livestock and air quality cafo air emissions project csu-ardec feb. 9, 2006
DESCRIPTION
Livestock and Air Quality CAFO Air Emissions Project CSU-ARDEC Feb. 9, 2006. Animal Science (Johnson, Stanton, Marcillac) NREL (Hannan) ARS (Mosier/Follet Atmospheric Sci. (Collet, Lee). National Academy of Science NRC 03 Air Emissions from AFO’s. Commissioned by EPA and USDA - PowerPoint PPT PresentationTRANSCRIPT

Livestock and Air Quality CAFO Air Emissions Project
CSU-ARDEC Feb. 9, 2006
Animal Science (Johnson, Stanton, Marcillac)
NREL (Hannan)
ARS (Mosier/Follet
Atmospheric Sci. (Collet, Lee)

National Academy of ScienceNRC 03
Air Emissions from AFO’s• Commissioned by EPA and USDA
• Finding 7: methods and measurements needed for NH3, CH4, H2S, PM’s
• Finding 8: Emission factor estimates not adequate
• Finding 9: Process-based model development recommended

National Research Initiative USDA 2004 RFP
• $ for Air Quality studies
• ? How can AFO emissions be measured?
• Particularly variable, heterogeneous production systems; e.g., cattle, pens, dams, lagoons, composting of all shapes sizes, etc
• We have a team that thinks we can!

Air Emissions from dairy CAFO: multi-scale measurements and process-based modeling
• The overall aim: to measure potentially problematic air emissions from cattle production systems and develop process based methods to predict them.
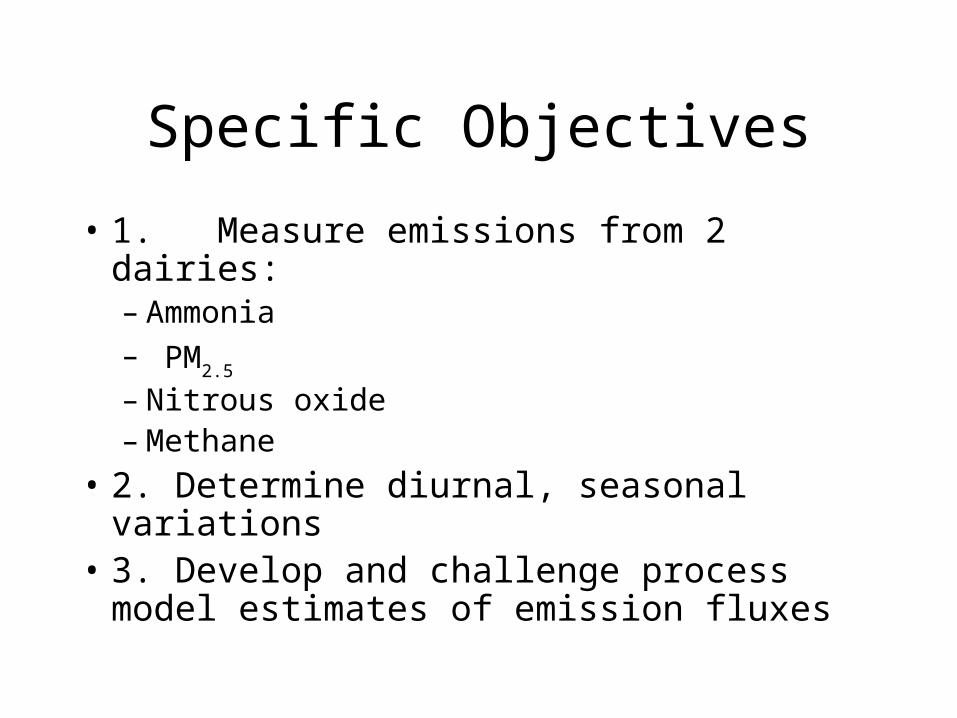
Specific Objectives
• 1. Measure emissions from 2 dairies:– Ammonia– PM2.5
– Nitrous oxide– Methane
• 2. Determine diurnal, seasonal variations • 3. Develop and challenge process model
estimates of emission fluxes

Objectives Contd:
• 4. Correlate downwind concentrations of spot sampled emissions - e.g.: H2S, VOC’s..
Approach
• Quantification of CAFO System Emissions– Mass Balance

F0
F1
Fe
Fd
FSx,y = dc/dtx,y,z + {F1y,z–F0y,z} + {Flx,z} + {Fex,y+Fdx,y}
dc/dt
x
yz
Whole-System Trace Gas Fluxes from Complex Agricultural Sources: Plume Characterization and Conservation of Mass
FS
Fl
Plume Lateral Vertical
Primary wind direction
indicates summation across plane or volume indicated by subscripts

F0
F1
Fd
Tethersonde Array
Ta, q, u, [CO2], [CH4], [N2O], [NH3], PM10, PM2.5
FSx,y = {F1y,z – F0y,z} + {Fdx,y}
1 sonde to characterize background profile, 3 (or more) to characterize plume, chemical trap array
Sonde telemetry to central computer. Balloon specs: >1 km height, 5 kg payload, auto-deflate
?


Tethersondes and Air Sampling
• Tethersondes at 5 heights; wind-speed, direction, humidity, temperature and pressure.
• Sample lines at 5 heights– draw samples to ground for non-reactive gases (CH4,
N2O, CO2)
– filters attached at each sample height collect NH3,
PM2.5, nitric acid.
• Sample; 1-2hr, 3X/d, 2 days, 7 seasons, 2yr

DW3
Upwind
DW2
DateTemp,
ºCRH, %
Wind Speed, mph
Wind Dir, º
Nov 18 11.3 26.8 2.3 348.3
Sample Dairy 1
DW1

Concentrations of NH3 by Height
0.0 50.0 100.0 150.0 200.0 250.0 300.0 350.0 400.0 450.0
1
2
3
4
5
NH3, ppbv

Concentrations of NH4 by Height
0.0 0.1 0.2 0.3 0.4 0.5 0.6
1
2
3
4
5
NH4 ppb(w/ w)

Concentration of HNO3 by Location
1.4
1.5
1.6
1.7
1.8
1.9
2.0
UW DW1 DW2 DW3
Location
Concentration of NH3 by Location
0.0
50.0
100.0
150.0
200.0
250.0
300.0
350.0
UW DW1 DW2 DW3
Location
Concentration of NH4 by Location
0.0
0.1
0.2
0.3
0.4
0.5
0.6
UW DW1 DW2 DW3
Location

Concentration of CH4 by Location
1.8
1.9
2.0
2.1
2.2
2.3
2.4
2.5
2.6
2.7
UW DW1 DW2 DW3
Location

Concentration of CO2 by Location
370.0
375.0
380.0
385.0
390.0395.0
400.0
405.0
410.0
415.0
420.0
UW DW1 DW2 DW3
Location

Concentration of N2O by Location
314.0
316.0
318.0
320.0
322.0
324.0
326.0
328.0
330.0
UW DW1 DW2 DW3
Location

F0 = y ∫ uz cz dz F1 = ∫ ∫ uy,z cy,z dy dz
Fluxes F0 and F1: Planes Perpendicular to Wind Direction
Ta, q, u, [CO2], [CH4], [N2O], [NH3], PM10, PM2.5help
Fluxes estimated by fitting flux velocity planes to measured scalar concentration and wind speed profiles and estimating the integrals
0
50
100
150
200
250
300
350
400
450
500
0 5 10 15
0
50
100
150
200
250
300
350
400
450
500
0 5 10 15
0
50
100
150
200
250
300
350
400
450
500
0 2 4 6 8
0
50
100
150
200
250
300
350
400
450
500
0 5 10 15
dc/dt
x
yz
cz
cz

ApproachProcess-based Model
• Characterization of Emission Source Components – Animals, diets, pens, manure removal methods,
solids separation, lagoons, composting procedures
– Prediction of C and N flux through each
• Modify whole farm model:– No cropping, add composting, NH4

Products and GHG from Cattle Production
JW
Herd
100 cows+ others
Cropping
Feeds
Manure
CH 4 N20FuelC0 2
Soil Carbon
(+)

Figure 1. Estimates of source and intensity of greenhouse gas emissions per unit of milk, lbs/lb, by scenario from Colorado dairy cattle systems.
0
0.2
0.4
0.6
0.8
1
1.2
1.4
1.6
Base Milk+20% Milk-20% Aerobic Anaerobic
CO
2eq
per
mil
k
Carbon Dioxide
Nitrous Oxide
Manure Methane
Enteric Methane

Products and GHG from Cattle Production
JW
Herd
100 cows+ others
Cropping
Feeds
Manure
CH 4 N 20FuelC0 2
NH4 PM
(+)

Important questions
• NH3 amounts by source
• NH4, conversion to PM’s
• CH4 from lagoons, dams, composting
• N2O from each
• Variations: diurnal, season, temp, etc

Total cost of US livestock NH3 and CH4 (Sci. 05, 308:1901)
• NH3:• EPA 04 estimate
– 2,418,595 t/yr
• X $1.3 to $21/kg
• = 3 to 50 $Bill/yr
• Note: McCubbin 02; 10% Livstk NH3 $4B
• CH4:
• EPA 04 estimate:– 7.3 Tg/yr
• X $0.60 to $1.54/kg
• = 4 to 11 $Bill/yr

The next step: Mitigation
• Treatment effects; algae, aeration, CuSO4, etc, etc.
• Dietary comp: RDP, peptide, Bypass AA’s, CHO source and Kd, etc, etc
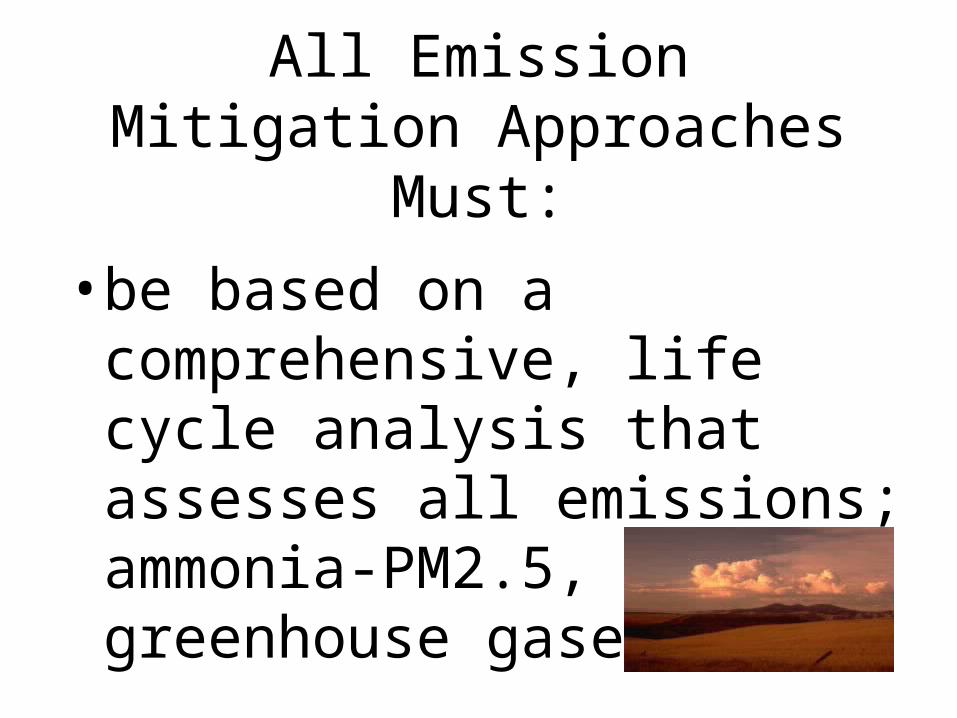
All Emission Mitigation Approaches Must:
• be based on a comprehensive, life cycle analysis that assesses all emissions; ammonia-PM2.5, greenhouse gases,etc.


Potential for Ammonia reduction
• Diet crude protein effect:
• Two research report examples:– Kulling,01 Dairy– Cole, 04 Beef

NH3 from manure of steers vs %CP in diet (Cole, et 05)
• Manure-soil incubations:
• Diet %CP NH3
• Control 14.5 0
• Med 13.0 - 37%
• Low 11.5 - 63%

Diet %CP vs Ammonia loss (Kulling,et. 01 J Ag Sci 137:235)
• Lactating Cows, 30.9 kg/d,
• 3 protein levels, +bypass Methionine12.5 %
15 %
17.5 %

Dairy % diet CP vs NH3 Emissions
(Kulling 01, J Ag Sci 137:235)78
0
10
20
30
40
50
60
70
80
NH3-N
17.5 15 12.5
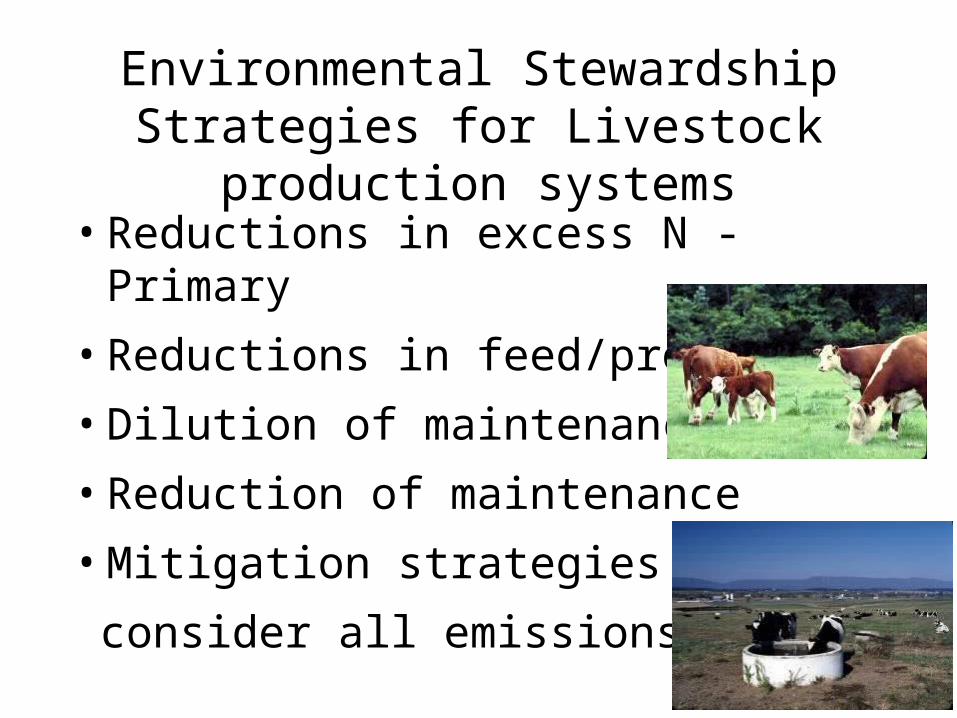
Environmental Stewardship Strategies for Livestock production systems
• Reductions in excess N - Primary
• Reductions in feed/product
• Dilution of maintenance
• Reduction of maintenance
• Mitigation strategies should
consider all emissions