livermore earthquake simulations are - lawrence livermore
TRANSCRIPT

Livermore earthquake
simulations are
providing insight into
historic and future
temblors.
Lawrence Livermore National Laboratory
S&TR September 2006�

ON April 18, 2006, Lawrence Livermore seismic experts participated
in a regional commemoration in San Francisco marking the centennial of the most significant event in the city’s history, the great 1906 earthquake. The Livermore scientists, together with colleagues from several research institutions, revealed to state and federal officials and the public the most accurate simulations of the 1906 quake ever conducted. They also shared supercomputer simulations of possible future temblors along other San Francisco Bay Area faults.
“By using advanced simulations to re-create the 1906 earthquake, we get a closer look at how the ground throughout the Bay Area responds to seismic waves,” says seismologist Arthur Rodgers, leader of Livermore’s seismology group in the Energy and Environment Directorate. “The simulations also allow us to gain
insight into what might happen if the San Andreas or other fault lines in the Bay Area were to rupture.”
Rodgers, geophysicist and computer scientist Shawn Larsen, applied mathematician Anders Petersson, and other Livermore researchers joined scientists from the University of California at Berkeley (UCB), Stanford University, and URS Corporation (a worldwide engineering firm) in a two-year study coordinated by the U.S. Geological Survey (USGS). The study’s goals were to simulate ground motions generated by the 1906 event, compare the results with observations and seismograms recorded at the time, and examine future earthquake scenarios throughout the Bay Area.
The Bay Area has a high density of active faults. Besides the San Andreas, fault zones include Calaveras, Concord–
Lawrence Livermore National Laboratory
Earthquake Modeling �S&TR September 2006
Fires raged at the southeast corner of Market
and Fremont streets, San Francisco, following
the 1906 earthquake. (Photo courtesy of the
California Historical Society.)

S&TR September 20066
Lawrence Livermore National Laboratory
Earthquake Modeling
Green Valley, Greenville, Hayward–Rodgers Creek, and San Gregorio. Together, these faults form a network of parallel fault lines marking where the North American and Pacific plates are slowly pushing against each other. By far the largest fault is the 1,300-kilometer-long San Andreas.
1906 Quake Measured 7.8Just before 5:12 a.m. on April 18, 1906,
a magnitude 4.0 foreshock on the San Andreas Fault quietly rumbled throughout the Bay Area. About 20 seconds later, a magnitude 7.8 to 7.9 temblor began to rupture, with its epicenter below the Pacific Ocean, just 3 kilometers west of Ocean Beach, San Francisco. Violent shaking swept throughout the entire region and included 17 serious aftershocks within 1 hour.
The quake ruptured 477 kilometers of the San Andreas Fault between San Juan Bautista to the south and Cape Mendocino to the north. (By comparison, the Bay Area’s 1989 Loma Prieta earthquake had a rupture length of only about 35 kilometers and one-thirtieth the energy.) The rupture propagated up to 5 kilometers per second.
The amount of horizontal displacement between the Pacific and North American plates varied from 0.5 to 9.7 meters. The earthquake was felt from southern Oregon to Los Angeles and inland as far east as central Nevada.
Kevin Starr, professor of history at the University of Southern California and California State librarian emeritus, described the earthquake during a presentation to Lawrence Livermore employees last April. He termed the quake “one of the greatest catastrophes in U.S. urban areas.” In all, more than 28,000 buildings were destroyed, many of them unreinforced structures that collapsed instantly. From a population of about 400,000, the earthquake killed approximately 3,000 people and left 225,000 homeless.
The earthquake triggered fires that raged for three days. Because the local police and fire departments were in disarray, U.S. Army General Frederick Funston took control of the firefighting effort, despite no firefighting experience. Using dynamite, black powder, and artillery, the Army blew up many buildings in an attempt to create firebreaks. Starr
noted the general population behaved admirably, moving in long lines toward parks and open areas as they dragged their trunks of belongings behind them.
Seismic Waves to MendocinoIn re-creating the 1906 quake,
simulations show seismic waves spreading south for 54 seconds and north for 90 seconds. First, primary waves, which are similar to sound waves, deliver a jolt. They are followed by even more violent secondary waves. The simulations shown in the figures on p. 7 use color to denote the intensity of shaking, with warmer colors indicating stronger ground motion.
The first simulation replicates the 1906 earthquake. Strong ground motion is shown in parts of San Francisco built on fill and, despite their distance from the epicenter, in basins located in the Napa, Sonoma, Santa Clara, Central, San Ramon, and Livermore valleys, as well as the Sacramento–San Joaquin Delta and Santa Rosa.
The second simulation shows a hypothetical magnitude 7.8 earthquake along the San Andreas Fault that begins in the north and ruptures to the south.
The 1906 San Francisco
earthquake destroyed more than
28,000 buildings. Looking north
along Valencia Street are a sink
hole (foreground) and the sunken
Valencia Street Hotel (left). (Photo
courtesy of the Bancroft Library,
University of California, Berkeley.)

�
Lawrence Livermore National Laboratory
S&TR September 2006 Earthquake Modeling
Fresno
Reno
Sacramento
Monterey
San Francisco
Mendocino
Redding
Eureka
NoneWeakly feltMinor damage
Moderate to significant damage
Extreme shaking and damage
02�68
10
MM
I sha
king
inte
nsity
0 100 200Kilometers
Fresno
Reno
Sacramento
Monterey
Redding
Eureka
San Francisco
Mendocino
NoneWeakly feltMinor damage
Moderate to significant damage
Extreme shaking and damage
02�68
10
MM
I sha
king
inte
nsity
0 100 200Kilometers
The modified Mercalli intensity (MMI) scale is used to depict shaking severity in two magnitude �.8 earthquake simulations. (a) One simulation shows the
perceived shaking experienced from Eureka to Fresno during the 1906 San Francisco earthquake, with the historical epicenter (denoted by the star) located
about 3 kilometers off the coast, along the San Andreas Fault. (b) Another simulation shows a hypothetical magnitude �.8 earthquake that starts near Cape
Mendocino in the north and ruptures to the south. Although the epicenter is farther away, the shaking experienced in San Francisco and in the Sacramento–
San Joaquin Delta and Central Valley regions is much greater.
“Although the epicenter for the 1906 earthquake was just west of San Francisco, the ground shaking in San Francisco was relatively mild,” says Larsen. “However, if the earthquake had begun north near Cape Mendocino, the shaking would have been much more extreme in San Francisco. In this case, a buildup of seismic energy would have slammed into the Bay Area. In some sense, this phenomenon is counterintuitive. Ground motion can be greater when the epicenter is farther away.”
The Livermore simulations were performed using the Laboratory’s MCR and Thunder supercomputers and Japan’s
Earth Simulator. All are massively parallel machines, in which thousands of microprocessors work together on small parts of enormous numerical problems. Typical simulations involve grids with billions of computational points averaging 100 meters in resolution and encompassing nearly all of northern California.
The Livermore team used several codes that are optimized to run on massively parallel supercomputers. The codes incorporate three-dimensional (3D) information about the propagation of seismic waves, such as how they radiate from an earthquake’s source to the
surface, at what velocities they propagate, and how they interact with the geology. The codes use a 3D geologic structure model of northern California developed by USGS. The 3D structure of Earth determines when and how strongly an earthquake is felt at particular locations because seismic waves travel differently through different rock types.
The USGS model comprises irregularly shaped blocks, bounded by faults, that stretch 45 kilometers deep, 650 kilometers north to south, and 330 kilometers east to west. (See the top figure on p. 8.) The model also includes the subsurface shape
(a) (b)
Water
Unconsolidated to semiconsolidated Plio-Quaternary deposits
Tertiary sedimentary and local volcanic rocks
Cenozoic deposits, undivided
Cretaceous and Jurassic forearc sedimentary rocks
Salinian Cretaceous granitic rocks and associated Sur Series metamorphic rocks
Mostly cretaceous and Jurassic subduction-related Franciscan Complex rocks
Jurassic ophiolitic rocks
Matic lower crustMantle
S&TR September 20068
Lawrence Livermore National Laboratory
Earthquake Modeling
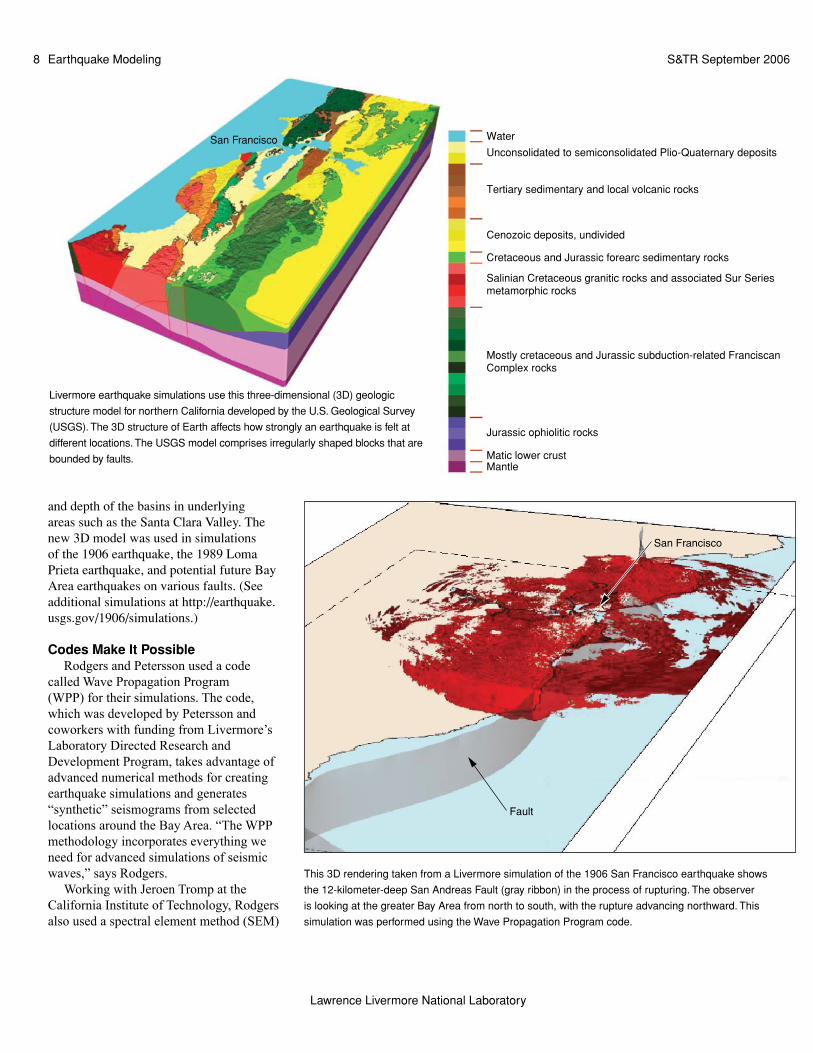
and depth of the basins in underlying areas such as the Santa Clara Valley. The new 3D model was used in simulations of the 1906 earthquake, the 1989 Loma Prieta earthquake, and potential future Bay Area earthquakes on various faults. (See additional simulations at http://earthquake.usgs.gov/1906/simulations.)
Codes Make It PossibleRodgers and Petersson used a code
called Wave Propagation Program (WPP) for their simulations. The code, which was developed by Petersson and coworkers with funding from Livermore’s Laboratory Directed Research and Development Program, takes advantage of advanced numerical methods for creating earthquake simulations and generates “synthetic” seismograms from selected locations around the Bay Area. “The WPP methodology incorporates everything we need for advanced simulations of seismic waves,” says Rodgers.
Working with Jeroen Tromp at the California Institute of Technology, Rodgers also used a spectral element method (SEM)
San Francisco
This 3D rendering taken from a Livermore simulation of the 1906 San Francisco earthquake shows
the 12-kilometer-deep San Andreas Fault (gray ribbon) in the process of rupturing. The observer
is looking at the greater Bay Area from north to south, with the rupture advancing northward. This
simulation was performed using the Wave Propagation Program code.
Livermore earthquake simulations use this three-dimensional (3D) geologic
structure model for northern California developed by the U.S. Geological Survey
(USGS). The 3D structure of Earth affects how strongly an earthquake is felt at
different locations. The USGS model comprises irregularly shaped blocks that are
bounded by faults.

9
Lawrence Livermore National Laboratory
S&TR September 2006 Earthquake Modeling
code to simulate the 1906 San Francisco earthquake. Rodgers explains that most codes treat the geographic areas that they are simulating like flat maps. The SEM code, however, models the globe in spherical coordinates by dividing it into curved sections.
Larsen used the E3D code for his simulations. Although Larsen developed the code nearly 15 years ago, he has continued to modify it to take advantage of supercomputer advances. E3D was previously used to simulate earthquakes on the Hayward–Rodgers Creek Fault and determine the potential effects of such quakes on the San Francisco–Oakland Bay Bridge. (See S&TR, December 1998, pp. 18–20; October 2001, pp. 4–12.) The code has an extensive user base at other national laboratories and in government agencies, academia, and industry. Larsen, together with Doug Dreger and David Dolenc at UCB, also used CODE3, a wave propagation package available in the public domain. CODE3 is the result of a combined effort at several U.S. universities and firms.
Predicting Future TemblorsOne important use of these simulation
codes is to help Bay Area government officials plan for future earthquakes. In the last half of the 1800s, earthquakes of magnitude 6.0 or greater occurred in the Bay Area at an average rate of once every four years. Seismicity rates dropped sharply after the 1906 earthquake. Scientists believe the 1906 earthquake relieved stresses on faults throughout the Bay Area.
The level of seismic activity has not yet returned to that of the late 1800s. The stresses continue to build and now the risk is high for another great quake in the Bay Area. USGS predicts a 62-percent chance of a magnitude 6.7 or greater temblor occurring in the next 30 years on a major Bay Area fault. The fault with the highest probability of slipping in the next 30 years is the 90-kilometer-long Hayward–Rodgers Creek Fault, with a 27-percent chance of a quake of magnitude 6.7 or greater.
Probability of magnitude6.� or greater quakesbefore 2032 on theindicated fault
Expanding urban areas
Increasing probabilityalong fault segments
Kilometers100 20
The risk is high for another great
quake in the San Francisco
Bay Area. USGS predicts a
62-percent chance of a
magnitude 6.� or greater temblor
occurring in the next 30 years
on a major Bay Area fault. The
fault with the highest probability
of slipping in the next 30 years is
the 90-kilometer-long Hayward–
Rodgers Creek Fault, with a
2�-percent chance of a
magnitude 6.� quake.
When May Lou Zoback, coordinator of the USGS earthquake hazards team, spoke to Livermore employees in April 2006, she warned that the Hayward–Rodgers Creek Fault has had a magnitude 6.5 or greater earthquake every 150 years (give or take 25 years) over the past several centuries.
The last one, a magnitude 7.0, occurred in 1868. It was known as the “Great San Francisco Earthquake” prior to 1906.
“You do the math, and you can see why we’re really worried about this fault,” said Zoback. An estimated 160,000 households would be displaced if a major earthquake

S&TR September 200610
Lawrence Livermore National Laboratory
Earthquake Modeling
erupts on the Hayward–Rodgers Creek Fault, according to Zoback. The Livermore team has done a number of earthquake simulations of the Hayward–Rodgers Creek Fault, which Larsen calls “the most dangerous fault in the U.S.” Simulations of a magnitude 6.7 quake on this fault show shaking to be almost as strong in the East Bay as it was from the much stronger 1906 quake centered on the San Andreas.
Rodgers notes that the intensity of shaking that an area experiences during an earthquake depends on the magnitude of the earthquake, its distance from the fault, and its type of ground materials. Soft, water-saturated sands and sediments amplify the shaking, while bedrock shakes less, which is why seismologists are so concerned about
the possible effects to the Sacramento–San Joaquin Delta from a future strong quake on the San Andreas, Hayward–Rodgers Creek, or Greenville faults. “Simulations show more shaking in the delta area than we expected,” says Larsen.
The delta covers 738,000 acres of reclaimed marshland protected by 1,100 miles of earthen levees, many built more than a century ago. “The delta levees are prone to liquefaction, a phenomenon that occurs when water-saturated material is subjected to shaking,” says Rodgers. During liquefaction, the ground loses its strength, which can cause buildings to sink and levees to fail. A major quake would threaten delta-area levees, buildings, and bridges and much of the state’s water supply.
Validating the SimulationsThe Livermore simulations have been
validated by comparing the individual results within the study’s modeling teams with ground motion data observed and recorded in the Lawson report after the 1906 quake (see the box below) and with seismograms recorded worldwide. USGS scientists, led by Jack Boatwright, created a detailed 1906 ShakeMap. Boatwright added sites to the map described in the Lawson report, such as displaced buildings, and conducted new investigations at many other sites. He converted earthquake intensity scales reported by the Lawson research team into measures of ground motion. The resulting map shows that the highest ground-shaking intensity actually occurred in and around Santa Rosa, located more than 30 kilometers from the San Andreas Fault. “I’m pleased that our simulations match Boatwright’s findings,” says Rodgers.
The 1906 earthquake was recorded by seismic stations worldwide. Seismograms trace the changing amplitude and frequency of the ground shaking beneath the instrument. From seismograms, scientists can determine the time, epicenter, depth, and type of faulting of an earthquake as well as estimate how much energy was released. Bay Area seismograms of the 1906 quake were highly complex because the shaking was so intense and the instruments did not have the range to record the motions on scale. Rodgers has compared the seismograms recorded in Europe with synthetic seismograms created by the advanced codes and found them to agree fairly well.
Determining Slip RateLivermore scientists are gaining a better
understanding of the nature of earthquake faults by determining the rate at which tectonic plates slide past each other. Knowing the slippage rate of one tectonic plate against another helps to identify the accumulation of stress on the various segments of the fault and, hence, the likely frequency and magnitude of earthquakes.
The Birth of U.S. Seismic ScienceMost experts agree that the 1906 San Francisco earthquake marked the beginning
of modern earthquake science in the U.S. Three days after the earthquake, California Governor George Pardee commissioned an investigation led by Andrew Lawson, a professor of geology at the University of California at Berkeley (UCB).
Professor Lawson assembled a group of scientists, who, over the next two years, collected evidence of the quake’s fault line. They mapped the entire 477-kilometer-long surface break of the San Andreas Fault and documented the fault’s movement. They found fences, houses, and roads that were offset up to 6 meters.
The report listed intensity estimates for more than 600 sites, the largest compilation of intensities ever assembled for a single earthquake. It also noted the correlation of intensity with underlying geologic conditions. Areas situated in sediment-filled valleys sustained stronger shaking than areas on bedrock, with the strongest shaking occurring in areas of landfill.
The Lawson report, published in 1908 as The California Earthquake of April 18, 1906: Report of the State Earthquake Investigation Commission, contained 643 pages and 40 large maps. Seismologists and geophysicists continue to use it for its physical descriptions, maps, and timetables of the 1906 event. The Lawson report remains the most important study of a single earthquake, and many consider it the birth of modern seismology in the U.S. In addition, the Seismological Society of America was formed in 1906 following the quake.
In 1910, a second volume of the Lawson report was published, written by Harry Fielding Reid, professor of physics and geology at Johns Hopkins University. In this volume, Reid proposed that faults store stress until they can no longer hold it, at which point, they snap like a rubber band stretched too far and suddenly release the energy. The process then begins again. This theory is still the principal model of the earthquake cycle.
The 1906 earthquake was the first natural disaster to be well documented by photographs. UCB’s Bancroft Library holds the single largest collection of 1906 photographs. These can be viewed, along with the Lawson report, at the 1906 San Francisco Earthquake and Fire Digital Collection Web site: http://bancroft.berkeley.edu/collections/earthquakeandfire.

11
Lawrence Livermore National Laboratory
S&TR September 2006 Earthquake Modeling
Lawrence Livermore is a member of the Bay Area Regional Deformation Network, which is a network of about 67 continuously operating Global Positioning System receivers at various sites in the Bay Area and northern California. The network was set up to measure the slip that is occurring across faults.
Livermore geophysicist Rick Ryerson is using the Laboratory’s Center for Accelerator Mass Spectrometry for precisely dating crystalline rocks (a technique called morphochronology) to determine the long-term slip rates of earthquake faults in Tibet and California. Ryerson first views satellite images to locate geologic formations offset by tectonic plate movement. Earthquakes can leave rock surfaces exposed, and the interaction of these surfaces with cosmic rays produces cosmogenic nuclides. The levels of cosmogenic nuclides increase the longer a sample remains at Earth’s surface. To date the rocks, Ryerson determines the ratio of concentrations of beryllium-10 and aluminum-26 to stable isotopes in the crystalline rocks.
Ryerson has taken samples from the Tibetan plateau, where two tectonic plates have been slowly grinding past each other for millions of years creating, in the process, the Himalayas. (See S&TR, June 2000, pp. 26–29.) He has also collected rocks from a portion of the southern San Andreas Fault just north of Palm Springs, where several strands of the fault converge. This method provides a new tool for evaluating faults in seismically active regions throughout the world.
More Simulations on the WayAs part of the Laboratory’s Earthquake
Hazards Group, Larsen, together with UCB collaborators, has used ground-motion simulations to investigate Bay Area bridges and freeway interchanges (with California Department of Transportation officials), dams (with the Federal Bureau of Reclamation), UC campus facilities,
Lawrence Livermore buildings, and area hospitals. Most recently, Larsen has been working with UCB scientists to simulate smaller Bay Area earthquakes. Of particular interest is the reliability of levees in the Sacramento–San Joaquin Delta under seismic force conditions. In this effort, Rodgers is hoping to examine the seismic resistance of the levees to earthquakes, especially to those on the Greenville Fault because of its proximity to the delta.
Rodgers is proposing additional simulations be done to gauge the effects
of strong quakes on local freeways, bridges, Bay Area Rapid Transit tunnels, and key facilities such as hospitals. “A major quake along the Hayward–Rodgers Creek, Greenville, or Calaveras faults could move the ground with velocity up to 1 meter per second,” he says. “With that much ground motion, it is critical to assess what would happen to buildings and major structures.”
Chad Noble, a Livermore structural engineer, has been using engineering codes to study how earthquakes affect dams, tunnels, and levees. Noble takes
(a) A simulated magnitude 6.� quake (epicenter is depicted by the star) on the Hayward–Rodgers Creek
Fault (black line) causes strong shaking in the delta region, although it is located about �0 kilometers
from the fault line. Abbreviations denote the following Bay Area regions: Golden Gate Bridge (GG), San
Francisco Bay (SFB), Santa Clara Valley (SCV), Livermore Valley (LV), San Ramon Valley (SRV), Mount
Diablo (MD), San Pablo Bay (SPB). Triangles denote locations of seismograph stations. (b) Synthetic
seismograms show the probable activity these stations would generate from a magnitude 6.� Hayward
quake. The seismogram from the hypothetical D22 station along the Sacramento–San Joaquin Delta
shows strong ground motion lasting much longer than at other locations in the Bay Area.
Shaking intensityStrongWeak
MD
SPB
SCV
GGDelta
BRIB
BDM D22
BRK
SFB
0
1.0
0.�
0
–0.�
1.0
0.�
0
–0.�
1.0
0.�
0
–0.�
1.0
0.�
0
–0.�
20 �0 60Time after event, seconds
Vel
ocity
, met
ers
per
seco
nd
80 100 120
Berkeley (BRK)
Briones State Park (BRIB)
Black Diamond Mine (BDM)
Delta (D22)
SRV
LV
(a) (b)

S&TR September 200612
Lawrence Livermore National Laboratory
Earthquake Modeling
seismic forces generated by Livermore seismological models and feeds them into structural finite-element models using two Livermore codes, DYNA3D and ALE3D. For the Federal Bureau of Reclamation, Noble and other Livermore engineers have analyzed the 3D response of some of the bureau’s concrete dams to seismic forces. The simulations show the stresses on dams and their foundations and the movement of contained water in response to seismic waves.
“Earthquake ruptures are not uniform but slip in ways that reveal differences in friction, rock strength, and stress,” says Rodgers. “A magnitude 6.5 earthquake
could have widely varying ground motion because of variations in the rupture that cannot be predicted. We hope to look at suites of simulations on Bay Area faults to account for rupture variability. In this way, we could reduce the uncertainty in ground-motion predictions.”
The results of the simulations will offer disaster planners the ability to more accurately predict where the ground will shake most severely during another major Bay Area earthquake. Scientists will not be able to prevent the Next Big One, but they can provide officials and the public more information to better plan for it.
—Arnie Heller
Key Words: ALE3D, CODE3, DYNA3D, E3D, earthquake, Hayward–Rodgers Creek Fault, Lawson report, Loma Prieta earthquake, morphochronology, Sacramento–San Joaquin Delta levees, San Andreas Fault, seismology, ShakeMap, spectral element method (SEM), U.S. Geological Survey (USGS), Wave Propagation Program (WPP), 1906 San Francisco earthquake.
For further information contact
Arthur J. Rodgers, Jr. (925) 423-5018
Livermore seismologists and geophysicists are major participants in the national program to provide the U.S. government with the technical capabilities needed for worldwide monitoring of several nuclear test ban and arms reduction treaties. Indeed, the strength of these treaties rests, in large part, on the technical capabilities available for monitoring compliance.
Livermore researchers focus on the Middle East, North Africa, and Russia. Their job is to help detect, locate, and identify events for the U.S. National Data Center at Patrick Air Force Base in Florida. Scientists calibrate seismic stations in these regions to ensure that seismograms of events are properly interpreted in light of regional geologic characteristics. An important issue is being able to discriminate nuclear explosions from naturally occurring phenomena, such as earthquakes, and other human-caused events, such as explosions used in mining and quarrying.
According to Dave Harris, Livermore’s Ground-Based Nuclear Explosion Monitoring Program leader, an important effort is developing geophysical models that accurately predict seismic wave propagation in regions where scientists lack observations of prior seismic events. “We develop geophysical models for regions like North Africa that do not experience many earthquakes. It’s helpful to have a model that synthetically generates probable seismograms.”
With funding from the Laboratory Directed Research and Development Program, Rodgers and seismologist Michael Pasyanos are exploring the use of a stochastic engine to strengthen
the predictive capability of models used in nuclear monitoring. Stochastic engines use advanced statistical methods and refined search methods to narrow the possible configurations of a model. (See S&TR, July/August 2002, pp. 21–23.) In this case, the stochastic engine is used to predict the range of seismic signals geophysicists might expect to see from an event in a certain area. “The stochastic engine gives us a suite of models that fit a broad range of data,” says Rodgers. “We can detect and identify weaker magnitude seismic events by making use of what we learn from the models.”
Livermore scientists have also been applying their expertise to characterize the geology of Yucca Mountain, Nevada, and its surrounding region. The goal is to determine whether spent nuclear fuel and high-level radioactive waste could be safely isolated deep beneath the mountain’s surface. As part of this site characterization, scientists have performed extensive studies to estimate the potential sizes and frequencies of future earthquakes and to determine the level of ground motion and fault displacement that might affect potential repository facilities, both on the surface and underground. Scientists have used the results of these studies to design repository facilities that will withstand earthquakes and to assess the long-term performance of the total repository system.
A variety of Livermore earthquake simulations can be viewed at http://www.llnl.gov/pao/news/news_releases/2006/quake_simulations.html.
Applying Seismic Expertise to Nuclear Treaties and Waste Storage