live load distribution on bridge abutments
TRANSCRIPT

Live Load Distributionon Bridge Abutments
Western Bridge Engineers Seminar
September 2015
1
Toorak Zokaie, PE, Ph.D.Amir Malek, PE, Ph.D.Amir Rahbari, PE

Background
2
Live Load Distribution on Abutments is
a three dimensional phenomenon that
is complicated by nonlinear subgrade
properties, load configurations and
geometric effects. Detailed analytical
studies are needed to better
understand this phenomenon and
propose simple procedures suitable for
design.

Scope of the Work
3
The scope of the work includes single
span bridges with different span
lengths (80’ & 200’), widths (24’, 48’, 72’, 96’)
Precast Girders
Pile and Spread Footings
Different soil types
Short (Seat) and Tall (High-Cantilever)
type abutments

Scope of Work (Continued)
4
Perform simplified and advanced (3D FE with nonlinear springs) analysis and compare the equivalent number of lanes used for design
Compare various simplified methods
Excel Spreadsheet (45 deg. Distribution)
Rigid Footing Analogy
Total number of lanes with and without MPF

CSI-Bridge
5
Short-Seat Abutment
High-Cantilever Abutment

CSI-Bridge: Foundation
6

CSI-Bridge: Abutment
7
Short-Seat Abutments for 80’ span Bridges

CSI-Bridge: Abutment
8
Short-Seat Abutments for 200’ span Bridges

CSI-Bridge: Abutment
9
High-Cantilever Abutments for 80’ span Bridges

CSI-Bridge: Abutment
10
High-Cantilever Abutments for 200’ span Bridges

CSI-Bridge: Subgrade
11
Foundation Stiffness – Spread Footings

CSI-Bridge: Subgrade
12
Foundation Stiffness – Pile Footings
Dense Sand Clay

Simplified Analysis - Excel
13

Simplified Analysis – Rigid Ftg
14
Side Pressure = 𝑉 ∗ (6𝑒
𝑊2+1
𝑊)

Summary of Results
15
Short-Seat Abutments for 80’ span Bridges

Summary of Results
16
Short-Seat Abutments for 200’ span Bridges

Summary of Results
17
High-Cantilever Abutments for 80’ span Bridges
Summary of Results
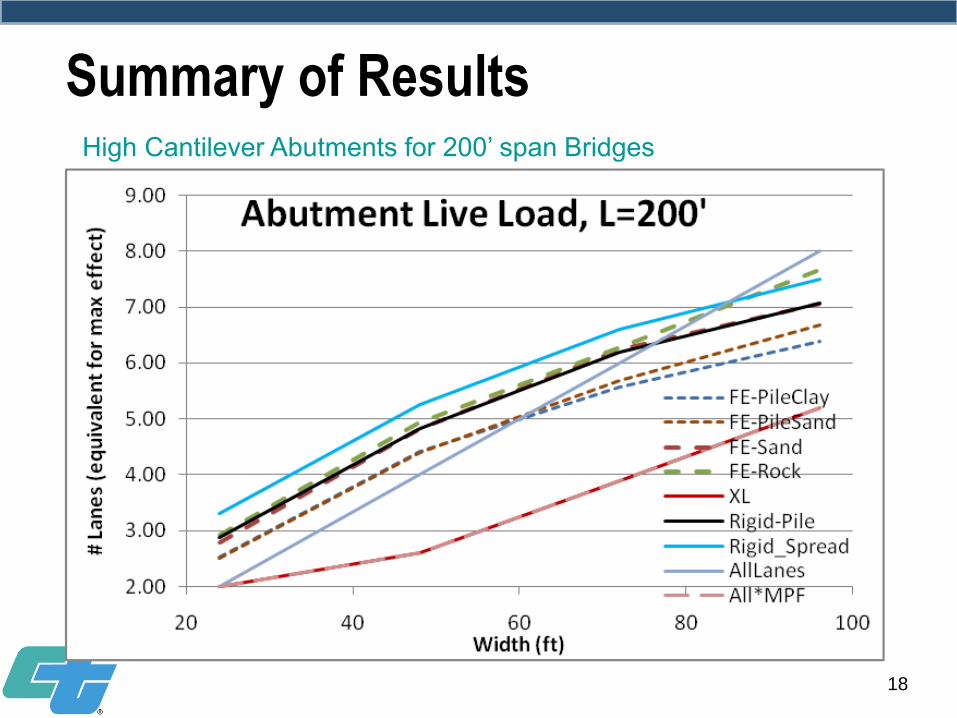
18
High Cantilever Abutments for 200’ span Bridges

Summary of Results
19
Short-Seat Abutments: Strength-1 Results

Summary of Results
20
High-Cantilever Abutments: Strength-1 Results
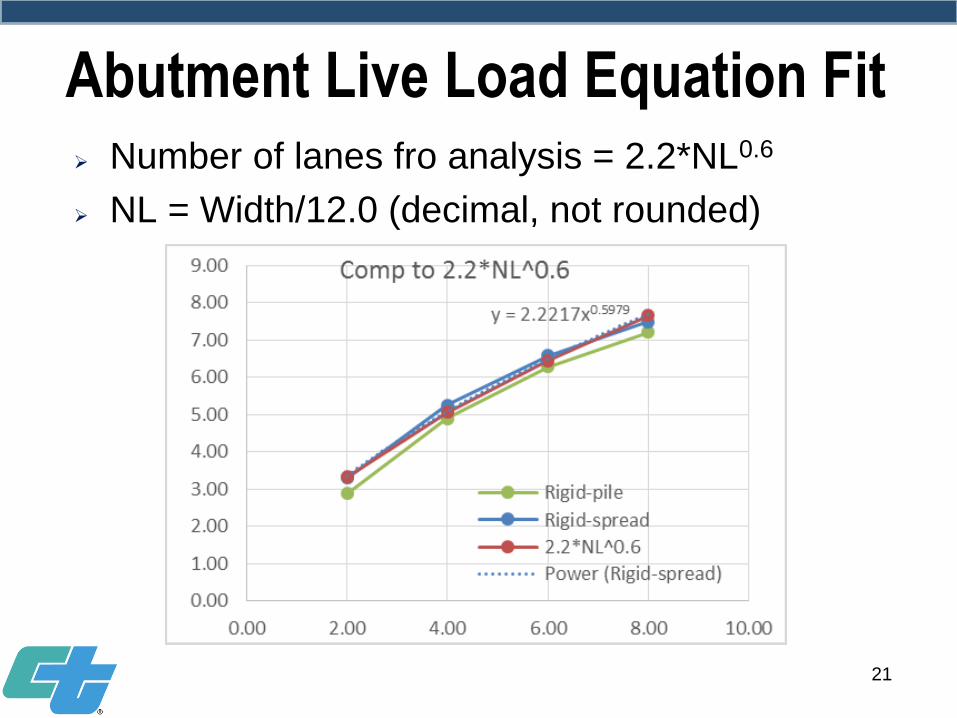
Abutment Live Load Equation Fit
21
Number of lanes fro analysis = 2.2*NL0.6
NL = Width/12.0 (decimal, not rounded)
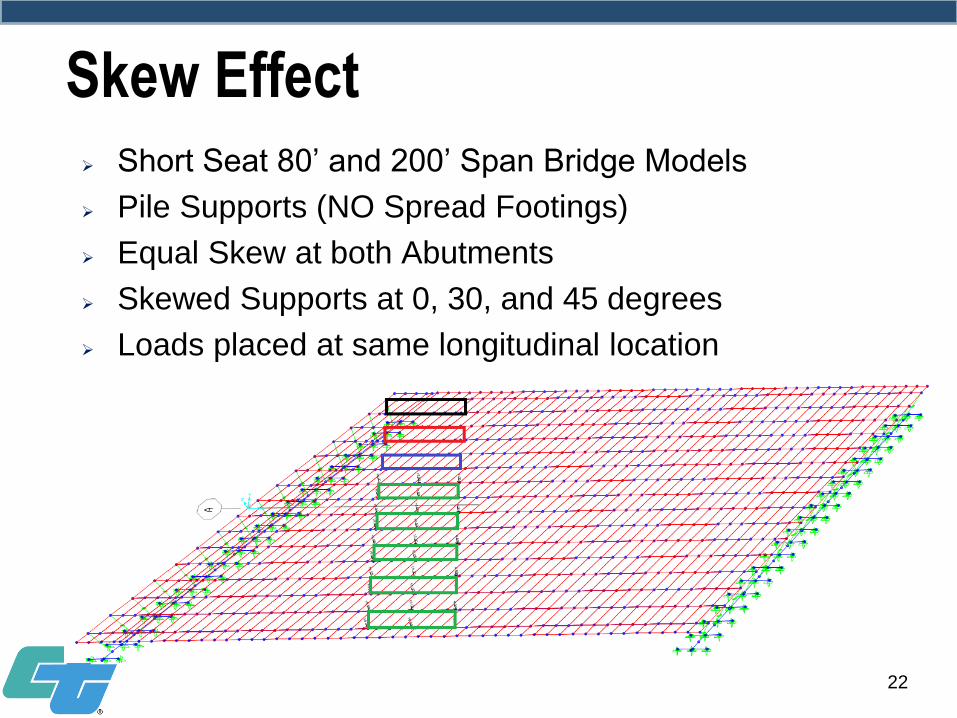
Skew Effect
22
Short Seat 80’ and 200’ Span Bridge Models
Pile Supports (NO Spread Footings)
Equal Skew at both Abutments
Skewed Supports at 0, 30, and 45 degrees
Loads placed at same longitudinal location
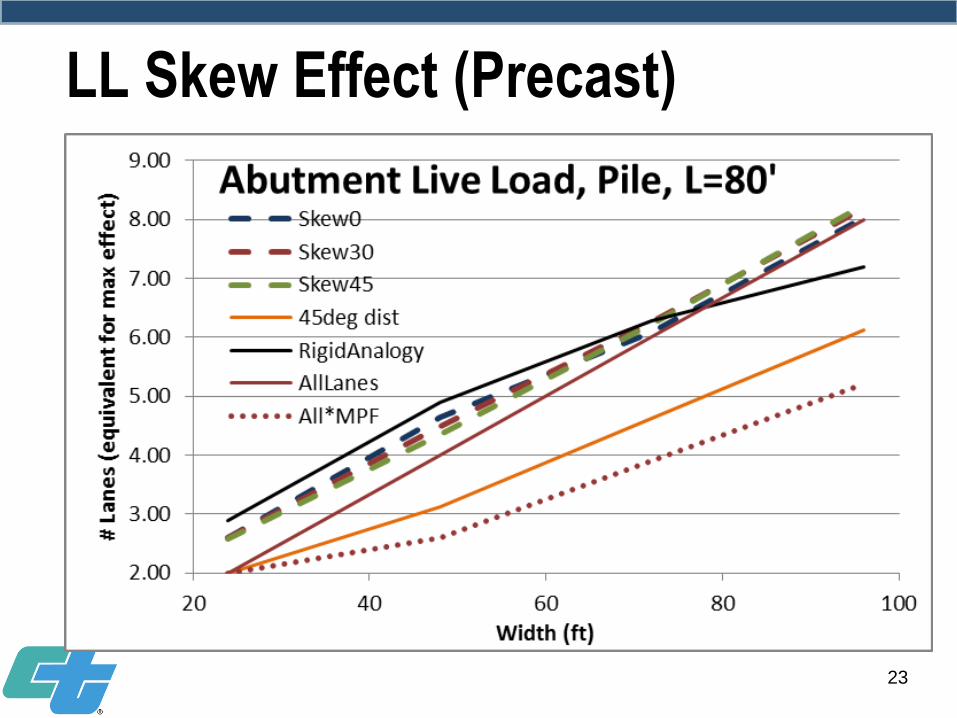
LL Skew Effect (Precast)
23

LL Skew Effect (Precast)
24

LL Skew Effect (CIP Box Girder)
25

LL Skew Effect (CIP Box Girder)
26

DL Skew Effect (Precast)
27
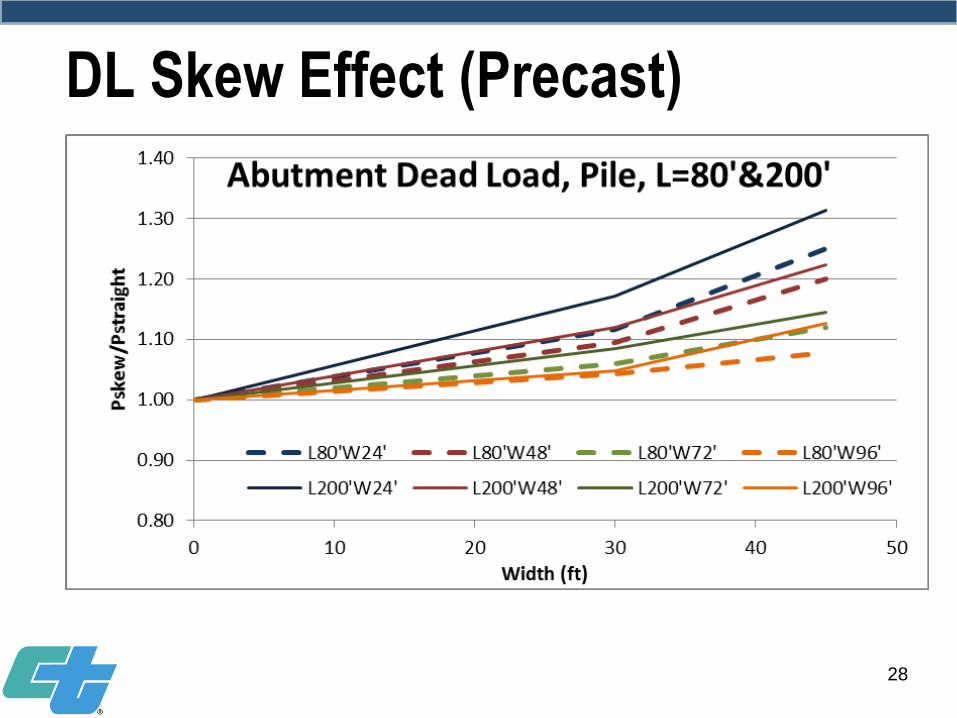
DL Skew Effect (Precast)
28

DL Skew Effect (CIP Box Girder)
29
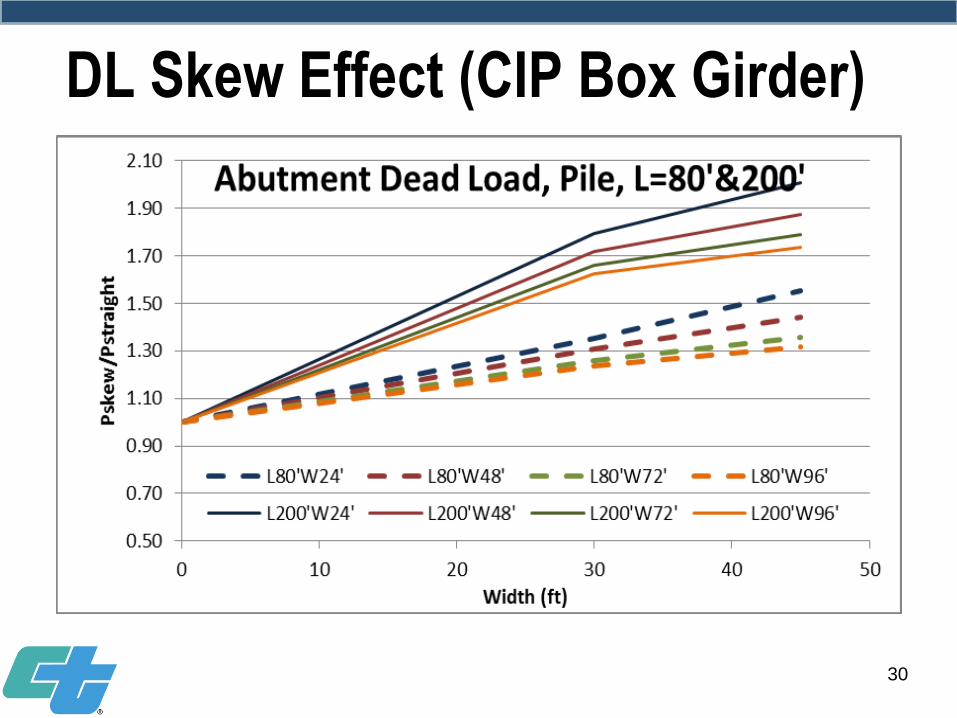
DL Skew Effect (CIP Box Girder)
30
Conclusions
31
The spreadsheet (45 degree distribution)
method is not always conservative
Tall (Cantilever) abutment results show
similar trends to Short-Seat
Rigid Analogy is fairly accurate in most cases
In Softer foundations, load distribution is
more uniform and Rigid Analogy tends to be
conservative

Conclusions
32
Live load response on abutment is not
affected by skew angle
Rigid Analogy works well for live load
distribution in skewed abutments
Curve fit for live load distribution works well:
#Lanes = 2.2*NL0.6 or
#Lanes = 0.56*W0.6 (W=Bridge Width, NL=W/12.0)
Skew affects the dead load response
Skew effect on DL is more pronounced in
box girder bridges

33
Questions?