live interactive learning @ your desktop december 14, 2011 noaa: explore with students the...
TRANSCRIPT

LIVE INTERACTIVE LEARNING @ YOUR DESKTOP
December 14, 2011
NOAA: Explore with Students the Connections between a Changing
Land Cover and Climate
Presented by: Steve Albers, Frank Niepold and Jessica Mackaro
Explore with Students the Connections between a Changing Land Cover and ClimateExplore with Students the Connections between a Changing Land Cover and Climate
Steve Albers, NOAAFrank Niepold, NOAAJessica Mackaro, GLOBE
December 14, 2011
Steve Albers, NOAAFrank Niepold, NOAAJessica Mackaro, GLOBE
December 14, 2011
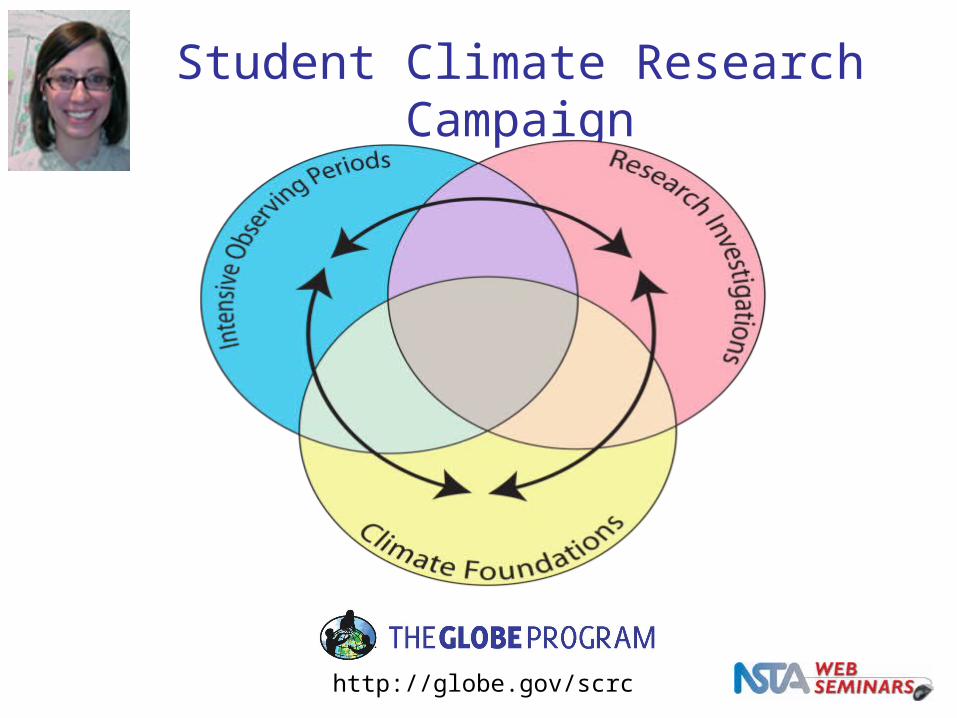
Student Climate Research Campaign
http://globe.gov/scrc
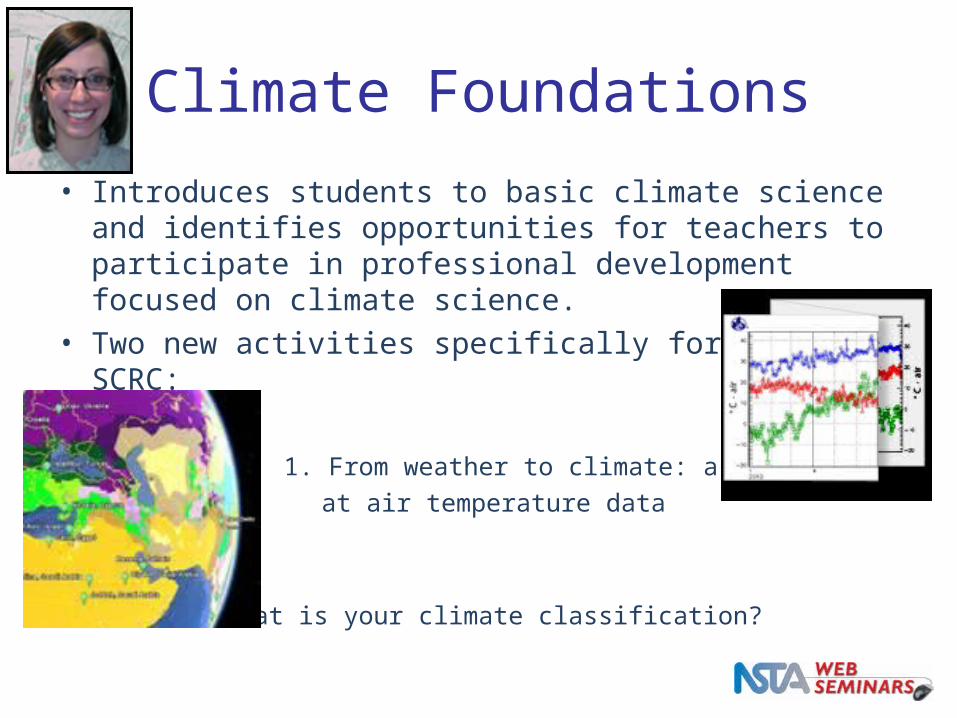
Climate Foundations
• Introduces students to basic climate science and identifies opportunities for teachers to participate in professional development focused on climate science.
• Two new activities specifically for the SCRC:
1. 1. From weather to climate: a look at air temperature data
2. What is your climate classification?

Climate Research FoundationsSchools are encouraged to develop and participate in their own climate research investigation by exploring: “What is my climate, and how has it changed over time?”A Few Examples:1.Climate and Pine Bark Beetle in Rocky Mountains, USA2.The Impacts of Water Quality and Climate Change on Oyster Production Water Quality in a local creek 3.Environmental Changes along Cove River 4.Changes in Land Cover and Green Up/Green Down dates in Aguadilla, Puerto Rico 5.Study of and Restoration of Grasses Along the Bolivar Peninsula Sand Dunes
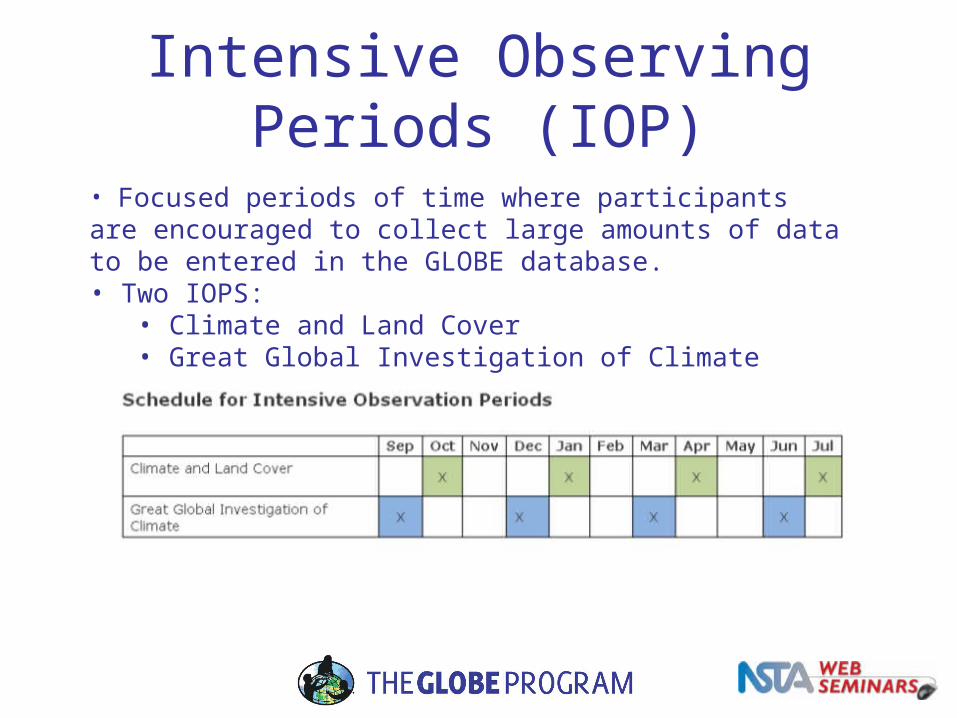
Intensive Observing Periods (IOP)
• Focused periods of time where participants are encouraged to collect large amounts of data to be entered in the GLOBE database.• Two IOPS:
• Climate and Land Cover• Great Global Investigation of Climate
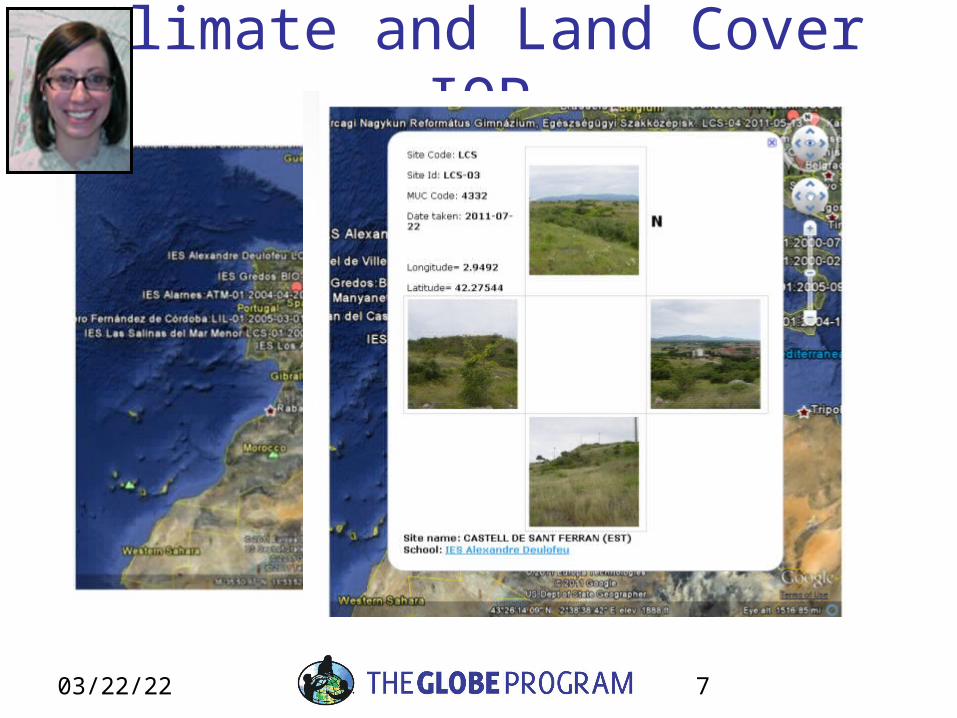
Climate and Land Cover IOP
04/19/23 7
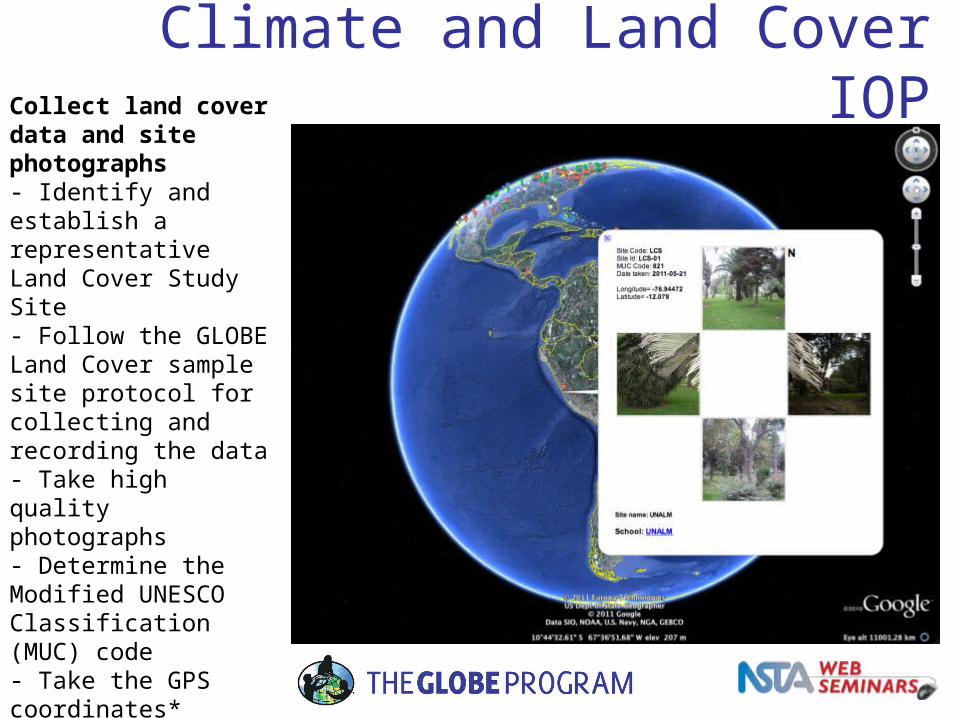
Climate and Land Cover IOPCollect land cover data and site photographs - Identify and establish a representative Land Cover Study Site - Follow the GLOBE Land Cover sample site protocol for collecting and recording the data- Take high quality photographs- Determine the Modified UNESCO Classification (MUC) code- Take the GPS coordinates*- Report the data

Great Global Investigation of Climate IOP

Let’s pause for questions from the audience.

Have you ever been trained to be a GLOBE teacher?
A. Yes
B. No

If yes, have you ever entered data?
A. Yes
B. No, but we collected data (we were not a GLOBE school)
C. No, because the quality was not high enough
D. No, because we were not a GLOBE school
E. No
If no, is this something you would be interested in?
A. Yes
B. No
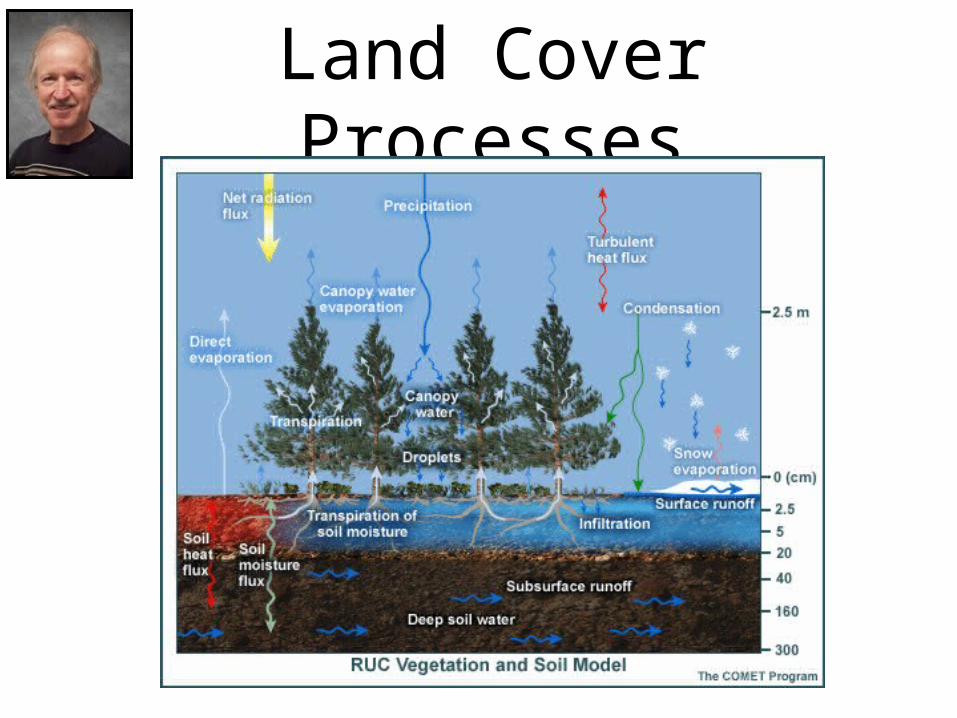
Land Cover Processes
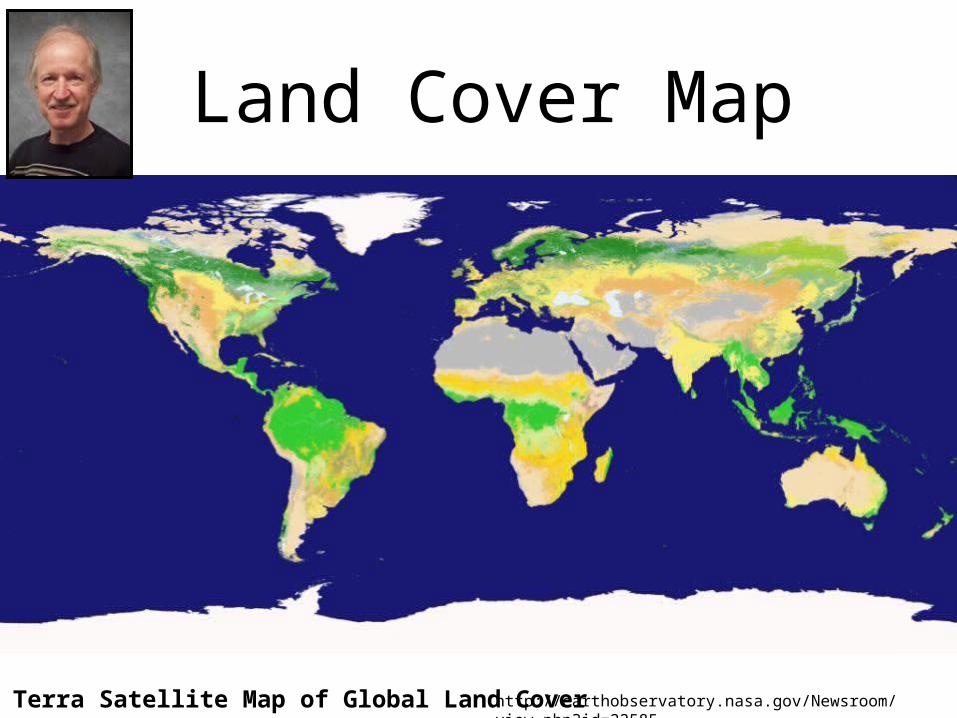
Land Cover Map
NASA’s Terra Satellite Refines Map of Global Land Cover
NASA’s Terra Satellite Map of Global Land Cover http://earthobservatory.nasa.gov/Newsroom/view.php?id=22585
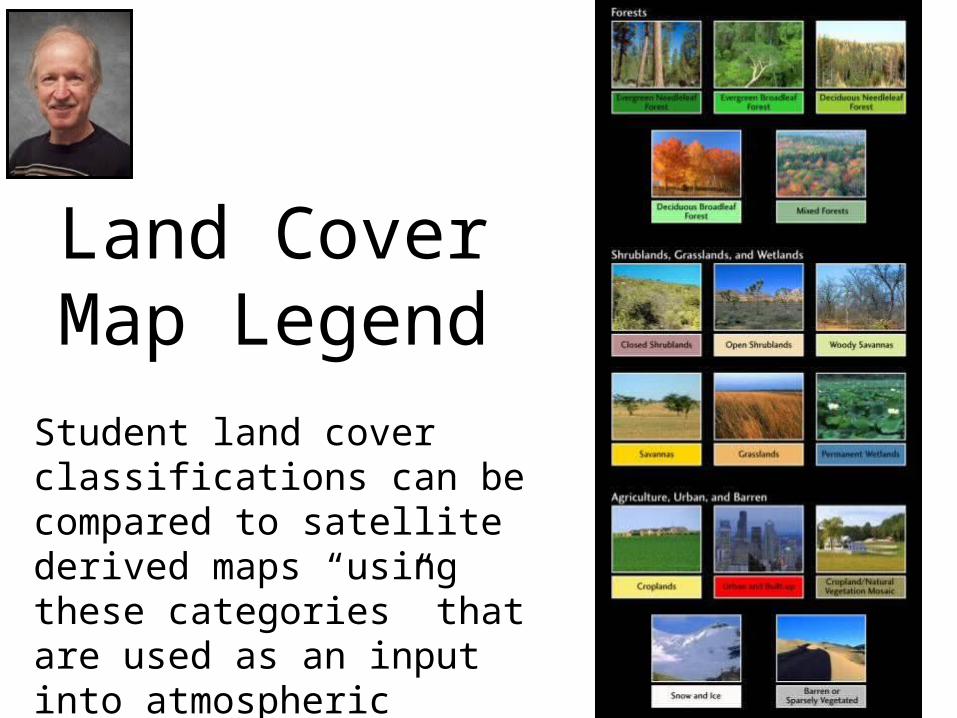
Land Cover Map Legend
Student land cover classifications can be compared to satellite derived maps “using these categories” that are used as an input into atmospheric models.

Science of Climate and Land Cover
http://earthobservatory.nasa.gov/IOTD/view.php?id=52052
Scientists need a better representation of relevant land surface features and their temporal (seasonal) variations to use in climate models.

Several groups at the National Oceanic and Atmospheric Administration (NOAA) Earth System Research Laboratory (ESRL) are working with satellite-based programs to improve and extend their global and regional observations of surface properties.
Science of Climate and Land Cover
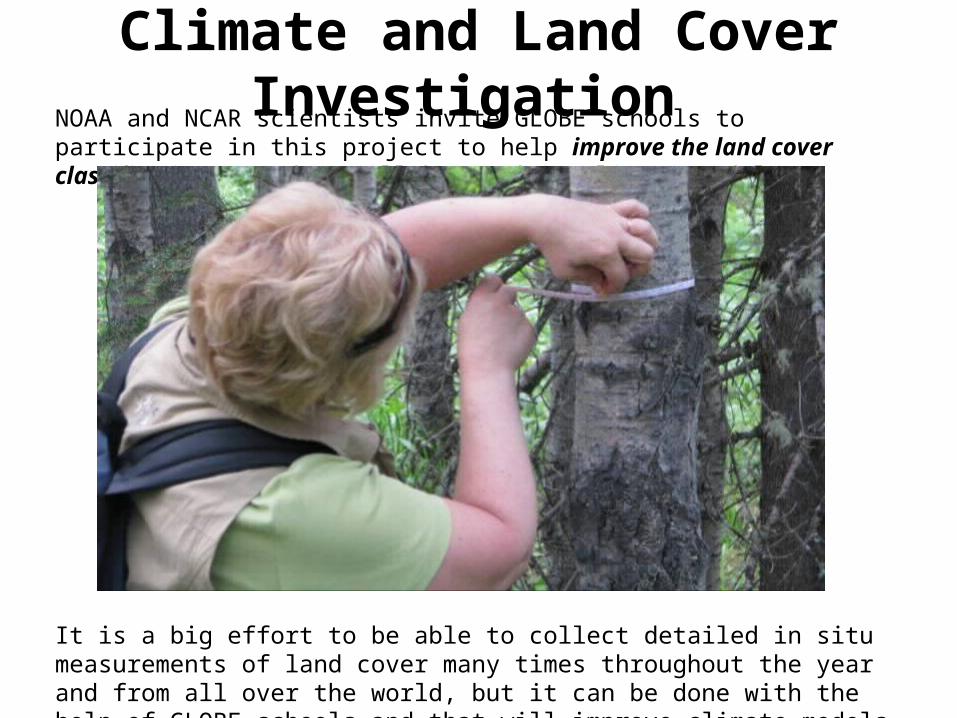
NOAA and NCAR scientists invite GLOBE schools to participate in this project to help improve the land cover classification maps that will be used in climate models.
It is a big effort to be able to collect detailed in situ measurements of land cover many times throughout the year and from all over the world, but it can be done with the help of GLOBE schools and that will improve climate models for the future!
Climate and Land Cover Investigation
Let’s pause for questions from the audience.
Do you think the land cover will change where you live
and teach in the next twenty five to fifty years?
A. Definitely yes
B. Maybe yes
C. Maybe no
D. Definitely no
E. Don’t know
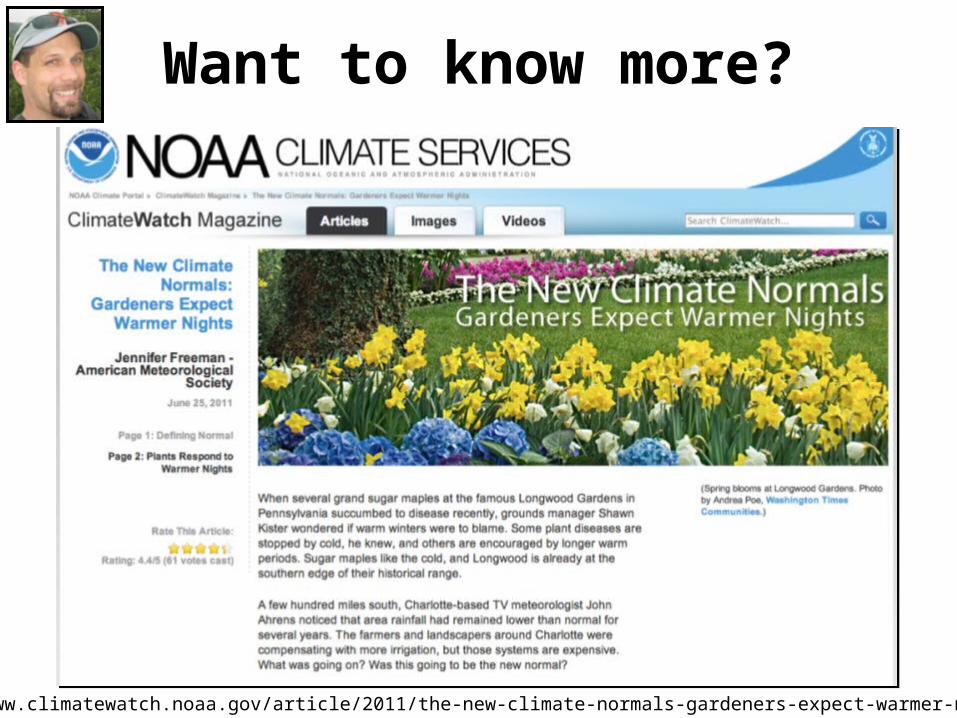
Want to know more?
http://www.climatewatch.noaa.gov/article/2011/the-new-climate-normals-gardeners-expect-warmer-nights-2/1
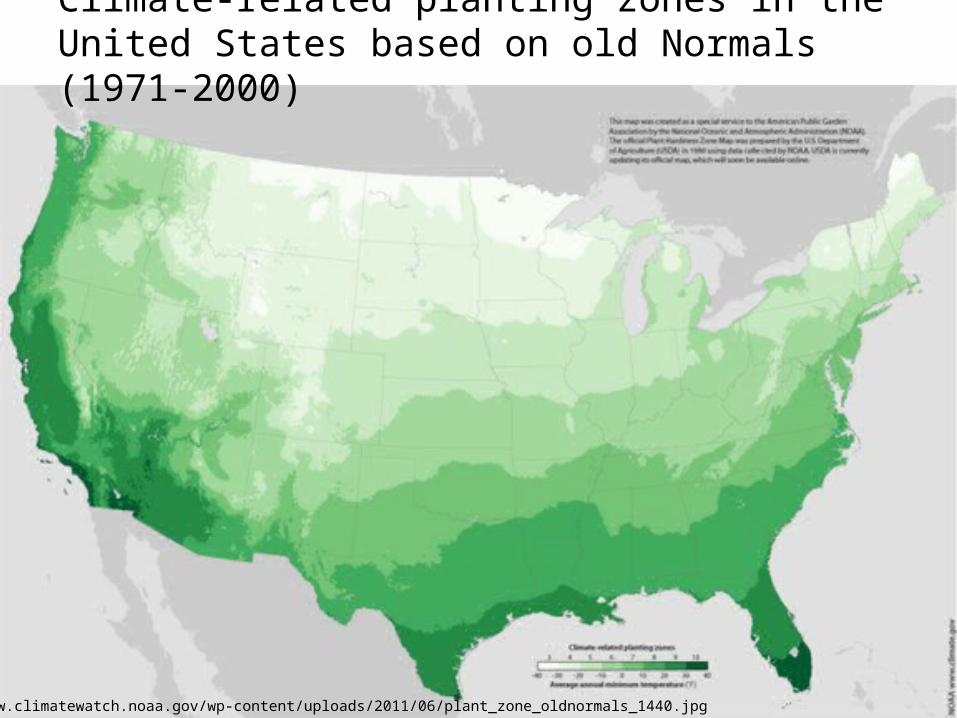
http://www.climatewatch.noaa.gov/wp-content/uploads/2011/06/plant_zone_oldnormals_1440.jpg
Climate-related planting zones in the United States based on old Normals (1971-2000)
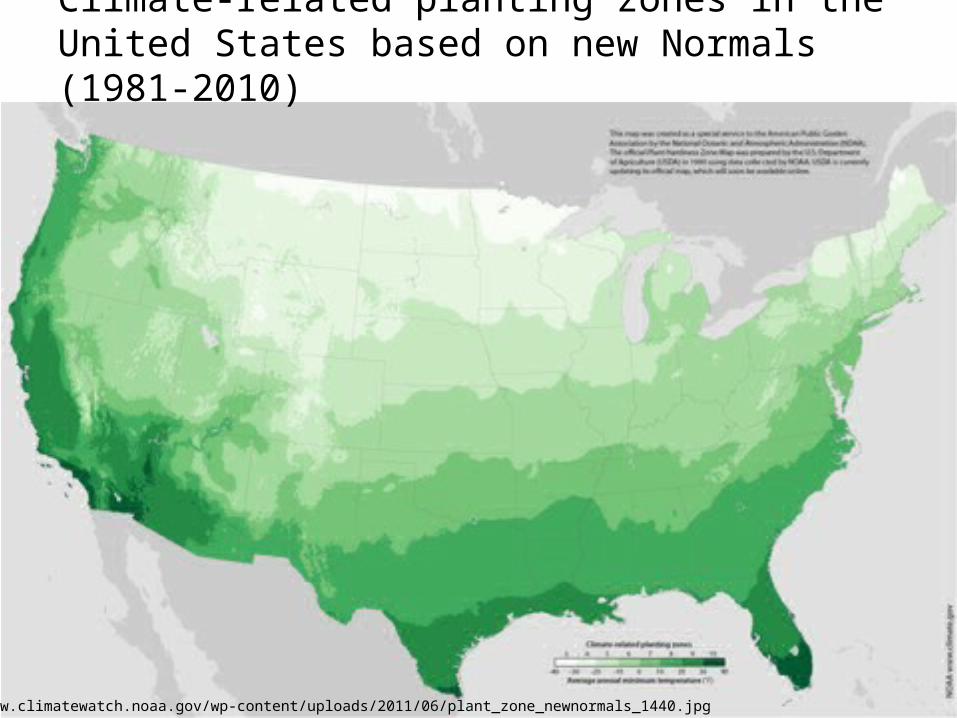
http://www.climatewatch.noaa.gov/wp-content/uploads/2011/06/plant_zone_newnormals_1440.jpg
Climate-related planting zones in the United States based on new Normals (1981-2010)

Areas that have changed zones as a result of warmer winter minimum temperatures.
http://www.climatewatch.noaa.gov/wp-content/uploads/2011/06/plant_zone_changes_1440.jpg

Let’s pause for questions from the audience.
With warmer nights and later onset of freezing days will this
mean that plants can generally survive closer to the
poles than they used to?A. Yes
B. No
C. Don’t know
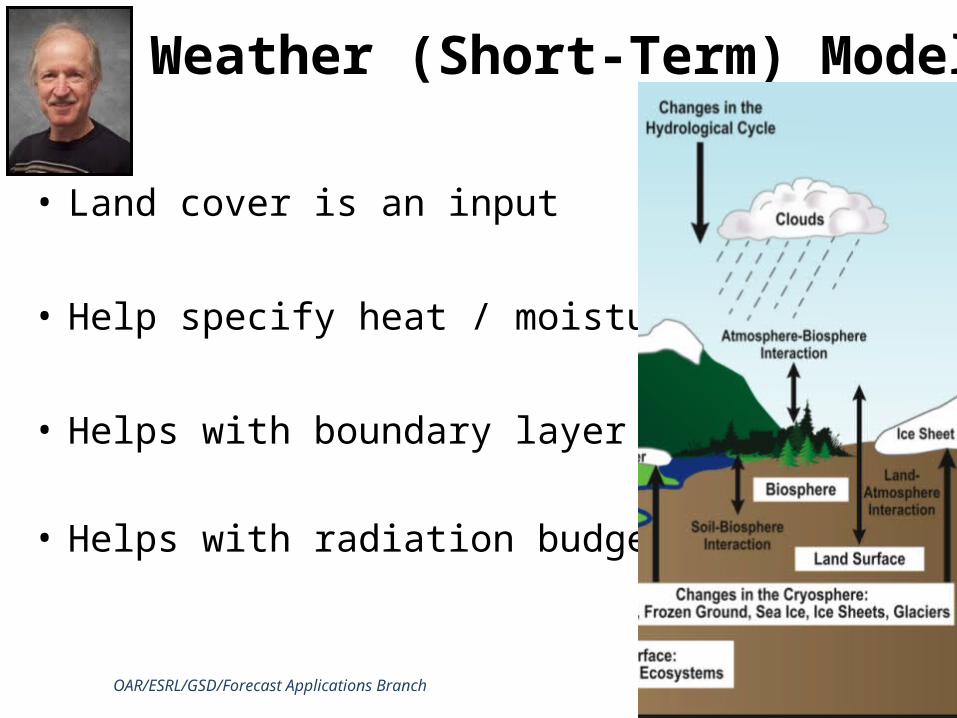
Weather (Short-Term) Models
• Land cover is an input
• Help specify heat / moisture fluxes
• Helps with boundary layer wind
• Helps with radiation budget
OAR/ESRL/GSD/Forecast Applications Branch 28
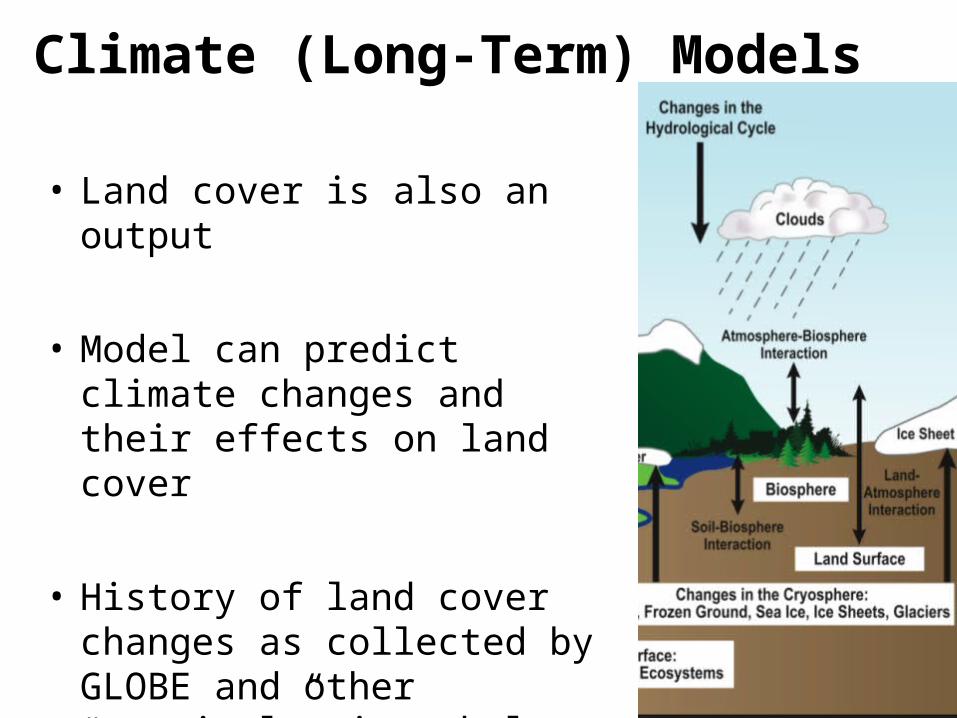
Climate (Long-Term) Models
• Land cover is also an output
• Model can predict climate changes and their effects on land cover
• History of land cover changes as collected by GLOBE and other “sentinel” sites helps verify the model
29

Scientists observe & measure all the factors that are known to influence Earth’s climate
30

Scientists observe & measure all the factors that are known to influence Earth’s climate
31http://earthobservatory.nasa.gov/Features/EnergyBalance/page6.php

Scientists apply that knowledge to a scaled-down,computer simulation of the planet: a global climate model
Modelers represent Earth’s surface and atmosphere as a virtual world made up of interacting, three-dimensional boxes.
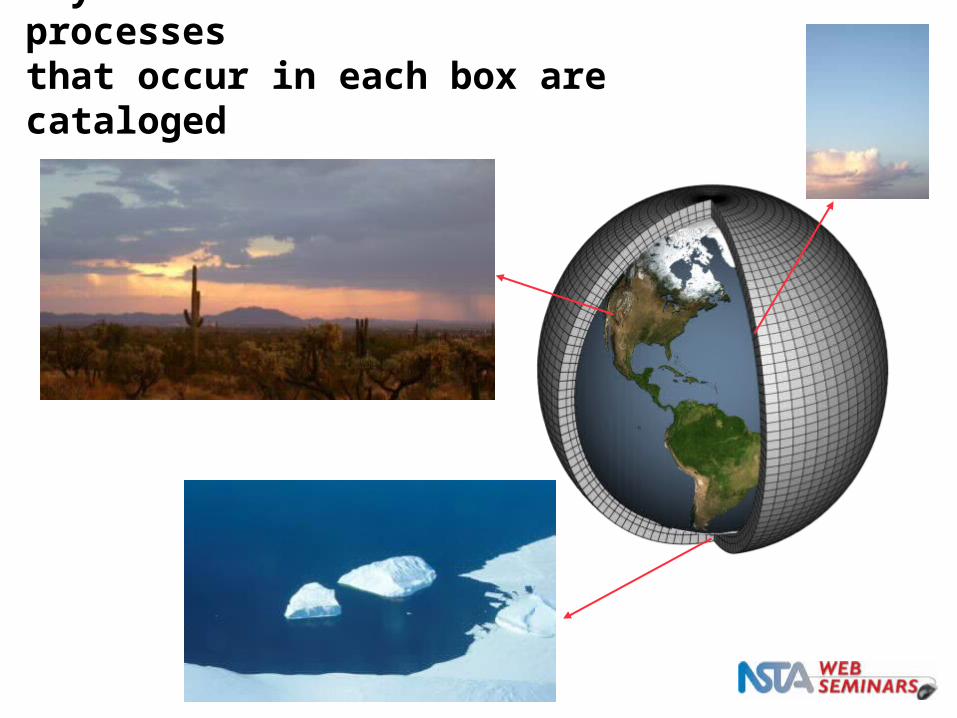
Physical characteristics and processes that occur in each box are cataloged
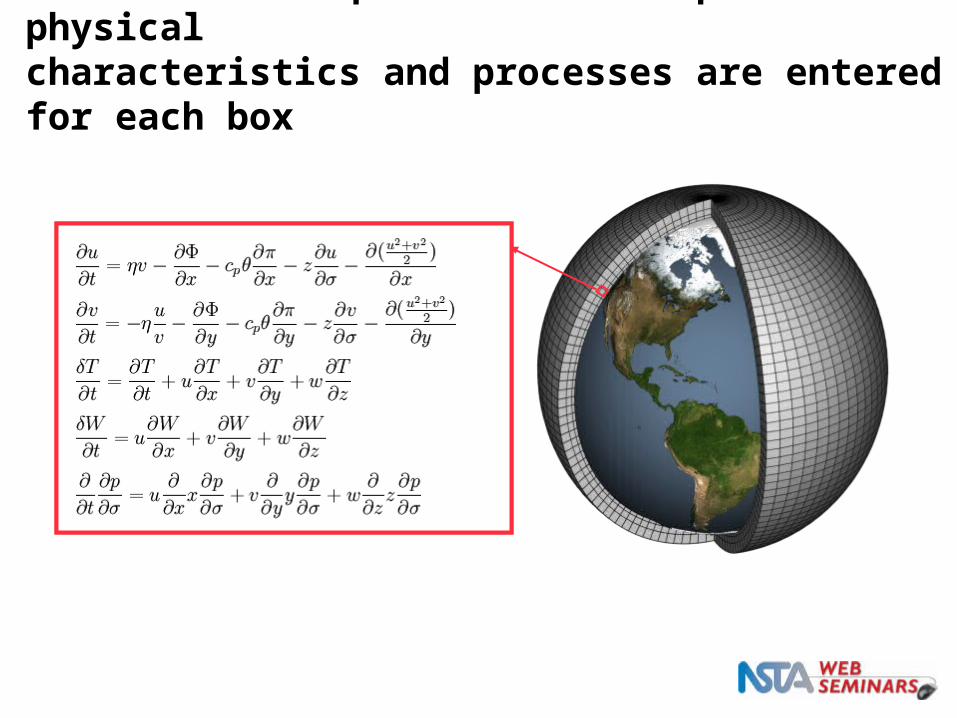
Mathematical equations that represent the physicalcharacteristics and processes are entered for each box

Equations are converted to computer code and climate variables are set
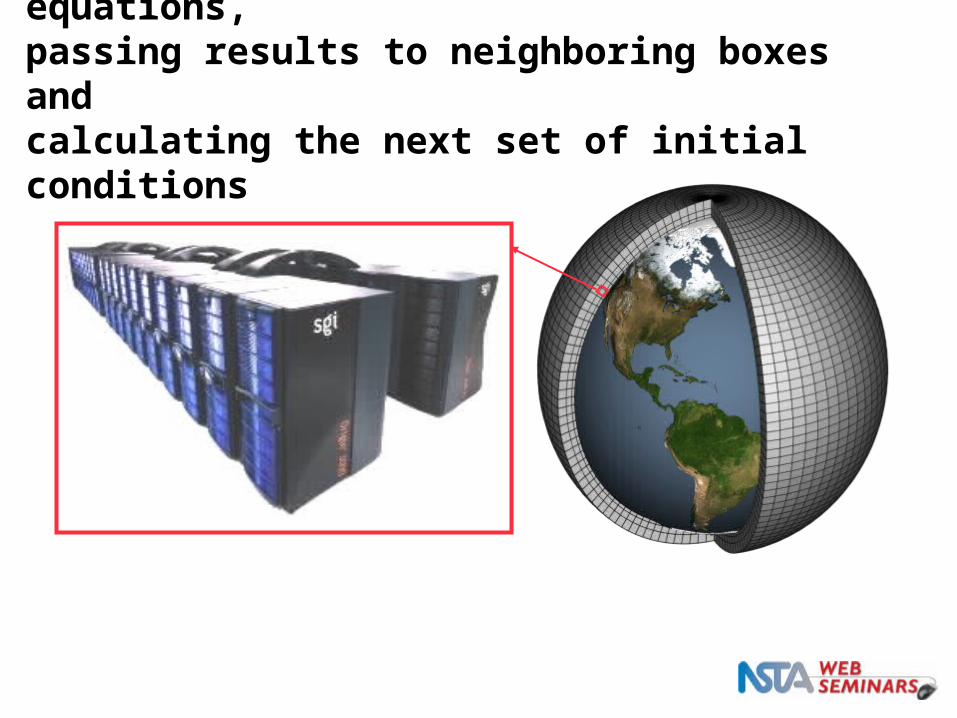
A supercomputer solves all the equations, passing results to neighboring boxes and calculating the next set of initial conditions
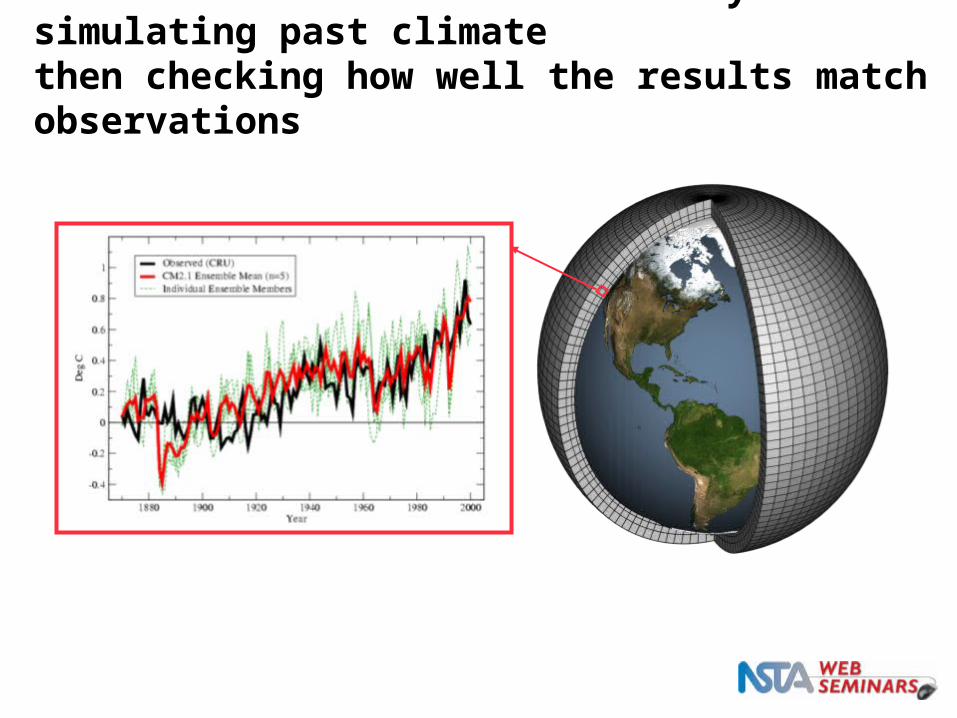
Models are tested and refined by simulating past climatethen checking how well the results match observations
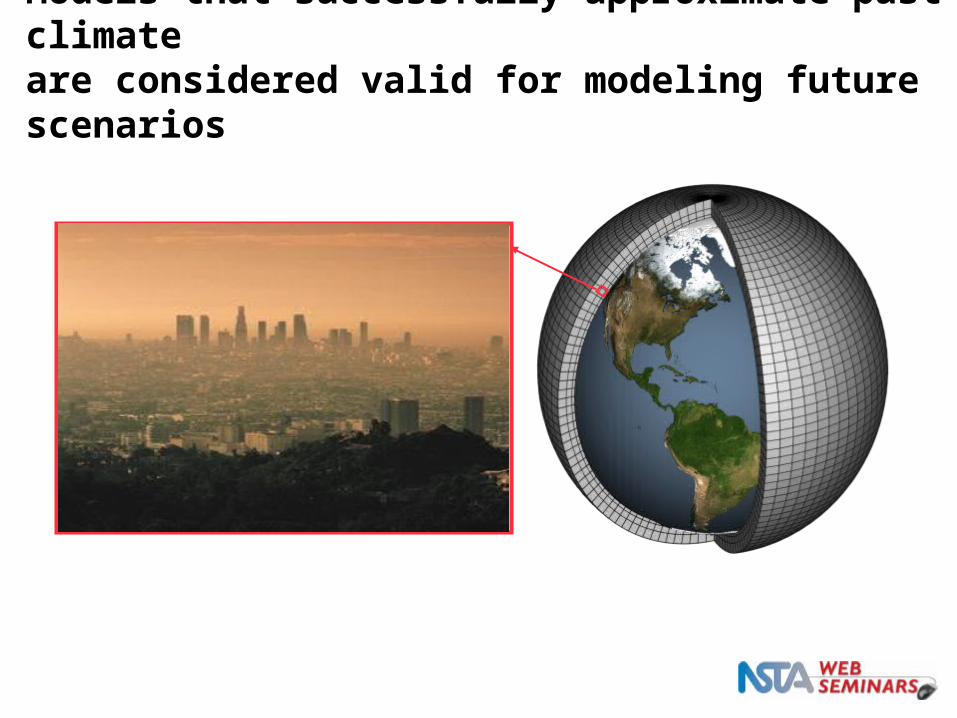
Models that successfully approximate past climate are considered valid for modeling future scenarios
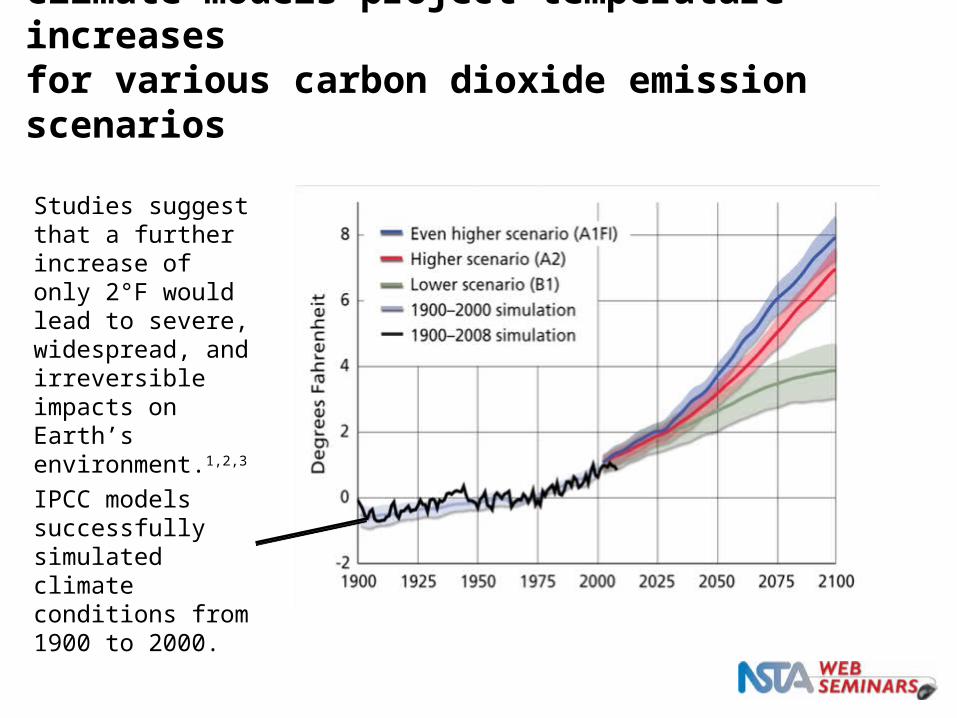
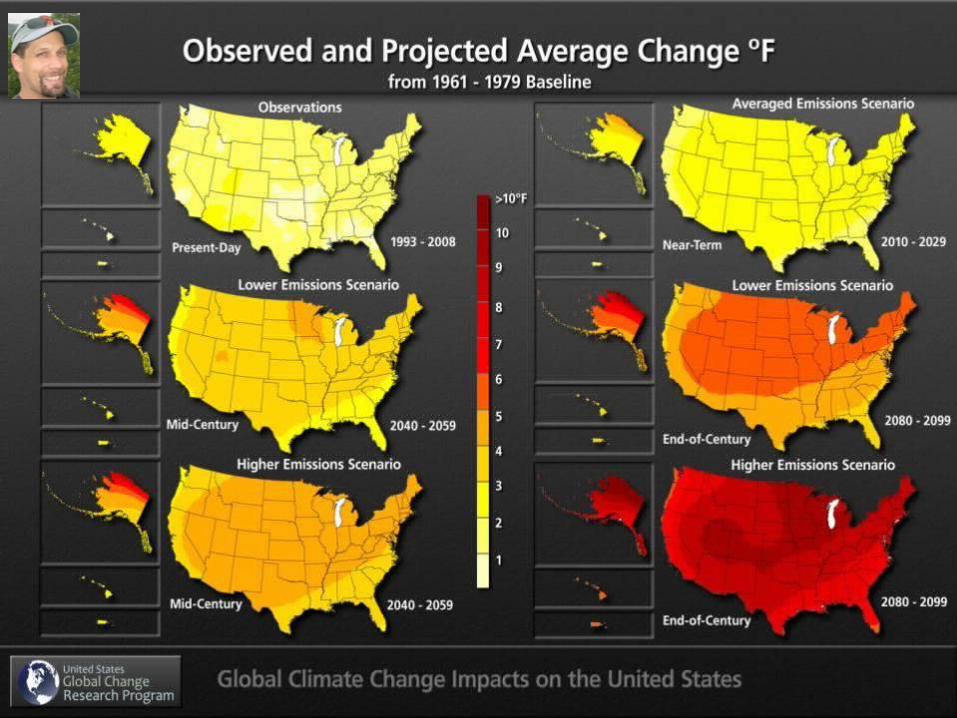
Climate models project temperature increases for various carbon dioxide emission scenarios
Studies suggest that a further increase of only 2°F would lead to severe, widespread, and irreversible impacts on Earth’s environment.1,2,3
IPCC models successfully simulated climate conditions from 1900 to 2000.

Research groups around the world have developed a range of respected climate models
Modeling groups also work together, averaging results from their models with other models that used the same initial conditions.
These multi-model results are called “ensembles.”
Let’s pause for questions from the audience.
Scientists can’t predict the weather more than a few
days in advance – they can’tpossibly predict the climate of
the future.A. False
B. True
C. Don’t know
Scientists’ computer models are too unreliable to predict
the climate of the future.
A. False
B. True
C. Don’t know
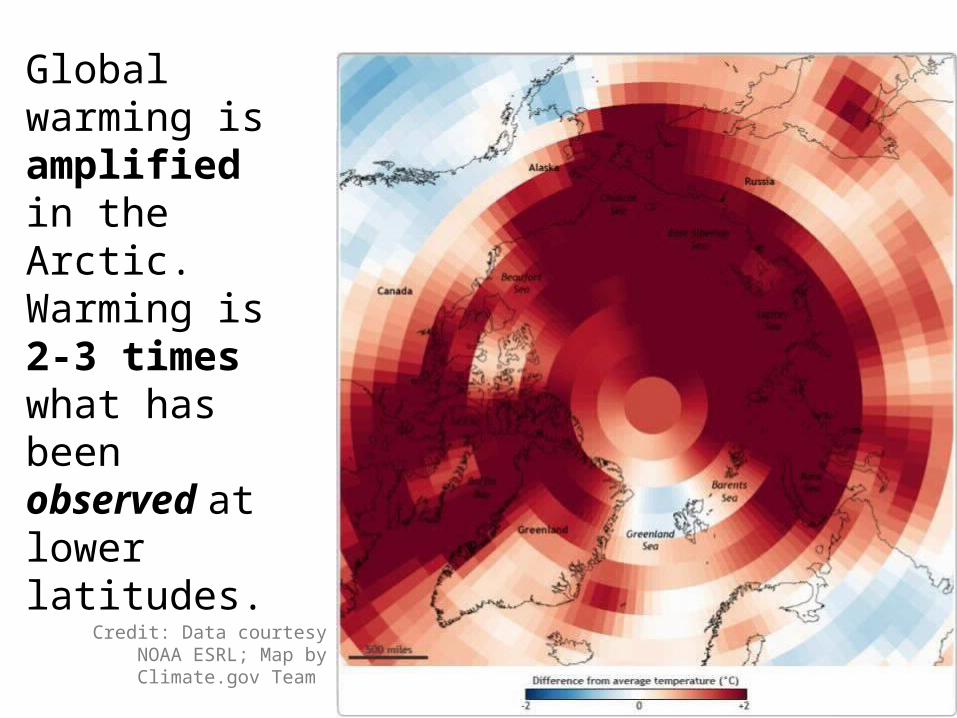
Global warming is amplified in the Arctic. Warming is 2-3 times what has been observed at lower latitudes.
Credit: Data courtesy NOAA ESRL; Map by Climate.gov Team

Tundra Growing Greener as Summer Warmth Increases
Credit: Data courtesy Uma Bhatt, U. of Alaska; Maps by Climate.gov Team


Let’s pause for questions from the audience.
Want to know more?
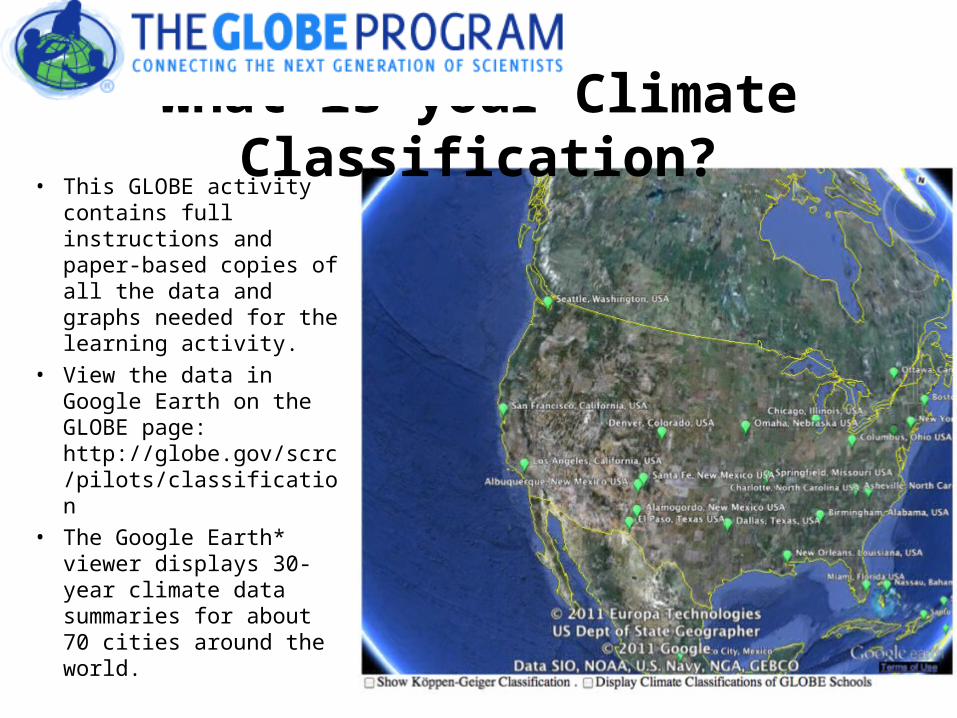
• This GLOBE activity contains full instructions and paper-based copies of all the data and graphs needed for the learning activity.
• View the data in Google Earth on the GLOBE page: http://globe.gov/scrc/pilots/classification
• The Google Earth* viewer displays 30-year climate data summaries for about 70 cities around the world.
What is your Climate Classification?
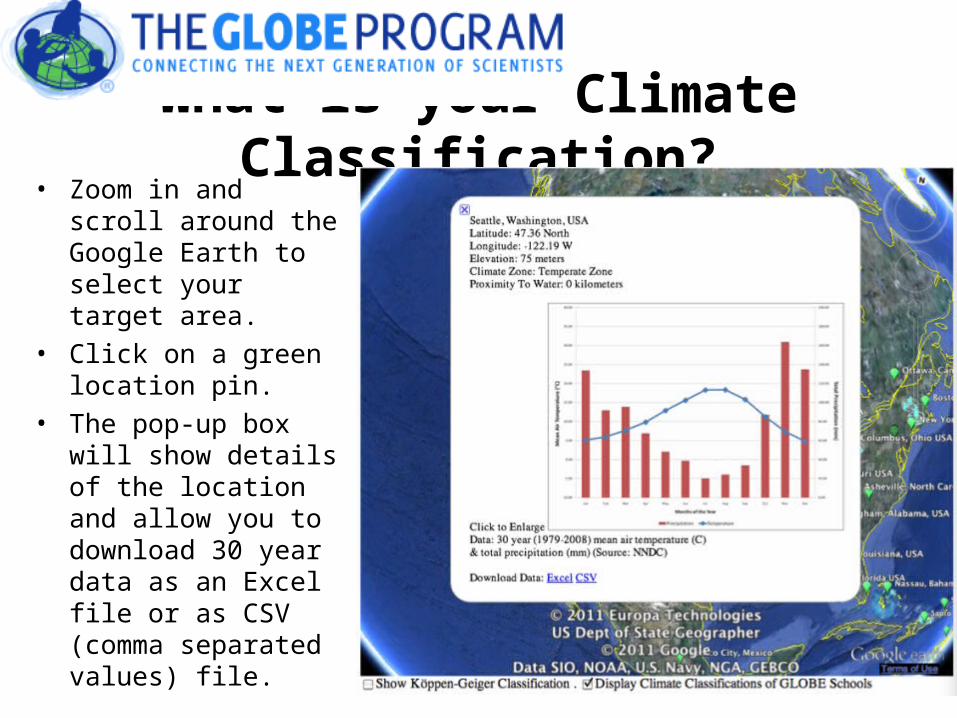
What is your Climate Classification?• Zoom in and scroll
around the Google Earth to select your target area.
• Click on a green location pin.
• The pop-up box will show details of the location and allow you to download 30 year data as an Excel file or as CSV (comma separated values) file.

What is your Climate Classification?• Use Google Earth to
show the Köppen-Gieger Classification.
• Compare the colour of your chosen location with the colour key at the top.
• Click on the colour key to get a description of each climate sub-category.
• You can display Climate Classifications of GLOBE schools to show if any schools in the area have submitted their climate classification to GLOBE.
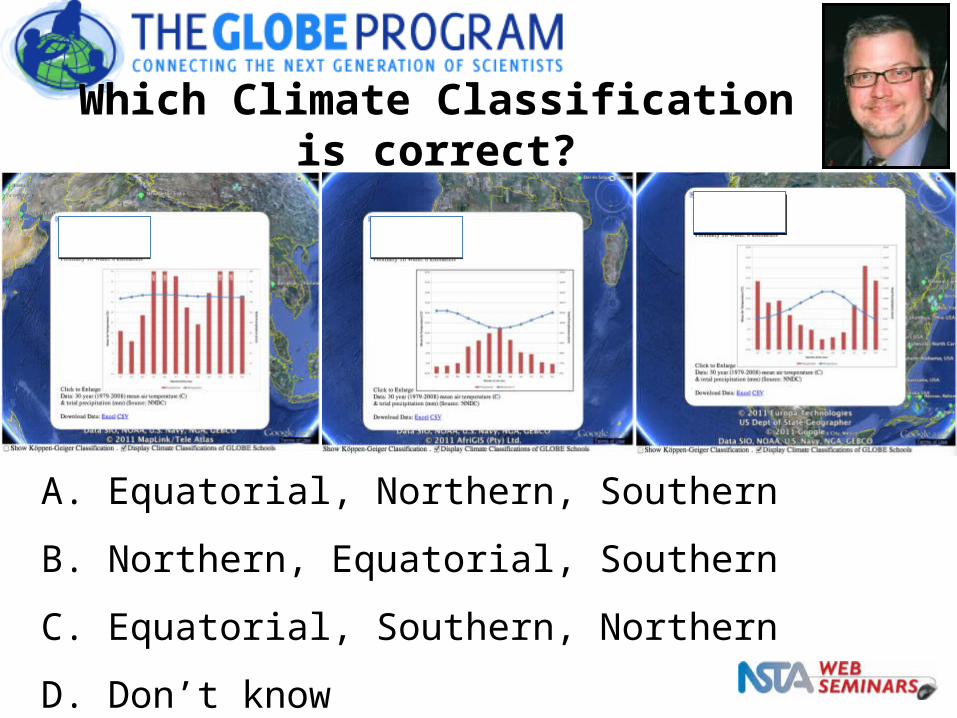
Which Climate Classification is correct?
A. Equatorial, Northern, Southern
B. Northern, Equatorial, Southern
C. Equatorial, Southern, Northern
D. Don’t know

As the climate continues to change how will the biomes shift poleward?

Let’s pause for questions from the audience.
Explore with Students the Connections between a Changing Land Cover and ClimateExplore with Students the Connections between a Changing Land Cover and Climate
Steve Albers, NOAA, [email protected] Niepold, NOAA, [email protected] Jessica Mackaro, The GLOBE Program, [email protected]
Further information:
Steve Albers, NOAA, [email protected] Niepold, NOAA, [email protected] Jessica Mackaro, The GLOBE Program, [email protected]
Further information:GLOBE Student Climate Research Campaign; http://globe.gov/scrcNOAA Climate Portal; http://www.climate.govUS Global Change Research Program: http://www.globalchange.gov/

Thank you to the sponsor of tonight's Web Seminar:
This web seminar contains information about programs, products, and services offered by third parties, as well as links to third-party websites. The presence of a listing or
such information does not constitute an endorsement by NSTA of a particular company or organization, or its programs, products, or services.

http://learningcenter.nsta.org

National Science Teachers AssociationDr. Francis Q. Eberle, Executive Director
Zipporah Miller, Associate Executive Director Conferences and Programs
Al Byers, Assistant Executive Director e-Learning
LIVE INTERACTIVE LEARNING @ YOUR DESKTOP
NSTA Web SeminarsPaul Tingler, Director
Jeff Layman, Technical Coordinator