little elm quarterly independent report school 3q16 … 142 174 141 240 389 162 3q 108 132 155 124...
TRANSCRIPT

Learn from Yesterday…
Understand Today…
Plan for Tomorrow
Little Elm
Independent
School
District
Quarterly Report
3Q16

Economic Conditions- Dallas-Fort Worth MSA
2
Unemployment Rate
SEPTEMBER 2016 USA
Texas
Little Elm DFW 4.1%
4.9%
2.8%
5% 4% 3% 6%
Annual Job Growth Rate
SEPTEMBER 2016 DFW
3.8%
1.7%
0% 2% 3% 4% 1%
USA
Texas
4.8%
2%

LEISD Home Sales January–November 2016 Home Sales by Transaction Type
3
• The district has had 1,687 home sales to date IN 2016, and roughly
45% were of new homes
• The average sale price to date in 2016 for a new home is $306,206, an
increase of 1.8% over 2015
• The average sale price to date in 2016 for an existing home is $258,377
Source: Metrostudy and Denton County Deed Transactions
Regular Resale 51%
New Home Sale 45%
Foreclosure 2%
REO Sale 2%
Little Elm ISD 2016 Home Sales by Type
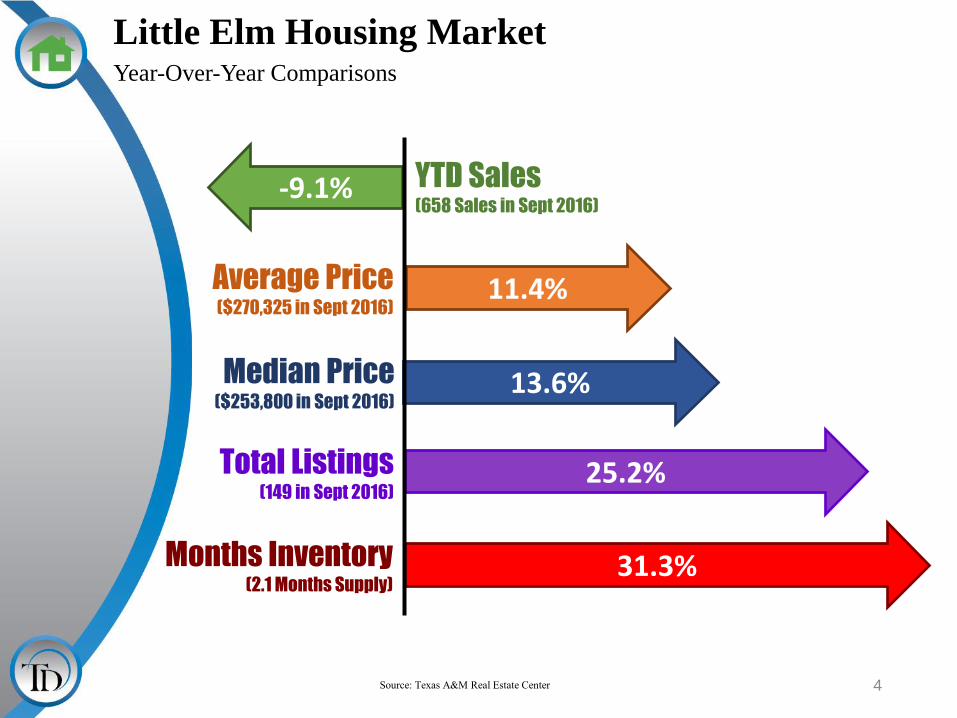
Little Elm Housing Market Year-Over-Year Comparisons
4
-9.1%
11.4%
13.6%
25.2%
31.3%
YTD Sales (658 Sales in Sept 2016)
Total Listings (149 in Sept 2016)
Average Price ($270,325 in Sept 2016)
Median Price ($253,800 in Sept 2016)
Months Inventory (2.1 Months Supply)
Source: Texas A&M Real Estate Center
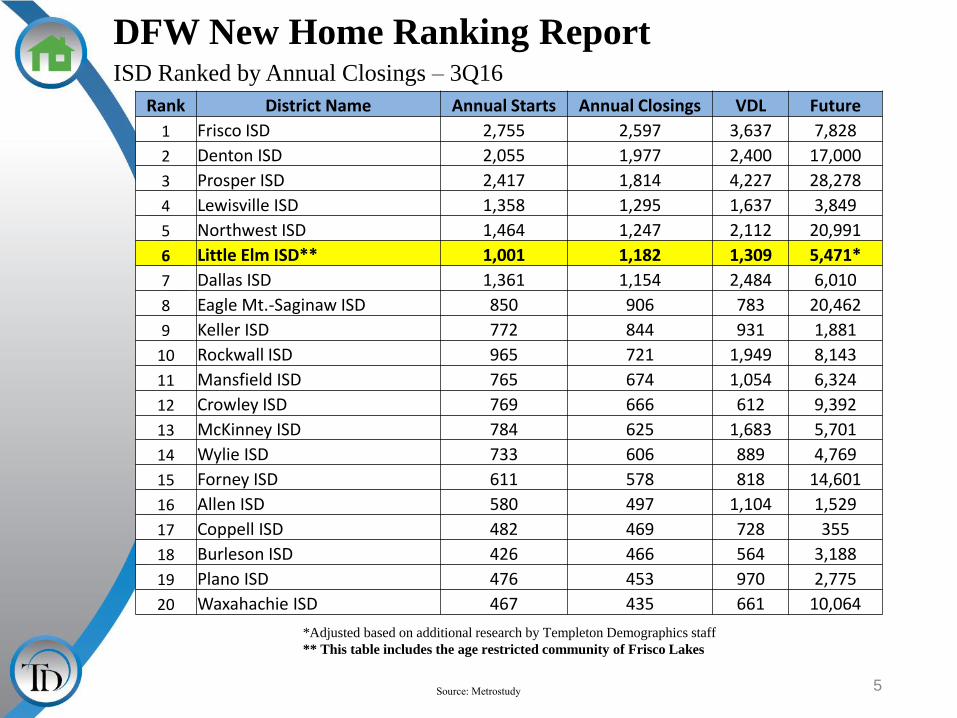
Rank District Name Annual Starts Annual Closings VDL Future
1 Frisco ISD 2,755 2,597 3,637 7,828
2 Denton ISD 2,055 1,977 2,400 17,000
3 Prosper ISD 2,417 1,814 4,227 28,278
4 Lewisville ISD 1,358 1,295 1,637 3,849
5 Northwest ISD 1,464 1,247 2,112 20,991
6 Little Elm ISD** 1,001 1,182 1,309 5,471*
7 Dallas ISD 1,361 1,154 2,484 6,010
8 Eagle Mt.-Saginaw ISD 850 906 783 20,462
9 Keller ISD 772 844 931 1,881
10 Rockwall ISD 965 721 1,949 8,143
11 Mansfield ISD 765 674 1,054 6,324
12 Crowley ISD 769 666 612 9,392
13 McKinney ISD 784 625 1,683 5,701
14 Wylie ISD 733 606 889 4,769
15 Forney ISD 611 578 818 14,601
16 Allen ISD 580 497 1,104 1,529
17 Coppell ISD 482 469 728 355
18 Burleson ISD 426 466 564 3,188
19 Plano ISD 476 453 970 2,775
20 Waxahachie ISD 467 435 661 10,064
DFW New Home Ranking Report ISD Ranked by Annual Closings – 3Q16
*Adjusted based on additional research by Templeton Demographics staff
** This table includes the age restricted community of Frisco Lakes
5 Source: Metrostudy

New Housing Activity
• Little Elm ISD had more than 150 starts for the seventh consecutive quarter
• The district had the most third quarter closings in more than 13 years
• New home inventory is low at 4 month’s supply due to a large number of 3Q closings 6
Little Elm ISD
Starts 2011 2012 2013 2014 2015 2016 Closings 2011 2012 2013 2014 2015 2016
1Q 114 85 174 136 167 381 1Q 75 99 143 114 155 256
2Q 87 148 175 126 261 243 2Q 127 125 180 146 182 262
3Q 142 174 141 240 389 162 3Q 108 132 155 124 211 378
4Q 110 175 109 138 258 4Q 134 175 121 160 308
Total 453 582 599 640 1,075 786 Total 444 531 599 544 856 896
0
200
400
600
800
1,000
1,200
2008 2009 2010 2011 2012 2013 2014 2015 2016
Annual Starts Annual Closings Avg. Inventory

Annual Closing Distribution 3Q16
7
* Does not include
age restricted
communities
Elementary Annual
Closings
BRENT 1
CHAVEZ 0
HACKBERRY 448*
LAKEVIEW 52
OAK POINT 177
PRESTWICK 241 Grand Total 919

Vacant Developed Lots 3Q16
8
* Does not include
age restricted
communities
Elementary Vacant
Dev. Lots
BRENT 9
CHAVEZ 0
HACKBERRY 193*
LAKEVIEW 102
OAK POINT 501
PRESTWICK 300
Grand Total 1,105
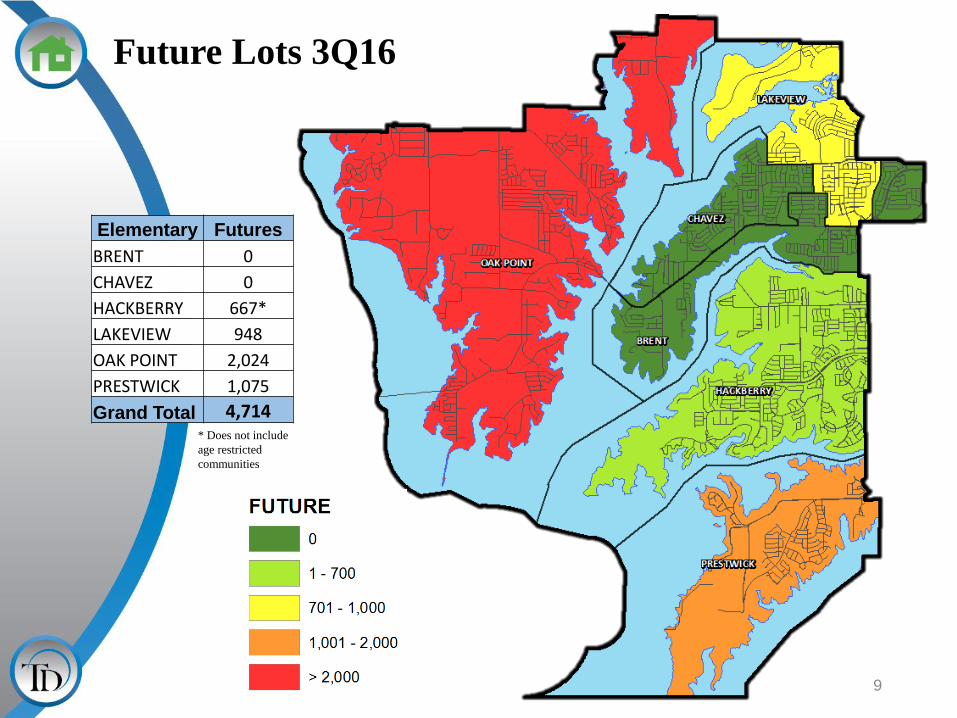
Future Lots 3Q16
9
* Does not include
age restricted
communities
Elementary Futures
BRENT 0
CHAVEZ 0
HACKBERRY 667*
LAKEVIEW 948
OAK POINT 2,024
PRESTWICK 1,075
Grand Total 4,714
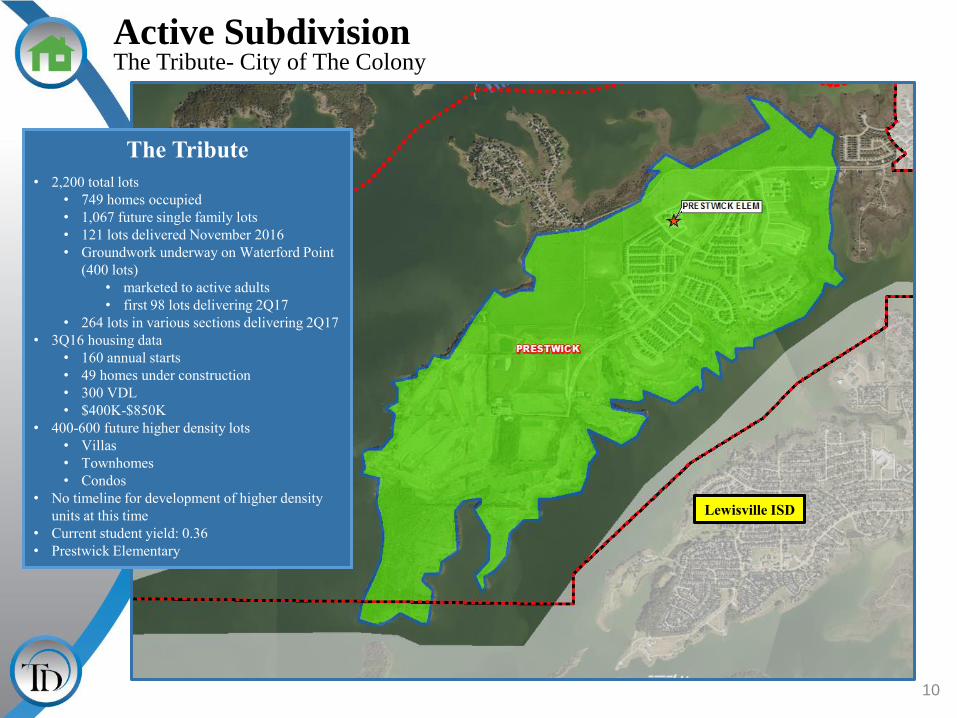
The Tribute
• 2,200 total lots
• 749 homes occupied
• 1,067 future single family lots
• 121 lots delivered November 2016
• Groundwork underway on Waterford Point
(400 lots)
• marketed to active adults
• first 98 lots delivering 2Q17
• 264 lots in various sections delivering 2Q17
• 3Q16 housing data
• 160 annual starts
• 49 homes under construction
• 300 VDL
• $400K-$850K
• 400-600 future higher density lots
• Villas
• Townhomes
• Condos
• No timeline for development of higher density
units at this time
• Current student yield: 0.36
• Prestwick Elementary
Active Subdivision The Tribute- City of The Colony
10
Lewisville ISD

Active Subdivision Wildridge – Town of Oak Point
Wildridge (Formerly Known As Timberlake)
• 723 total lots in LEISD
• 551 future lots
• 30 homes under construction
• 36 homes occupied
• 85 vacant developed lots
• Phase 2 (199 lots) groundwork underway:
• 66 lots delivering December 2016
• 50 lots delivering January 2017
• 83 lots delivering December 2017
• Phase 3 (appx. 220 lots) in planning stages,
groundwork anticipated mid 2017
• Split between LEISD & Denton ISD
• All activity is currently in LEISD
• $250K+ with average home price at/near $275K
• 3 current students
• Oak Point Elementary
11
Denton ISD

Active Subdivision Rivendale by the Lake
12
Rivendale by the Lake
• 705 total lots
• 230 future lots
• 302 homes occupied
• 35 homes under construction
• 124 vacant developed lots
• Phase 4 (120 lots) delivered 3Q16
• Groundwork underway on 230 future lots
• Building approx. 180 homes per year
• $210K-$280K
• Current student yield: 0.27
• Hackberry Elementary
Phase 4
120 lots

Active Subdivision Paloma Creek South Lakeview
13
Paloma Creek South
• 431 total lots
• 332 future single family lots
• 29 homes occupied
• 25 vacant developed lots
• 54 homes under construction
• Groundwork underway for Phase 2
(332 lots) in South Lakeview
• 157 lots delivered 3Q16
• Groundwork underway on
remaining 175 lots anticipated
delivery by end 2016
• Current student yield: 0.82
• Oak Point Elementary
Lakeview Ph. 2D1
157 lots
Lakeview
Phase 2D2
175 lots
Denton ISD

Multi Family Activity Lakeside at Little Elm
14
Lakeside at Little Elm
• 242 Market rate units under construction
• Will be part of mixed-use development
that will include retail and multi-family
residential
• First units expected to begin pre-leasing
late 2016 or early 2017
• Construction complete spring 2017
• Chavez Elementary
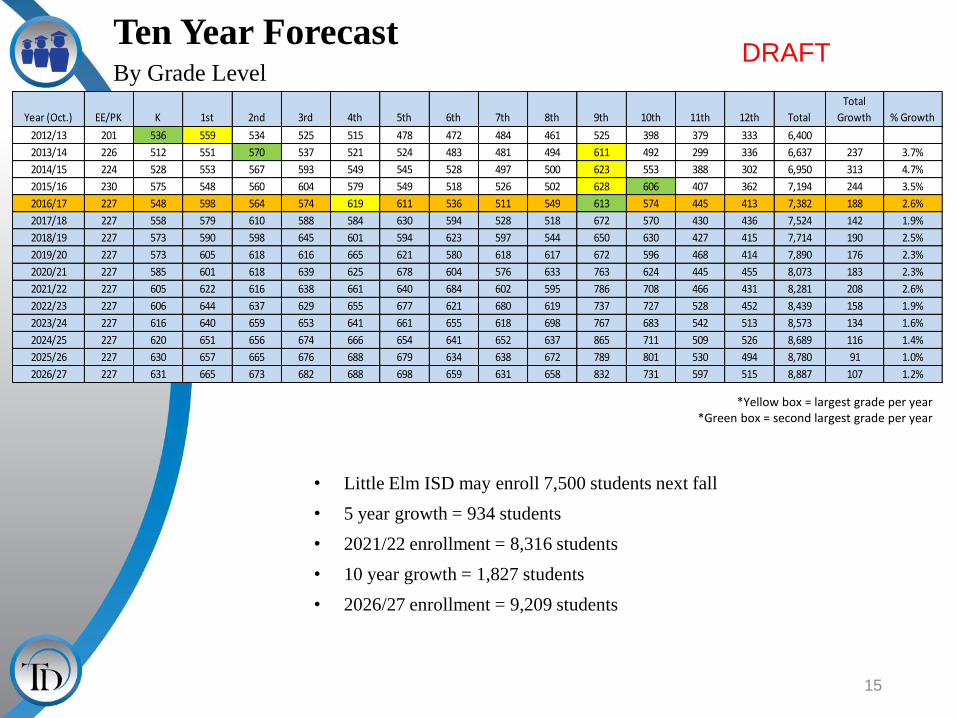
Ten Year Forecast By Grade Level
*Yellow box = largest grade per year *Green box = second largest grade per year
• Little Elm ISD may enroll 7,500 students next fall
• 5 year growth = 934 students
• 2021/22 enrollment = 8,316 students
• 10 year growth = 1,827 students
• 2026/27 enrollment = 9,209 students
15
DRAFT
Year (Oct.) EE/PK K 1st 2nd 3rd 4th 5th 6th 7th 8th 9th 10th 11th 12th Total
Total
Growth % Growth
2012/13 201 536 559 534 525 515 478 472 484 461 525 398 379 333 6,400
2013/14 226 512 551 570 537 521 524 483 481 494 611 492 299 336 6,637 237 3.7%
2014/15 224 528 553 567 593 549 545 528 497 500 623 553 388 302 6,950 313 4.7%
2015/16 230 575 548 560 604 579 549 518 526 502 628 606 407 362 7,194 244 3.5%
2016/17 227 548 598 564 574 619 611 536 511 549 613 574 445 413 7,382 188 2.6%
2017/18 227 558 579 610 588 584 630 594 528 518 672 570 430 436 7,524 142 1.9%
2018/19 227 573 590 598 645 601 594 623 597 544 650 630 427 415 7,714 190 2.5%
2019/20 227 573 605 618 616 665 621 580 618 617 672 596 468 414 7,890 176 2.3%
2020/21 227 585 601 618 639 625 678 604 576 633 763 624 445 455 8,073 183 2.3%
2021/22 227 605 622 616 638 661 640 684 602 595 786 708 466 431 8,281 208 2.6%
2022/23 227 606 644 637 629 655 677 621 680 619 737 727 528 452 8,439 158 1.9%
2023/24 227 616 640 659 653 641 661 655 618 698 767 683 542 513 8,573 134 1.6%
2024/25 227 620 651 656 674 666 654 641 652 637 865 711 509 526 8,689 116 1.4%
2025/26 227 630 657 665 676 688 679 634 638 672 789 801 530 494 8,780 91 1.0%
2026/27 227 631 665 673 682 688 698 659 631 658 832 731 597 515 8,887 107 1.2%

Ten Year Forecast By Elementary Campus with Functional Capacity ( not including district programs).
• Oak Point Elementary may enroll more than 750 students by 2018
• Prestwick Elementary may enroll more than 450 students next fall
and more than 500 by 2020
*Yellow box = enrollment exceeds stated capacity
16
DRAFT
Maximum Current
Campus Capacity 2016/17 2017/18 2018/19 2019/20 2020/21 2021/22 2022/23 2023/24 2024/25 2025/26 2026/27
Brent Elementary 843 666 656 636 640 616 608 627 619 617 630 630
Chavez Elementary 843 722 703 692 683 694 682 695 698 702 707 703
Hackberry Elementary 823 605 597 635 679 695 716 723 733 747 754 767
Lakeview Elementary 823 629 635 640 647 652 659 673 686 703 737 765
Oak Point Elementary 823 702 738 756 781 811 825 831 833 841 851 859
Prestwick Elementary (EE-5th) 400 417 447 469 495 505 519 526 528 538 543 540
ELEMENTARY SCHOOL TOTAL 4,555 3,741 3,776 3,828 3,925 3,973 4,009 4,075 4,097 4,148 4,222 4,264
PROJECTIONS

Ten Year Forecast By Elementary Campus with Functional Capacity with district programs.
*Yellow box = enrollment exceeds stated capacity
17
DRAFT
Functional Current
Campus Capacity 2016/17 2017/18 2018/19 2019/20 2020/21 2021/22 2022/23 2023/24 2024/25 2025/26 2026/27
Brent Elementary 743 666 656 636 640 616 608 627 619 617 630 630
Chavez Elementary 625 722 703 692 683 694 682 695 698 702 707 703
Hackberry Elementary 605 605 597 635 679 695 716 723 733 747 754 767
Lakeview Elementary 605 629 635 640 647 652 659 673 686 703 737 765
Oak Point Elementary 684 702 738 756 781 811 825 831 833 841 851 859
Prestwick Elementary (EE-5th) 382 417 447 469 495 505 519 526 528 538 543 540
ELEMENTARY SCHOOL TOTAL 3,644 3,741 3,776 3,828 3,925 3,973 4,009 4,075 4,097 4,148 4,222 4,264
PROJECTIONS
Note: District Programs: Includes SPED, inclusion, Pre-K, Gifted and Talented, ACE, etc. Library, Gym, Art, Music, Multi-Purpose, Science, Computer Rooms are excluded from total classroom count. Some Classrooms @ Hackberry, Lakeview & Oak Point (approx. 6 classrooms) are smaller w/o cubbies but are used as standard classrooms.
Maximum Current PROJECTIONS
Campus Capacity 2016/17 2017/1
8 2018/1
9 2019/2
0 2020/2
1 2021/2
2 2022/2
3 2023/2
4 2024/2
5 2025/2
6 2026/2
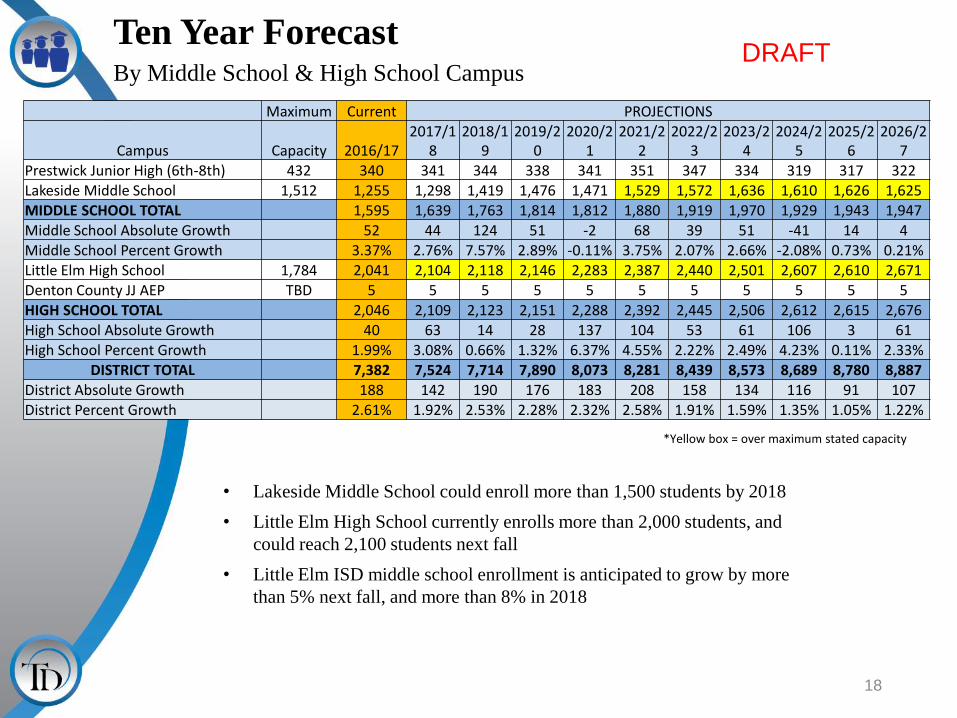
7 Prestwick Junior High (6th-8th) 432 340 341 344 338 341 351 347 334 319 317 322 Lakeside Middle School 1,512 1,255 1,298 1,419 1,476 1,471 1,529 1,572 1,636 1,610 1,626 1,625 MIDDLE SCHOOL TOTAL 1,595 1,639 1,763 1,814 1,812 1,880 1,919 1,970 1,929 1,943 1,947 Middle School Absolute Growth 52 44 124 51 -2 68 39 51 -41 14 4 Middle School Percent Growth 3.37% 2.76% 7.57% 2.89% -0.11% 3.75% 2.07% 2.66% -2.08% 0.73% 0.21% Little Elm High School 1,784 2,041 2,104 2,118 2,146 2,283 2,387 2,440 2,501 2,607 2,610 2,671 Denton County JJ AEP TBD 5 5 5 5 5 5 5 5 5 5 5
HIGH SCHOOL TOTAL 2,046 2,109 2,123 2,151 2,288 2,392 2,445 2,506 2,612 2,615 2,676 High School Absolute Growth 40 63 14 28 137 104 53 61 106 3 61 High School Percent Growth 1.99% 3.08% 0.66% 1.32% 6.37% 4.55% 2.22% 2.49% 4.23% 0.11% 2.33%
DISTRICT TOTAL 7,382 7,524 7,714 7,890 8,073 8,281 8,439 8,573 8,689 8,780 8,887 District Absolute Growth 188 142 190 176 183 208 158 134 116 91 107 District Percent Growth 2.61% 1.92% 2.53% 2.28% 2.32% 2.58% 1.91% 1.59% 1.35% 1.05% 1.22%
Ten Year Forecast By Middle School & High School Campus
• Lakeside Middle School could enroll more than 1,500 students by 2018
• Little Elm High School currently enrolls more than 2,000 students, and
could reach 2,100 students next fall
• Little Elm ISD middle school enrollment is anticipated to grow by more
than 5% next fall, and more than 8% in 2018
18
*Yellow box = over maximum stated capacity
DRAFT

One Year Forecast
19
By Campus and Grade DRAFT
Current
Campus 2016/17 EE/PK K 1st 2nd 3rd 4th 5th 6th 7th 8th 9th 10th 11th 12th Total Change
Brent Elementary 666 25 93 97 100 113 111 117 0 0 0 0 0 0 0 656 -10
Chavez Elementary 722 95 93 95 105 89 115 111 0 0 0 0 0 0 0 703 -19
Hackberry Elementary 605 51 96 100 97 83 75 95 0 0 0 0 0 0 0 597 -8
Lakeview Elementary 629 4 98 101 113 112 98 109 0 0 0 0 0 0 0 635 0
Oak Point Elementary 702 50 107 110 124 107 115 125 0 0 0 0 0 0 0 738 36
Prestwick Elementary (EE-5th) 417 2 71 76 71 84 70 73 0 0 0 0 0 0 0 447 30
ELEMENTARY SCHOOL TOTALS 3,741 227 558 579 610 588 584 630 0 0 0 0 0 0 0 3,776 35
STEM Junior High (6th-8th) 340 0 0 0 0 0 0 0 115 118 108 0 0 0 0 341 1
Lakeside Middle School 1,255 0 0 0 0 0 0 0 478 410 410 0 0 0 0 1,298 43
MIDDLE SCHOOL TOTALS 1,595 0 0 0 0 0 0 0 593 528 518 0 0 0 0 1,639 44
Little Elm High School 2,041 0 0 0 0 0 0 0 0 0 0 670 570 428 436 2,104 63
HIGH SCHOOL TOTALS 2,041 0 0 0 0 0 0 0 0 0 0 670 570 428 436 2,104 63
Denton County JJAEP 5 0 0 0 0 0 0 0 1 0 0 2 0 2 0 5 0
TOTAL ENROLLMENT 7,382 227 558 579 610 588 584 630 594 528 518 672 570 430 436 7,524 142
2017-2018 Enrollment Projections by Grade

Summary
• Little Elm’s unemployment rate is currently below 3%.
• The average and median home sale price have risen by more
than 10% in the last 12 months.
• The district had the most third quarter closings in more than
13 years.
• Nearly half of all annual new home closings fall within
Hackberry Elementary zone due to activity in Rivendale by
the Lake and Hidden Cove.
• LEISD can expect an increase of approximately 930 students
during the next 5 years.
• 2021/22 enrollment projection: 8,316.
• Little Elm ISD is projected to have more than 9,200 students
for the 2026/27 school year.
www.tdemographics.com 20