4q16 little elm ppt updated 141 142 174 141 240 389 162 3q 125 108 132 155 124 211 378 4q 107 110...
TRANSCRIPT

Learn from Yesterday…Understand Today…Plan for Tomorrow
Little ElmIndependentSchool District
Quarterly Report4Q16

Economic Conditions – DFW Area (December 2016)
2
UnemploymentRate
0.2%
112,800 new jobsNational rate 1.5%
Job Growth
3.3%3,350 more
starts than 2015
AnnualHome Starts
29,892
Sources: Texas Workforce Commission & Metrostudy
U.S. 4.5%Texas 4.6%
DFW MSA 3.7%Little Elm 2.5%
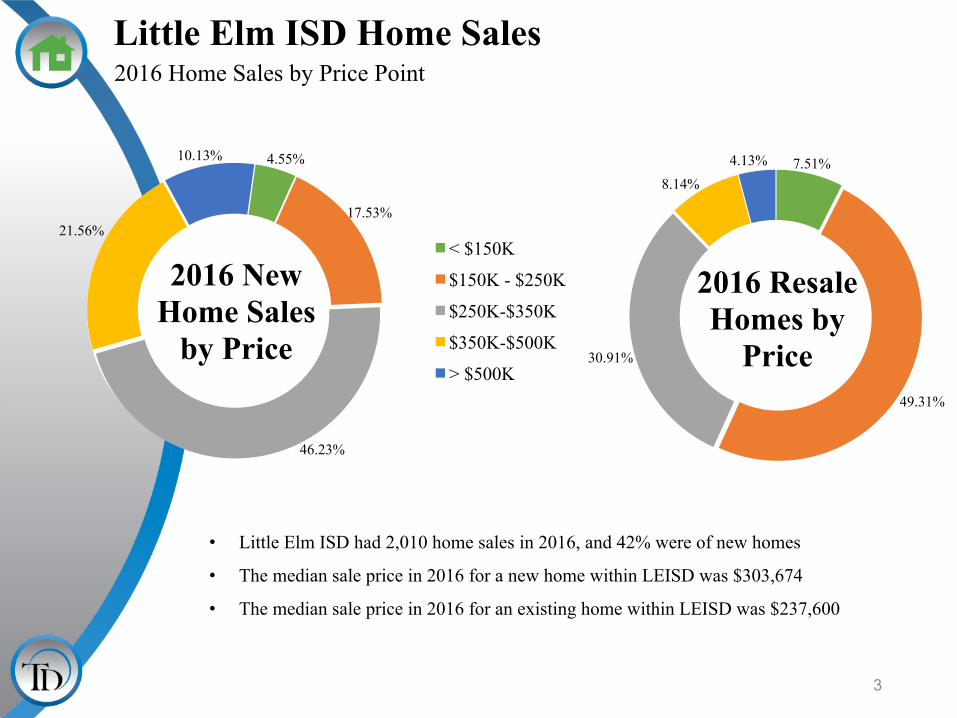
7.51%
49.31%
30.91%
8.14%4.13%
2016 Resale Homes by
Price
4.55%
17.53%
46.23%
21.56%
10.13%
2016 NewHome Sales
by Price
< $150K
$150K - $250K
$250K-$350K
$350K-$500K
> $500K
Little Elm ISD Home Sales
• Little Elm ISD had 2,010 home sales in 2016, and 42% were of new homes
• The median sale price in 2016 for a new home within LEISD was $303,674
• The median sale price in 2016 for an existing home within LEISD was $237,600
2016 Home Sales by Price Point
3

DFW New Home Ranking Report ISD Ranked by Annual Closings – 4Q16
*Adjusted based on additional research by Templeton Demographics staff** This table includes the age restricted community of Frisco Lakes
4Source: Metrostudy
Rank DistrictName AnnualStarts AnnualClosings VDL Future1 FriscoISD 2,639 2,542 3,569 7,9312 DentonISD 1,971 2,103 2,420 17,0333 ProsperISD 2,569 2,050 4,675 27,1424 LewisvilleISD 1,313 1,387 1,468 4,4945 NorthwestISD 1,670 1,282 2,207 21,0916 DallasISD 1,574 1,223 2,233 6,0297 LittleElmISD** 1,006 1,056 1,550 5,032*8 EagleMt.-SaginawISD 768 856 1,277 19,8559 RockwallISD 984 850 1,887 8,11610 KellerISD 778 788 970 1,74611 CrowleyISD 714 783 662 9,71412 McKinneyISD 789 723 1,610 5,96513 MansfieldISD 763 708 898 6,61214 WylieISD 798 707 1,042 4,50015 ForneyISD 688 552 884 14,23216 AllenISD 570 515 1,052 1,59717 CoppellISD 461 483 588 32918 WaxahachieISD 447 477 801 9,81719 PlanoISD 463 453 1,030 2,66020 MidlothianISD 553 445 1,295 19,947
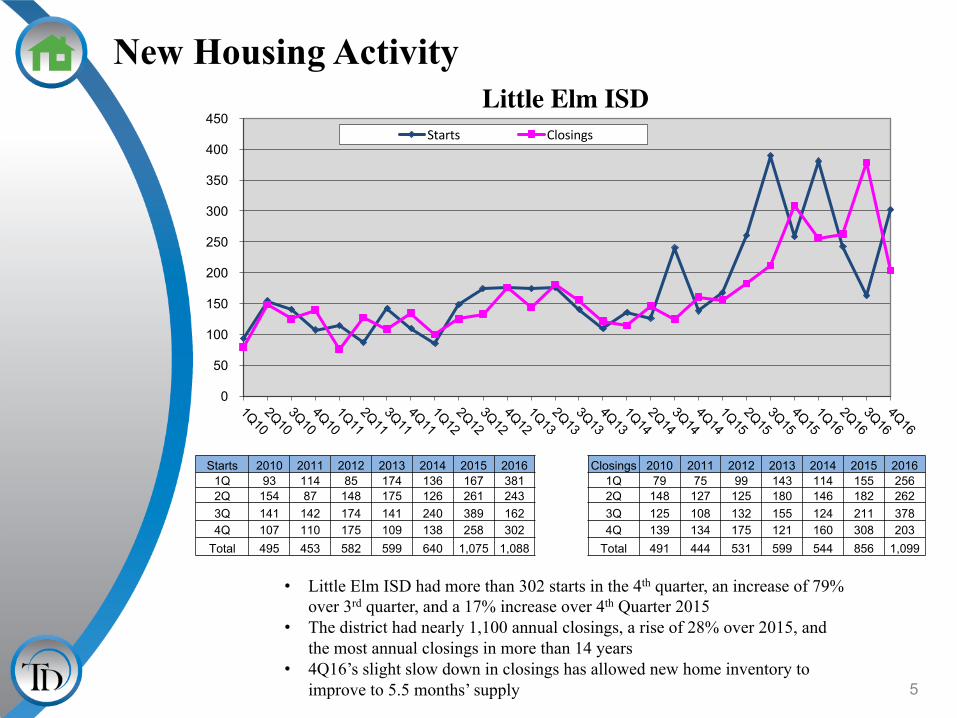
New Housing Activity
• Little Elm ISD had more than 302 starts in the 4th quarter, an increase of 79% over 3rd quarter, and a 17% increase over 4th Quarter 2015
• The district had nearly 1,100 annual closings, a rise of 28% over 2015, and the most annual closings in more than 14 years
• 4Q16’s slight slow down in closings has allowed new home inventory to improve to 5.5 months’ supply 5
Little Elm ISD
0
50
100
150
200
250
300
350
400
450 Starts Closings
Starts 2010 2011 2012 2013 2014 2015 2016 Closings 2010 2011 2012 2013 2014 2015 20161Q 93 114 85 174 136 167 381 1Q 79 75 99 143 114 155 2562Q 154 87 148 175 126 261 243 2Q 148 127 125 180 146 182 2623Q 141 142 174 141 240 389 162 3Q 125 108 132 155 124 211 3784Q 107 110 175 109 138 258 302 4Q 139 134 175 121 160 308 203
Total 495 453 582 599 640 1,075 1,088 Total 491 444 531 599 544 856 1,099
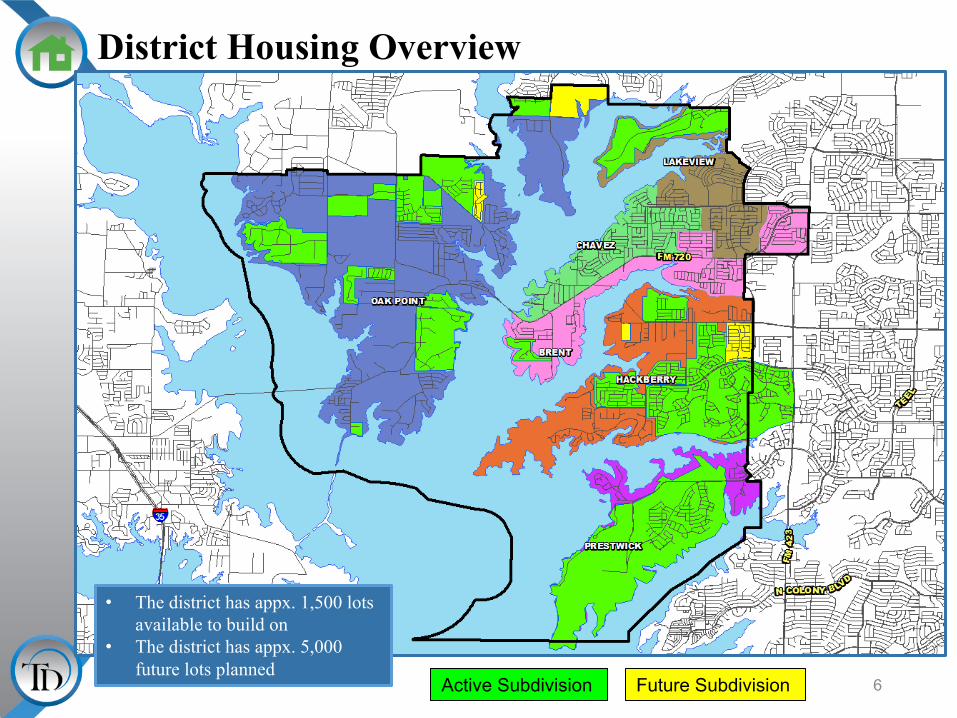
District Housing Overview
6
• The district has appx. 1,500 lots available to build on
• The district has appx. 5,000 future lots planned
Active Subdivision Future Subdivision
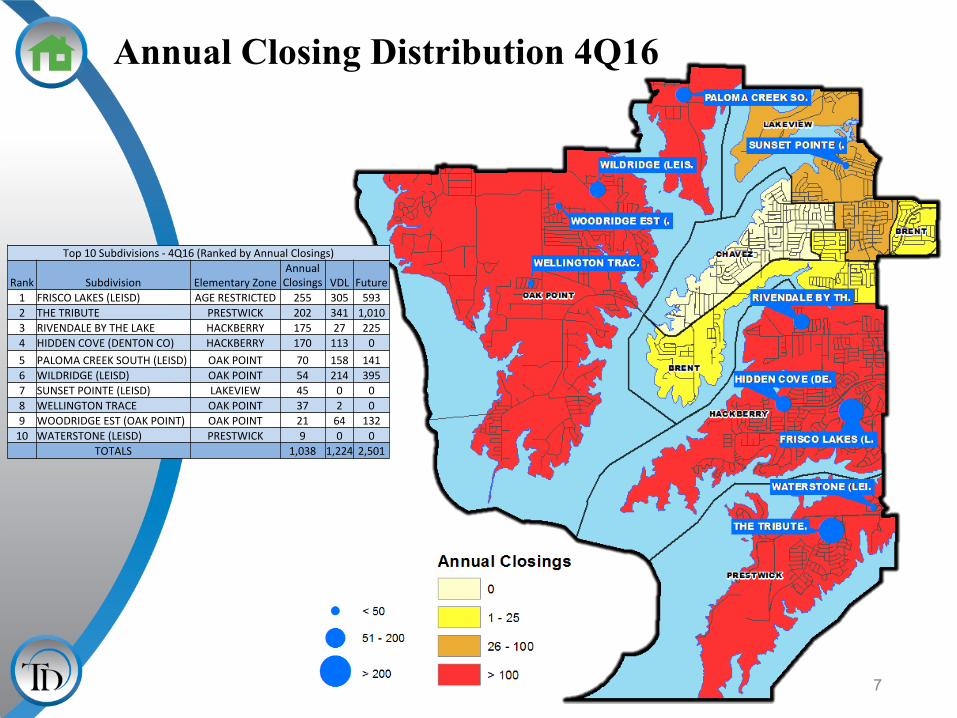
Annual Closing Distribution 4Q16
7
Top10Subdivisions- 4Q16(RankedbyAnnualClosings)
Rank Subdivision ElementaryZoneAnnualClosings VDL Future
1 FRISCOLAKES(LEISD) AGE RESTRICTED 255 305 5932 THETRIBUTE PRESTWICK 202 341 1,0103 RIVENDALEBYTHELAKE HACKBERRY 175 27 2254 HIDDENCOVE(DENTONCO) HACKBERRY 170 113 05 PALOMACREEKSOUTH(LEISD) OAKPOINT 70 158 1416 WILDRIDGE(LEISD) OAKPOINT 54 214 3957 SUNSETPOINTE(LEISD) LAKEVIEW 45 0 08 WELLINGTONTRACE OAKPOINT 37 2 09 WOODRIDGEEST(OAKPOINT) OAKPOINT 21 64 13210 WATERSTONE(LEISD) PRESTWICK 9 0 0
TOTALS 1,038 1,224 2,501

The Tribute• 2,200 total lots
• 793 homes occupied• 1,010 future single family lots• 121 lots delivered November 2016• Groundwork underway on Waterford Point
(400 lots)• marketed to active adults• first 98 lots delivering 2Q17
• 264 lots in various sections delivering 2Q17• 4Q16 housing data
• 124 annual starts• 28 homes under construction• 341 VDL• $400K-$850K
• 400-600 future higher density units• Villas• Townhomes• Condos
• No timeline for development of higher density units at this time
• Prestwick Elementary
Active SubdivisionThe Tribute- City of The Colony
8
Lewisville ISD
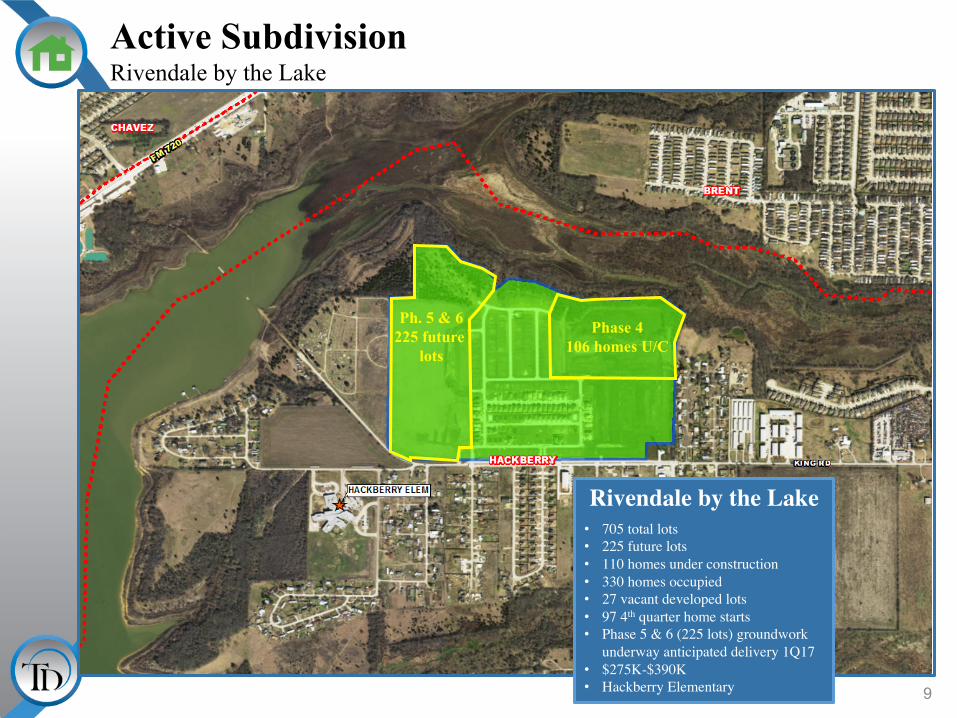
Active Subdivision Rivendale by the Lake
Rivendale by the Lake• 705 total lots • 225 future lots• 110 homes under construction• 330 homes occupied• 27 vacant developed lots• 97 4th quarter home starts• Phase 5 & 6 (225 lots) groundwork
underway anticipated delivery 1Q17• $275K-$390K• Hackberry Elementary 9
Phase 4106 homes U/C
Ph. 5 & 6225 future
lots

Active SubdivisionPaloma Creek South Lakeview
10
Paloma Creek South• 425 total lots• 141 future lots• 111 homes occupied• 158 vacant developed lots• 10 homes under construction• Groundwork underway for Phase 2 in
South Lakeview• Phase 2D1 (157 lots) delivered • Groundwork underway on
remaining 130 lots anticipated delivery summer 2018
• $235K-$320K• Oak Point Elementary
Lakeview Ph. 2D1157 lots
Lakeview Phase 2D2
130 lots
Denton ISD
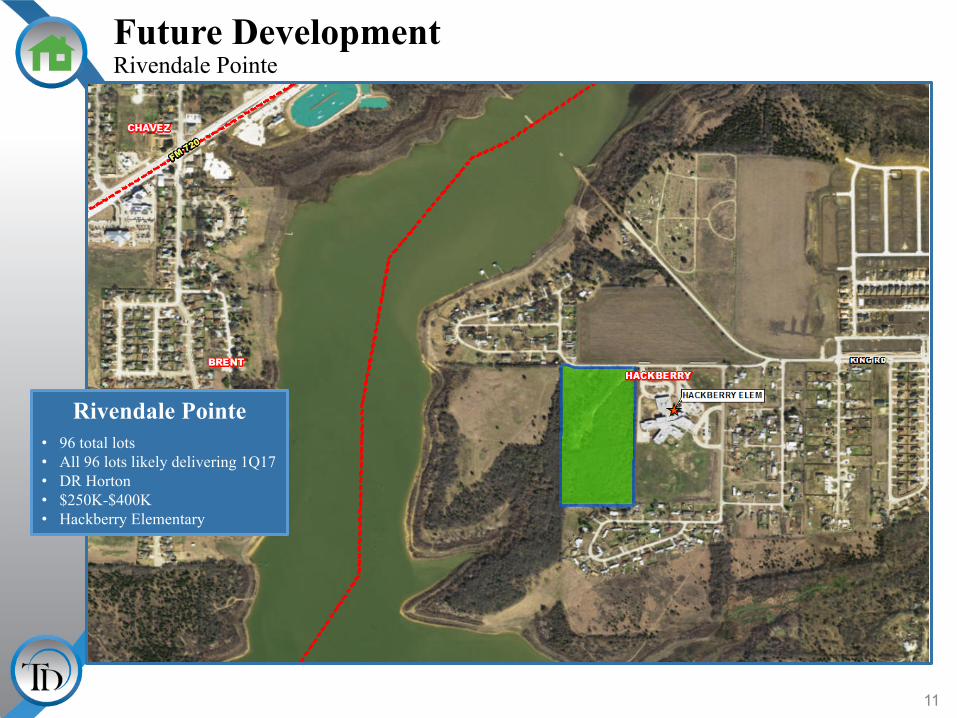
Future DevelopmentRivendale Pointe
11
Rivendale Pointe• 96 total lots• All 96 lots likely delivering 1Q17• DR Horton • $250K-$400K• Hackberry Elementary
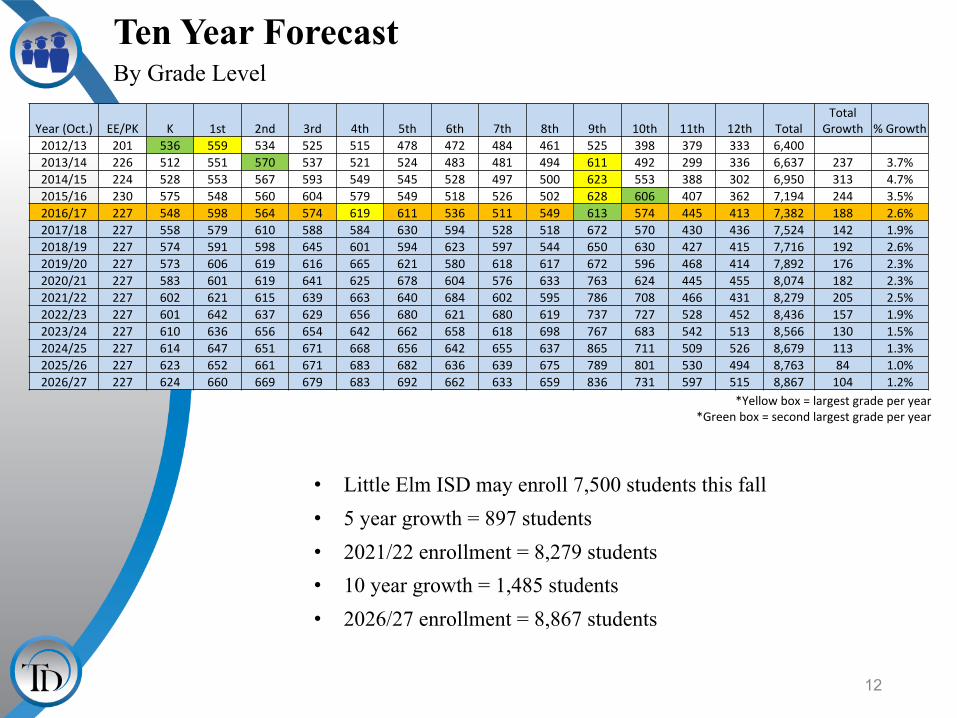
Ten Year ForecastBy Grade Level
*Yellowbox=largestgradeperyear*Greenbox=secondlargestgradeperyear
• Little Elm ISD may enroll 7,500 students this fall• 5 year growth = 897 students• 2021/22 enrollment = 8,279 students• 10 year growth = 1,485 students• 2026/27 enrollment = 8,867 students
12
Year(Oct.) EE/PK K 1st 2nd 3rd 4th 5th 6th 7th 8th 9th 10th 11th 12th TotalTotal
Growth %Growth2012/13 201 536 559 534 525 515 478 472 484 461 525 398 379 333 6,4002013/14 226 512 551 570 537 521 524 483 481 494 611 492 299 336 6,637 237 3.7%2014/15 224 528 553 567 593 549 545 528 497 500 623 553 388 302 6,950 313 4.7%2015/16 230 575 548 560 604 579 549 518 526 502 628 606 407 362 7,194 244 3.5%2016/17 227 548 598 564 574 619 611 536 511 549 613 574 445 413 7,382 188 2.6%2017/18 227 558 579 610 588 584 630 594 528 518 672 570 430 436 7,524 142 1.9%2018/19 227 574 591 598 645 601 594 623 597 544 650 630 427 415 7,716 192 2.6%2019/20 227 573 606 619 616 665 621 580 618 617 672 596 468 414 7,892 176 2.3%2020/21 227 583 601 619 641 625 678 604 576 633 763 624 445 455 8,074 182 2.3%2021/22 227 602 621 615 639 663 640 684 602 595 786 708 466 431 8,279 205 2.5%2022/23 227 601 642 637 629 656 680 621 680 619 737 727 528 452 8,436 157 1.9%2023/24 227 610 636 656 654 642 662 658 618 698 767 683 542 513 8,566 130 1.5%2024/25 227 614 647 651 671 668 656 642 655 637 865 711 509 526 8,679 113 1.3%2025/26 227 623 652 661 671 683 682 636 639 675 789 801 530 494 8,763 84 1.0%2026/27 227 624 660 669 679 683 692 662 633 659 836 731 597 515 8,867 104 1.2%
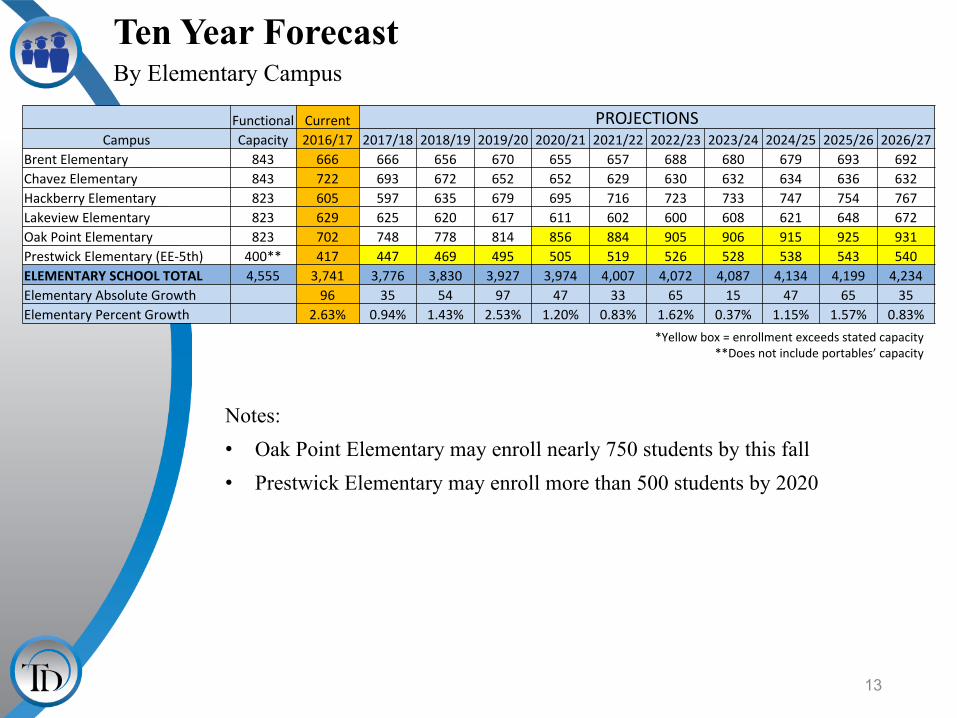
Ten Year ForecastBy Elementary Campus
Notes:• Oak Point Elementary may enroll nearly 750 students by this fall• Prestwick Elementary may enroll more than 500 students by 2020
*Yellowbox=enrollmentexceedsstatedcapacity**Doesnotincludeportables’capacity
13
Functional Current PROJECTIONSCampus Capacity 2016/17 2017/18 2018/19 2019/20 2020/21 2021/22 2022/23 2023/24 2024/25 2025/26 2026/27
BrentElementary 843 666 666 656 670 655 657 688 680 679 693 692ChavezElementary 843 722 693 672 652 652 629 630 632 634 636 632HackberryElementary 823 605 597 635 679 695 716 723 733 747 754 767LakeviewElementary 823 629 625 620 617 611 602 600 608 621 648 672OakPointElementary 823 702 748 778 814 856 884 905 906 915 925 931PrestwickElementary(EE-5th) 400** 417 447 469 495 505 519 526 528 538 543 540ELEMENTARYSCHOOLTOTAL 4,555 3,741 3,776 3,830 3,927 3,974 4,007 4,072 4,087 4,134 4,199 4,234ElementaryAbsoluteGrowth 96 35 54 97 47 33 65 15 47 65 35ElementaryPercentGrowth 2.63% 0.94% 1.43% 2.53% 1.20% 0.83% 1.62% 0.37% 1.15% 1.57% 0.83%
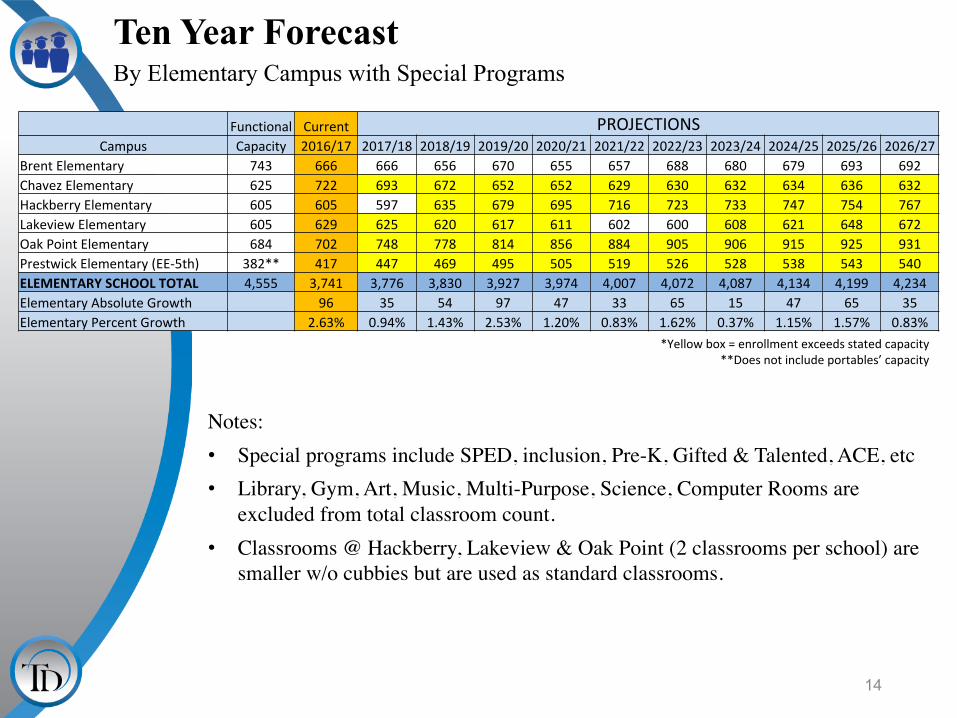
Ten Year Forecast
14
By Elementary Campus with Special Programs
Functional Current PROJECTIONSCampus Capacity 2016/17 2017/18 2018/19 2019/20 2020/21 2021/22 2022/23 2023/24 2024/25 2025/26 2026/27
BrentElementary 743 666 666 656 670 655 657 688 680 679 693 692ChavezElementary 625 722 693 672 652 652 629 630 632 634 636 632HackberryElementary 605 605 597 635 679 695 716 723 733 747 754 767LakeviewElementary 605 629 625 620 617 611 602 600 608 621 648 672OakPointElementary 684 702 748 778 814 856 884 905 906 915 925 931PrestwickElementary(EE-5th) 382** 417 447 469 495 505 519 526 528 538 543 540ELEMENTARYSCHOOLTOTAL 4,555 3,741 3,776 3,830 3,927 3,974 4,007 4,072 4,087 4,134 4,199 4,234ElementaryAbsoluteGrowth 96 35 54 97 47 33 65 15 47 65 35ElementaryPercentGrowth 2.63% 0.94% 1.43% 2.53% 1.20% 0.83% 1.62% 0.37% 1.15% 1.57% 0.83%
*Yellowbox=enrollmentexceedsstatedcapacity**Doesnotincludeportables’capacity
Notes:• Special programs include SPED, inclusion, Pre-K, Gifted & Talented, ACE, etc• Library, Gym, Art, Music, Multi-Purpose, Science, Computer Rooms are
excluded from total classroom count. • Classrooms @ Hackberry, Lakeview & Oak Point (2 classrooms per school) are
smaller w/o cubbies but are used as standard classrooms.

Ten Year ForecastBy Middle School & High School Campus
Notes:• Lakeside Middle School could enroll more than 1,400 students by 2018• Little Elm High School currently enrolls more than 2,000 students, and
could reach 2,100 students this fall
15
*Yellowbox=enrollmentexceedsstatedcapacity
Functional Current PROJECTIONSCampus Capacity 2016/17 2017/18 2018/19 2019/20 2020/21 2021/22 2022/23 2023/24 2024/25 2025/26 2026/27
PrestwickJuniorHigh(6th-8th) 432 340 341 344 338 341 351 347 334 319 317 322LakesideMiddleSchool 1,512 1,255 1,298 1,419 1,476 1,471 1,529 1,572 1,639 1,614 1,632 1,631MIDDLESCHOOLTOTAL 1,595 1,639 1,763 1,814 1,812 1,880 1,919 1,973 1,933 1,949 1,953MiddleSchoolAbsoluteGrowth 52 44 124 51 -2 68 39 54 -40 16 4MiddleSchoolPercentGrowth 3.37% 2.76% 7.57% 2.89% -0.11% 3.75% 2.07% 2.81% -2.03% 0.83% 0.21%LittleElmHighSchool 2,500 2,041 2,104 2,118 2,146 2,283 2,387 2,440 2,501 2,607 2,610 2,675DentonCountyJJAEP 5 5 5 5 5 5 5 5 5 5 5HIGHSCHOOLTOTAL 2,046 2,109 2,123 2,151 2,288 2,392 2,445 2,506 2,612 2,615 2,680HighSchoolAbsoluteGrowth 40 63 14 28 137 104 53 61 106 3 65HighSchoolPercentGrowth 1.99% 3.08% 0.66% 1.32% 6.37% 4.55% 2.22% 2.49% 4.23% 0.11% 2.49%
DISTRICTTOTAL 7,382 7,524 7,716 7,892 8,074 8,279 8,436 8,566 8,679 8,763 8,867DistrictAbsoluteGrowth 188 142 192 176 182 205 157 130 113 84 104DistrictPercentGrowth 2.61% 1.92% 2.55% 2.28% 2.31% 2.54% 1.90% 1.54% 1.32% 0.97% 1.19%
Summary
• Little Elm’s unemployment rate is currently below 3%.
• In 2016, the median new home sale price was more than $300,000 within Little Elm ISD.
• The district had nearly 1,100 annual closings, a rise of 28% over 2015, and the most annual closings in more than 14 years.
• Rivendale by the Lake in Hackberry Elementary started 97 homes in the 4th quarter of 2016.
• LEISD can expect an increase of approximately 900 students during the next 5 years.
• 2021/22 enrollment projection: 8,279.
• Little Elm ISD is projected to have nearly 8,900 students for the 2026/27 school year.
www.tdemographics.com16