lirr operations
TRANSCRIPT

7/29/2019 LIRR Operations
http://slidepdf.com/reader/full/lirr-operations 1/12
LONG ISLAND RAIL ROAD
Helena E. Williams
President
09/16/13 *****
August 2013

7/29/2019 LIRR Operations
http://slidepdf.com/reader/full/lirr-operations 2/12
OPERATING REPORT
FOR MONTH OF AUGUST 2013
Performance Summary Annual YTD thru YTD thru
* * * Goal August August August AugustOn Time Performance System Overall 95.1% 91.9% 93.4% 93.6% 94.9%
(Trains that arrive at AM Peak 84.3% 92.2% 96.4% 94.8%their final destination PM Peak 93.1% 90.2% 89.6% 92.0%within 5 minutes 59 seconds Total Peak 88.5% 91.2% 93.3% 93.5%
of scheduled arrival time) Off Peak Weekday 93.3% 93.9% 92.9% 95.0%Weekend 93.3% 95.0% 96.2% 96.3%
Babylon Branch Overall 95.1% 90.8% 92.8% 93.2% 94.5%
AM Peak 83.7% 91.6% 97.4% 96.1%PM Peak 93.9% 89.6% 88.1% 91.4%
Total Peak 88.2% 90.7% 93.2% 94.0%
Off Peak Weekday 92.7% 93.6% 91.7% 94.1%Weekend 90.2% 94.5% 97.6% 96.4%
Far Rockaway Branch Overall 95.1% 96.0% 96.5% 96.1% 97.4%
AM Peak 84.7% 92.3% 95.7% 95.3%PM Peak 97.5% 92.8% 93.2% 94.7%
Total Peak 90.5% 92.5% 94.6% 95.0%
Off Peak Weekday 98.3% 97.3% 96.3% 98.1%
Weekend 96.8% 98.6% 97.5% 98.5%Huntington Branch Overall 95.1% 92.2% 92.4% 93.6% 94.6%
AM Peak 87.0% 92.9% 98.0% 94.5%PM Peak 89.6% 88.3% 87.3% 89.1%
Total Peak 88.2% 90.7% 92.8% 91.9%
Off Peak Weekday 93.0% 91.7% 91.1% 94.7%Weekend 94.6% 94.8% 98.4% 96.7%
Hempstead Branch Overall 95.1% 95.1% 96.4% 96.4% 97.4%
AM Peak 88.2% 95.0% 97.0% 96.7%PM Peak 96.0% 93.8% 91.3% 94.4%
Total Peak 91.9% 94.4% 94.3% 95.6%
Off Peak Weekday 96.0% 96.7% 97.4% 97.9%Weekend 96.4% 97.7% 96.3% 98.0%
Long Beach Branch Overall 95.1% 93.4% 95.0% 96.0% 96.6%
AM Peak 84.9% 92.7% 95.3% 96.2%PM Peak 95.0% 93.5% 93.0% 94.2%
August 2013 Total Peak 89.7% 93.1% 94.2% 95.3%
Off Peak Weekday 94.4% 94.9% 96.5% 96.9%
Weekend 95.7% 97.6% 97.2% 97.3%Montauk Branch Overall 95.1% 87.8% 90.4% 85.6% 90.7%
AM Peak 87.5% 92.1% 89.1% 93.1%PM Peak 89.8% 87.5% 79.7% 86.0%
Total Peak 88.7% 89.9% 85.0% 90.0%
Off Peak Weekday 90.1% 92.9% 86.0% 91.5%6-Nov-13 Weekend 83.0% 86.3% 85.3% 89.8%
Oyster Bay Branch Overall 95.1% 92.1% 92.8% 96.1% 95.4%
AM Peak 86.4% 94.1% 98.1% 95.7%PM Peak 86.4% 87.1% 92.0% 91.3%
Total Peak 86.4% 90.9% 95.3% 93.7%
Off Peak Weekday 95.0% 93.1% 95.3% 95.3%Weekend 93.3% 95.0% 100.0% 98.3%
2013 Data 2012 Data

7/29/2019 LIRR Operations
http://slidepdf.com/reader/full/lirr-operations 3/12
OPERATING REPORT
FOR MONTH OF AUGUST 2013
Performance Summary Annual YTD thru YTD thru
* * * Goal August August August August
2013 Data 2012 Data
Port Jefferson Branch Overall 95.1% 91.5% 90.9% 89.3% 91.8%AM Peak 82.4% 90.4% 93.5% 92.0%PM Peak 90.3% 86.2% 90.7% 88.2%
Total Peak 86.1% 88.4% 92.2% 90.2%
Off Peak Weekday 91.5% 90.3% 85.3% 90.2%
Weekend 98.8% 95.7% 94.8% 97.0%Port Washington Branch Overall 95.1% 90.8% 94.1% 94.8% 95.9%
AM Peak 80.7% 90.8% 96.9% 94.5%PM Peak 93.3% 90.5% 92.0% 94.3%
Total Peak 87.3% 90.7% 94.4% 94.4%
Off Peak Weekday 91.0% 95.0% 94.3% 96.2%Weekend 96.1% 97.1% 98.0% 98.0%
Ronkonkoma Branch Overall 95.1% 90.1% 91.2% 92.6% 92.5%
AM Peak 81.5% 91.2% 97.6% 92.0%PM Peak 94.9% 91.4% 89.1% 92.7%
Total Peak 87.7% 91.3% 93.9% 92.3%
Off Peak Weekday 91.0% 90.7% 90.8% 92.4%Weekend 91.8% 92.3% 95.0% 93.0%
West Hempstead Branch Overall 95.1% 94.4% 95.4% 95.4% 96.9%
AM Peak 88.2% 94.6% 97.4% 96.7%PM Peak 93.9% 90.2% 89.1% 92.8%
Total Peak 91.3% 92.2% 92.9% 94.6%
Off Peak Weekday 96.1% 97.3% 96.8% 98.3%Weekend 100.0% 97.3% 100.0% 100.0%
Operating Statistics Trains Scheduled 20,699 159,118 20,726 157,926
Avg. Delay per Late Train (min) -15.2 -13.3 -11.9 -12.9excluding trains canceled or terminated
Trains Over 15 min. Late 439 1,995 235 1,590 excluding trains canceled or terminated
Trains Canceled 78 748 24 313Trains Terminated 42 431 28 239
Percent of Scheduled Trips Comp leted 99.4% 99.3% 99.7% 99.7%
Consist Compliance System Overall
(Percent of trains where the AM Peak 99.2%number of seats provided PM Peak 99.5%was greater than or equal Total Peak 99.3%
to the required number of Off Peak
seats per loading standards) Weekend

7/29/2019 LIRR Operations
http://slidepdf.com/reader/full/lirr-operations 4/12
OPERATING REPORT
FOR MONTH OF AUGUST 2013
Categori es Of Delay J uly August
YTD ThruAugust August
YTD ThruAugust
YTD 2012Vs 2013
Late Train Incidents National Rail Passenger Corp 332 361 1,619 11 511 1,108
Capital Programs 42 24 131 23 96 35
Engineering 123 118 1,227 138 1,008 219
Penn Station Central Control 20 43 154 8 71 83
Maintenance of Equipment 137 245 1,151 143 1,158 (7)
** Other / Miscellaneous 192 96 2,056 343 1,454 602
Public 470 624 3,455 553 3,286 169
Transportation 44 45 406 76 362 44
Vandalism 3 97 143 3 73 70
Maintenance of Way (Sched.) 17 24 187 20 87 100
** Other / Miscellaneous includes weather related delays
2012 Data2013 Data

7/29/2019 LIRR Operations
http://slidepdf.com/reader/full/lirr-operations 5/12
OPERATING REPO
FOR MONTH OF AUGUST 20
EVENTS RESULTING IN 10 or MORE LATE (L), CANCELED (C) OR TERMINATED (T) TRAINS
Date Day DESCRIPTION OF EVENT L C T L C T L C T Late Cxld T
8/1 Thu Broken crossing protection east of New Hyde Park 12 12
8/5 Mon Amtrak requiring extension on track work program in Line 4 73 3 5 21 94 3
8/6 Tues Amtrak related track condition in Line 2 49 5 16 65
8/9 Fri Train 2009 struck unauthorized pedestrian west of Brentwood 15 9 1 8 3 23 9
8/9 Fri Loss of third rail power at Jamaica 6 2 4 10 2
8/11 Sun LIPA power outage in Valley Stream 10 2 10 2
8/15 Th ur s Train 1001 disabled in Jay Interlocking 83 3 2 20 1 103 4
8/16 Fri Track circuit failure in Hunt Interlocking 8 16 24
8/18 SunTrain 8055 struck unauthorized pedestrian west of New Hyde
Park28 5 3 28 5
8/19 Mon Amtrak related third rail damage in Line 4 67 8 6 56 2 123 10
8/22 Thu Amtrak related track circuit failure in JO Interlocking 10 3 3 13 3
8/23 Fri Track circuit failure west of Wood Interlocking due to vandalism 40 2 42 2 82 4
8/23 FriPolice assistance at Woodside due to suspicious people on Tr.
24014 6 4
8/24 Sat Customer with fatal medical condition at Bellmore Station 25 10 2 25 10
8/25 Sun Heavy Loading 10 10
8/26 Mon NYAR struck an unauthorized person in Hicksville Station 6 1 4 3 10 1
8/26 Mon Crossing protection not functioning east of Bethpage 18 18
8/27 Tu es Train 605 disabled in Line 4 7 8 15
8/27 Tu es Track circuit failure at New Hyde Park 11 1 12
8/29 Th ur s Amtrak related track circuit failure in C Interlocking 8 1 4 13
8/29 Th ur s Heavy loading due to US Open 1 2 8 11
8/30 Fri Train 2714 with equipment trouble in Harold Interlocking 13 2 1 14 2
TOTAL FOR MONTH 377 28 25 57 5 0 285 22 11 719 55
AM Peak PM Peak Off Peak TOTAL
810

7/29/2019 LIRR Operations
http://slidepdf.com/reader/full/lirr-operations 6/12
OPERATING REPORT
FOR MONTH OF AUGUST 2013
MEAN DISTANCE BETWEEN FAILURES
J uly YTD 12 month J uly YTD
Equip- Total MDBF J uly No. of MDBF thru MDBF J uly No. of MDBF thru
ment Fleet Goal MDBF Primary J uly Rolling Avg MDBF Primary J uly
Type Size (miles) (miles) Failures (miles) (miles) (miles) Failures (miles)
Mean M-3 152 55,000 116,825 5 96,602 92,449 55,465 10 71,389
Distance M-7 836 350,000 637,252 8 456,396 424,092 375,624 13 421,934
Between DM 21 18,000 16,504 5 23,928 25,988 19,100 4 27,582
Failures DE 24 18,000 10,138 9 17,372 21,867 18,465 5 17,283
C-3 134 75,000 105,983 7 102,808 104,337 98,409 7 105,392
Diesel 179 45,000 43,602 21 56,414 62,144 53,599 16 58,188
Fleet 970 152,000 194,053 34 201,581 202,540 161,419 39 188,374
Mean Distance Between Failures (MDBF) is the average number of miles a railcar or locomotive travels
before breaking down and causing a delay. The higher the MDBF, the more reliable
the equipment and the service.
ALL FLEETS
Mean Distance Between Failure
Long Island Rail Road
2013 Data 2012 Data
2008 - 2013
-
50
100
150
200
250 Thousands
-
50
100
150
200
250
300 Thousands
MDBF Monthly MDBF Target 12 Month MDBF

7/29/2019 LIRR Operations
http://slidepdf.com/reader/full/lirr-operations 7/12
OPERATING REPORT
FOR MONTH OF AUGUST 2013Standee Report
2013 Data
East Of Jamaica August AM Peak PM Peak
Daily Babylon Branch Program Standees 0 0
Average Add'l Standees 1 2Total Standees 1 2
Far Rockaway Branch Program Standees 0 0 Add'l Standees 0 0
Total Standees 0 0
Huntington Branch Program Standees 0 0
Add'l Standees 1 0
Total Standees 1 0
Hempstead Branch Program Standees 0 0 Add'l Standees 2 0
Total Standees 2 0
Long Beach Branch Program Standees 0 0
Add'l Standees 4 0
Total Standees 4 0
Montauk Branch Program Standees 0 0
Add'l Standees 7 0
Total Standees 7 0
Oyster Bay Branch Program Standees 0 0 Add'l Standees 31 0
Total Standees 31 0
Port Jefferson Branch Program Standees 0 0
Add'l Standees 0 0
Total Standees 0 0Port Washington Branch Program Standees 8 0
Add'l Standees 6 0
Total Standees 14 0
Ronkonkoma Branch Program Standees 0 38 Add'l Standees 2 16
Total Standees 2 54
West Hempstead Branch Program Standees 0 0
Add'l Standees 0 0
Total Standees 0 0
August 2013 System Wide PEAK 64 56
Definitions
Holidays and Special Events for which there are special equipment programs are not included.
Weekday standees are calculated based on the most recent average weekday customer counts
"Program Standees" is the average number of customers in excess of programmed seating capacity.
" Addit ional Standees" reflect the impact of reduced train car consists (as reported in the weekday equipment reports).
Note: These statistics do not include the effects of daily ridership variation or uneven distribution of customers within trains.
7/29/2019 LIRR Operations
http://slidepdf.com/reader/full/lirr-operations 8/12
OPERATING REPORT
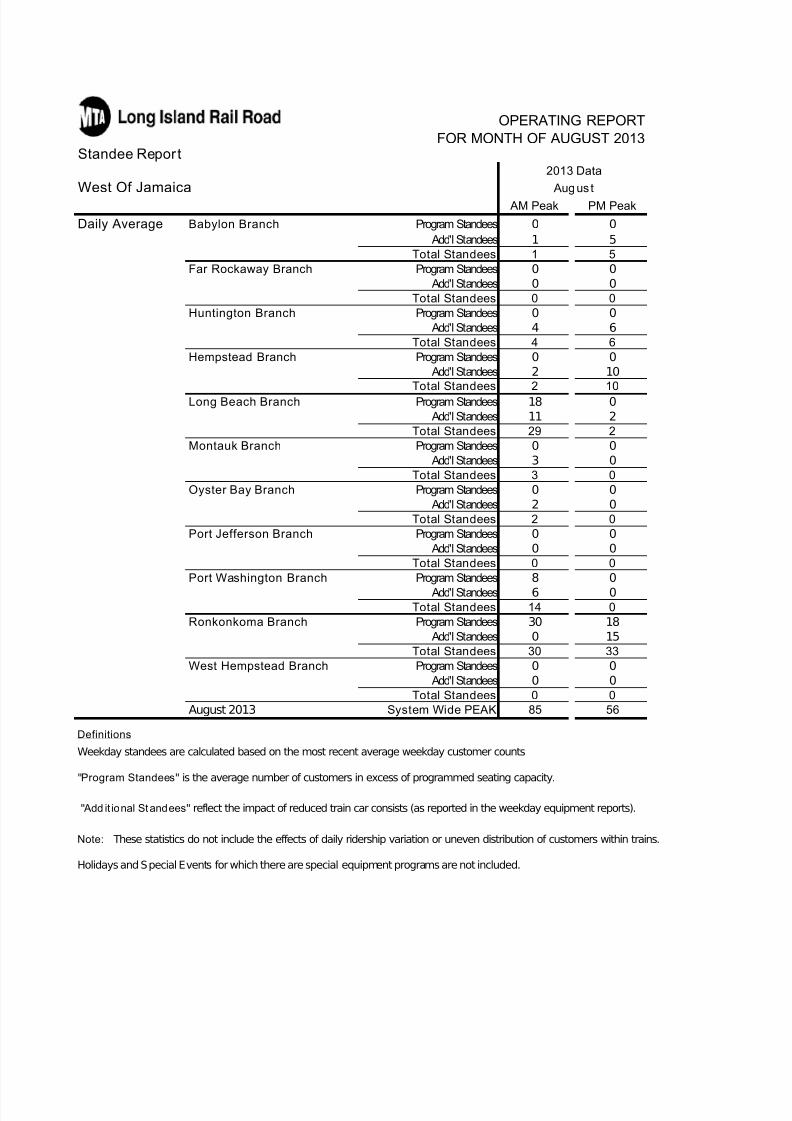
FOR MONTH OF AUGUST 2013Standee Report
2013 Data
West Of Jamaica August
AM Peak PM Peak
Daily Average Babylon Branch Program Standees 0 0
Add'l Standees 1 5Total Standees 1 5
Far Rockaway Branch Program Standees 0 0 Add'l Standees 0 0
Total Standees 0 0
Huntington Branch Program Standees 0 0
Add'l Standees 4 6
Total Standees 4 6
Hempstead Branch Program Standees 0 0 Add'l Standees 2 10
Total Standees 2 10
Long Beach Branch Program Standees 18 0
Add'l Standees 11 2
Total Standees 29 2
Montauk Branch Program Standees 0 0
Add'l Standees 3 0
Total Standees 3 0
Oyster Bay Branch Program Standees 0 0 Add'l Standees 2 0
Total Standees 2 0
Port Jefferson Branch Program Standees 0 0
Add'l Standees 0 0
Total Standees 0 0
Port Washington Branch Program Standees 8 0
Add'l Standees 6 0 Total Standees 14 0
Ronkonkoma Branch Program Standees 30 18 Add'l Standees 0 15
Total Standees 30 33
West Hempstead Branch Program Standees 0 0
Add'l Standees 0 0
Total Standees 0 0
August 2013 System Wide PEAK 85 56
Definitions
Holidays and Special Events for which there are special equipment programs are not included.
Weekday standees are calculated based on the most recent average weekday customer counts
"Program Standees" is the average number of customers in excess of programmed seating capacity.
" Add it ional Standees" reflect the impact of reduced train car consists (as reported in the weekday equipment reports).
Note: These statistics do not include the effects of daily ridership variation or uneven distribution of customers within trains.

7/29/2019 LIRR Operations
http://slidepdf.com/reader/full/lirr-operations 9/12
OPERATING REPORT
FOR MONTH OF AUGUST 2013
16.4%
Year Total
2009 114 2010 113 2011 120 2012 106 2013 134
28.0%
* Federal Railroad Administration Frequency Index
August 2013
MTA Long Island Rail Road
Summary of Employee Injuries thru July
Total Employee Injuries
Year Total
2013
Employee FRA Reportable Injuries
FRA FI*
2.853.25
% change from last year:
2.70
3.612.82
% change from last year:
2012 140
163
2009 1702010 1752011 189
170 175189
140
163
0
50
100
150
200
2009 2010 2011 2012 2013
2.702.85
3.25
2.82
3.61
0.00
1.00
2.00
3.00
4.00
2009 2010 2011 2012 2013

7/29/2019 LIRR Operations
http://slidepdf.com/reader/full/lirr-operations 10/12
OPERATING REPORT
FOR MONTH OF AUGUST 2013
Employee Reportable Accidents
Comparison by Department
Department 2012 2013%
Change
Engineering 32 50 56%
Equipment 22 27 23%
Transportation 40 38 -5%
Pass Serv 7 8 14%
MPA 5 11 120%
Year LT RD LT FI* RD FI*LT&RD
FI*2009 98 1 2.32 0.02 2.342010 100 2 2.47 0.05 2.522011 105 2 2.84 0.06 2.902012 93 0 2.48 0.00 2.482013 118 0 3.18 0.00 3.18
28.2%
* - Injuries per 200,000 hours worked
Employee Lost Time and Restricted Duty Injuries
% change from last year:
MTA Long Island Rail Road
Summary of Employee Injur ies thru July
2.34 2.52
2.90
2.48
3.18
0.00
0.50
1.00
1.50
2.00
2.50
3.00
3.50
2009 2010 2011 2012 2013
32
22
40
75
50
27
38
811
0
10
20
30
40
50
60
Eng Eqp Trans Pass Srv MPA
2012 2013

7/29/2019 LIRR Operations
http://slidepdf.com/reader/full/lirr-operations 11/12
OPERATING REPOR
FOR MONTH OF AUGUST 201
MTA Long Island Rail Road
Total Customer Injuries
Year Total FI*
2009 288 5.96
2010 269 5.692011 279 6.022012 313 6.462013 258 5.37
% change from last year: -16.9%
YearSlip Trip
FallGap Train Doors Escalators Assaul
2012 171 27 30 21 10
2013 138 30 20 24 20
*- Injuries per 1,000,000 rides
Summary of Customer Injuries thru July
Top 5 Customer Injuries by Type
5.965.69
6.026.46
5.37
0.00
1.00
2.00
3.00
4.00
5.00
6.00
7.00
2009 2010 2011 2012 2013
171
27 3021
10
138
3020 24 20
0
20
40
60
80
100
120140
160
180
Slip TripFall
Gap Train Doors Escalators Assaults
2012 2013

7/29/2019 LIRR Operations
http://slidepdf.com/reader/full/lirr-operations 12/12
OPERATING REPORT
FOR MONTH OF AUGUST 2013
MTA Long Island Rail Road
Year Total FRA Rpt.
2012 11 11
2013 4 4
% change from last year: -63.6%
Year Non-Reportable Reportable
2009 18
2010 10
2011 12
2012 13
2013 8
T.R.A.C.K.S. Participants Together Railroads and Communities Keeping Safe
Total Participants
Year
2009
August 2013 2010201120122013
`
6-Nov-13
Total
65,748
49,049 41,868 62,124 56,456
15
8
13
Summary of Contractor Injuries, Train Accidents & T.R.A.C.K.S.
thru July
Contractor Injuries
16
5
Train Accidents
65,748
49,049
41,868
62,124
56,456
0
10,000
20,000
30,000
40,000
50,000
60,000
70,000
2009 20010 2011 2012 2013
11
4
11
4
-
2
4
6
8
10
12
Total FRA
18
10 12 13 8
16
5
158
13
34
15
27
21 21
05
10
15
20
25
30
35
40
45
50
Reportable
Accountable