lipsticks - flong is a collection of macrophotographs of ... shahee ilyas shaheeilyas ......
TRANSCRIPT
Lipsticks
Stacy Greene www.stacygreene.com
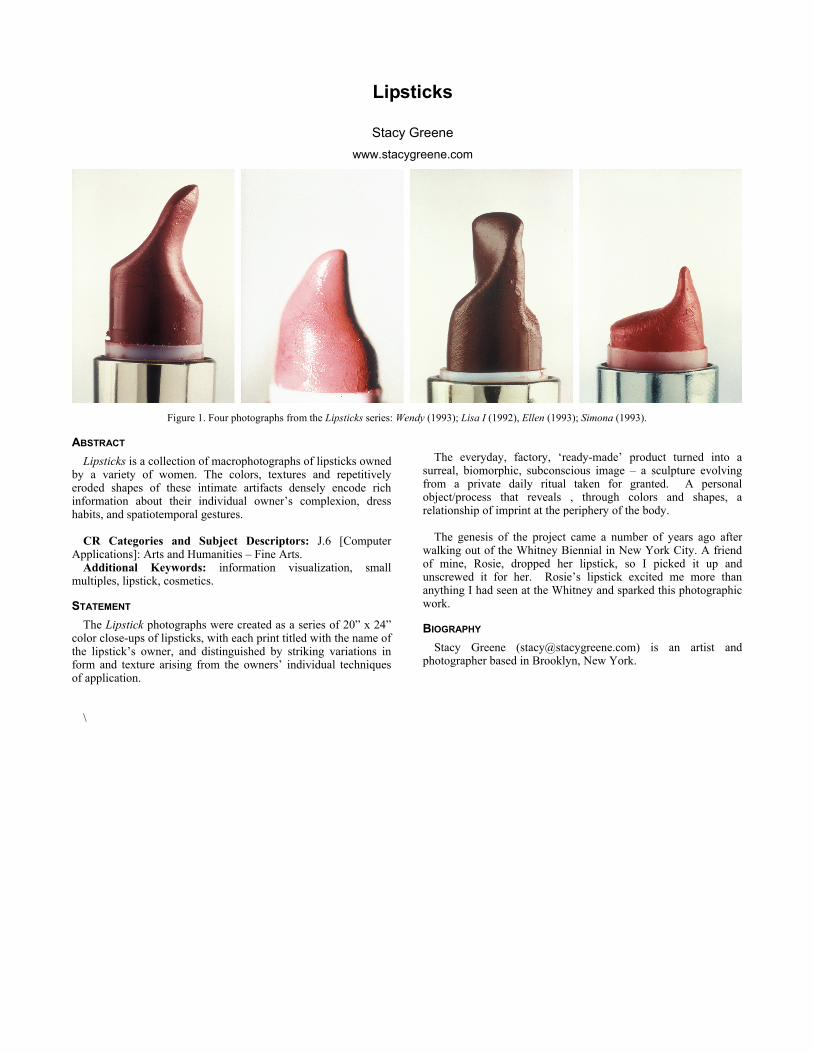
Figure 1. Four photographs from the Lipsticks series: Wendy (1993); Lisa I (1992), Ellen (1993); Simona (1993).
ABSTRACT Lipsticks is a collection of macrophotographs of lipsticks owned
by a variety of women. The colors, textures and repetitively eroded shapes of these intimate artifacts densely encode rich information about their individual owner’s complexion, dress habits, and spatiotemporal gestures.
CR Categories and Subject Descriptors: J.6 [Computer
Applications]: Arts and Humanities – Fine Arts. Additional Keywords: information visualization, small
multiples, lipstick, cosmetics.
STATEMENT The Lipstick photographs were created as a series of 20” x 24”
color close-ups of lipsticks, with each print titled with the name of the lipstick’s owner, and distinguished by striking variations in form and texture arising from the owners’ individual techniques of application.
\
The everyday, factory, ‘ready-made’ product turned into a
surreal, biomorphic, subconscious image – a sculpture evolving from a private daily ritual taken for granted. A personal object/process that reveals , through colors and shapes, a relationship of imprint at the periphery of the body.
The genesis of the project came a number of years ago after
walking out of the Whitney Biennial in New York City. A friend of mine, Rosie, dropped her lipstick, so I picked it up and unscrewed it for her. Rosie’s lipstick excited me more than anything I had seen at the Whitney and sparked this photographic work.
BIOGRAPHY Stacy Greene ([email protected]) is an artist and
photographer based in Brooklyn, New York.
We Feel Fine:
An Exploration of Human Emotion in Six Movements
Jonathan Harris and Sepandar Kamvar wefeelfine.org
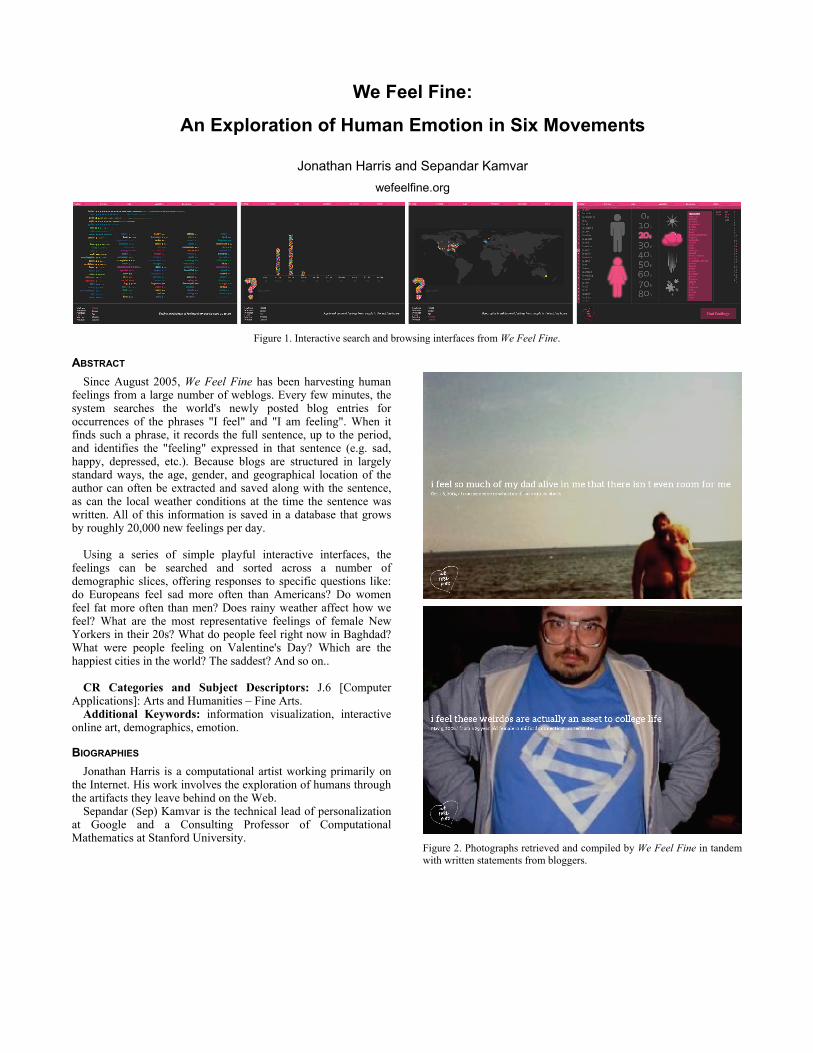
Figure 1. Interactive search and browsing interfaces from We Feel Fine.
ABSTRACT Since August 2005, We Feel Fine has been harvesting human
feelings from a large number of weblogs. Every few minutes, the system searches the world's newly posted blog entries for occurrences of the phrases "I feel" and "I am feeling". When it finds such a phrase, it records the full sentence, up to the period, and identifies the "feeling" expressed in that sentence (e.g. sad, happy, depressed, etc.). Because blogs are structured in largely standard ways, the age, gender, and geographical location of the author can often be extracted and saved along with the sentence, as can the local weather conditions at the time the sentence was written. All of this information is saved in a database that grows by roughly 20,000 new feelings per day.
Using a series of simple playful interactive interfaces, the
feelings can be searched and sorted across a number of demographic slices, offering responses to specific questions like: do Europeans feel sad more often than Americans? Do women feel fat more often than men? Does rainy weather affect how we feel? What are the most representative feelings of female New Yorkers in their 20s? What do people feel right now in Baghdad? What were people feeling on Valentine's Day? Which are the happiest cities in the world? The saddest? And so on..
CR Categories and Subject Descriptors: J.6 [Computer
Applications]: Arts and Humanities – Fine Arts. Additional Keywords: information visualization, interactive
online art, demographics, emotion.
BIOGRAPHIES Jonathan Harris is a computational artist working primarily on
the Internet. His work involves the exploration of humans through the artifacts they leave behind on the Web.
Sepandar (Sep) Kamvar is the technical lead of personalization at Google and a Consulting Professor of Computational Mathematics at Stanford University.
Figure 2. Photographs retrieved and compiled by We Feel Fine in tandem with written statements from bloggers.
Flags by Colours
Shahee Ilyas shaheeilyas.com
Figure 1.Flags by colours.
ABSTRACT Using a list of countries generated by The World Factbook
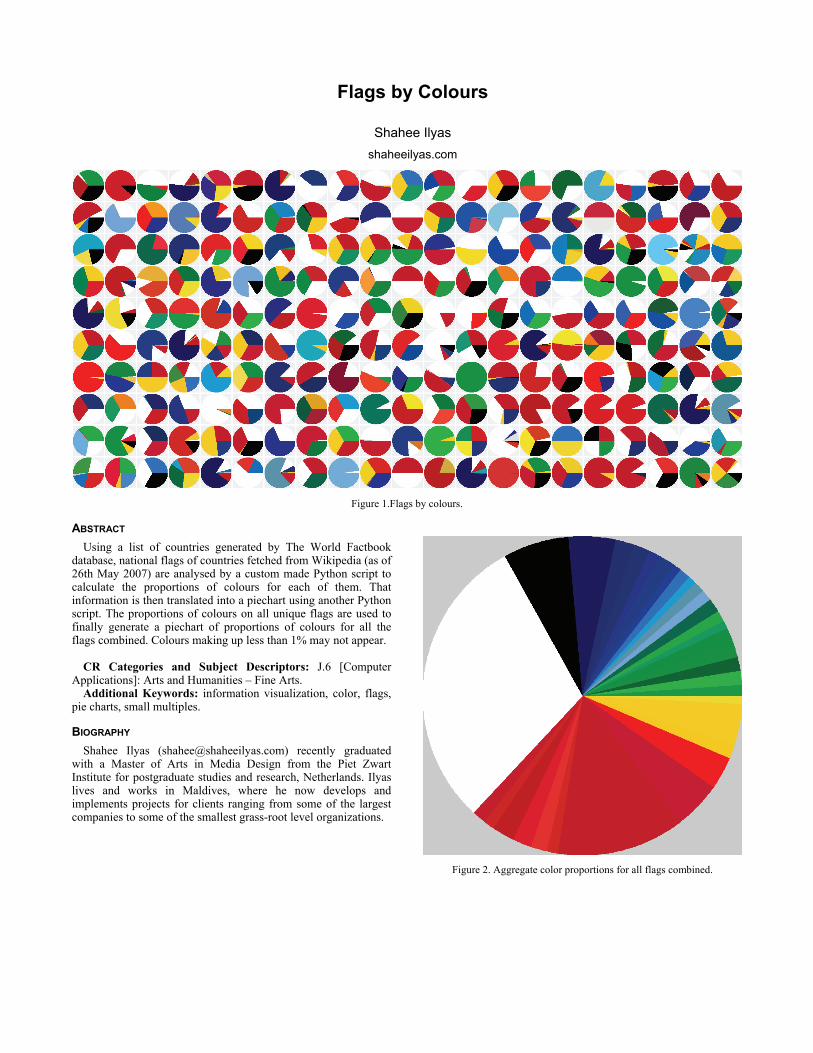
database, national flags of countries fetched from Wikipedia (as of 26th May 2007) are analysed by a custom made Python script to calculate the proportions of colours for each of them. That information is then translated into a piechart using another Python script. The proportions of colours on all unique flags are used to finally generate a piechart of proportions of colours for all the flags combined. Colours making up less than 1% may not appear.
CR Categories and Subject Descriptors: J.6 [Computer
Applications]: Arts and Humanities – Fine Arts. Additional Keywords: information visualization, color, flags,
pie charts, small multiples.
BIOGRAPHY Shahee Ilyas ([email protected]) recently graduated
with a Master of Arts in Media Design from the Piet Zwart Institute for postgraduate studies and research, Netherlands. Ilyas lives and works in Maldives, where he now develops and implements projects for clients ranging from some of the largest companies to some of the smallest grass-root level organizations.
Figure 2. Aggregate color proportions for all flags combined.
Eventide
Cassandra C. Jones cassandrac.googlepages.com
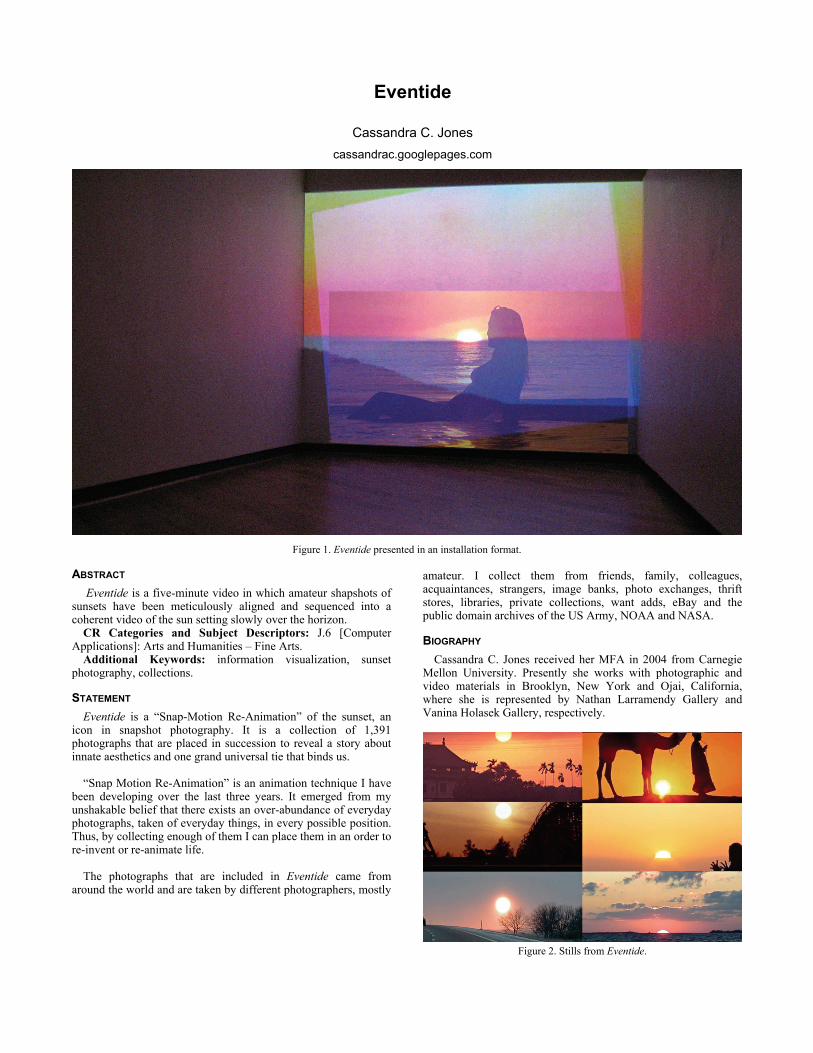
Figure 1. Eventide presented in an installation format.
ABSTRACT Eventide is a five-minute video in which amateur shapshots of
sunsets have been meticulously aligned and sequenced into a coherent video of the sun setting slowly over the horizon.
CR Categories and Subject Descriptors: J.6 [Computer Applications]: Arts and Humanities – Fine Arts.
Additional Keywords: information visualization, sunset photography, collections.
STATEMENT Eventide is a “Snap-Motion Re-Animation” of the sunset, an
icon in snapshot photography. It is a collection of 1,391 photographs that are placed in succession to reveal a story about innate aesthetics and one grand universal tie that binds us.
“Snap Motion Re-Animation” is an animation technique I have
been developing over the last three years. It emerged from my unshakable belief that there exists an over-abundance of everyday photographs, taken of everyday things, in every possible position. Thus, by collecting enough of them I can place them in an order to re-invent or re-animate life.
The photographs that are included in Eventide came from
around the world and are taken by different photographers, mostly
amateur. I collect them from friends, family, colleagues, acquaintances, strangers, image banks, photo exchanges, thrift stores, libraries, private collections, want adds, eBay and the public domain archives of the US Army, NOAA and NASA.
BIOGRAPHY Cassandra C. Jones received her MFA in 2004 from Carnegie
Mellon University. Presently she works with photographic and video materials in Brooklyn, New York and Ojai, California, where she is represented by Nathan Larramendy Gallery and Vanina Holasek Gallery, respectively.
Figure 2. Stills from Eventide.
The Sheep Market
Aaron Koblin Department of Design | Media Arts, UCLA
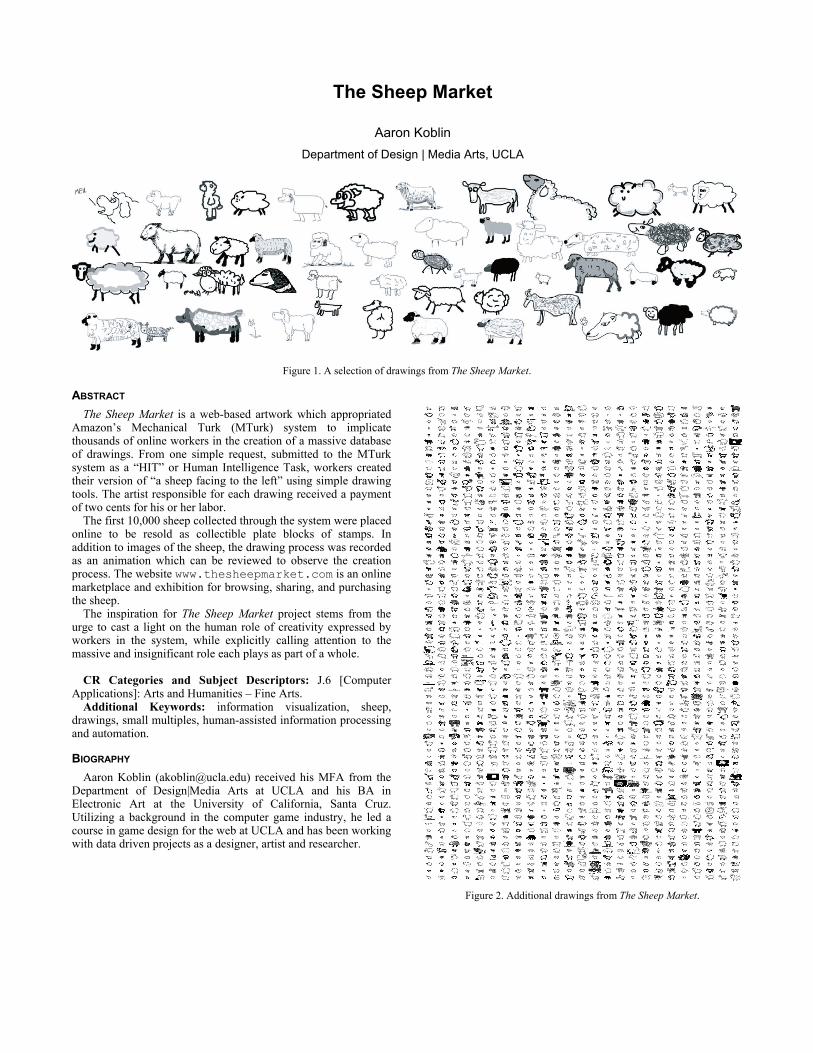
Figure 1. A selection of drawings from The Sheep Market.
ABSTRACT The Sheep Market is a web-based artwork which appropriated
Amazon’s Mechanical Turk (MTurk) system to implicate thousands of online workers in the creation of a massive database of drawings. From one simple request, submitted to the MTurk system as a “HIT” or Human Intelligence Task, workers created their version of “a sheep facing to the left” using simple drawing tools. The artist responsible for each drawing received a payment of two cents for his or her labor.
The first 10,000 sheep collected through the system were placed online to be resold as collectible plate blocks of stamps. In addition to images of the sheep, the drawing process was recorded as an animation which can be reviewed to observe the creation process. The website www.thesheepmarket.com is an online marketplace and exhibition for browsing, sharing, and purchasing the sheep.
The inspiration for The Sheep Market project stems from the urge to cast a light on the human role of creativity expressed by workers in the system, while explicitly calling attention to the massive and insignificant role each plays as part of a whole.
CR Categories and Subject Descriptors: J.6 [Computer
Applications]: Arts and Humanities – Fine Arts. Additional Keywords: information visualization, sheep,
drawings, small multiples, human-assisted information processing and automation.
BIOGRAPHY Aaron Koblin ([email protected]) received his MFA from the
Department of Design|Media Arts at UCLA and his BA in Electronic Art at the University of California, Santa Cruz. Utilizing a background in the computer game industry, he led a course in game design for the web at UCLA and has been working with data driven projects as a designer, artist and researcher.
Figure 2. Additional drawings from The Sheep Market.
Skymall Liberation
Evan Roth Eyebeam Atelier / ni9e.com
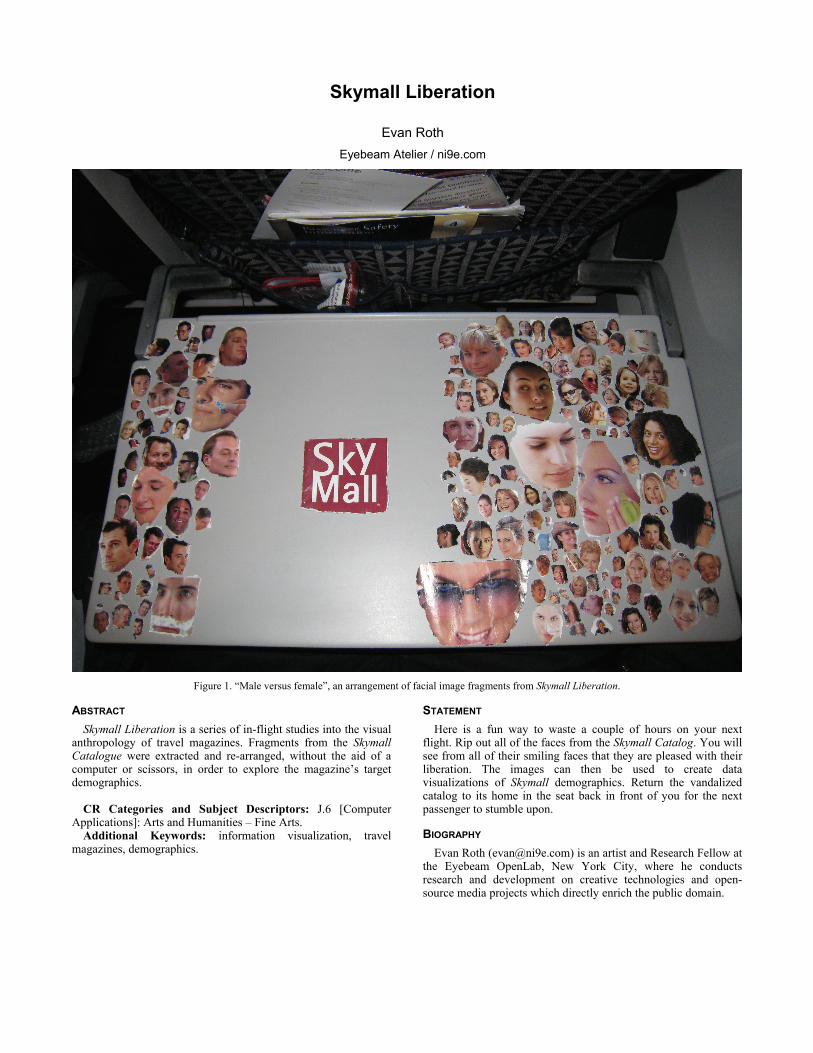
Figure 1. “Male versus female”, an arrangement of facial image fragments from Skymall Liberation.
ABSTRACT Skymall Liberation is a series of in-flight studies into the visual
anthropology of travel magazines. Fragments from the Skymall Catalogue were extracted and re-arranged, without the aid of a computer or scissors, in order to explore the magazine’s target demographics.
CR Categories and Subject Descriptors: J.6 [Computer
Applications]: Arts and Humanities – Fine Arts. Additional Keywords: information visualization, travel
magazines, demographics.
STATEMENT Here is a fun way to waste a couple of hours on your next
flight. Rip out all of the faces from the Skymall Catalog. You will see from all of their smiling faces that they are pleased with their liberation. The images can then be used to create data visualizations of Skymall demographics. Return the vandalized catalog to its home in the seat back in front of you for the next passenger to stumble upon.
BIOGRAPHY Evan Roth ([email protected]) is an artist and Research Fellow at
the Eyebeam OpenLab, New York City, where he conducts research and development on creative technologies and open-source media projects which directly enrich the public domain.
Color Code
Martin Wattenberg IBM Watson Research Center
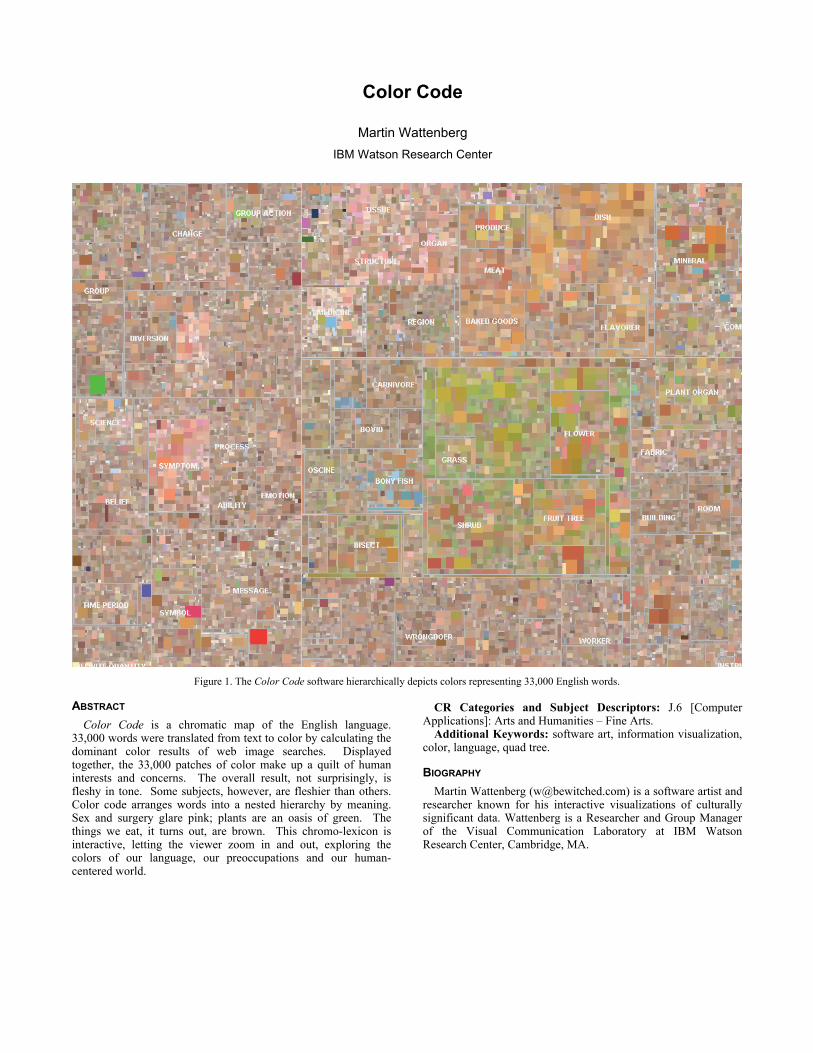
Figure 1. The Color Code software hierarchically depicts colors representing 33,000 English words.
ABSTRACT Color Code is a chromatic map of the English language.
33,000 words were translated from text to color by calculating the dominant color results of web image searches. Displayed together, the 33,000 patches of color make up a quilt of human interests and concerns. The overall result, not surprisingly, is fleshy in tone. Some subjects, however, are fleshier than others. Color code arranges words into a nested hierarchy by meaning. Sex and surgery glare pink; plants are an oasis of green. The things we eat, it turns out, are brown. This chromo-lexicon is interactive, letting the viewer zoom in and out, exploring the colors of our language, our preoccupations and our human-centered world.
CR Categories and Subject Descriptors: J.6 [Computer
Applications]: Arts and Humanities – Fine Arts. Additional Keywords: software art, information visualization,
color, language, quad tree.
BIOGRAPHY Martin Wattenberg ([email protected]) is a software artist and
researcher known for his interactive visualizations of culturally significant data. Wattenberg is a Researcher and Group Manager of the Visual Communication Laboratory at IBM Watson Research Center, Cambridge, MA.