lipor food waste strategies · lipor’s food waste strategies pre-waste project final conference...
TRANSCRIPT

LIPOR’S FOOD WASTE STRATEGIES
PRE-WASTE PROJECT FINAL CONFERENCE
Brussels, 7 th November, 2012
Catarina Almeida| Prevention Working Group

LIPOR
2
Intermunicipal Waste Management of Greater Porto

LIPOR
3
•8 Municipalities
• MSW Production (2011): 514.832,43 ton
• Capitation (2011): 1,40 kg/(inh./day)
• Carbon Footprint:
2011: 363.262 ton CO2eq
Atl
anti
c O
cean
Population - 969.036 inhabitants 9,32% of Portuguese Population in 650 km2
(0,7% of the national territory)
LIPOR
4
• “Become even more an
organization of reference, through
resources valorization, social
responsibility and eco-efficient
performance.”
VISION

LIPOR’S CHALLENGES
5
Apply Waste Management Hierarchy
Increase quantities of material sent to Recycling
Increase valorisation of Organic Waste fraction present in MSW
Reduce Landfill deposition
Implement TOTAL Certification at LIPOR (Quality, Environment, Health and Safety and Social Responsibility)
Increase Energetic Efficiency
Reduce CO2 eq. emissions

6
Multimaterial Recovery
Energy Recovery
Recyclable Waste Stream
Mixed Municipal Waste Stream
DIFFERENT WASTE, DIFFERENT DESTINATIONS
Organic Recovery Biowaste Stream

WASTE MANAGEMENT
7
Prevention and Reduction
Prepare for Reuse
Recycling
Other Valorization
Elimination
L I P O R ’ S WA S T E P R E V E N T I O N
S T R AT EGY
Guidelines and Community Legislation
Strategic Plan for LIPOR Municipal Solid Waste
Sustainable Management 2007-2016
National Legislation PERSU II
Sustainable Management
LIPOR’s Strategic Plan 2007-2016:
Waste Prevention is the basis of LIPOR’s waste management hierarchy.

8
PREVENTION AT LIPOR Prevention Group, started at 2006 Multidisciplinary team work Take the waste prevention as a priority goal, opposed : • The unnecessary and avoidable waste production • The high costs of management and treatment • Economic, environmental and social impacts
Define
Implement
Monitor
Evaluate
LIPOR’s Prevention
Plan

9
Prevention Activities Plan 2012 LIPOR’s develops waste prevention projects/ initiatives, on the following axis :
Biowaste
Recyclable waste
Waste Hazardousness
Recovery/Reuse
Use of economic instruments
Communication/Awareness
Waste Prevention Indicators Study
WASTE PREVENTION L I P O R W A S T E P R E V E N T I O N S T R AT E G Y:
10
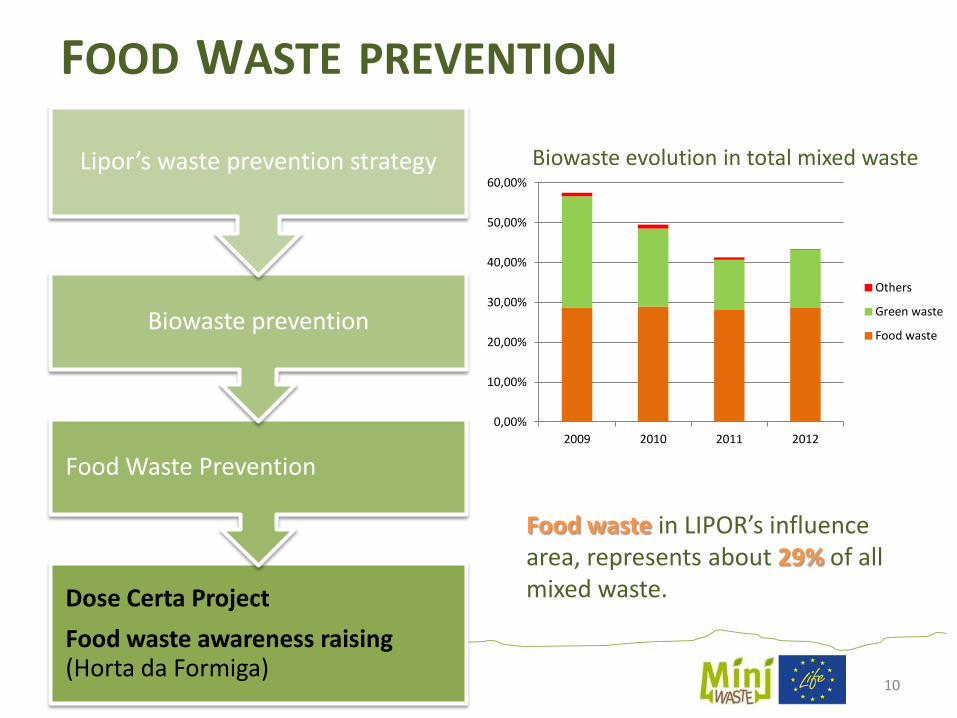
FOOD WASTE PREVENTION
Food waste in LIPOR’s influence area, represents about 29% of all mixed waste.
Biowaste evolution in total mixed waste
0,00%
10,00%
20,00%
30,00%
40,00%
50,00%
60,00%
2009 2010 2011 2012
Others
Green waste
Food waste
Dose Certa Project
Food waste awareness raising (Horta da Formiga)
Food Waste Prevention
Biowaste prevention
Lipor’s waste prevention strategy

OBJECTIVES FOOD WASTE STRATEGY
FOOD WASTE
PREVENTION
Promote food waste reduction
Aware to:
- Sustainable consumption
-Inventory management
- Nutritional and Environmental aspects
Promote behavior changes
(environmental and dietary habits)
Motivate and empower
voluntary and active
participation

DOSE CERTA PROJECT Scope Implementation of Dose Certa Project in order to allow participants to adopt best environmental, nutritional and management food stock practices, from food purchase to preparation and meals consumption.
Purchases
Warehouse
Ecologic Purchasing
Kitchen
Waste
Costumer
Stock management: good practices
Behaviour changes
Costumer service
“Operation 5 Stars Restaurants”
Meals preparation
FOOD WASTE PREVENTION

DOSE CERTA PROJECT
FOOD WASTE PREVENTION
In 2012 were started 2 Pilot Case Studies:
- School Canteen
-Foodservice Company
(is being followed the same methodology).
TARGET PUBLIC
Restaurants
School Canteens
Families
Food Service
Companies

DOSE CERTA PROJECT – 7 phases
FOOD WASTE PREVENTION
1. Project
Release
3. Initial *
Diagnosis
4. Training
5. Final *
Diagnosis
6. Dose Certa
Certificates delivery
2.Preparation
7. Monitoring * Same procedure
Co
mm
un
icat
ion
/Aw
are
ne
ss

FOOD WASTE PREVENTION
- To know what foods are thrown away
- Associated costs - Define Menus
“Dose Certa”
Food stock counting (Kg and €)
Purchased Food record (Kg and €)
Warehouse Waste production (Kg)
Food Waste production in “Kitchen – Waste” stream (Kg)
Food Waste production in “Costumer-Waste” stream (Kg)
DOSE CERTA PROJECT

FOOD WASTE AWARENESS RAISING
FOOD WASTE PREVENTION
Scope
Raise the awareness of the population, through a number of initiatives, leading to a behaviour change, educating to the best environmental and food habits

FOOD WASTE PREVENTION
Where?
- Horta da Formiga
- Shopping centre
- Specialised shops
- Universities
- Organic markets
• Citizen
• Institutions
• Companies
TARGET PUBLIC
FOOD WASTE AWARENESS RAISING

FOOD WASTE PREVENTION
FOOD WASTE AWARENESS RAISING
Home composting and
food waste Courses
Cooking Courses*
Refined Leftovers Courses
Action Strategy
* About: Jams, food conservation, healthy food habits (balanced meals)

FOOD WASTE PREVENTION
FOOD WASTE AWARENESS RAISING
Recipes using leftovers
Workshops
Exhibition stands
Awareness raising
materials
Action Strategy

DOSE CERTA PROJECT INDICATORS
FOOD WASTE PREVENTION
Indicator
2011 2012
Target Execution Target
Execution (1st sem.)
Nr. of adherents 3* 100% 6** 4 (66,7%) Nr. of restaurants to be monitored
2 100%
Access to website www.eunaofacolixo.com
15.163 8.837
(58,2%) 3.127
a) 3.610
(115,4%) Nr. of press news (Waste Prevention)
119 251
(210,9%) 251
63 (25%)
Nr. of press news (Dose Certa project)
--- 18/251 --- 1/63
• * 3 restaurants; • ** 2 restaurants adherent in 2011+ 2 new restaurants +1 canteen (food service company) +
1 school canteen; • a) semestral target

FOOD WASTE AWARENESS RAISING INDICATORS
FOOD WASTE PREVENTION
Indicator
From 2010 to June 2012
Execution
Raise the awareness about the food waste problem
2.542
Stands 41
Access to website www.eunaofacolixo.com
3.610
Nr. of press news (Waste Prevention) 63
Nr. of press news (About food waste awareness raising)
33/63*
• * only in 2012

22
Statistics - PREVENTION INDICATORS
Description Action Benefits
Study on the development of indicators in waste prevention field, for Lipor system.
• Monitoring the goals set for the different projects and initiatives in the waste prevention field;
• Evaluate the implementation of the measures and the results obtained.
WASTE PREVENTION WASTE PREVENTION INDICATORS STUDY

23
Statistics - PREVENTION INDICATORS
WASTE PREVENTION WASTE PREVENTION INDICATORS STUDY
Using the pressure-state-response (PCR) model by the OECD
TYPE MAIN FEATURES
Pressure indicators Generation of: - Municipal waste
Condition indicators Effects on water and air quality; effects on land use and soil quality
Response indicators - Waste minimisation - Economic and fiscal instruments, expenditures

KEY ELEMENTS
FOOD WASTE PREVENTION
Websites e.News Facebook Press
releases Project specific documentation
Proximity communication
Field work Establish
partnerships
Flexibility (local reality
versus adaptation)
Communication and Transferability of good practices

25
FOOD WASTE PREVENTION IN THE FUTURE
• Continue the Dose Certa Project implementation in:
Restaurants
School Canteens
Food Service Companies (Canteens)
• Develop new actions addressed to Families (to encourage food waste
reduction at home)
• Raise awareness among LIPOR’s Employees (Example: EWWR)
• Raise awareness among Hotel/Tourism Schools (to prepare future
Chefs to avoid food waste)…
… and exchange experiences with other regions!

More Information
26
www.hortadaformiga.com www.eunaofacolixo.com www.lipor.pt

Contacts:
27
LIPOR: +351 229 770 100 Prevention Working Group
Dose Certa Project:
Catarina Almeida [email protected]
Food waste awareness raising:
Ana Lopes [email protected]
THANK YOU!
Maria do Céu Silva [email protected]