(links to page 2)s streams and rivers flow through diverse habitats, from mountain canyons, valleys,...
TRANSCRIPT

1
(links to page 2)
1
(links to page 2)

2
STREAMS, RIVERS & LAKES
California's streams and rivers flow through diverse habitats, from mountain canyons, valleys, deserts, estuaries and urban areas. Riparian woodlands develop along stream banks and floodplains, linking forest, chaparral, scrubland, grassland, and wetlands. California lakes, supporting deep water, wetlands, riparian woodlands, offer a quiet refuge for plants, animals and humans alike. More >>
ESTUARIES
Estuaries are unique habitats found where rivers and the ocean mix. They feature a diverse array of plants and animals adapted to life along this mixing zone. More >>
OCEAN
California has 1,100 miles of shoreline and 220,000 square miles of state and federal oceanic habitat, featuring one of the world's most diverse marine ecosystems. More >>
WETLANDS
Wetlands form along the shallow margins of deepwater ecosystems such as lakes, estuaries, and rivers. They also form in upland settings where groundwater or runoff makes the ground too wet for upland vegetation. More >>
Stressors & Processes Contact Us Ecosystem Health Safe to Swim Home Safe to Drink Safe to Eat Fish
CALIFORNIA WATER QUALITY MONITORING COUNCIL
ENVIRONMENTAL PROTECTION AGENCY NATURAL RESOURCES AGENCY
State of California
Wetlands I Estuaries I Streams, Rivers & Lakes l Ocean
Home Aquatic Ecosystem Health
Are Our Aquatic Ecosystems Healthy? California has many types of aquatic habitats. Follow the links below to learn more…
AQUATIC HEALTH LINKS Stressors
Laws, Regulations, Standards & Guidelines
Regulatory Activities Enforcement Actions
Research
Monitoring Programs, Data Sources & Reports
State & Regional Water Boards
(links to page 3)
(links to page 3)

3
What is the extent of stream and river resources?
What is the condition of our streams and rivers?
Which streams or rivers are listed by the State as impaired?
What is being done to protect and restore our streams and rivers?
What are the trends in the condition of our streams and rivers?
What are the stressors affecting the condition of our streams and rivers?
Aquatic Ecosystem Health Stressors & Processes Swimming Home Drinking Eating Fish & Shellfish
Home Aquatic Ecosystem Health Streams & Rivers
QUESTIONS ANSWERED
Are Our Stream & River Ecosystems Healthy?
STREAM & RIVER LINKS Stream and River Types
Tools to Assess Biological and Physical Condition
Laws, Regulations, Standards & Guidelines
Regulatory Activities
Enforcement Actions
Research Monitoring Programs,
Data Sources & Reports
State & Regional Water Boards
Yolo County
Extent of Stream & River Resources
Stream & River Condition Impaired Waterbodies
Protection and Restoration
(links to page 7)
(links to page 4)
(link to page 8) (links to Healthy Streams Partnership page)
Lorem ipsum dolor sit amet, consectetur adipiscing elit. Ut quis ante arcu, non rutrum dolor. Morbi nec malesuada urna. Cras a metus elit. Quisque aliquam pharetra dolor sed fringilla. Donec urna lacus, aliquam a euismod sit amet, cursus nec nisi. Integer at eleifend nulla. In hac habitasse platea dictumst. Sed faucibus lorem sem. Vivamus sit amet libero vel massa dapibus accumsan.
To view stream and river information:
Click on a county or
Select a County or Region from a pop-up menu above the map
CALIFORNIA WATER QUALITY MONITORING COUNCIL
ENVIRONMENTAL PROTECTION AGENCY RESOURCES AGENCY
State of California
Estuaries | Lakes | Streams & Rivers | Ocean | Wetlands
Contact Us
(links to page 17)
(links to page 13)
(links to page 18)
Region Region Regions
Yolo County
(above links are the same as questions to the right but map would focus on the county or Region) (links to page 14)
(links to page 15)
(links to page 16)

4
North Coast (x% of State Total)
Perennial Streams & Rivers x,xxx km (xx%) Non-Perennial Streams & Rivers xx,xxx km (xx%)
Aquatic Ecosystem Health Stressors & Processes Swimming Home Drinking Eating Fish & Shellfish
Home Aquatic Ecosystem Health Streams & Rivers
What is the Extent of Our Stream & River Resources?
STREAM & RIVER LINKS Stream and River Types
Tools to Assess Biological and Physical Condition
Laws, Regulations, Standards & Guidelines
Regulatory Activities
Enforcement Actions
Research Monitoring Programs,
Data Sources & Reports
State & Regional Water Boards Lorem ipsum dolor sit amet, consectetur
adipiscing elit. Ut quis ante arcu, non rutrum dolor. Morbi nec malesuada urna. Cras a metus elit. Quisque aliquam pharetra dolor sed fringilla. Donec urna lacus, The hydrologic regions of California are based on divisions established by the California Department of Water Resources. Each region exhibits similar precipitation, runoff, geologic, and tectonic conditions.
Statewide Figures
Perennial Streams and Rivers
xx,xxx km (x,xxx miles)
xx% of the total
Non-Perennial Streams and Rivers
xxx,xxx km (x,xxx miles)
xx% of the total
Stream and River Types
To view stream and river info by hydrologic region:
Click on a hydrologic region or
Select from the pop-up menu above the map
CALIFORNIA WATER QUALITY MONITORING COUNCIL
ENVIRONMENTAL PROTECTION AGENCY RESOURCES AGENCY
State of California
Estuaries | Lakes | Streams & Rivers | Ocean | Wetlands
Contact Us
North coast Select Region:
(links to page 7)
(links to page 7)
(links to page 17)
(links to page 18)
(links to Healthy Streams Partnership page)

5
Aquatic Ecosystem Health Stressors & Processes Swimming Home Drinking Eating Fish & Shellfish
Home Aquatic Ecosystem Health Streams & Rivers
What is the Extent of Our Stream & River Resources?
STREAM & RIVER LINKS Stream and River Types
Tools to Assess Biological and Physical Condition
Laws, Regulations, Standards & Guidelines
Regulatory Activities
Enforcement Actions
Research Monitoring Programs,
Data Sources & Reports
State & Regional Water Boards
CALIFORNIA WATER QUALITY MONITORING COUNCIL
ENVIRONMENTAL PROTECTION AGENCY RESOURCES AGENCY
State of California
Estuaries | Lakes | Streams & Rivers | Ocean | Wetlands
Contact Us
North Coast Select Region:
(links to page 7)
(links to page 17)
(links to page 18)
(links to Healthy Streams Partnership page)
Source: J. Mount. 1995. California Rivers and Streams: The Conflict Between Fluvial Process and Land Use
Source: DWR California Water Plan

6
Aquatic Ecosystem Health Stressors & Processes Swimming Home Drinking Eating Fish & Shellfish
Home Aquatic Ecosystem Health Streams & Rivers
What is the Extent of Our Stream & River Resources?
STREAM & RIVER LINKS Stream and River Types
Tools to Assess Biological and Physical Condition
Laws, Regulations, Standards & Guidelines
Regulatory Activities
Enforcement Actions
Research Monitoring Programs,
Data Sources & Reports
State & Regional Water Boards
CALIFORNIA WATER QUALITY MONITORING COUNCIL
ENVIRONMENTAL PROTECTION AGENCY RESOURCES AGENCY
State of California
Estuaries | Lakes | Streams & Rivers | Ocean | Wetlands
Contact Us
North Coast
(links to page 7)
Select Region:
(links to page 17)
(links to page 18)
(links to Healthy Streams Partnership page)
Source: J. Mount. 1995. California Rivers and Streams: The Conflict Between Fluvial Process and Land Use
Continuation from prior slide, content from slides 5 and 6 would be on the same page

7
Aquatic Ecosystem Health Stressors & Processes Swimming Home Drinking Eating Fish & Shellfish
Home Aquatic Ecosystem Health Streams & Rivers
Types of Streams & Rivers
STREAM & RIVER LINKS Stream and River Types
Tools to Assess Biological and Physical Condition
Laws, Regulations, Standards & Guidelines
Regulatory Activities
Enforcement Actions
Research Monitoring Programs,
Data Sources & Reports
State & Regional Water Boards
CALIFORNIA WATER QUALITY MONITORING COUNCIL
ENVIRONMENTAL PROTECTION AGENCY RESOURCES AGENCY
State of California
Estuaries | Lakes | Streams & Rivers | Ocean | Wetlands
Contact Us
(links to page 7)
(links to page 17)
(links to page 18)
Lorem ipsum dolor sit amet, consectetur adipiscing elit. Ut quis ante arcu, non rutrum dolor. Morbi nec malesuada urna. Cras a metus elit. Quisque aliquam pharetra dolor sed fringilla. Donec urna lacus.
Large Rivers Lorem ipsum dolor sit amet, consectetur adipiscing elit. Ut quis ante arcu, non rutrum dolor. Morbi nec malesuada urna. Cras a metus elit. Quisque aliquam pharetra dolor sed fringilla. Donec urna lacus, aliquam a euismod sit amet, cursus nec nisi. Integer at eleifend nulla.
Streams Landscape features with defined beds and banks that have been formed by water and which under typical circumstances are maintained by the flow of water. Perennial Streams A stream with the year-round presence of flowing surface water during a typical water year.
Non-Perennial Streams Lorem ipsum dolor sit amet, consectetur adipiscing elit. Ut quis ante arcu, non rutrum dolor. Morbi nec malesuada urna. Cras a metus elit. Quisque aliquam pharetra dolor sed fringilla. Donec urna lacus, aliquam a euismod sit amet, cursus nec nisi. Integer at eleifend nulla.
● Intermittent Streams Streams containing flowing water for only a portion of the year. When not flowing, water may remain in sections (e.g., isolated pools) fed by springs or ground water with dry stretches occurring in the intervening areas.
● Ephemeral Streams Streams that contain running water only seasonally and not necessarily every year.
[Add photos]
(links to Healthy Streams Partnership page)

8
Aquatic Ecosystem Health Stressors & Processes Swimming Home Drinking Eating Fish & Shellfish
Home Aquatic Ecosystem Health Streams & Rivers
STREAM & RIVER LINKS Stream and River Types
Tools to Assess Biological and Physical Condition
Laws, Regulations, Standards & Guidelines
Regulatory Activities
Enforcement Actions
Research Monitoring Programs,
Data Sources & Reports
State & Regional Water Boards
CALIFORNIA WATER QUALITY MONITORING COUNCIL
ENVIRONMENTAL PROTECTION AGENCY RESOURCES AGENCY
State of California
Estuaries | Lakes | Streams & Rivers | Ocean | Wetlands
Contact Us
(links to page 7)
(links to page 17)
(links to page 18)
What is the Condition of Our Streams & Rivers?
Sacramento River at I-Street Bridge
Fish
Benthic Macro-Inverte-brates
Algae Toxicity Physical Habitat
No Assess-
ment A D B C F
Chem-istry
Condition Measured Using Biological and Physical Indicators
Lorem ipsum dolor sit amet, consectetur adipiscing elit. Ut quis ante arcu, non rutrum dolor. Morbi nec malesuada urna. Cras a metus elit. Quisque aliquam pharetra dolor sed fringilla. Donec urna lacus, aliquam a euismod sit amet, cursus nec nisi.
Tools to Assess Biological and Physical Condition
Statewide Condition Assessment - Toxicity Lorem ipsum dolor sit amet, consectetur adipiscing elit. Ut quis ante arcu, non rutrum dolor. Morbi nec malesuada urna. Cras a metus elit.
Stream and River Water Quality Assessment and Impairments Pursuant to the Clean Water Act Lorem ipsum dolor sit amet, consectetur adipiscing elit. Ut quis ante arcu, non rutrum dolor. Morbi nec malesuada urna. Cras a metus elit.
(links to page 9)
(links to page 17)
(links to page 13)
Region Region
Yolo County
Good Fair Poor
Regions
(links to related information on page 15)
(links to Healthy Streams Partnership page)

9
Where has toxicity been observed in California waters?
What is the magnitude of observed toxicity?
How do the results of toxicity measurements compare among different land cover types?
Aquatic Ecosystem Health Stressors & Processes Swimming Home Drinking Eating Fish & Shellfish
Home Aquatic Ecosystem Health Streams & Rivers
QUESTIONS ANSWERED
What is the Condition of Our Streams & Rivers?
STREAM & RIVER LINKS Stream and River Types
Tools to Assess Biological and Physical Condition
Laws, Regulations, Standards & Guidelines
Regulatory Activities
Enforcement Actions
Research Monitoring Programs,
Data Sources & Reports
State & Regional Water Boards
(links to page 7)
(links to Healthy Streams Partnership page)
Condition assessed using toxicity testing as an indicator. Insert Toxicity Summary See Notes also need careful consideration of appropriate caveats
To view stream and river information:
Click on a county or
Select a County or Region from a pop-up menu above the map
CALIFORNIA WATER QUALITY MONITORING COUNCIL
ENVIRONMENTAL PROTECTION AGENCY RESOURCES AGENCY
State of California
Estuaries | Lakes | Streams & Rivers | Ocean | Wetlands
Contact Us
(links to page 17)
(links to page 18)
Region Region Regions
Yolo County
Yolo County
Where has toxicity been observed?
What is magnitude of observed toxicity?
How do results compare among land uses?
(above links are the same as questions to the right but map would focus on the county or Region)
(link to slide 10)
(link to slide 10)
(link to slide 11)

10
Aquatic Ecosystem Health Stressors & Processes Swimming Home Drinking Eating Fish & Shellfish
Home Aquatic Ecosystem Health Streams & Rivers Where has Toxicity Been Observed in California Waters and What is the Magnitude of Observed Toxicity?
STREAM & RIVER LINKS Stream and River Types
Tools to Assess Biological and Physical Condition
Laws, Regulations, Standards & Guidelines
Regulatory Activities
Enforcement Actions
Research Monitoring Programs,
Data Sources & Reports
State & Regional Water Boards
This interactive map shows locations of sites sampled by the SWAMP and partner programs. All sites are color coded using the categorization process described here, which considers the available toxicity test endpoints in both water and sediment… Develop associated page that provides means of viewing the raw data (CCAMP layout one example) Raw data show summarized value (% survival), as opposed to replicate data [Note: Add disclaimer language]
Add drop-down menus that allow you to filter data according to: matrix magnitude of toxicity
Drop-down menu on raw data page Test species Toxicity observed (Y/N) Matrix Date – start and end
CALIFORNIA WATER QUALITY MONITORING COUNCIL
ENVIRONMENTAL PROTECTION AGENCY RESOURCES AGENCY
State of California
Estuaries | Lakes | Streams & Rivers | Ocean | Wetlands
Contact Us
(links to page 7)
(links to page 17)
(links to page 18)
Sacramento River at Hood
Test Species: Magnitude of Tox: C. dubia Non-toxic
Test Endpoint: Number of Tests Survival 5
Test Matrix: Water Column
Select Species Test Species Regions
Sac County
(links to Healthy Streams Partnership page)
Include drop down menu similar to safe to eat portal
Here links to slide 9

11
Aquatic Ecosystem Health Stressors & Processes Swimming Home Drinking Eating Fish & Shellfish
Home Aquatic Ecosystem Health Streams & Rivers Where has Toxicity Been Observed in California Waters and What is the Magnitude of Observed Toxicity?
STREAM & RIVER LINKS Stream and River Types
Tools to Assess Biological and Physical Condition
Laws, Regulations, Standards & Guidelines
Regulatory Activities
Enforcement Actions
Research Monitoring Programs,
Data Sources & Reports
State & Regional Water Boards
CALIFORNIA WATER QUALITY MONITORING COUNCIL
ENVIRONMENTAL PROTECTION AGENCY RESOURCES AGENCY
State of California
Estuaries | Lakes | Streams & Rivers | Ocean | Wetlands
Contact Us
(links to page 7)
(links to page 15)
(links to page 16)
(links to Healthy Streams Partnership page)
The word “here” in text on slide 10 links to a separate page with this figure

12
Aquatic Ecosystem Health Stressors & Processes Swimming Home Drinking Eating Fish & Shellfish
Home Aquatic Ecosystem Health Streams & Rivers
How do the Results of Toxicity Measurements Compare Among Different Land Cover Types?
STREAM & RIVER LINKS Stream and River Types
Tools to Assess Biological and Physical Condition
Laws, Regulations, Standards & Guidelines
Regulatory Activities
Enforcement Actions
Research Monitoring Programs,
Data Sources & Reports
State & Regional Water Boards
Samples from sites in agricultural and urban areas had significantly higher toxicity than sites in less developed areas (Figure 9), and had a greater magnitude of toxicity (Figure 10). The differences in toxicity between undeveloped and urban areas was highly statistically significant (p < 0.0005); and the same is true for the difference between undeveloped and agricultural areas. A subset of the sites assessed (536 out of 992) were mapped and categorized for land cover using geographic information system (GIS) analysis. For each site, an area 1 km upstream (including tributaries) and 500 m on either side of the stream was mapped. If land cover within those areas was greater than 10% “developed” (National Land Cover Dataset classification), they were designated as urban. This is based on the widely supported impervious surface area model that shows decreased ecological condition in streams draining lands with greater than 10% impervious surface area. Sites with greater than 25% agricultural land cover were classified as agricultural sites. Sites were classified as “undeveloped” if they had both less than 10% urban and less than 25% agricultural land cover. Sites were classified as “ag-urban” if they had both greater than 10% urban and 25% agricultural land cover.
CALIFORNIA WATER QUALITY MONITORING COUNCIL
ENVIRONMENTAL PROTECTION AGENCY RESOURCES AGENCY
State of California
Estuaries | Lakes | Streams & Rivers | Ocean | Wetlands
Contact Us
(links to page 7)
(links to page 17)
(links to page 18)
(links to Healthy Streams Partnership page)
Figure 9
Figure 10
Use fusion charts for these figures. These will be static figures that are updated occasionally. Possibly use series of tabs for figures or other means so only one figure shows at any given time.

13
Aquatic Ecosystem Health Stressors & Processes Swimming Home Drinking Eating Fish & Shellfish
Home Aquatic Ecosystem Health Streams & Rivers
Which Streams or Rivers are Listed by the State as Impaired?
STREAM & RIVER LINKS Stream and River Types
Tools to Assess Biological and Physical Condition
Laws, Regulations, Standards & Guidelines
Regulatory Activities
Enforcement Actions
Research Monitoring Programs,
Data Sources & Reports
State & Regional Water Boards
Yolo County
Stream & River Condition
Trends
Stressors
Protection and Restoration
This interactive map shows which of California's waters are listed as impaired for aquatic life uses (i.e., may not protect aquatic life) and which pollutants are involved. Also shown are condition assessments pursuant to Section 305(b) of the Clean Water Act. [Note: Add disclaimer language - Hunt]
View 2010 303(d) Listing and current TMDL Information:
Click on a county or Select County from the pop-up menu above map Select Pollutant Category from the pop-up menu Use magnifier tool to zoom into an area of interest
Listed Waters by Water Quality Control Region
This chart shows …
CALIFORNIA WATER QUALITY MONITORING COUNCIL
ENVIRONMENTAL PROTECTION AGENCY RESOURCES AGENCY
State of California
Estuaries | Lakes | Streams & Rivers | Ocean | Wetlands
Contact Us
(links to page 7)
(links to page 17)
(links to page 18)
757
425
511
766
312
568
3981
256
0
100
200
300
400
500
600
700
800
900
1 2 3 4 5 6 7 8 9
Regional Board
Num
ber
of L
iste
d W
ater
s
Sacramento River, Upper
Pollutant of concern: Unknown Toxicity
Size affected: 49.0 miles
Listed water body in the Central Valley Region
[Note: discuss differences in assessment approaches
between Regions]
Select Pollutant: Pollutant Category Regions
Yolo County
(links to Healthy Streams Partnership page)
See safe to eat page for TMDL text

14
Aquatic Ecosystem Health Stressors & Processes Swimming Home Drinking Eating Fish & Shellfish
Home Aquatic Ecosystem Health Streams & Rivers
What is Being Done to Protect and Restore Our Streams and Rivers?
STREAM & RIVER LINKS Stream and River Types
Tools to Assess Biological and Physical Condition
Laws, Regulations, Standards & Guidelines
Regulatory Activities
Enforcement Actions
Research Monitoring Programs,
Data Sources & Reports
State & Regional Water Boards
CALIFORNIA WATER QUALITY MONITORING COUNCIL
ENVIRONMENTAL PROTECTION AGENCY RESOURCES AGENCY
State of California
Estuaries | Lakes | Streams & Rivers | Ocean | Wetlands
Contact Us
(links to page 7)
(links to page 17)
(links to page 18)
A number of programs address existing water quality problems that affect stream health.
Total Maximum Daily Loads (TMDLs)
Lorem ipsum dolor sit amet, consectetur adipiscing elit. Ut quis ante arcu, non rutrum dolor. Morbi nec malesuada urna. Cras a metus elit. Quisque aliquam pharetra dolor sed fringilla. Donec urna lacus, aliquam a euismod sit amet, cursus nec nisi. Clean Water Grant Projects
Lorem ipsum dolor sit amet, consectetur adipiscing elit. Ut quis ante arcu, non rutrum dolor. Morbi nec malesuada urna. Cras a metus elit. Quisque aliquam pharetra dolor sed fringilla. Donec urna lacus, aliquam a euismod sit amet, cursus nec nisi. Integer at eleifend nulla. In hac habitasse platea dictumst. Sed faucibus lorem sem. Vivamus sit amet libero vel massa dapibus accumsan. NPS – Watersheds of Focus ILRP Stormwater Flow Studies (DFG and SWRCB) Critical Habitat Designations – (include link to map of designated critical habitat for salmonids) DPR Pyrethroid Re-registration
[Show on map?]
(links to Healthy Streams Partnership page)
Link back to 303(d) page/map

15
Aquatic Ecosystem Health Stressors & Processes Swimming Home Drinking Eating Fish & Shellfish
Home Aquatic Ecosystem Health Streams & Rivers
What Are the Trends in Stream & River Condition?
STREAM & RIVER LINKS Stream and River Types
Tools to Assess Biological and Physical Condition
Laws, Regulations, Standards & Guidelines
Regulatory Activities
Enforcement Actions
Research Monitoring Programs,
Data Sources & Reports
State & Regional Water Boards
CALIFORNIA WATER QUALITY MONITORING COUNCIL
ENVIRONMENTAL PROTECTION AGENCY RESOURCES AGENCY
State of California
Estuaries | Lakes | Streams & Rivers | Ocean | Wetlands
Contact Us
(links to page 7)
(links to page 17)
(links to page 18)
Region Region
Yolo County
Improving No Change Declining
Regions
Sacramento River at I-Street Bridge
Fish
Benthic Macro-Inverte-brates
Algae Toxicity Physical Habitat
No Assess-
ment –
Chem-istry
Much of the water quality information for California streams was gathered in studies designed to identify problem areas and recommend solutions. Assessment of trends over time requires studies specifically designed for that purpose that can be maintained over many funding cycles. The trends information presented here is primarily from one large-scale State/federal program. Other trend monitoring programs have begun recently, but do not yet have a long enough data record to be presented here.
To view stream and river trend information:
Click on a county, Region, or monitoring location or Select from the pop-up menu above the map
Statewide Trends Lorem ipsum dolor sit amet, consectetur adipiscing.
(links to related information on page 17)
(links to Healthy Streams Partnership page)

16
Aquatic Ecosystem Health Stressors & Processes Swimming Home Drinking Eating Fish & Shellfish
Home Aquatic Ecosystem Health Streams & Rivers
What are the Stressors Affecting the Condition of our Streams and Rivers?
STREAM & RIVER LINKS Stream and River Types
Tools to Assess Biological and Physical Condition
Laws, Regulations, Standards & Guidelines
Regulatory Activities
Enforcement Actions
Research Monitoring Programs,
Data Sources & Reports
State & Regional Water Boards
Yolo County
Stream & River Condition
Trends
Stressors
Protection and Restoration
Lorem ipsum dolor sit amet, consectetur adipiscing elit. Ut quis ante arcu, non rutrum dolor. Morbi nec malesuada urna. Cras a metus elit. Quisque aliquam pharetra dolor sed fringilla.
To view stream and river information:
Click on a county or Region or
Select from the pop-up menu above the map
Physical Stressors
Text
Chemical Stressors
Text
The Extent of Stressor Impact
This chart shows …
CALIFORNIA WATER QUALITY MONITORING COUNCIL
ENVIRONMENTAL PROTECTION AGENCY RESOURCES AGENCY
State of California
Estuaries | Lakes | Streams & Rivers | Ocean | Wetlands
Contact Us
(links to page 7)
(links to page 17)
(links to page 18)
[Note: include data from PSA, SPoT SMC, EMAP, CMAP, SG/LA, NPDES, land use, and
pesticide use]
Region Region
Yolo County
Regions
0 10 20 30 40 50 60 70 80
Bed Instability
Excess Sand or Fines
Low Habitat Complexity
Low Vegetation Complexity
High Riparian Disturbance
Percent of stream miles
Need separate map from page 13?
(links to Healthy Streams Partnership page)
17
Aquatic Ecosystem Health Stressors & Processes Swimming Home Drinking Eating Fish & Shellfish
Home Aquatic Ecosystem Health Streams & Rivers
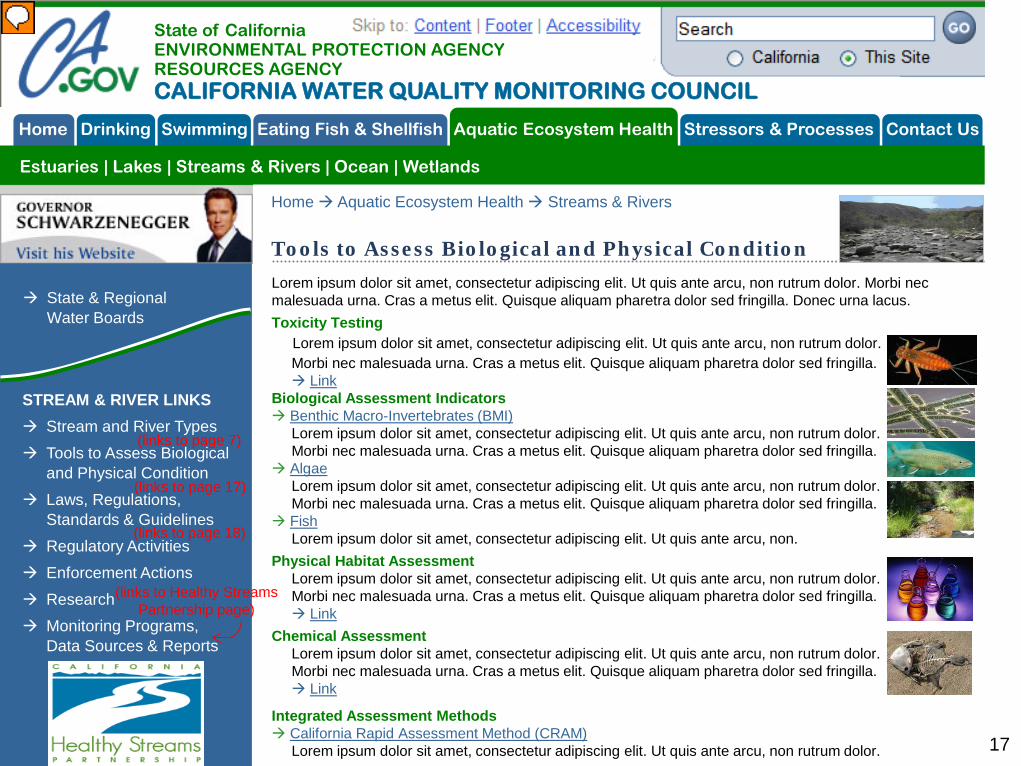
Tools to Assess Biological and Physical Condition
STREAM & RIVER LINKS Stream and River Types
Tools to Assess Biological and Physical Condition
Laws, Regulations, Standards & Guidelines
Regulatory Activities
Enforcement Actions
Research Monitoring Programs,
Data Sources & Reports
State & Regional Water Boards
Lorem ipsum dolor sit amet, consectetur adipiscing elit. Ut quis ante arcu, non rutrum dolor. Morbi nec malesuada urna. Cras a metus elit. Quisque aliquam pharetra dolor sed fringilla. Donec urna lacus.
Toxicity Testing Lorem ipsum dolor sit amet, consectetur adipiscing elit. Ut quis ante arcu, non rutrum dolor. Morbi nec malesuada urna. Cras a metus elit. Quisque aliquam pharetra dolor sed fringilla. Link Biological Assessment Indicators Benthic Macro-Invertebrates (BMI) Lorem ipsum dolor sit amet, consectetur adipiscing elit. Ut quis ante arcu, non rutrum dolor. Morbi nec malesuada urna. Cras a metus elit. Quisque aliquam pharetra dolor sed fringilla. Algae Lorem ipsum dolor sit amet, consectetur adipiscing elit. Ut quis ante arcu, non rutrum dolor. Morbi nec malesuada urna. Cras a metus elit. Quisque aliquam pharetra dolor sed fringilla. Fish Lorem ipsum dolor sit amet, consectetur adipiscing elit. Ut quis ante arcu, non.
Physical Habitat Assessment Lorem ipsum dolor sit amet, consectetur adipiscing elit. Ut quis ante arcu, non rutrum dolor. Morbi nec malesuada urna. Cras a metus elit. Quisque aliquam pharetra dolor sed fringilla. Link
Chemical Assessment Lorem ipsum dolor sit amet, consectetur adipiscing elit. Ut quis ante arcu, non rutrum dolor. Morbi nec malesuada urna. Cras a metus elit. Quisque aliquam pharetra dolor sed fringilla. Link
Integrated Assessment Methods California Rapid Assessment Method (CRAM) Lorem ipsum dolor sit amet, consectetur adipiscing elit. Ut quis ante arcu, non rutrum dolor.
CALIFORNIA WATER QUALITY MONITORING COUNCIL
ENVIRONMENTAL PROTECTION AGENCY RESOURCES AGENCY
State of California
Estuaries | Lakes | Streams & Rivers | Ocean | Wetlands
Contact Us
(links to page 7)
(links to page 17)
(links to page 18)
(links to Healthy Streams Partnership page)
18
Aquatic Ecosystem Health Stressors & Processes Swimming Home Drinking Eating Fish & Shellfish
Home Aquatic Ecosystem Health Streams & Rivers
STREAM & RIVER LINKS Stream and River Types
Tools to Assess Biological and Physical Condition
Laws, Regulations, Standards & Guidelines
Regulatory Activities
Enforcement Actions
Research Monitoring Programs,
Data Sources & Reports
State & Regional Water Boards
CALIFORNIA WATER QUALITY MONITORING COUNCIL
ENVIRONMENTAL PROTECTION AGENCY RESOURCES AGENCY
State of California
Estuaries | Lakes | Streams & Rivers | Ocean | Wetlands
Contact Us
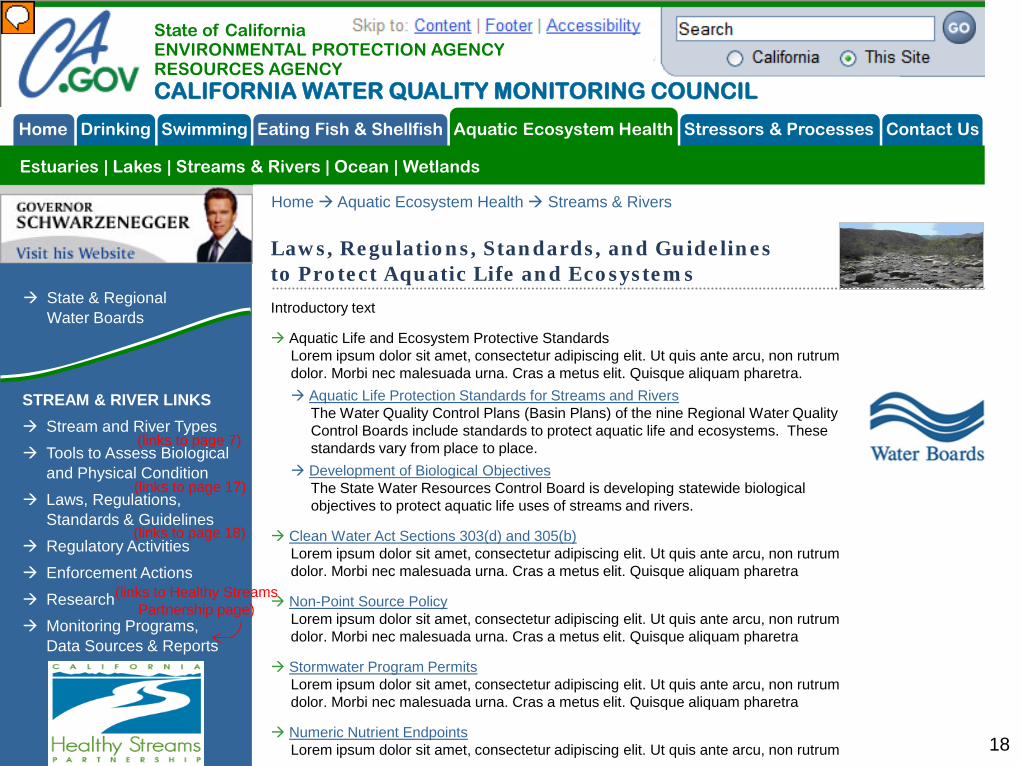
Laws, Regulations, Standards, and Guidelines to Protect Aquatic Life and Ecosystems Introductory text Aquatic Life and Ecosystem Protective Standards Lorem ipsum dolor sit amet, consectetur adipiscing elit. Ut quis ante arcu, non rutrum dolor. Morbi nec malesuada urna. Cras a metus elit. Quisque aliquam pharetra.
Aquatic Life Protection Standards for Streams and Rivers The Water Quality Control Plans (Basin Plans) of the nine Regional Water Quality Control Boards include standards to protect aquatic life and ecosystems. These standards vary from place to place.
Development of Biological Objectives The State Water Resources Control Board is developing statewide biological objectives to protect aquatic life uses of streams and rivers. Clean Water Act Sections 303(d) and 305(b) Lorem ipsum dolor sit amet, consectetur adipiscing elit. Ut quis ante arcu, non rutrum dolor. Morbi nec malesuada urna. Cras a metus elit. Quisque aliquam pharetra Non-Point Source Policy Lorem ipsum dolor sit amet, consectetur adipiscing elit. Ut quis ante arcu, non rutrum dolor. Morbi nec malesuada urna. Cras a metus elit. Quisque aliquam pharetra Stormwater Program Permits Lorem ipsum dolor sit amet, consectetur adipiscing elit. Ut quis ante arcu, non rutrum dolor. Morbi nec malesuada urna. Cras a metus elit. Quisque aliquam pharetra Numeric Nutrient Endpoints Lorem ipsum dolor sit amet, consectetur adipiscing elit. Ut quis ante arcu, non rutrum
(links to page 7)
(links to page 17)
(links to page 18)
(links to Healthy Streams Partnership page)