links 1 what is the potential income for some really tough and dirty jobs? how do these salaries...
TRANSCRIPT

Links
1
What is the potential income for some really
tough and dirty jobs?
How do these salaries compare with what some
would call clean jobs in Human Services?*
Prepared for SSAC byPolly McMahon, PhDSpokane Falls Community College
© The Washington Center for Improving the Quality of Undergraduate Education. All rights reserved. *2008*
Support Quantitative Concepts and Skills
Number sense: AverageNumber sense: PercentagesVisualizing data: Bar Graphs
SSAC2007:HF5549.PM1.1
Dirty Jobs vs. Clean Jobs – A Comparison of Salaries
*Human Services: to plan, manage, and provide social and related community services.
Core Quantitative Concept and Skill
Making Comparisons: Percentage Difference

Links
2
What are “Dirty Jobs”
anyway?
You will use direct comparisons to explore the differences.
Problem
What are income expectations
for really dirty jobs?
How does this compare with
other types of jobs?
CLICK IT!
Links
3
Your teachers may reflect on their early years as a time when they did physically demanding and sometimes risky work. Often they did this work to support educational ventures that would lead to a less risky and often a less physically demanding career. These early jobs may be seen as “Dirty Jobs.”
For students in Human Services often the only ideal that is realized is that you enjoy helping people and want to earn a solid income. However, there is often little, if any, research done to compare salaries and possibilities in this wide open field. There is quite a difference between a job that is done for survival or just getting to the next step in life and one that fills a heart and mind with passion and a deep-seated quest for lifelong learning.
In this module you are asked to research some of the most challenging, the most dirty, and perhaps the most risky of jobs and compare them with other Human Service jobs that may be less risky and demanding.
Problem
What jobs pay the most according to government pay rates?

Links
4
On average, do “Dirty Jobs” or “Clean Jobs” pay more?
Comparison of Salaries
= Cell with a number in it
= Cell with a formula in it
Your first assignment in this module (Slide 6) will be to make a spreadsheet like this one to compare five clean jobs and dirty jobs you select from the Bureau of Labor Statistics Website.
B C D E
2 Really Dirty and Rough Jobs3 Road Kill Grounds Keeper. $24,6904 Embalmers $33,1705 Septic Tank Worker $21,4406 Bug Breeder $23,0807 Fish Gutter $22,0608 Roach Killer $25,0709 Worm Poop Remover, Pest Hanlder $30,40010 Termite Exterminator $25,99011 Cow Hoof Trimmer $22,77012 Parasite Remover $25,07013 Hot Tar Roofer $29,9801415 Average $25,7931617 Not so Dirty Jobs1819 Individual and Family Services $37,53020 Local Government $42,67021 School Social Workers $53,06022 Home Health Care $48,30023 Beginning Level Social Worker $25,42824 Developmental Disabilities Manager Trainee $32,80825 Sex Offender Treatment Specialist $40,6922627 Average $40,070
From US Labor Bureau and State Govt Sites

Links
5
Using a Spreadsheet to assess “Dirty Jobs” vs. “Clean Jobs”
Assignments
You have four assignments to complete in this module. All of the assignments use the spreadsheet program Excel. Follow the directions in each assignment and submit the result as an email attachment or submit it through Blackboard as an email attachment.
PreparationYou should become familiar with the basics of the Excel spreadsheet program. You can click on the Links icon at the top right of this page to go to the Links page. There are several tutorials to view. Also within the assignment pages there are similar links to useful information regarding the assignment.
Slide 6 Assignment 1: Researching Labor StatisticsThis assignment guides you through exploration of labor statistics and entering some of that information into a spreadsheet where you will find the average salary of two types of jobs.
Slide 7 Assignment 2: Making Bar GraphsIn creating a Bar Graph from your spreadsheet data you can use your existing spreadsheet data developed for your Labor Statistics research assignment.
Slide 8-9 Assignment 3: Quantifying the DisparityAgain, drawing on your existing spreadsheet, you will create two additional columns to display the percentage differences of salary between Dirty Jobs and Clean Jobs.
Slide 11 Assignment 4: Demonstrating Your UnderstandingAfter you complete the first three assignments in this module, you will answer some final questions to demonstrate your understanding of the material.
Links
6
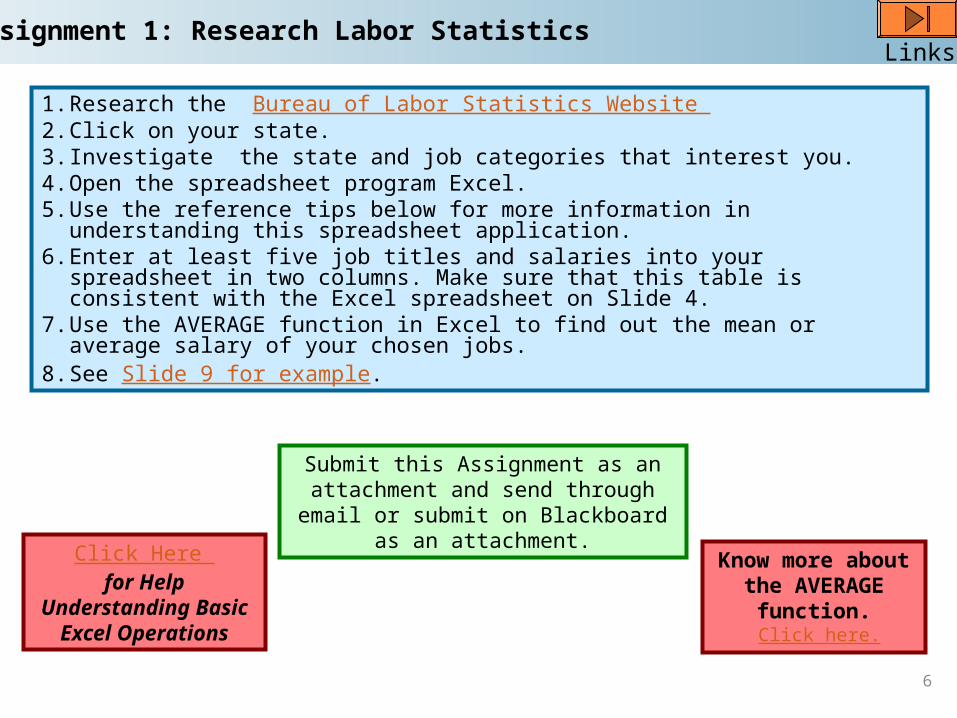
1. Research the Bureau of Labor Statistics Website 2. Click on your state. 3. Investigate the state and job categories that interest you. 4. Open the spreadsheet program Excel.5. Use the reference tips below for more information in understanding this
spreadsheet application. 6. Enter at least five job titles and salaries into your spreadsheet in two columns.
Make sure that this table is consistent with the Excel spreadsheet on Slide 4.7. Use the AVERAGE function in Excel to find out the mean or average salary of
your chosen jobs.8. See Slide 9 for example.
Submit this Assignment as an attachment and send through email or
submit on Blackboard as an attachment.
Assignment 1: Research Labor Statistics
Click Here for Help
Understanding Basic Excel Operations
Know more about the AVERAGE
function. Click here.

Links
7
Assignment Details for Bar Graph Design
1.Open the Excel application file which you created to research Labor Statistics.
2.Click on the link found at the bottom right side of this box for hints on developing a basic bar graph.
3.Use your own average salaries from the Bureau of Labor Statistics Website or from the reference spreadsheet on Slide 4.
4.Enter these averages in two columns.5.Use the Chart Function in Excel to create your Bar Graph based
on those columns.6. See Slide 9 for example.
Submit this Assignment as an attachment and send through email or submit on Blackboard as an attachment.
Assignment 2: Drawing Bar Graphs
Click Here for Help Developing a Basic
Bar Graph

Links
8
Assignment Details for Percentages
1. Open the Excel application file which you created to research Labor Statistics.
2. You can use your own average salaries from the Bureau of Labor Statistics Website or from the reference spreadsheet on Slide 4. This time list the highest paying job first then the rest in descending order. Do this for “Dirty Jobs” in one column and “Clean Jobs” in an adjacent column.
3. The remaining cells in the column will relate to the 2nd, 3rd, 4th and 5th jobs etc.
4. See Slide 10 for examples of quantitative comparisons.
Assignment 3: Quantifying the Disparity
Click Here for Help Understanding Basic Excel Operations
There are various ways of using numbers to make a comparison between disparate quantities. For example if one length is 4 feet and another is 3 feet, you can say that the first is 33% longer than the second. Or you can say that the second is 25% shorter than the first. Or you can say that the first is 133% as large as the second. Or you can say that the second is 75% as large as the first. It is important that you understand why these numbers are the way they are. It may seem easy, but people commonly make mistakes. For example, let’s say the first length is 4 feet, and the second length is 12 feet. Then, it would be a mistake to say that the second is three times longer than the first. Any of the following would be correct: (1) The second is three times as long as the first; (2) the second is two times longer than the first; or (3) the second is 200% longer than the first.

Links
9
Submit this Assignment as an attachment and send through email or submit on Blackboard as an attachment.
COMPARISONS
Arrange the salaries into two side-by-side lists in a new spreadsheet (Assignment 1). Return to Assignment 1.
Make column graphs of the first five jobs which show a direct comparison! (Assignment 2). Return to Assignment 2.
Click Here for Help Understanding
Basic Excel Operations
B C D2 Comparisons3 Dirty J ob Clean J ob4 First $30,000 $40,0005 Second $22,000 $30,0006 Third $21,000 $25,0007 Fourth $20,000 $20,0008 Fifth $19,000 $18,000

Links
10
Describing the Comparison in Words
RELATIVE DIFFERENCES
Return to Assignment 3
Be sure you understand the meaning of the statements in the last column.
B C D E F 2 Comparisons3
4 A Dirty J ob Clean J ob Difference "Clean pays ?% more than Dirty"5 First $30,000 $40,000 $10,000 33%6 Second $22,000 $30,000 $8,000 36%7 Third $21,000 $25,000 $4,000 19%8 Fourth $20,000 $20,000 $0 0%9 Fifth $19,000 $18,000 -$1,000 -5%1011 Average $22,400 $26,600 $4,200 19%12
13 B Dirty J ob Clean J ob Difference "Dirty pays ?% less than Clean"14 First $30,000 $40,000 $10,000 25%15 Second $22,000 $30,000 $8,000 27%16 Third $21,000 $25,000 $4,000 16%17 Fourth $20,000 $20,000 $0 0%18 Fifth $19,000 $18,000 -$1,000 -6%1920 Average $22,400 $26,600 $4,200 16%21
22 C Dirty J ob Clean J ob Difference "Clean pays ?% as much as Dirty"23 First $30,000 $40,000 $10,000 133%24 Second $22,000 $30,000 $8,000 136%25 Third $21,000 $25,000 $4,000 119%26 Fourth $20,000 $20,000 $0 100%27 Fifth $19,000 $18,000 -$1,000 95%2829 Average $22,400 $26,600 $4,200 119%30
31 D Dirty J ob Clean J ob Difference "Dirty pays ?% as much as Clean"32 First $30,000 $40,000 $10,000 75%33 Second $22,000 $30,000 $8,000 73%34 Third $21,000 $25,000 $4,000 84%35 Fourth $20,000 $20,000 $0 100%36 Fifth $19,000 $18,000 -$1,000 106%3738 Average $22,400 $26,600 $4,200 84%

Links
11
Final Questions
1. What is a good source for labor statistics?2. What is the purpose of the AVERAGE function in the application
Excel?3. Which function is used in Excel to create a bar graph?4. If 25 out of 100 people earn less money than the norm what is this
number in terms of percentage?5. The Excel application program is also called a ______________.6. What is the difference between a row and a column in a
spreadsheet?7. Give some examples of higher paying “Dirty Jobs”.8. Give some examples of higher paying “Clean Jobs”.9. Give an example of a spreadsheet formula.10. Describe quantitatively in words the disparity in salary between a
job paying $100,000 per year and one paying $25,000 per year.
Submit this Assignment as an attachment and send through email or submit on Blackboard as an attachment.
Assignment 4: Some Final Questions

Links
12
The choices we make in careers are influenced by many factors. Passion, education, lifestyle, compensation and other choices guide us.
Will a good career choice make us happy in this area of our lives?
Dan Gilbert, a psychology professor at Harvard, and author of “Stumbling on Happiness” gave a talk at the TED conference in 2004. You can see it here. You may be intrigued on several levels by viewing his talk on happiness.
We have explored “Dirty Jobs” vs “Clean Jobs” but the so-called obvious choices between jobs may or may not make us happy.
Skills gained:In researching the Bureau of Labor Statistics Website you found two types of jobs and created a formula in an Excel spreadsheet which allowed you to compare salaries and find an average salary. You then viewed the differences expressed in percentages for each of the two types of jobs and created a bar graph as a way to visualize the data. Finally, you considered the various ways of using words to compare the salaries.
A Spreadsheet can be a wonderful tool to explore our world. We hope you enjoyed this journey into the world of “Dirty Jobs” vs “Clean Jobs”.
Closing Thoughts
Links
13
References and End Notes
LINKSHow to Use ExcelTutorials collected by SERC
How to Use Excel
University of South Dakota
Excel Tutorial
Clemson Physics Lab
Excel Average Function
Tech On The Net
Dirty Jobs Song
Discovery Channel / YouTube.com
Spreadsheets Across The Curriculum
SSAC
Dan GilbertTED 2004 on the subject of happiness.
Back to Slide 5