linking theoretical decision-making mechanisms in the
TRANSCRIPT

HAL Id: hal-01401203https://hal-amu.archives-ouvertes.fr/hal-01401203
Submitted on 23 Nov 2016
HAL is a multi-disciplinary open accessarchive for the deposit and dissemination of sci-entific research documents, whether they are pub-lished or not. The documents may come fromteaching and research institutions in France orabroad, or from public or private research centers.
L’archive ouverte pluridisciplinaire HAL, estdestinée au dépôt et à la diffusion de documentsscientifiques de niveau recherche, publiés ou non,émanant des établissements d’enseignement et derecherche français ou étrangers, des laboratoirespublics ou privés.
Linking Theoretical Decision-making Mechanisms in theSimon Task with Electrophysiological Data: AModel-based Neuroscience Study in HumansMathieu Servant, Corey White, Anna Montagnini, Boris Burle
To cite this version:Mathieu Servant, Corey White, Anna Montagnini, Boris Burle. Linking Theoretical Decision-makingMechanisms in the Simon Task with Electrophysiological Data: A Model-based Neuroscience Studyin Humans. Journal of Cognitive Neuroscience, Massachusetts Institute of Technology Press (MITPress), 2016, 28 (10), pp.1501-1521. �10.1162/jocn_a_00989�. �hal-01401203�
Linking Theoretical Decision-making Mechanisms inthe Simon Task with Electrophysiological Data: A
Model-based Neuroscience Study in Humans
Mathieu Servant1,2, Corey White3, Anna Montagnini1, and Borís Burle1
Abstract
■ A current challenge for decision-making research is in ex-tending models of simple decisions to more complex and eco-logical choice situations. Conflict tasks (e.g., Simon, Stroop,Eriksen flanker) have been the focus of much interest, becausethey provide a decision-making context representative of every-day life experiences. Modeling efforts have led to an elaborateddrift diffusion model for conflict tasks (DMC), which imple-ments a superimposition of automatic and controlled decisionactivations. The DMC has proven to capture the diversity of be-havioral conflict effects across various task contexts. This study
combined DMC predictions with EEG and EMG measurementsto test a set of linking propositions that specify the relationshipbetween theoretical decision-making mechanisms involved inthe Simon task and brain activity. Our results are consistentwith a representation of the superimposed decision variablein the primary motor cortices. The decision variable was alsoobserved in the EMG activity of response agonist muscles. Thesefindings provide new insight into the neurophysiology of humandecision-making. In return, they provide support for the DMCmodel framework. ■
INTRODUCTION
Formal models of perceptual decision-making have tradi-tionally focused on simple two-choice situations. Suchmodels share the assumption that sensory evidence isaccumulated until a criterion quantity of evidence is ob-tained, at which point from where the decision termi-nates in a choice and motor activity is engaged (Bogacz,Brown, Moehlis, Holmes, & Cohen, 2006; Ratcliff & Smith,2004). However, observers typically face decisions basedon multiple streams of sensory information, each of thembeing associated with multiple response alternatives.Extending decision-making models to more complex andecological choice situations has recently been the focusof much interest.Although the majority of studies seeking to address
complex decisions have dealt with multiple-choice tasks(e.g., Keuken et al., 2015; Ratcliff & Starns, 2013; VanMaanenet al., 2012; Leite & Ratcliff, 2010; Albantakis & Deco, 2009;Churchland, Kiani, & Shadlen, 2008; Usher & McClelland,2004), others have started to uncover the mechanismsunderlying decisions about relevance (Ulrich, Schröter,Leuthold, & Birngruber, 2015; Servant, Montagnini, &Burle, 2014; White, Ratcliff, & Starns, 2011; Hübner,Steinhauser, & Lehle, 2010). These studies have focusedon the conflict paradigm, where task-relevant and task-irrelevant stimulus attributes compete for response acti-
vation. In the Simon task, for example, participants areinstructed to press a left or right button according to thecolor of a lateralized stimulus (e.g., left response to a bluetarget, right response to a red target). Although the loca-tion of the stimulus is task irrelevant, it interferes in the de-cision process: Responses are slower and less accuratewhen stimulus location and response side do not cor-respond (incompatible trial) than when they do (compati-ble trial), a phenomenon known as the “Simon effect”(Hommel, 2011; Simon & Small, 1969).
Performance in the Simon task is challenging for for-mal decision-making models for at least two reasons.First, errors are faster than correct responses in theincompatible condition only (Van den Wildenberg et al.,2010). Second, distributional analyses have revealedthat the Simon effect decreases as RT increases (Pratte,Rouder, Morey, & Feng, 2010; Ridderinkhof, 2002), imply-ing that the condition with the longer mean RT also showsthe smaller spread of RT (Schwarz & Miller, 2012). Theseparticular patterns are not naturally predicted by stan-dard decision-making theories (Servant et al., 2014; Whiteet al., 2011; Hübner et al., 2010; Wagenmakers & Brown,2007; Luce, 1986). Ulrich et al. (2015) have recently intro-duced an extension of the drift diffusion model of percep-tual decision-making (Ratcliff & McKoon, 2008; Ratcliff,1978) able to capture RT distributions and accuracy datain the Simon task, allowing for decomposition and quan-tification of latent cognitive processes (hereafter referredto as diffusion model for conflict tasks [DMC]). The aimof the present work was to use the DMC as a tool to
1Aix-Marseille Université, CNRS, 2Vanderbilt University, 3SyracuseUniversity
© 2016 Massachusetts Institute of Technology Journal of Cognitive Neuroscience 28:10, pp. 1501–1521doi:10.1162/jocn_a_00989
better interpret human electrophysiological measure-ments in the Simon task. More precisely, we combinedDMC predictions with EEG and EMG measurements totest a set of linking propositions (Schall, 2004; Teller,1984) that specify the relationship between cognitiveprocesses involved in the Simon task and brain activity.We first introduce the DMC architecture and elaboratesome linking propositions afterwards.
DMC Architecture
The standard drift diffusion model assumes continuousand perfect accumulation of the difference betweennoisy samples of task-relevant sensory information sup-porting alternative choices. Technically speaking, accu-mulation grows toward one of two decision terminationbounds b (correct decision) and −b (incorrect decision)according to
dx ¼ μdt þ σdW
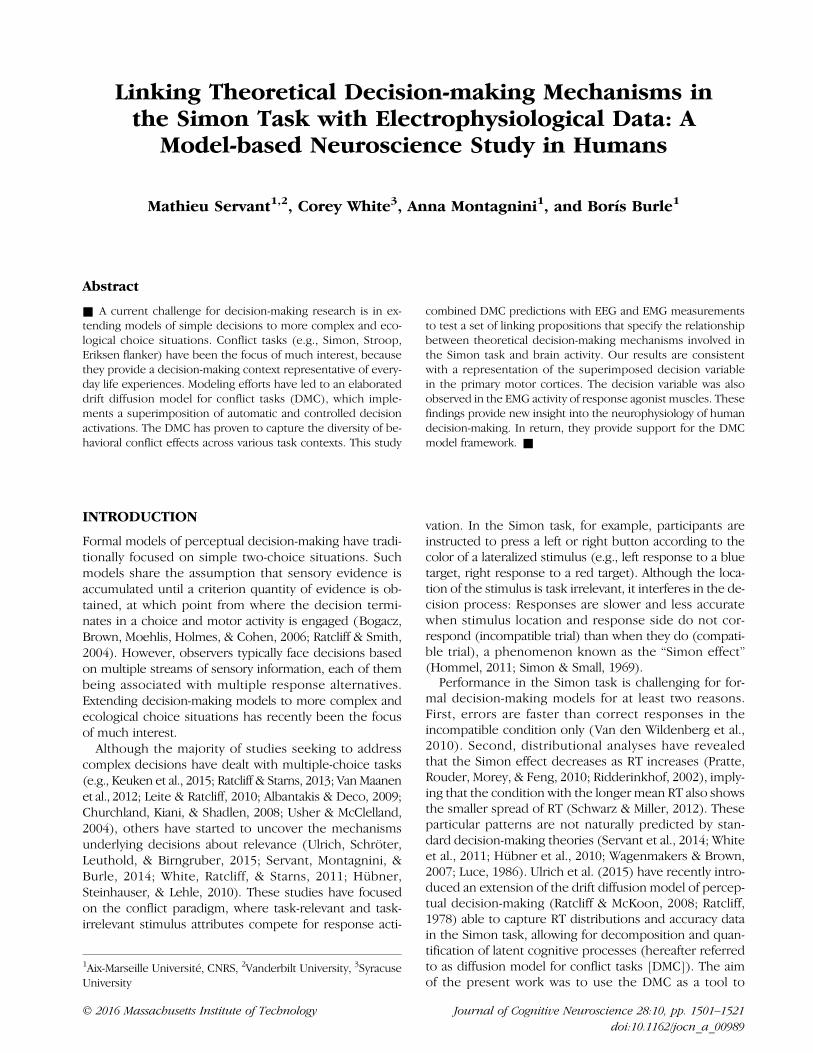
where dx represents the change in accumulated evi-dence x for a small time interval dt, μ is the drift rate(i.e., the average increase of evidence in favor of the cor-rect choice per time unit), and σdW denotes Gaussianlydistributed white noise (Wiener process) with mean 0and variance σ2dt. The DMC preserves this controlleddecision-making mechanism (Figure 1, left) but assumesan additional automatic process that operates on task-irrelevant sensory information (e.g., the location of thestimulus in the Simon task). The automatic process brief-ly spills over to the decision-making process. Decision-making is thus determined by superimposed activations ofautomatic and controlled processes, an architecture remi-niscent of a model of attention and automaticity proposedby Logan (1980).
The expected mean of the noisy automatic activation Xa(t)is modeled as a scaled gamma function of the following form:
E Xa tð Þ½ � ¼ Ae−t=τ tea − 1ð Þτ
� � a−1ð Þ
where a is the shape parameter of the function and A is itspeak amplitude. The peak latency is located at τ(a − 1), τbeing the characteristic time parameter. This pulse-likefunction represents the short-living contribution of theautomatic process to decision-making and favors thecorrect (incorrect) response in compatible (incompati-ble) trials (Figure 1, middle). Its first derivative with re-spect to time is the time-varying drift rate μa(t) of theautomatic process. Let μc denote the (time-constant)drift rate of the controlled process. The time-varyingdrift rate of the superimposed process is simply thesum of μa(t) and μc (Figure 1, right). The model gen-erates a correct (incorrect) response when the super-imposed process hits the correct (incorrect) terminationbound b (−b). In compatible trials, automatic and con-trolled processes converge on activation of the correctresponse, thereby facilitating RT and accuracy. In in-compatible trials, the early incorrect automatic activa-tion hampers the decision process and increases thelikelihood of an incorrect choice. Ulrich et al. (2015)demonstrated that the DMC captures all the behavioralpeculiarities of Simon task performance. Moreover, themodel can explain data from other conflict tasks byvariations in the characteristic time parameter τ of thegamma automatic activation.
Linking Propositions
When perceptual decisions are assigned to particularactions through task instructions, mounting evidencefrom human neuroimaging and single-unit physiology inbehaving monkeys shows that the decision variable is
Figure 1. Architecture ofthe DMC. The decisionprocess is modeled as thesuperimposition of automaticand controlled drift diffusionprocesses. The expected mean(i.e., accumulated drift rate)of each process is illustrated.See text for details. z =starting point of evidenceaccumulation; b = upperdecision termination bound(correct response); −b = lowerdecision termination bound(incorrect response).
1502 Journal of Cognitive Neuroscience Volume 28, Number 10
represented in motor structures that prepare and executethe response (e.g., Kelly & O’Connell, 2013; O’Connell,Dockree, & Kelly, 2012; Purcell, Schall, Logan, & Palmeri,2012; Selen, Shadlen, & Wolpert, 2012; Purcell et al.,2010; Donner, Siegel, Fries, & Engel, 2009; Ratcliff,Cherian, & Segraves, 2003; Romo, Hernandez, Zainos,Lemus, & Brody, 2002; Gold & Shadlen, 2000; Hanes& Schall, 1996). These findings suggest a continuousflow of information from decision to motor brain regions(Cisek & Kalaska, 2010; Gold & Shadlen, 2007). Recently,Kelly and O’Connell (2013) have argued that the lateralizedreadiness potential (LRP1), an EEG marker of unimanualmotor preparation, reflects key properties of the theoreti-cal decision variable. In particular, the LRP exhibits rise-to-threshold dynamics (see also Gratton, Coles, Sirevaag,Eriksen, & Donchin, 1988), the slope of which scales withthe quality of sensory information in a meaningful way. TheLRP, however, is blind to the contribution of each motorcortex (M1). A more precise measure can be obtained byapplying a current source density (CSD) transformation toEEG signals. CSD refers to a group of mathematical trans-
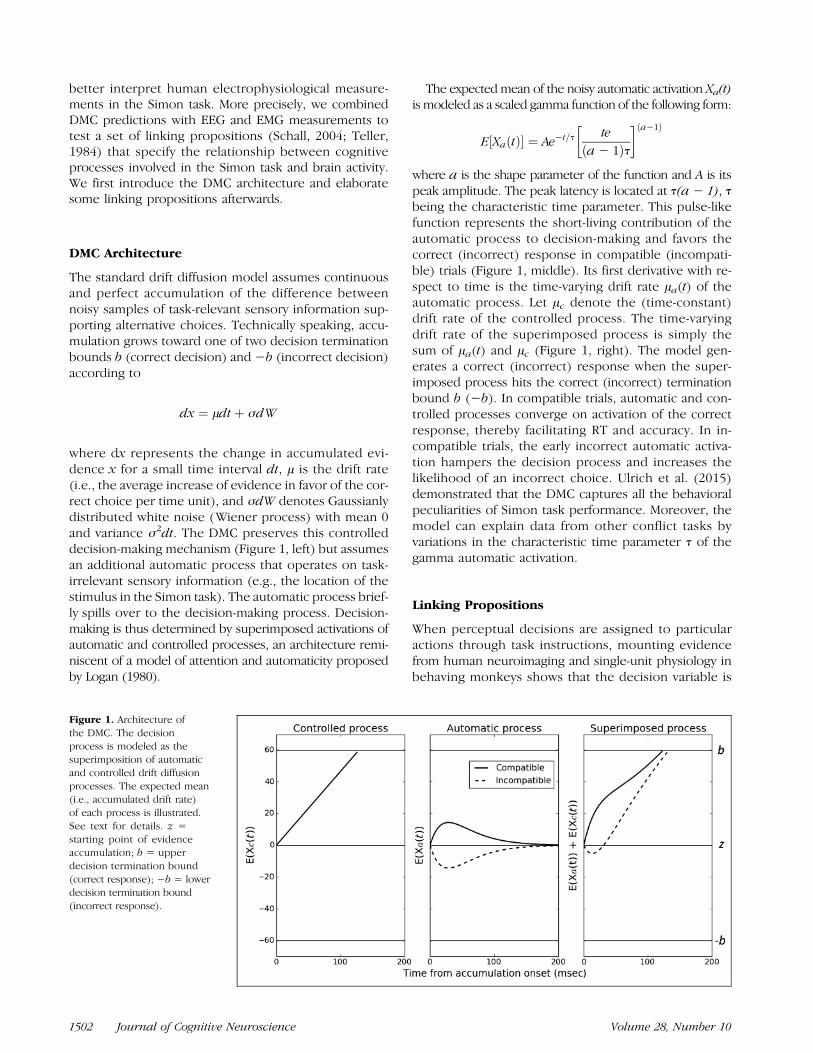
formations that compute estimates of the cortical currentflowing radially through the skull (Burle et al., 2015; Kayser& Tenke, 2015), providing a good approximation of thecorticogram (Gevins et al., 1987). Contrary to the LRP,CSD methods allow isolation of the electrical activity fromeach M1. In two-choice tasks, they have revealed a devel-oping negativity over M1 contralateral to the responsealong with a developing positivity over M1 ispilateral(Burle, Van den Wildenberg, Spieser, & Ridderinkhof,in press; Vidal et al., 2011; Meckler et al., 2010; Vidal,Grapperon, Bonnet, & Hasbroucq, 2003). These compo-nents peak around the onset of EMG activity responsiblefor the response (Figure 2A). Converging results fromcorticograms, intracortical data and stimulation studiesindicate that the contralateral negativity corresponds toan activation of the motor command whereas the ipsi-lateral positivity corresponds to an inhibition of the non-required response (reviewed by Burle, Vidal, Tandonnet,& Hasbroucq, 2004; see also Meckler et al., 2010). Capital-izing upon these findings, the first linking propositionconjectures that the activation/inhibition EEG pattern
Figure 2. Putative electrophysiological markers of the decision variable. (A) Typical CSD-converted scalp potentials observed over the motor corticesin two-choice tasks involving left and right manual responses (adapted from Vidal et al., 2003). Top: Averaged CSD activities over M1 contralateral(blue trace) and M1 ispsilateral (red trace) to the responding hand time-locked to EMG onset. The contralateral negativity corresponds to anactivation of the motor command whereas the ipsilateral negativity corresponds to an inhibition of the nonrequired response. Bottom: Monopolarversus CSD topographic maps at EMG onset. The CSD transformation eliminates blurring effects caused by volume conduction, hence isolating theelectrical activity of each motor cortex. (B) EMG activity (in μV) in the muscles involved (Correct EMG, top) and not involved (Incorrect EMG,bottom) in the required response as a function of time (in msec) from stimulus onset. The correct response is preceded by a small EMG burst in theincorrect channel, called a “partial error.” RT = RT from stimulus onset to the mechanical response; PE = partial error; CT = correction time (fromthe incorrect EMG activation to the correct one); MT = motor time (from the correct EMG activation to the correct response).
Servant et al. 1503
over M1s is the neural signature of the controlled deci-sion process hypothesized by drift diffusion models.Specifically, activation and inhibition components wouldreflect accumulated task-relevant sensory evidence forand against the chosen response alternative. To test thishypothesis, we manipulated the quality of the task-relevantcolor evidence in the Simon task and conducted simul-taneous EEG and EMG recordings. If Linking Proposition1 holds, then rising slopes of activation and inhibitionEEG components should decrease as the quality of colorevidence decreases and exhibit high anticorrelation.
Electrophysiological findings in the Simon task suggestthat the location-based automatic activation reaches themotor system. The LRP usually shows an early positivedip in incompatible trials only, presumably reflecting an ac-tivation of the incorrect response (reviewed by Leuthold,2011). Moreover, EMG recordings have revealed covert in-correct EMG activation (“partial error”; Figure 2B) in a por-tion of trials where the correct response was finally issued.Partial errors are more frequent in incompatible comparedwith compatible trials, suggesting that the automatic activa-tion reaches the peripheral muscular level (reviewed byVan denWildenberg et al., 2010). On the basis of these find-ings, the second linking proposition expands upon the for-mer in assuming that the activation/inhibition EEG patternover M1s in the Simon task reflects the superimposed dif-fusion process posited by DMC. To test this hypothesis,we first fit the DMC to each individual behavioral dataset. Best-fitting parameters were then used to computethe time course of the expectedmean of the superimposeddiffusion process. Finally, the grand-averaged time courseof the superimposed process was compared against thegrand-averaged time course of the activation/inhibitionEEG pattern. A comparison of EEG signals with and withoutpartial error trials was also conducted to gain insight intothe contribution of the automatic process.
The final linking proposition builds upon our recentcomputational work, suggesting that EMG activity inconflict tasks reflects up-to-date information about the de-cision (Servant, White, Montagnini, & Burle, 2015). We pro-vide an empirical test of this hypothesis by analyzing howpartial errors and correct EMG bursts scale with the qualityof task-relevant color evidence and how such scaling relatesto the theoretical decision variable of DMC. We finally showhow the model can be extended to account for EEG andEMG profiles simultaneously and explore consequencesof this extension on decision thresholds.
METHODS
Participants
Fourteen students (mean age = 23.5 years, SD= 3.4 years,10 women) from the University of Aix-Marseille partici-pated in the study and were paid A15/hr. They were notaware of the purpose of the experiment and reported tohave normal or corrected-to-normal vision and normalcolor vision. This experiment was approved by the ethical
committee of the Aix-Marseille University and by the“Comité de Protection des Personnes Sud Méditerrannée1” (Approval No. 1041). Participants gave their informedwritten consent according to the Declaration of Helsinki.
Task Design
Participants performed a Simon task in which the percep-tual saturation (i.e., discriminability) of the task-relevantcolor was manipulated (Servant et al., 2014; Hommel,1994). The task was programmed in Python 2.7 (www.python.org), using components of the Psychopy tool-box (Peirce, 2007). Participants were instructed to pressa right or left button with the corresponding thumb accord-ing to the color (blue or red) of a target circle (radius =0.32°) centered 1.6° to the left or right of fixation (0.2° ×0.2° gray cross). Colored circles were presented againsta black background. Color saturation was varied alongthe CIE Lightness Chroma Hue device-independent2 color-imetric space (Commission Internationale de l’éclairage,1976), specifically designed to accurately match color per-ception. Chroma quantifies the percentage of saturation.Red (hue = 30°) and blue (hue = 280°) colors alwayshad the same lightness (L = 51), corresponding to a lumi-nance of approximately 19 cd/m2 (the lightness of thegray fixation cross was also adjusted to 51). Three supra-threshold chroma levels (low quality of sensory evidence:15%, medium quality: 25%, high quality: 60%) were chosento obtain approximately similar mean RT differences be-tween each level pair 15–25% and 25–60%. We previouslydemonstrated that mean RT decreases as a power func-tion of chroma intensity in the Simon task (see Figure 6in Servant et al., 2014), a phenomenon known as Piéron’slaw (Piéron, 1913). Color calibration was performed bymeans of a Brontes colorimeter (Admesy B.V., Ittervoort,the Netherlands). Response buttons were fixed on the topof two plastic cylinders (3 cm in diameter, 7 cm in height,10 cm separation between buttons), and button closureswere transmitted to the parallel port of the computer toreach high temporal precision.The experiment took place in a dark and sound-
shielded Faraday cage. Participants were seated in a com-fortable chair 180 cm in front of a CRT monitor with arefresh rate of 75 Hz. Each trial started with a fixationcross whose duration was a random draw from a uniformdistribution bounded at 400 and 1200 msec. A targetcircle was then displayed and remained on-screen untilthe participant responded, with a maximum duration of1000 msec. The offset of the stimulus and fixation crossserved to indicate to the participants the beginning of theintertrial interval (1000 msec), during which they wereallowed to blink. Each trial was defined by a factorial com-bination of target location (left or right), target hue (redor blue), and chroma (three chroma levels). All types oftrials were equiprobable and presented in a pseudo-random order so that first-order compatibility sequences(i.e., compatible–incompatible: CI, CC, IC, II) occurred
1504 Journal of Cognitive Neuroscience Volume 28, Number 10
the same number of times. Chroma levels were pairedequally often with each of the possible compatibility se-quence. Half of the participants gave a right-hand re-sponse to a blue target and a left-hand response to ared target. This mapping was reversed for the other half.Participants were instructed to respond as fast and accu-rately as possible to the color of the target circle. Theyfirst performed 96 practice trials and worked through24 blocks of 96 trials, with a short rest between blocks.Practice trials were excluded from analyses. The experi-ment lasted approximately 105 min.
DMC Fitting
The DMC was fit to behavioral data using the methodproposed by Hübner (2014). The model was simulta-neously fit to the quantiles (0.1, 0.3, 0.5, 0.7, 0.9) of theRT distributions of correct responses and to the condi-tional accuracy functions (CAFs) of each individual dataset.3 CAFs represent accuracy as a function of time. Inthe Simon task, the incompatible condition is typically as-sociated with an early drop of accuracy, resulting in aconcave CAF shape (see Figure 5A, top). This particularpattern implies that incorrect responses are faster thancorrect responses. CAFs were constructed by sortingthe RT data into five bins of equal size; the proportionof errors in each RT bin was then computed, providingthe error data considered in the fitting procedure. Modelpredictions were obtained by running Monte Carlo simu-lations with an integration constant dt = 1 msec and adiffusion noise σ fixed at 4, similar to Ulrich et al. (2015).Predicted and observed data were compared through alikelihood ratio chi-square statistic, G2:
G2 ¼ 2X6i¼1
ni
X11j¼1
pij logpijπij
!
The outer summation over i extends over the three chromalevels in each compatibility condition. ni is the number ofvalid trials per condition. The inner summation over jextends over the 11 RT bins in each condition (6 binsbounded by RT quantiles of correct trials representing10%, 20%, 20%, 20%, 20%, 10% of the data and 5 CAF bins,each one representing 20% of the data). pij and πij are,respectively, the observed and predicted proportions ofresponses in bin j of condition i.The G2 statistic was minimized with a python implemen-
tation of the Nelder–Mead SIMPLEX algorithm (optimize.fmin function of the SciPy package; Jones et al., 2001)to obtain best-fitting parameters. Eighty thousand trialswere simulated for each condition and minimizationcycle. Because SIMPLEX is very sensitive to the initial para-metric guess, different sets of initial parameter valueswere used. These values were taken from uniform distri-butions U(a,b) centered on best-fitting parameters for theSimon task reported by Ulrich et al. (2015). For eachparameter, the bounds a and b of the uniform distribu-
tion were chosen to span a large space to reduce thelikelihood of reaching a local minimum.
Across-trial variability in starting point (uniformly dis-tributed with range σz) and nondecision time (normallydistributed with mean μr and variance σr) was incorpo-rated.4 To account for the color saturation manipulation,the drift rate of the controlled process μc was allowedto vary between chroma levels. The first model we fithad 10 free parameters (referred to as Model 1): upperdecision termination bound (b; lower bound = −b),shape (a), characteristic time (τ), and peak amplitude(A) of the gamma function, drift rate of the controlledprocess for 15% (μc15), 25% (μc25), and 60% (μc60) chromalevels, mean nondecision time (μr), across-trial variabilityin starting point (σz), and nondecision time (σr). Becausethe leading edge of the observed distribution of correctresponses was slightly shifted to the right as chroma de-creased, we fit an alternative model that also allowed themean nondecision time to vary between chroma levels.This alternative model (referred to as Model 2) had thus13 free parameters. Model selection was performed bycomputing a BIC statistic that penalizes models accordingto their number of free parameters f:
BIC ¼ G2 þ f logX6i¼1
ni
We found that Model 2 had significantly smaller G2 (M =87.1) and BIC (M= 185.8) values compared with Model 1(G2: M= 114.2; BIC: M= 191.4), p= .0004 and p= .037,respectively (paired-sample permutation tests based onsampling permutation distribution 5000 times). Conse-quently, we only report best-fitting parameters and pre-dictions of Model 2 in the following sections.
Electrophysiological Recordings andSignal Processing
EEG and EMG activities were sampled continuously from64 scalp locations conforming to the 10–20 positioningsystem (Chatrian, Lettich, & Nelson, 1988) using a BioSemiActive II system (BioSemi Instrumentation, Amsterdam,the Netherlands). Sampling rate was 1024 Hz. The EMGwas recorded from two electrodes pasted 2 cm aparton the thenar eminence, above the flexor pollicis brevis.Electrodes for vertical and horizontal electrooculogramwere respectively located at the Fp2 and below the righteye, and on each outer canthus.
Electrophysiological data were filtered offline (EEG:high-pass = 0.01 Hz; EMG: high-pass = 10 Hz). EEG datawere re-referenced to the right mastoid, and EMG elec-trodes were bipolarly referenced. Ocular artifacts wereremoved by independent component analysis underEEGLAB (Delorme & Makeig, 2004). Because the EEGsignals of some participants were substantially contami-nated by muscular activities, we used a Blind Source Sepa-ration Algorithm based on Canonical Correlation Analysis
Servant et al. 1505
(BSSCCA; De Clercq, Vergult, Vanrumste, Van Paesschen,& Van Huffel, 2006) implemented in the AAR plug-infor EEGLAB to remove EMG artifacts and keep as manytrials as possible in our analyses. Basically, the BSSCCAmethod projects the EEG signals into maximally auto-correlated components. Components with the lowestautocorrelation values are assumed to be related toEMG artifacts and are selected according to their spectralpower properties. Components having less than 10 timesmore average power in the EEG band than in the EMGband were considered EMG-related activities and re-moved. This criterion provided satisfying results. Remain-ing artifacts were removed manually (overall, 7.2% oftrials were rejected). CSD was estimated by computingthe surface Laplacian (SL)5 of brain potentials after spher-ical spline interpolation, using 3 as the degree of splineand a maximum of 15° for the Legendre polynomial. SLis directly proportional to the radial current flow at scalp(e.g., Perrin, Bertrand, & Pernier, 1987).
The onset of EMG activity of both hands was markedmanually after visual inspection. This method has provenmore efficient than automated algorithms (Van Boxtel,Geraats, Van den Berg-Lenssen, & Brunia, 1993), particu-larly for detecting small EMG bursts such as partial errors.The experimenter who processed the EMG signals wasunaware of the type of mapping and color saturationthe EMG traces corresponded to. Trials were classified“correct” or “error,” depending on whether button clo-sure took place in the correct or incorrect EMG channel.Among correct trials, trials in which an incorrect EMGactivity preceded the correct one (“partial error trials”;see Figure 2B) were dissociated from “pure correct trials.”
Data Analyses
Unless specified, all statistical analyses were performedby means of repeated-measures ANOVAs. Proportionswere arc-sine transformed before being submitted toANOVA to stabilize their variance (Winer, 1971). Datasphericity was assessed by Mauchly’s test (Mauchly,1940). When sphericity was violated, the statistic epsilonε was reported and a Greenhouse–Geisser correction(Greenhouse & Geisser, 1959) was applied. EEG analysesfocused on electrodes at standard sites C3 and C4, locatedabove the motor cortices (Koessler et al., 2009). Similarto previous work (e.g., Vidal et al., 2003, 2011), we foundthat the left- and right-hand responses elicited symmet-rical activities (i.e., the hand factor did not interact withany of our experimental factors in all analyses performed,all ps > .1). Consequently, these activities were mergedtogether. Left (odd) and right (even) electrodes respec-tively correspond to electrodes contralateral and ipsilateralto the responding hand (arbitrarymapping). Individual datasets were included into EMG analyses when the number ofpartial errors in each condition exceeded 20. All partici-pants fulfilled this criterion.
RESULTS
Behavior
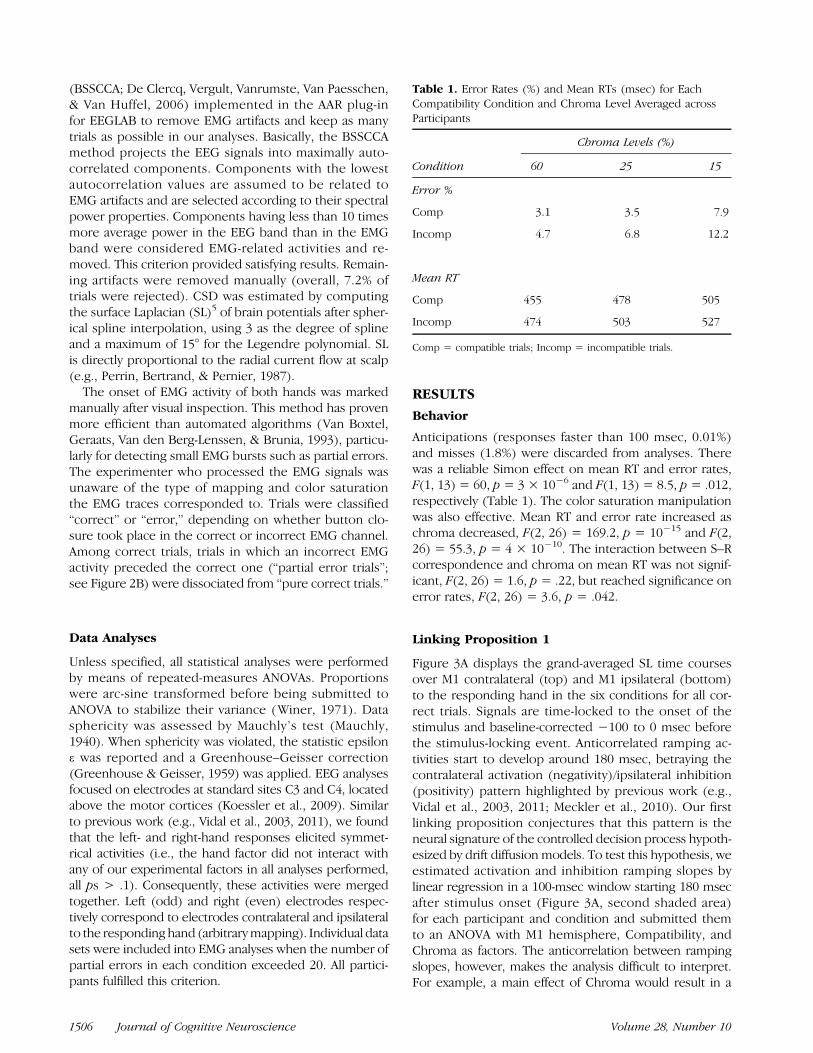
Anticipations (responses faster than 100 msec, 0.01%)and misses (1.8%) were discarded from analyses. Therewas a reliable Simon effect on mean RT and error rates,F(1, 13) = 60, p = 3 × 10⁻⁶ and F(1, 13) = 8.5, p = .012,respectively (Table 1). The color saturation manipulationwas also effective. Mean RT and error rate increased aschroma decreased, F(2, 26) = 169.2, p = 10−15 and F(2,26) = 55.3, p = 4 × 10⁻¹⁰. The interaction between S–Rcorrespondence and chroma on mean RT was not signif-icant, F(2, 26) = 1.6, p = .22, but reached significance onerror rates, F(2, 26) = 3.6, p = .042.
Linking Proposition 1
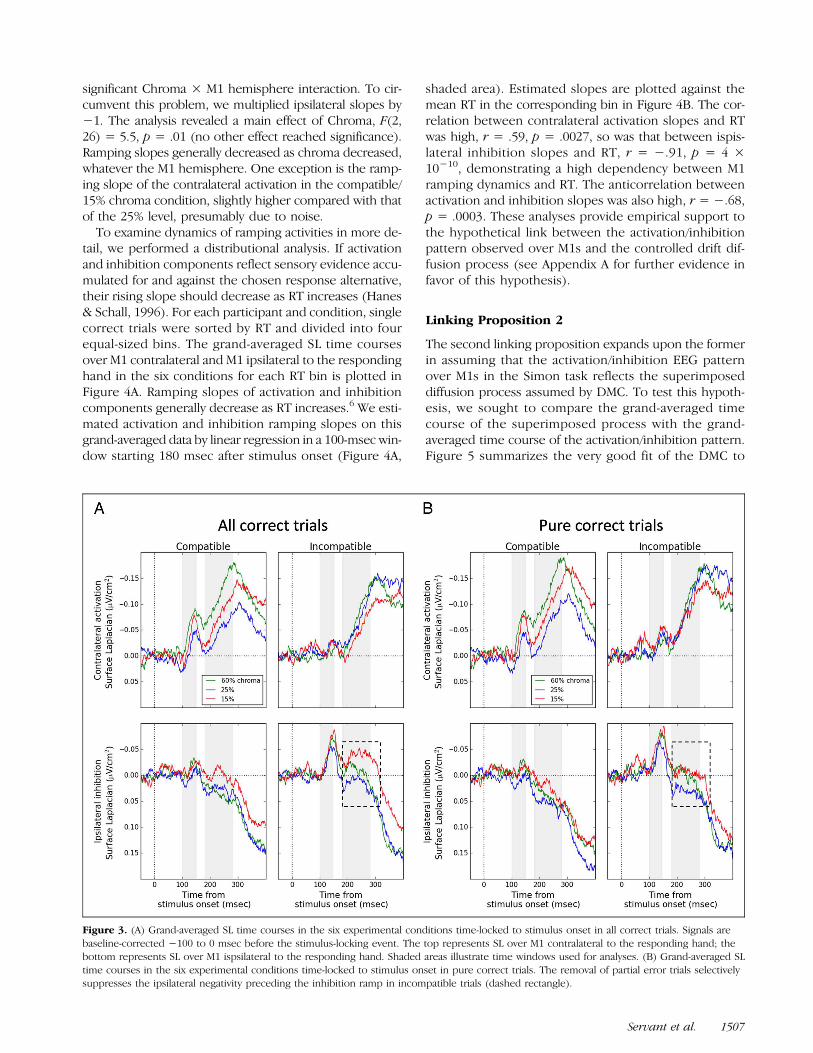
Figure 3A displays the grand-averaged SL time coursesover M1 contralateral (top) and M1 ipsilateral (bottom)to the responding hand in the six conditions for all cor-rect trials. Signals are time-locked to the onset of thestimulus and baseline-corrected −100 to 0 msec beforethe stimulus-locking event. Anticorrelated ramping ac-tivities start to develop around 180 msec, betraying thecontralateral activation (negativity)/ipsilateral inhibition(positivity) pattern highlighted by previous work (e.g.,Vidal et al., 2003, 2011; Meckler et al., 2010). Our firstlinking proposition conjectures that this pattern is theneural signature of the controlled decision process hypoth-esized by drift diffusion models. To test this hypothesis, weestimated activation and inhibition ramping slopes bylinear regression in a 100-msec window starting 180 msecafter stimulus onset (Figure 3A, second shaded area)for each participant and condition and submitted themto an ANOVA with M1 hemisphere, Compatibility, andChroma as factors. The anticorrelation between rampingslopes, however, makes the analysis difficult to interpret.For example, a main effect of Chroma would result in a
Table 1. Error Rates (%) and Mean RTs (msec) for EachCompatibility Condition and Chroma Level Averaged acrossParticipants
Condition
Chroma Levels (%)
60 25 15
Error %
Comp 3.1 3.5 7.9
Incomp 4.7 6.8 12.2
Mean RT
Comp 455 478 505
Incomp 474 503 527
Comp = compatible trials; Incomp = incompatible trials.
1506 Journal of Cognitive Neuroscience Volume 28, Number 10
significant Chroma × M1 hemisphere interaction. To cir-cumvent this problem, we multiplied ipsilateral slopes by−1. The analysis revealed a main effect of Chroma, F(2,26) = 5.5, p = .01 (no other effect reached significance).Ramping slopes generally decreased as chroma decreased,whatever the M1 hemisphere. One exception is the ramp-ing slope of the contralateral activation in the compatible/15% chroma condition, slightly higher compared with thatof the 25% level, presumably due to noise.To examine dynamics of ramping activities in more de-
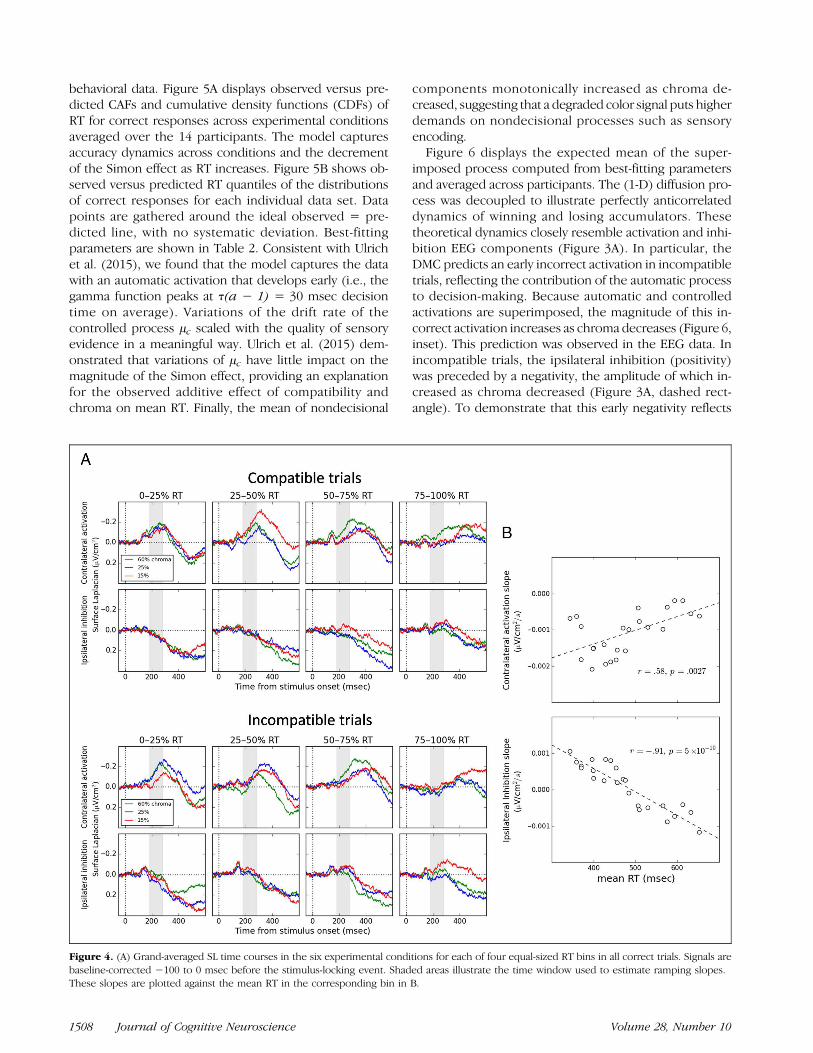
tail, we performed a distributional analysis. If activationand inhibition components reflect sensory evidence accu-mulated for and against the chosen response alternative,their rising slope should decrease as RT increases (Hanes& Schall, 1996). For each participant and condition, singlecorrect trials were sorted by RT and divided into fourequal-sized bins. The grand-averaged SL time coursesover M1 contralateral and M1 ipsilateral to the respondinghand in the six conditions for each RT bin is plotted inFigure 4A. Ramping slopes of activation and inhibitioncomponents generally decrease as RT increases.6 We esti-mated activation and inhibition ramping slopes on thisgrand-averaged data by linear regression in a 100-msec win-dow starting 180 msec after stimulus onset (Figure 4A,
shaded area). Estimated slopes are plotted against themean RT in the corresponding bin in Figure 4B. The cor-relation between contralateral activation slopes and RTwas high, r = .59, p = .0027, so was that between ispis-lateral inhibition slopes and RT, r = −.91, p = 4 ×10⁻¹⁰, demonstrating a high dependency between M1ramping dynamics and RT. The anticorrelation betweenactivation and inhibition slopes was also high, r = −.68,p = .0003. These analyses provide empirical support tothe hypothetical link between the activation/inhibitionpattern observed over M1s and the controlled drift dif-fusion process (see Appendix A for further evidence infavor of this hypothesis).
Linking Proposition 2
The second linking proposition expands upon the formerin assuming that the activation/inhibition EEG patternover M1s in the Simon task reflects the superimposeddiffusion process assumed by DMC. To test this hypoth-esis, we sought to compare the grand-averaged timecourse of the superimposed process with the grand-averaged time course of the activation/inhibition pattern.Figure 5 summarizes the very good fit of the DMC to
Figure 3. (A) Grand-averaged SL time courses in the six experimental conditions time-locked to stimulus onset in all correct trials. Signals arebaseline-corrected −100 to 0 msec before the stimulus-locking event. The top represents SL over M1 contralateral to the responding hand; thebottom represents SL over M1 ispsilateral to the responding hand. Shaded areas illustrate time windows used for analyses. (B) Grand-averaged SLtime courses in the six experimental conditions time-locked to stimulus onset in pure correct trials. The removal of partial error trials selectivelysuppresses the ipsilateral negativity preceding the inhibition ramp in incompatible trials (dashed rectangle).
Servant et al. 1507
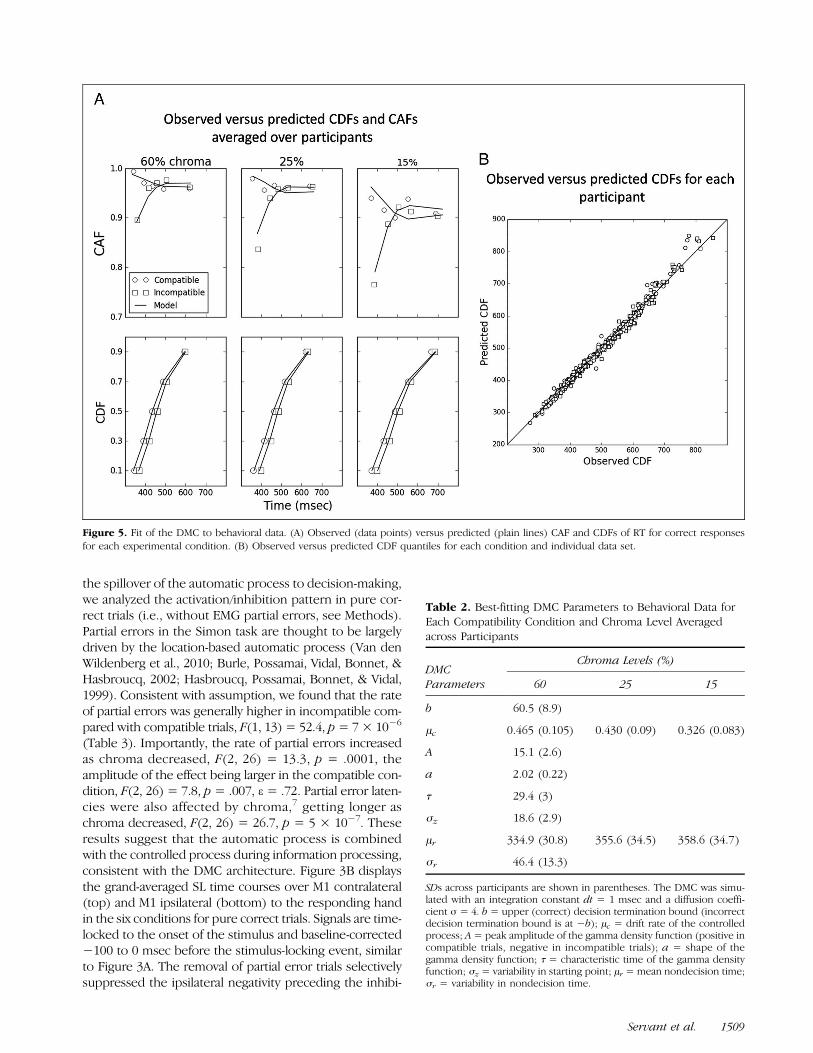
behavioral data. Figure 5A displays observed versus pre-dicted CAFs and cumulative density functions (CDFs) ofRT for correct responses across experimental conditionsaveraged over the 14 participants. The model capturesaccuracy dynamics across conditions and the decrementof the Simon effect as RT increases. Figure 5B shows ob-served versus predicted RT quantiles of the distributionsof correct responses for each individual data set. Datapoints are gathered around the ideal observed = pre-dicted line, with no systematic deviation. Best-fittingparameters are shown in Table 2. Consistent with Ulrichet al. (2015), we found that the model captures the datawith an automatic activation that develops early (i.e., thegamma function peaks at τ(a − 1) = 30 msec decisiontime on average). Variations of the drift rate of thecontrolled process μc scaled with the quality of sensoryevidence in a meaningful way. Ulrich et al. (2015) dem-onstrated that variations of μc have little impact on themagnitude of the Simon effect, providing an explanationfor the observed additive effect of compatibility andchroma on mean RT. Finally, the mean of nondecisional
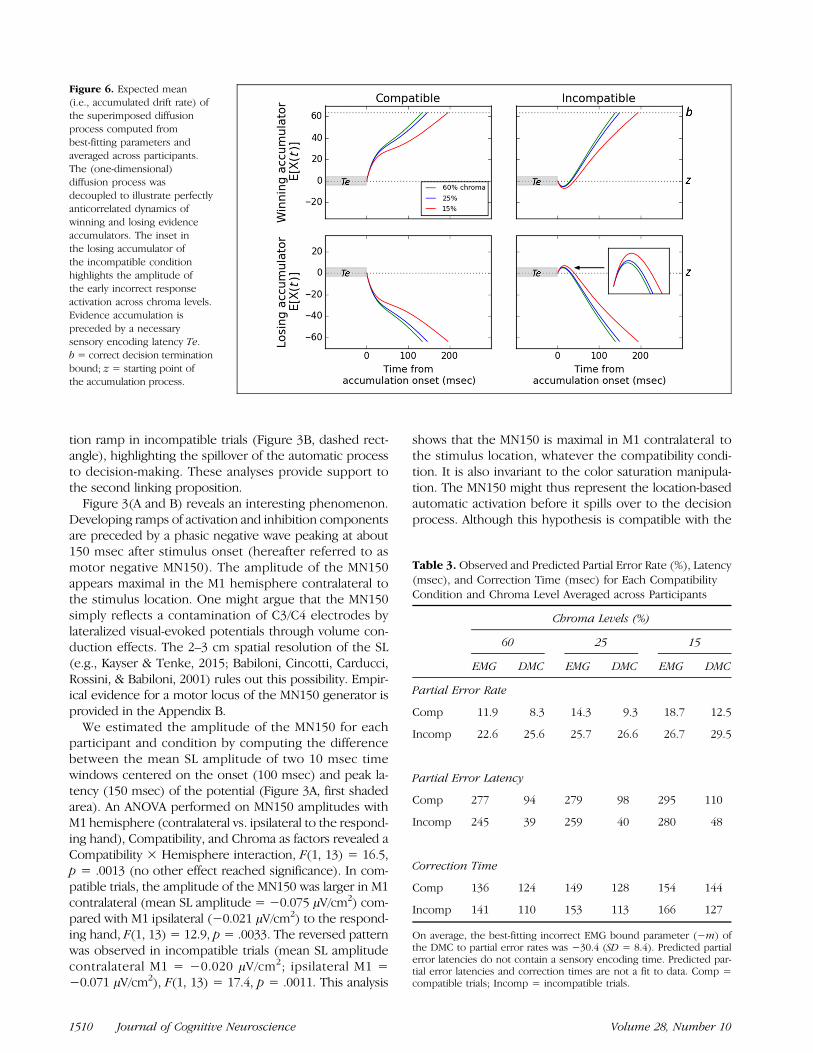
components monotonically increased as chroma de-creased, suggesting that a degraded color signal puts higherdemands on nondecisional processes such as sensoryencoding.Figure 6 displays the expected mean of the super-
imposed process computed from best-fitting parametersand averaged across participants. The (1-D) diffusion pro-cess was decoupled to illustrate perfectly anticorrelateddynamics of winning and losing accumulators. Thesetheoretical dynamics closely resemble activation and inhi-bition EEG components (Figure 3A). In particular, theDMC predicts an early incorrect activation in incompatibletrials, reflecting the contribution of the automatic processto decision-making. Because automatic and controlledactivations are superimposed, the magnitude of this in-correct activation increases as chroma decreases (Figure 6,inset). This prediction was observed in the EEG data. Inincompatible trials, the ipsilateral inhibition (positivity)was preceded by a negativity, the amplitude of which in-creased as chroma decreased (Figure 3A, dashed rect-angle). To demonstrate that this early negativity reflects
Figure 4. (A) Grand-averaged SL time courses in the six experimental conditions for each of four equal-sized RT bins in all correct trials. Signals arebaseline-corrected −100 to 0 msec before the stimulus-locking event. Shaded areas illustrate the time window used to estimate ramping slopes.These slopes are plotted against the mean RT in the corresponding bin in B.
1508 Journal of Cognitive Neuroscience Volume 28, Number 10
the spillover of the automatic process to decision-making,we analyzed the activation/inhibition pattern in pure cor-rect trials (i.e., without EMG partial errors, see Methods).Partial errors in the Simon task are thought to be largelydriven by the location-based automatic process (Van denWildenberg et al., 2010; Burle, Possamai, Vidal, Bonnet, &Hasbroucq, 2002; Hasbroucq, Possamai, Bonnet, & Vidal,1999). Consistent with assumption, we found that the rateof partial errors was generally higher in incompatible com-pared with compatible trials, F(1, 13) = 52.4, p= 7× 10⁻⁶
(Table 3). Importantly, the rate of partial errors increasedas chroma decreased, F(2, 26) = 13.3, p = .0001, theamplitude of the effect being larger in the compatible con-dition, F(2, 26) = 7.8, p = .007, ε= .72. Partial error laten-cies were also affected by chroma,7 getting longer aschroma decreased, F(2, 26) = 26.7, p = 5 × 10⁻⁷. Theseresults suggest that the automatic process is combinedwith the controlled process during information processing,consistent with the DMC architecture. Figure 3B displaysthe grand-averaged SL time courses over M1 contralateral(top) and M1 ipsilateral (bottom) to the responding handin the six conditions for pure correct trials. Signals are time-locked to the onset of the stimulus and baseline-corrected−100 to 0 msec before the stimulus-locking event, similarto Figure 3A. The removal of partial error trials selectivelysuppressed the ipsilateral negativity preceding the inhibi-
Figure 5. Fit of the DMC to behavioral data. (A) Observed (data points) versus predicted (plain lines) CAF and CDFs of RT for correct responsesfor each experimental condition. (B) Observed versus predicted CDF quantiles for each condition and individual data set.
Table 2. Best-fitting DMC Parameters to Behavioral Data forEach Compatibility Condition and Chroma Level Averagedacross Participants
DMCParameters
Chroma Levels (%)
60 25 15
b 60.5 (8.9)
μc 0.465 (0.105) 0.430 (0.09) 0.326 (0.083)
A 15.1 (2.6)
a 2.02 (0.22)
τ 29.4 (3)
σz 18.6 (2.9)
μr 334.9 (30.8) 355.6 (34.5) 358.6 (34.7)
σr 46.4 (13.3)
SDs across participants are shown in parentheses. The DMC was simu-lated with an integration constant dt = 1 msec and a diffusion coeffi-cient σ = 4. b = upper (correct) decision termination bound (incorrectdecision termination bound is at −b); μc = drift rate of the controlledprocess; A= peak amplitude of the gamma density function (positive incompatible trials, negative in incompatible trials); a = shape of thegamma density function; τ = characteristic time of the gamma densityfunction; σz = variability in starting point; μr =mean nondecision time;σr = variability in nondecision time.
Servant et al. 1509
tion ramp in incompatible trials (Figure 3B, dashed rect-angle), highlighting the spillover of the automatic processto decision-making. These analyses provide support tothe second linking proposition.
Figure 3(A and B) reveals an interesting phenomenon.Developing ramps of activation and inhibition componentsare preceded by a phasic negative wave peaking at about150 msec after stimulus onset (hereafter referred to asmotor negative MN150). The amplitude of the MN150appears maximal in the M1 hemisphere contralateral tothe stimulus location. One might argue that the MN150simply reflects a contamination of C3/C4 electrodes bylateralized visual-evoked potentials through volume con-duction effects. The 2–3 cm spatial resolution of the SL(e.g., Kayser & Tenke, 2015; Babiloni, Cincotti, Carducci,Rossini, & Babiloni, 2001) rules out this possibility. Empir-ical evidence for a motor locus of the MN150 generator isprovided in the Appendix B.
We estimated the amplitude of the MN150 for eachparticipant and condition by computing the differencebetween the mean SL amplitude of two 10 msec timewindows centered on the onset (100 msec) and peak la-tency (150 msec) of the potential (Figure 3A, first shadedarea). An ANOVA performed on MN150 amplitudes withM1 hemisphere (contralateral vs. ipsilateral to the respond-ing hand), Compatibility, and Chroma as factors revealed aCompatibility × Hemisphere interaction, F(1, 13) = 16.5,p = .0013 (no other effect reached significance). In com-patible trials, the amplitude of the MN150 was larger in M1contralateral (mean SL amplitude = −0.075 μV/cm2) com-pared with M1 ipsilateral (−0.021 μV/cm2) to the respond-ing hand, F(1, 13) = 12.9, p= .0033. The reversed patternwas observed in incompatible trials (mean SL amplitudecontralateral M1 = −0.020 μV/cm2; ipsilateral M1 =−0.071 μV/cm2), F(1, 13) = 17.4, p = .0011. This analysis
shows that the MN150 is maximal in M1 contralateral tothe stimulus location, whatever the compatibility condi-tion. It is also invariant to the color saturation manipula-tion. The MN150 might thus represent the location-basedautomatic activation before it spills over to the decisionprocess. Although this hypothesis is compatible with the
Table 3. Observed and Predicted Partial Error Rate (%), Latency(msec), and Correction Time (msec) for Each CompatibilityCondition and Chroma Level Averaged across Participants
Chroma Levels (%)
60 25 15
EMG DMC EMG DMC EMG DMC
Partial Error Rate
Comp 11.9 8.3 14.3 9.3 18.7 12.5
Incomp 22.6 25.6 25.7 26.6 26.7 29.5
Partial Error Latency
Comp 277 94 279 98 295 110
Incomp 245 39 259 40 280 48
Correction Time
Comp 136 124 149 128 154 144
Incomp 141 110 153 113 166 127
On average, the best-fitting incorrect EMG bound parameter (−m) ofthe DMC to partial error rates was −30.4 (SD = 8.4). Predicted partialerror latencies do not contain a sensory encoding time. Predicted par-tial error latencies and correction times are not a fit to data. Comp =compatible trials; Incomp = incompatible trials.
Figure 6. Expected mean(i.e., accumulated drift rate) ofthe superimposed diffusionprocess computed frombest-fitting parameters andaveraged across participants.The (one-dimensional)diffusion process wasdecoupled to illustrate perfectlyanticorrelated dynamics ofwinning and losing evidenceaccumulators. The inset inthe losing accumulator ofthe incompatible conditionhighlights the amplitude ofthe early incorrect responseactivation across chroma levels.Evidence accumulation ispreceded by a necessarysensory encoding latency Te.b = correct decision terminationbound; z = starting point ofthe accumulation process.
1510 Journal of Cognitive Neuroscience Volume 28, Number 10
DMC framework, it has important limitations. These limi-tations will be introduced in the Discussion section.
Linking Proposition 3
The final linking proposition builds upon our recentcomputational work suggesting that EMG activity in con-flict tasks reflects up-to-date information about the deci-sion (Servant et al., 2015). In other words, EMG burstsmight be driven by the evolving decision evidence. Theobserved effects of compatibility and chroma on partialerror rates and latencies are consistent with this hypoth-esis. However, we sought to provide a more direct empir-ical test by evaluating how the magnitude of EMG burstsscale with chroma and how such scaling relates to thetheoretical superimposed diffusion process of the DMC.
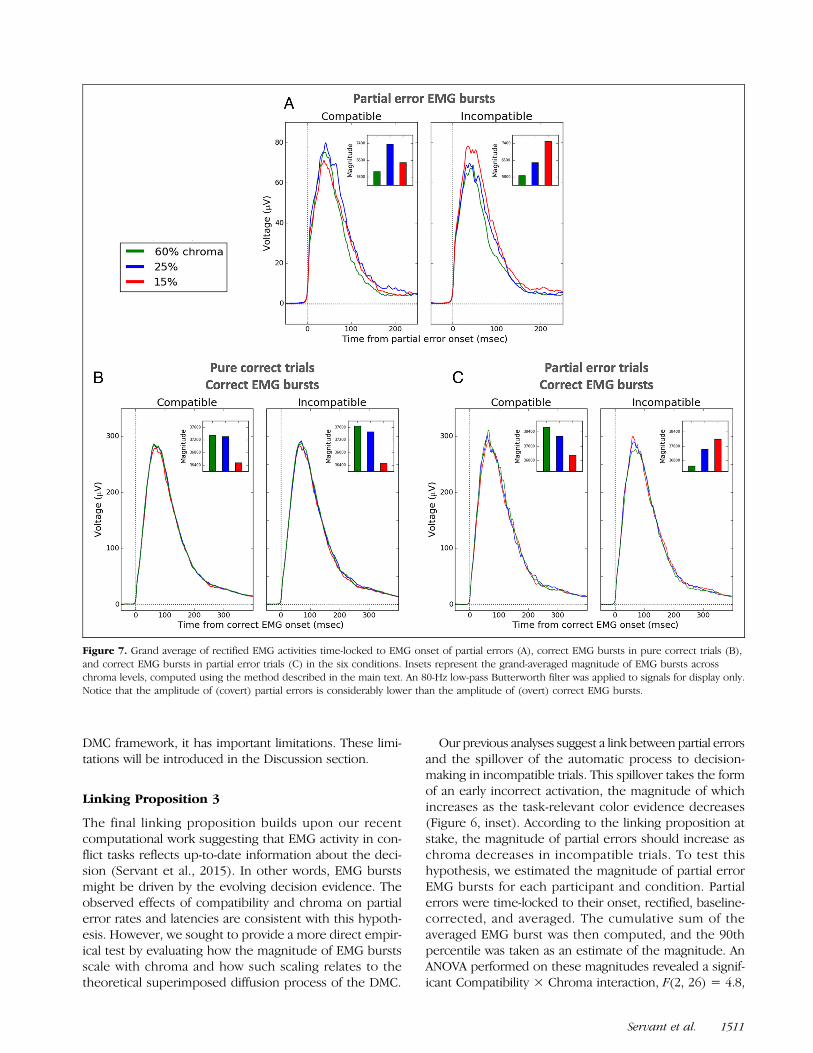
Our previous analyses suggest a link between partial errorsand the spillover of the automatic process to decision-making in incompatible trials. This spillover takes the formof an early incorrect activation, the magnitude of whichincreases as the task-relevant color evidence decreases(Figure 6, inset). According to the linking proposition atstake, the magnitude of partial errors should increase aschroma decreases in incompatible trials. To test thishypothesis, we estimated the magnitude of partial errorEMG bursts for each participant and condition. Partialerrors were time-locked to their onset, rectified, baseline-corrected, and averaged. The cumulative sum of theaveraged EMG burst was then computed, and the 90thpercentile was taken as an estimate of the magnitude. AnANOVA performed on these magnitudes revealed a signif-icant Compatibility × Chroma interaction, F(2, 26) = 4.8,
Figure 7. Grand average of rectified EMG activities time-locked to EMG onset of partial errors (A), correct EMG bursts in pure correct trials (B),and correct EMG bursts in partial error trials (C) in the six conditions. Insets represent the grand-averaged magnitude of EMG bursts acrosschroma levels, computed using the method described in the main text. An 80-Hz low-pass Butterworth filter was applied to signals for display only.Notice that the amplitude of (covert) partial errors is considerably lower than the amplitude of (overt) correct EMG bursts.
Servant et al. 1511
p = .032, ε = .7. In incompatible trials, the magnitude ofpartial errors monotonically increased as chroma de-creased, F(2, 26) = 5.5, p = .01 (Figure 7A). Although avery small trend for a chroma effect showed up in com-patible trials (F(2, 26) = 2.5, p = .103), partial error mag-nitudes did not meaningfully scale with chroma levels,consistent with the assumption that partial errors aremainly driven by noise or fast guesses in this condition(e.g., Hasbroucq, Burle, Vidal, & Possamai, 2009; Hasbroucqet al., 1999; Eriksen, Coles, Morris, & O’Hara, 1985).
Besides partial errors, the third linking propositionmakes a particular prediction with regard to the mag-nitude of (overt) correct EMG bursts. As decision timeincreases, the drift rate of the superimposed process con-verges toward that of the controlled process μc, whateverthe compatibility condition (Figure 9A). Because μc de-creases as chroma decreases, the magnitude of correctEMG bursts should decrease as chroma decreases. Fig-ure 7(B and C) shows that this is the case, except whenthe correct EMG burst is preceded by a partial error in theincompatible condition. The magnitude of correct EMGbursts was quantified in the same way as for partial errors.For pure correct trials, the ANOVA revealed a significant ef-fect of Chroma, F(2, 26) = 3.2, p= .05 (Compatibility: p=.54; interaction: p= .83; Figure 7B). For partial error trials,the ANOVA revealed a trend for a Compatibility × Chromainteraction, F(2, 26) = 2.7, p = .084: Although the magni-tude of correct EMG bursts in the compatible conditionscaled with chroma in the predicted direction, the oppositepattern was observed in the incompatible condition(Figure 7C). This result might suggest a particular partialerror correction processing scheme in the incompatiblecondition.
The hypothetical relationship between the drift rateof the controlled process μc and correct EMG burstscan further be assessed by analyzing the motor time
MT (time between the EMG onset of the correct EMGburst and the mechanical button press; see Figure 2B).Specifically, MT should increase when μc decreases. Weobserved this relationship in pure correct trials (60%chroma: mean MT = 132.2 msec; 25%: 133.6 msec; 15%:133.7 msec; main effect of Chroma, F(2, 26) = 3.6, p =.041; Compatibility: p = .47; interaction: p = .65). No sig-nificant effect showed up for partial error trials however(all ps > .1).These results provide empirical evidence in favor of
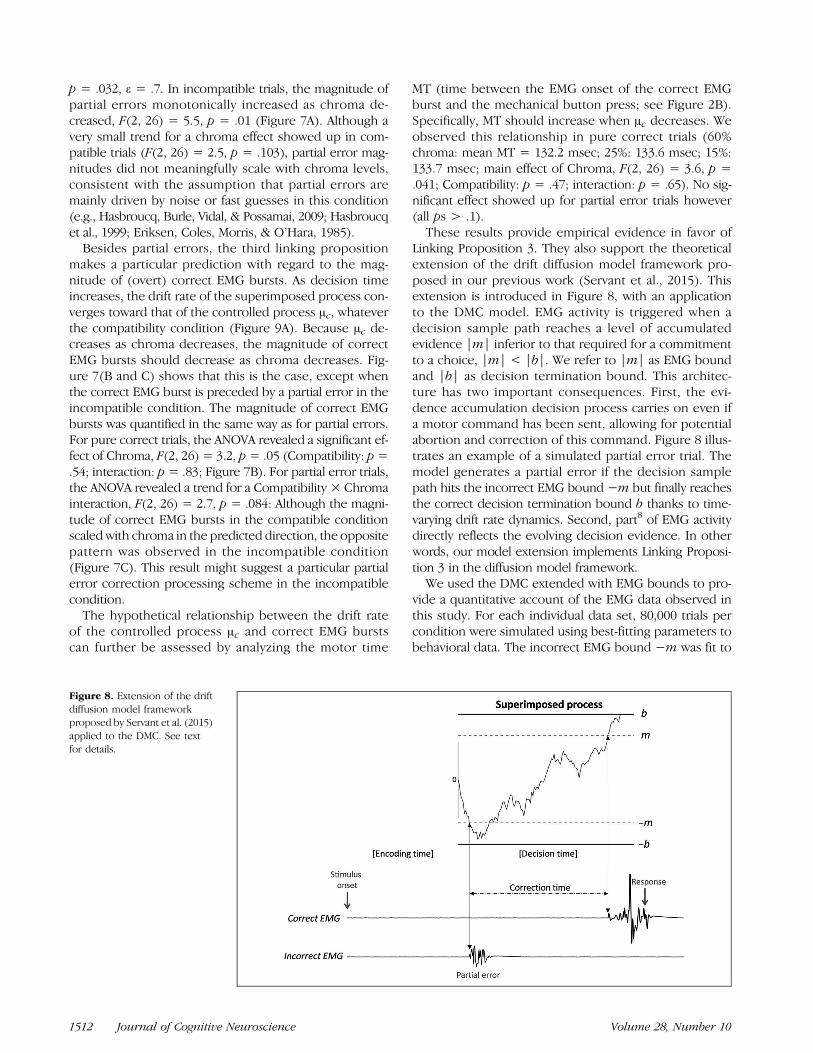
Linking Proposition 3. They also support the theoreticalextension of the drift diffusion model framework pro-posed in our previous work (Servant et al., 2015). Thisextension is introduced in Figure 8, with an applicationto the DMC model. EMG activity is triggered when adecision sample path reaches a level of accumulatedevidence |m| inferior to that required for a commitmentto a choice, |m| < |b|. We refer to |m| as EMG boundand |b| as decision termination bound. This architec-ture has two important consequences. First, the evi-dence accumulation decision process carries on even ifa motor command has been sent, allowing for potentialabortion and correction of this command. Figure 8 illus-trates an example of a simulated partial error trial. Themodel generates a partial error if the decision samplepath hits the incorrect EMG bound −m but finally reachesthe correct decision termination bound b thanks to time-varying drift rate dynamics. Second, part8 of EMG activitydirectly reflects the evolving decision evidence. In otherwords, our model extension implements Linking Proposi-tion 3 in the diffusion model framework.We used the DMC extended with EMG bounds to pro-
vide a quantitative account of the EMG data observed inthis study. For each individual data set, 80,000 trials percondition were simulated using best-fitting parameters tobehavioral data. The incorrect EMG bound −m was fit to
Figure 8. Extension of the driftdiffusion model frameworkproposed by Servant et al. (2015)applied to the DMC. See textfor details.
1512 Journal of Cognitive Neuroscience Volume 28, Number 10
partial error rates by minimizing the following loss func-tion with a Simplex routine:
Loss ¼X6
i¼1ei − εið Þ2
where e and ε represent observed and predicted partialerror rates for each experimental condition i. The param-eter m was not allowed to vary between conditions. Afterthis calibration step, the DMC was simulated again toextract predicted partial error latencies and correctiontimes (latency between first hits of the incorrect EMGbound −m and the correct EMG bound m; Figure 8).These predictions were finally compared against empi-rical data.9 The empirical correction time is defined asthe latency between the onset of the partial error andthe onset of the correct EMG burst (Figure 2B). Table 3summarizes the results of the simulations. Although theextended DMC captures compatibility and chroma effectson partial error rates10 ( p = 2 × 10⁻⁷ and p = 5 × 10⁻¹⁰,
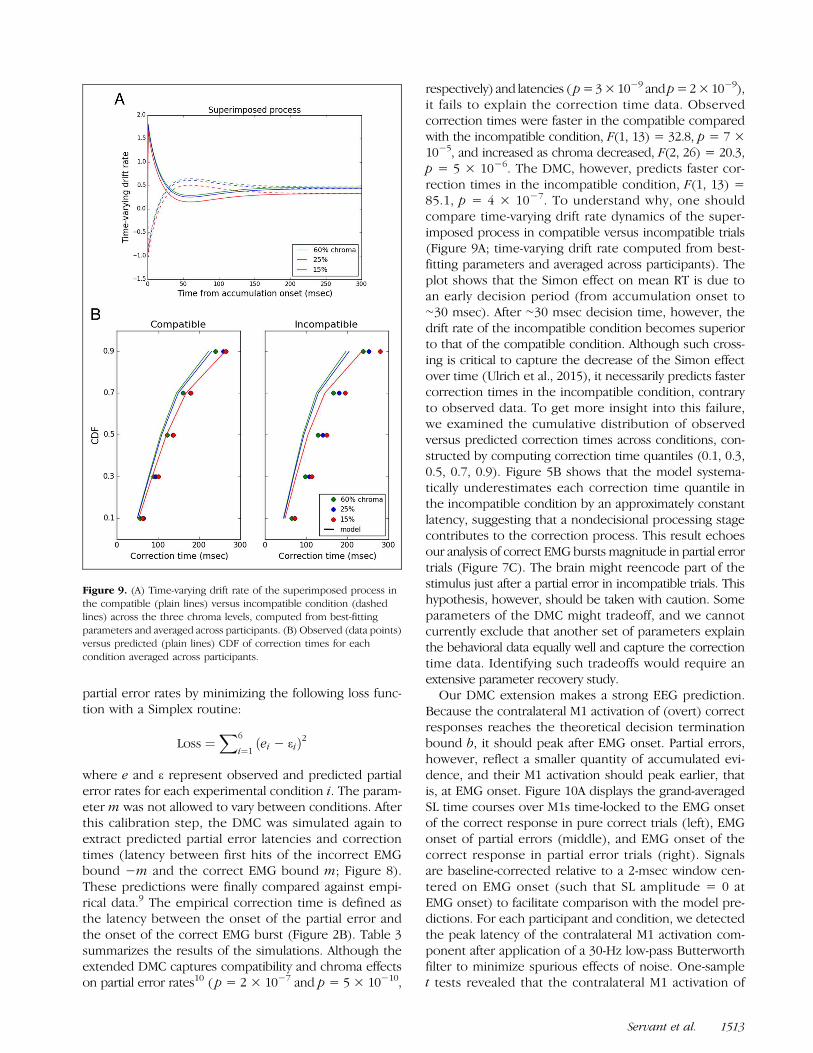
respectively) and latencies ( p=3×10⁻⁹ andp=2×10⁻⁹),it fails to explain the correction time data. Observedcorrection times were faster in the compatible comparedwith the incompatible condition, F(1, 13) = 32.8, p = 7 ×10⁻⁵, and increased as chroma decreased, F(2, 26) = 20.3,p = 5 × 10⁻⁶. The DMC, however, predicts faster cor-rection times in the incompatible condition, F(1, 13) =85.1, p = 4 × 10⁻⁷. To understand why, one shouldcompare time-varying drift rate dynamics of the super-imposed process in compatible versus incompatible trials(Figure 9A; time-varying drift rate computed from best-fitting parameters and averaged across participants). Theplot shows that the Simon effect on mean RT is due toan early decision period (from accumulation onset to∼30 msec). After ∼30 msec decision time, however, thedrift rate of the incompatible condition becomes superiorto that of the compatible condition. Although such cross-ing is critical to capture the decrease of the Simon effectover time (Ulrich et al., 2015), it necessarily predicts fastercorrection times in the incompatible condition, contraryto observed data. To get more insight into this failure,we examined the cumulative distribution of observedversus predicted correction times across conditions, con-structed by computing correction time quantiles (0.1, 0.3,0.5, 0.7, 0.9). Figure 5B shows that the model systema-tically underestimates each correction time quantile inthe incompatible condition by an approximately constantlatency, suggesting that a nondecisional processing stagecontributes to the correction process. This result echoesour analysis of correct EMG bursts magnitude in partial errortrials (Figure 7C). The brain might reencode part of thestimulus just after a partial error in incompatible trials. Thishypothesis, however, should be taken with caution. Someparameters of the DMC might tradeoff, and we cannotcurrently exclude that another set of parameters explainthe behavioral data equally well and capture the correctiontime data. Identifying such tradeoffs would require anextensive parameter recovery study.
Our DMC extension makes a strong EEG prediction.Because the contralateral M1 activation of (overt) correctresponses reaches the theoretical decision terminationbound b, it should peak after EMG onset. Partial errors,however, reflect a smaller quantity of accumulated evi-dence, and their M1 activation should peak earlier, thatis, at EMG onset. Figure 10A displays the grand-averagedSL time courses over M1s time-locked to the EMG onsetof the correct response in pure correct trials (left), EMGonset of partial errors (middle), and EMG onset of thecorrect response in partial error trials (right). Signalsare baseline-corrected relative to a 2-msec window cen-tered on EMG onset (such that SL amplitude = 0 atEMG onset) to facilitate comparison with the model pre-dictions. For each participant and condition, we detectedthe peak latency of the contralateral M1 activation com-ponent after application of a 30-Hz low-pass Butterworthfilter to minimize spurious effects of noise. One-samplet tests revealed that the contralateral M1 activation of
Figure 9. (A) Time-varying drift rate of the superimposed process inthe compatible (plain lines) versus incompatible condition (dashedlines) across the three chroma levels, computed from best-fittingparameters and averaged across participants. (B) Observed (data points)versus predicted (plain lines) CDF of correction times for eachcondition averaged across participants.
Servant et al. 1513
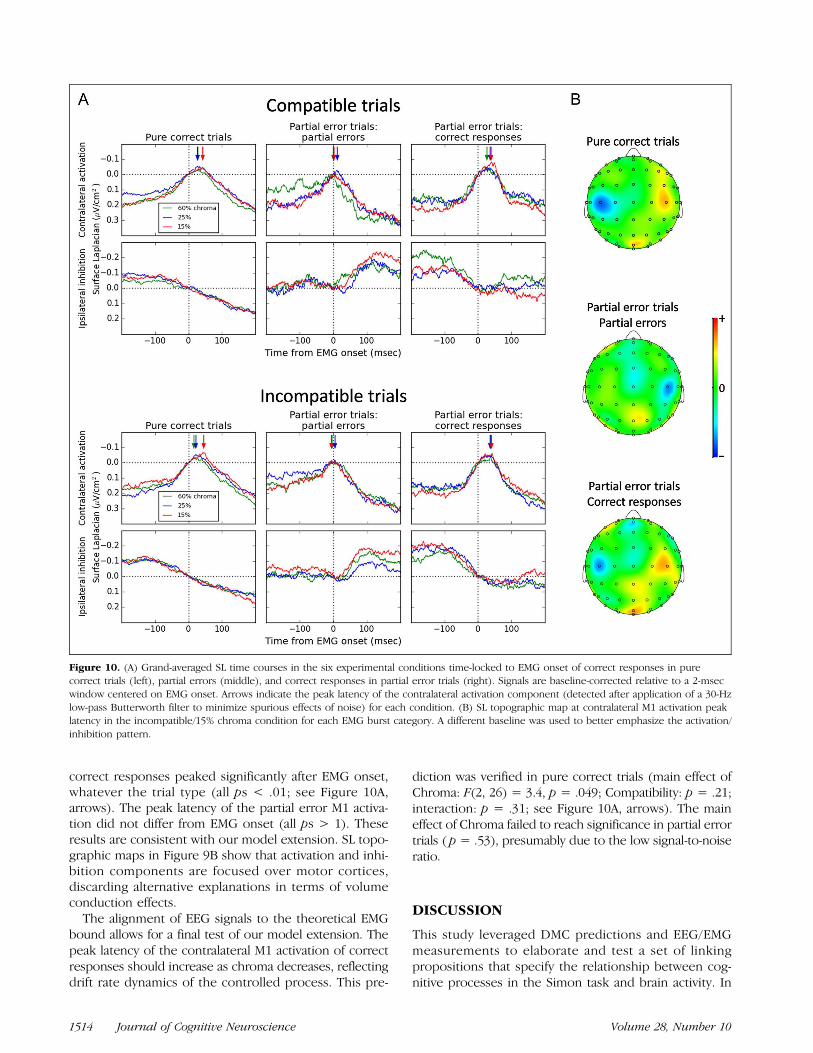
correct responses peaked significantly after EMG onset,whatever the trial type (all ps < .01; see Figure 10A,arrows). The peak latency of the partial error M1 activa-tion did not differ from EMG onset (all ps > 1). Theseresults are consistent with our model extension. SL topo-graphic maps in Figure 9B show that activation and inhi-bition components are focused over motor cortices,discarding alternative explanations in terms of volumeconduction effects.
The alignment of EEG signals to the theoretical EMGbound allows for a final test of our model extension. Thepeak latency of the contralateral M1 activation of correctresponses should increase as chroma decreases, reflectingdrift rate dynamics of the controlled process. This pre-
diction was verified in pure correct trials (main effect ofChroma: F(2, 26) = 3.4, p = .049; Compatibility: p = .21;interaction: p = .31; see Figure 10A, arrows). The maineffect of Chroma failed to reach significance in partial errortrials ( p = .53), presumably due to the low signal-to-noiseratio.
DISCUSSION
This study leveraged DMC predictions and EEG/EMGmeasurements to elaborate and test a set of linkingpropositions that specify the relationship between cog-nitive processes in the Simon task and brain activity. In
Figure 10. (A) Grand-averaged SL time courses in the six experimental conditions time-locked to EMG onset of correct responses in purecorrect trials (left), partial errors (middle), and correct responses in partial error trials (right). Signals are baseline-corrected relative to a 2-msecwindow centered on EMG onset. Arrows indicate the peak latency of the contralateral activation component (detected after application of a 30-Hzlow-pass Butterworth filter to minimize spurious effects of noise) for each condition. (B) SL topographic map at contralateral M1 activation peaklatency in the incompatible/15% chroma condition for each EMG burst category. A different baseline was used to better emphasize the activation/inhibition pattern.
1514 Journal of Cognitive Neuroscience Volume 28, Number 10
doing so, we sought to enhance our understanding ofneurophysiological data. Reciprocally, we sought to bet-ter constrain the DMC architecture beyond adequate fitsto behavioral data, a method known to have limitationsfor theory testing (Roberts & Pashler, 2000). The sectionsbelow summarize our main findings and discuss theirtheoretical consequences.
A Representation of the Superimposed DriftDiffusion Variable in M1s
Our analyses of SL EEG signals over M1s showed thatramping slopes of activation and inhibition componentsscale with the quality of task-relevant color evidenceand more generally with RT, as expected for a neuralintegrator (Kelly & O’Connell, 2013; O’Connell et al.,2012; Donner et al., 2009; Roitman & Shadlen, 2002; Hanes& Schall, 1996). The high anticorrelation (r = −.68)observed between activation and inhibition ramps re-vealed a form of inhibition between competing accumu-lators, consistent with the general drift diffusion modelarchitecture (Ratcliff & McKoon, 2008; Ratcliff, 1978).The observed anticorrelation, however, was high butnot perfect. The high amount of noise inherent to EEGmeasurements might have reduced the underlying anti-correlation between neural generators. Perfect anticorrela-tion might also be implausible from a neurophysiologicalpoint of view, due to, for example, ceiling effects of neuralfiring rates. Consistent with this hypothesis, single-unit re-cordings of accumulator neurons in behaving monkeyshave revealed anticorrelations similar to that reported inthis study (reviewed by Gold & Shadlen, 2007).Although the drift diffusion model is agnostic to the
way inhibition is implemented (Bogacz et al., 2006), em-pirical evidence suggests that it occurs in a flexible andfeedforward manner (i.e., via crossed inputs). The ipsi-lateral M1 inhibition component is absent when responsesare made by two fingers of the same hand (Meynier, Burle,Possamai, Vidal, & Hasbroucq, 2009) and when no re-sponse choice is required (Vidal et al., 2011). Furthermore,functional dissociations have been reported betweenactivation and inhibition components, some manipula-tions affecting only one of the two (Burle et al., in press;Tandonnet, Burle, Vidal, & Hasbroucq, 2006). These re-sults speak against an interpretation of inhibition as apassive by-product of reciprocal interhemispheric con-nections (Ferbert et al., 1992). Two aspects of the presentdata are consistent with this hypothesis. Figure 10A (left)shows that the ipsilateral M1 inhibition component inpure correct trials carries on even after the contralateralactivation peak. Moreover, Figure 9(A and B, middle)suggests a lack of M1 inhibition associated with partialerrors. To test this hypothesis, we estimated the slopeof the inhibition component by linear regression in a50-msec time window ending at EMG onset for each par-ticipant and condition. Slopes did not differ from 0 in anyof the conditions (one-sample t tests, all ps > .1).11 These
results highlight the high flexibility of the brain mecha-nism regulating motor inhibition.
Beyond the relationship between task-relevant sensoryinformation accumulation and activation/inhibition EEGcomponents, we found evidence that the location-basedautomatic activation spills over to the decision process, ashypothesized by the DMCmodel (Ulrich et al., 2015). Thecontribution of the automatic process to decision-makingis particularly visible in incompatible trials, where the ipsi-lateral inhibition ramp is preceded by a short-living nega-tivity (Figure 3A, dashed rectangle). By comparing correcttrials with and without EMG partial errors, we were ableto unambiguously establish the link between this nega-tivity and the theoretical location-based automatic activa-tion of the incorrect response. Our experimental designallows for a deeper test of the DMC assumption. In in-compatible trials, the model assumes that the automaticactivation increases as chroma decreases because of theintegration of task-relevant and task-irrelevant informa-tion into a single decision variable. This prediction wasverified in the EEG data. We also found that the rate,latency, and magnitude of partial errors increase as chro-ma decreases in the incompatible condition. This resultprovides strong empirical support for the DMC architec-ture and refutes alternative models in which automaticand controlled processes race independently against eachother (see Figure 2 in Van den Wildenberg et al., 2010).
It remains to be determined whether the integration ofautomatic and controlled processes occurs at the M1 levelor in upstream structures. Recent evidence suggests thatthe decision variable is computed in supramodal brainareas and flows down to the motor system (Kelly &O’Connell, 2013; O’Connell et al., 2012). These experi-ments, however, draw upon simple decision tasks andare agnostic with respect to the automatic process. Evi-dence for a motor locus of the integration might comefrom the MN150, a phasic negative wave that precedesthe activation/inhibition pattern (Figure 3, first shadedarea). The amplitude of the MN150 is maximal over M1contralateral to the stimulus, whatever the compatibilitycondition, and is not sensitive to chroma. This componentmight be the neural signature of the location-based auto-matic activation before it spills over to decision-making.Although this hypothesis is compatible with the DMCframework, it has important limitations. First, one wouldexpect that the Simon effect disappears with verticalstimulus and response arrangements. This has never beenobserved (e.g., Vallesi, Mapelli, Schiff, Amodio, & Umilta,2005; Valle-Inclan & Redondo, 1998; De Jong, Liang, &Lauber, 1994). Second, the Simon effect would reversewhen the arms are crossed. A regular Simon effect hasbeen systematically documented with this setting (e.g.,Hasbroucq et al., 2009; Roswarski & Proctor, 2003;Wascher, Schatz, Kuder, & Verleger, 2001; Wallace, 1971).An alternative interpretation of the MN150 comes from aline of EEG research in spatial compatibility tasks showingearly lateralized motor deflexions that do not reflect
Servant et al. 1515
movement-related activities. Using an auditory version ofthe Simon task, Leuthold and Schröter (2006) reported alateralized frontocentral activity in the time range of theMN150 that was not modulated by the effector condition(hand, foot, eye), presumably reflecting amotor-attentionalmechanism (see also Praamstra & Oostenveld, 2003;Wascher & Wauschkuhn, 1996). This linking propositionshould be tested in future work.
EMG Activity and the Decision Variable
The final linking proposition conjectures that part ofEMG activity reflects the evolving decision variable. Con-sistent with this proposition, we found that covert andovert EMG bursts scale with the quality of sensoryevidence in a way predicted by the superimposed deci-sion variable of DMC. At first sight, this result suggestsa continuous flow of the decision variable down to theeffectors. The transmission of information from M1 tothe flexor pollicis brevis, however, cannot be purely con-tinuous: EMG bursts do not exhibit a ramp-like activitybut instead a discrete onset, suggesting that a mechanismgates the flow of information. Incorporation of EMGbounds into the drift diffusion model framework is asimple realization of this idea (Servant et al., 2015). Weextended the DMC with EMG bounds and provided aquantitative account of the EMG data. This extensionmade additional predictions on evidence accumulationthreshold dynamics that were verified in the EEG data.
It is unclear whether the link between EMG activityand the decision variable extends beyond conflict tasks.Also, the functional significance of EMG bounds remainsto be clarified. We previously hypothesized that the brainmight engage motor activity in an adaptive way, that is,when the decision variable reaches a sufficiently high de-gree of confidence for a particular response alternative(Servant et al., 2015). Electrophysiological and micro-stimulation studies in behavingmonkeys have revealed thatthe very same neurons that encode the decision variablealso encode a confidence signal (Fetsch, Kiani, Newsome,& Shadlen, 2014; Kiani & Shadlen, 2009). Recent behavioraland computational evidence suggest that changes of mindin decision-making and confidence are linked by a com-mon generative mechanism (Van den Berg et al., 2016).In the drift diffusion model framework, confidence cor-responds to the log posterior odds of a correct responseand can be derived from the diffusion process using Bayes’rule (Kiani & Shadlen, 2009). Our theoretical EMG boundsmight correspond to a log posterior odds level.
Extension to Other Conflict Tasks
An important strength of the DMC architecture is itsability to account for behavioral data from different con-flict tasks. Contrary to the Simon effect, the magnitude offlanker and Stroop compatibility effects increases over time
(Servant et al., 2014; White et al., 2011; Hübner et al., 2010;Pratte et al., 2010; but see Burle, Spieser, Servant, &Hasbroucq, 2014). The DMC explains these distributionaldifferences by variations in the characteristic time param-eter τ of the automatic activation. Specifically, an automaticactivation that develops relatively early (late) relative to thecontrolled activation tends to produce a decrease (in-crease) of the compatibility effect as RT increases (Ulrichet al., 2015). In line with this hypothesis, we found thatthe DMC captures the present Simon task data with anautomatic activation that develops early (the peak latencyof the gamma function was ∼30 msec on average).Two aspects of our electrophysiological data appear
consistent with the early activation hypothesis. First,the ipsilateral negativity preceding the inhibition rampin incompatible trials (Figure 3A, dashed rectangle) peaks∼40 msec after its onset (onset and peak latencies detectedafter application of a 30-Hz low-pass Butterworth filter andaveraged across chroma levels). Second, partial errors arenot associated with a reliable M1 inhibition (Figure 10Aand 10B,middle). This result might suggest that the latencyof partial errors is very close to the onset of the decisionprocess. Consistent with this hypothesis, we found thatpartial error latencies generated by DMC extended withEMG bounds are very fast, particularly in the incompatiblecondition (range 39–48 msec after evidence accumulationonset; see Table 3). If the lack of M1 inhibition for partialerrors in the Simon task is due to the early automaticactivation, then a reliable inhibition should be observedin the flanker task. Figure 8 of Burle, Roger, Allain, Vidal,and Hasbroucq (2008; standard flanker task, EEG time-locked to the onset of partial errors) suggests that thisis the case. A reanalysis of their EEG data revealed a reli-able M1 inhibition associated with partial errors (onesample t test against 0, t(9) = −2.4, p = .04, data col-lapsed across flanker compatibility conditions). These re-sults provide support to the general DMC framework.Combining DMC predictions with EEG and EMG measure-ments in other conflict tasks such as the flanker or theStroop should provide additional insight into the relativetime course of controlled and automatic activations.
Conclusion
Our model-based neuroscience study contributes to thegrowing body of evidence showing a representation ofthe decision variable in the motor system (e.g., Kelly &O’Connell, 2013; O’Connell et al., 2012; Purcell et al.,2010, 2012; Selen et al., 2012; Donner et al., 2009; Ratcliffet al., 2003; Romo et al., 2002; Gold & Shadlen, 2000;Hanes & Schall, 1996), even down to the effectors (Servantet al., 2015). It also demonstrates that the decision variableis not shielded against task-irrelevant sensory information.Our findings provide new insight into the neurophysiologyof human decision-making. In return, they provide sup-port for the DMC model framework.
1516 Journal of Cognitive Neuroscience Volume 28, Number 10
APPENDIX A: FURTHER EVIDENCE IN FAVOROF LINKING PROPOSITION 1
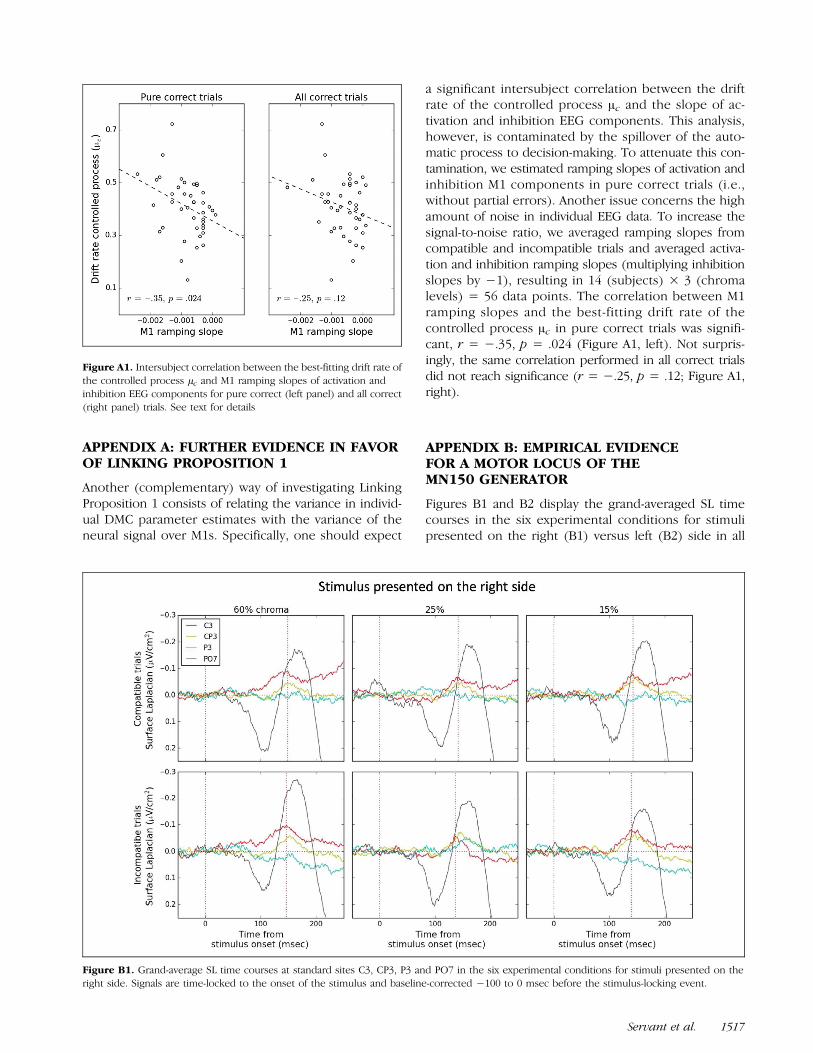
Another (complementary) way of investigating LinkingProposition 1 consists of relating the variance in individ-ual DMC parameter estimates with the variance of theneural signal over M1s. Specifically, one should expect
a significant intersubject correlation between the driftrate of the controlled process μc and the slope of ac-tivation and inhibition EEG components. This analysis,however, is contaminated by the spillover of the auto-matic process to decision-making. To attenuate this con-tamination, we estimated ramping slopes of activation andinhibition M1 components in pure correct trials (i.e.,without partial errors). Another issue concerns the highamount of noise in individual EEG data. To increase thesignal-to-noise ratio, we averaged ramping slopes fromcompatible and incompatible trials and averaged activa-tion and inhibition ramping slopes (multiplying inhibitionslopes by −1), resulting in 14 (subjects) × 3 (chromalevels) = 56 data points. The correlation between M1ramping slopes and the best-fitting drift rate of thecontrolled process μc in pure correct trials was signifi-cant, r = −.35, p = .024 (Figure A1, left). Not surpris-ingly, the same correlation performed in all correct trialsdid not reach significance (r = −.25, p = .12; Figure A1,right).
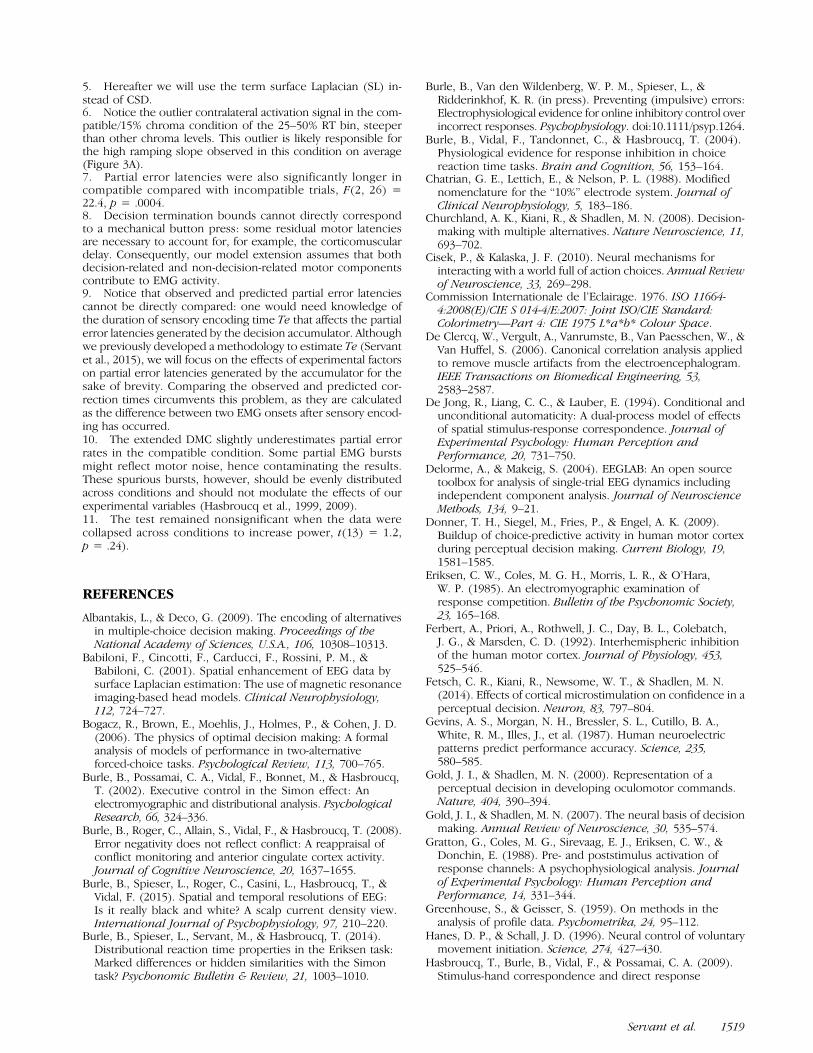
APPENDIX B: EMPIRICAL EVIDENCEFOR A MOTOR LOCUS OF THEMN150 GENERATOR
Figures B1 and B2 display the grand-averaged SL timecourses in the six experimental conditions for stimulipresented on the right (B1) versus left (B2) side in all
Figure A1. Intersubject correlation between the best-fitting drift rate ofthe controlled process μc and M1 ramping slopes of activation andinhibition EEG components for pure correct (left panel) and all correct(right panel) trials. See text for details
Figure B1. Grand-average SL time courses at standard sites C3, CP3, P3 and PO7 in the six experimental conditions for stimuli presented on theright side. Signals are time-locked to the onset of the stimulus and baseline-corrected −100 to 0 msec before the stimulus-locking event.
Servant et al. 1517

correct trials. Signals are time-locked to the onset of thestimulus and baseline-corrected −100 to 0 msec beforethe stimulus-locking event. The peak latency of theMN150 (indicated by the red dotted line) systematicallyprecedes that of the lateralized sensory-related negativ-ity at electrodes PO7/PO8 (all ps < .05). Moreover, SLtopographic maps at MN150 peak latency shown inFigure B3 clearly show a gap between motor (C3/C4)and sensory (PO7/PO8) activities. The different time
courses and topographies of these activities demon-strate they are not generated by the same underlyingdipole.
Acknowledgments
This research was supported by the European Research Councilunder the European Community’s Seventh Framework Pro-gram (FP7/2007-2013 grant agreement no. 241077).
Reprint requests should be sent to Borís Burle, Laboratoire deNeurosciences Cognitives, Fédération de Recherche 3C, case C,Aix-Marseille Université, CNRS, 3 Place Victor Hugo, 13331Marseille cedex 3, France, or via e-mail: [email protected].
Notes
1. The LRP is computed by subtracting electrical activities re-corded over M1 ipsilateral from those over M1 contralateral tothe responding hand.2. Although the CIE LCH is considered a device-independentcolor space, it needs a white point reference. We chose thestandard and widely used CIE D65 illuminant.3. The DMC was also fit to behavioral data aggregated acrossparticipants (data not shown for the sake of brevity). Parameterestimates were very close to the averages of parameter esti-mates obtained by fitting the model to individual data.4. Ulrich and colleagues used a beta distribution to modelacross-trial variability in starting point. We used a uniform dis-tribution, as commonly done for the standard drift diffusionmodel (e.g., Ratcliff & McKoon, 2008). Ratcliff (2013) showedthat the model is robust to changes in the across-trial distribu-tions of parameter values.
Figure B2. Grand-average SL time courses at standard sites C4, CP4, P4 and PO8 in the six experimental conditions for stimuli presented on theleft side. Signals are time-locked to the onset of the stimulus and baseline-corrected −100 to 0 msec before the stimulus-locking event.
Figure B3. SL topographic maps at 150 msec after the stimulus-lockingevent in the 15% chroma condition. Maps are plotted as a function ofstimulus-response compatibility and stimulus side.
1518 Journal of Cognitive Neuroscience Volume 28, Number 10
5. Hereafter we will use the term surface Laplacian (SL) in-stead of CSD.6. Notice the outlier contralateral activation signal in the com-patible/15% chroma condition of the 25–50% RT bin, steeperthan other chroma levels. This outlier is likely responsible forthe high ramping slope observed in this condition on average(Figure 3A).7. Partial error latencies were also significantly longer incompatible compared with incompatible trials, F(2, 26) =22.4, p = .0004.8. Decision termination bounds cannot directly correspondto a mechanical button press: some residual motor latenciesare necessary to account for, for example, the corticomusculardelay. Consequently, our model extension assumes that bothdecision-related and non-decision-related motor componentscontribute to EMG activity.9. Notice that observed and predicted partial error latenciescannot be directly compared: one would need knowledge ofthe duration of sensory encoding time Te that affects the partialerror latencies generated by the decision accumulator. Althoughwe previously developed a methodology to estimate Te (Servantet al., 2015), we will focus on the effects of experimental factorson partial error latencies generated by the accumulator for thesake of brevity. Comparing the observed and predicted cor-rection times circumvents this problem, as they are calculatedas the difference between two EMG onsets after sensory encod-ing has occurred.10. The extended DMC slightly underestimates partial errorrates in the compatible condition. Some partial EMG burstsmight reflect motor noise, hence contaminating the results.These spurious bursts, however, should be evenly distributedacross conditions and should not modulate the effects of ourexperimental variables (Hasbroucq et al., 1999, 2009).11. The test remained nonsignificant when the data werecollapsed across conditions to increase power, t(13) = 1.2,p = .24).
REFERENCES
Albantakis, L., & Deco, G. (2009). The encoding of alternativesin multiple-choice decision making. Proceedings of theNational Academy of Sciences, U.S.A., 106, 10308–10313.
Babiloni, F., Cincotti, F., Carducci, F., Rossini, P. M., &Babiloni, C. (2001). Spatial enhancement of EEG data bysurface Laplacian estimation: The use of magnetic resonanceimaging-based head models. Clinical Neurophysiology,112, 724–727.
Bogacz, R., Brown, E., Moehlis, J., Holmes, P., & Cohen, J. D.(2006). The physics of optimal decision making: A formalanalysis of models of performance in two-alternativeforced-choice tasks. Psychological Review, 113, 700–765.
Burle, B., Possamai, C. A., Vidal, F., Bonnet, M., & Hasbroucq,T. (2002). Executive control in the Simon effect: Anelectromyographic and distributional analysis. PsychologicalResearch, 66, 324–336.
Burle, B., Roger, C., Allain, S., Vidal, F., & Hasbroucq, T. (2008).Error negativity does not reflect conflict: A reappraisal ofconflict monitoring and anterior cingulate cortex activity.Journal of Cognitive Neuroscience, 20, 1637–1655.
Burle, B., Spieser, L., Roger, C., Casini, L., Hasbroucq, T., &Vidal, F. (2015). Spatial and temporal resolutions of EEG:Is it really black and white? A scalp current density view.International Journal of Psychophysiology, 97, 210–220.
Burle, B., Spieser, L., Servant, M., & Hasbroucq, T. (2014).Distributional reaction time properties in the Eriksen task:Marked differences or hidden similarities with the Simontask? Psychonomic Bulletin & Review, 21, 1003–1010.
Burle, B., Van den Wildenberg, W. P. M., Spieser, L., &Ridderinkhof, K. R. (in press). Preventing (impulsive) errors:Electrophysiological evidence for online inhibitory control overincorrect responses. Psychophysiology. doi:10.1111/psyp.1264.
Burle, B., Vidal, F., Tandonnet, C., & Hasbroucq, T. (2004).Physiological evidence for response inhibition in choicereaction time tasks. Brain and Cognition, 56, 153–164.
Chatrian, G. E., Lettich, E., & Nelson, P. L. (1988). Modifiednomenclature for the “10%” electrode system. Journal ofClinical Neurophysiology, 5, 183–186.
Churchland, A. K., Kiani, R., & Shadlen, M. N. (2008). Decision-making with multiple alternatives. Nature Neuroscience, 11,693–702.
Cisek, P., & Kalaska, J. F. (2010). Neural mechanisms forinteracting with a world full of action choices. Annual Reviewof Neuroscience, 33, 269–298.
Commission Internationale de l’Eclairage. 1976. ISO 11664-4:2008(E)/CIE S 014-4/E:2007: Joint ISO/CIE Standard:Colorimetry—Part 4: CIE 1975 L*a*b* Colour Space.
De Clercq, W., Vergult, A., Vanrumste, B., Van Paesschen, W., &Van Huffel, S. (2006). Canonical correlation analysis appliedto remove muscle artifacts from the electroencephalogram.IEEE Transactions on Biomedical Engineering, 53,2583–2587.
De Jong, R., Liang, C. C., & Lauber, E. (1994). Conditional andunconditional automaticity: A dual-process model of effectsof spatial stimulus-response correspondence. Journal ofExperimental Psychology: Human Perception andPerformance, 20, 731–750.
Delorme, A., & Makeig, S. (2004). EEGLAB: An open sourcetoolbox for analysis of single-trial EEG dynamics includingindependent component analysis. Journal of NeuroscienceMethods, 134, 9–21.
Donner, T. H., Siegel, M., Fries, P., & Engel, A. K. (2009).Buildup of choice-predictive activity in human motor cortexduring perceptual decision making. Current Biology, 19,1581–1585.
Eriksen, C. W., Coles, M. G. H., Morris, L. R., & O’Hara,W. P. (1985). An electromyographic examination ofresponse competition. Bulletin of the Psychonomic Society,23, 165–168.
Ferbert, A., Priori, A., Rothwell, J. C., Day, B. L., Colebatch,J. G., & Marsden, C. D. (1992). Interhemispheric inhibitionof the human motor cortex. Journal of Physiology, 453,525–546.
Fetsch, C. R., Kiani, R., Newsome, W. T., & Shadlen, M. N.(2014). Effects of cortical microstimulation on confidence in aperceptual decision. Neuron, 83, 797–804.
Gevins, A. S., Morgan, N. H., Bressler, S. L., Cutillo, B. A.,White, R. M., Illes, J., et al. (1987). Human neuroelectricpatterns predict performance accuracy. Science, 235,580–585.
Gold, J. I., & Shadlen, M. N. (2000). Representation of aperceptual decision in developing oculomotor commands.Nature, 404, 390–394.
Gold, J. I., & Shadlen, M. N. (2007). The neural basis of decisionmaking. Annual Review of Neuroscience, 30, 535–574.
Gratton, G., Coles, M. G., Sirevaag, E. J., Eriksen, C. W., &Donchin, E. (1988). Pre- and poststimulus activation ofresponse channels: A psychophysiological analysis. Journalof Experimental Psychology: Human Perception andPerformance, 14, 331–344.
Greenhouse, S., & Geisser, S. (1959). On methods in theanalysis of profile data. Psychometrika, 24, 95–112.
Hanes, D. P., & Schall, J. D. (1996). Neural control of voluntarymovement initiation. Science, 274, 427–430.
Hasbroucq, T., Burle, B., Vidal, F., & Possamai, C. A. (2009).Stimulus-hand correspondence and direct response
Servant et al. 1519
activation: An electromyographic analysis. Psychophysiology,46, 1160–1169.
Hasbroucq, T., Possamai, C. A., Bonnet, M., & Vidal, F. (1999).Effect of the irrelevant location of the response signal onchoice reaction time: An electromyographic study in humans.Psychophysiology, 36, 522–526.
Hommel, B. (1994). Spontaneous decay of response-codeactivation. Psychological Research, 56, 261–268.
Hommel, B. (2011). The Simon effect as tool and heuristic.Acta Psychologica, 136, 189–202.
Hübner, R. (2014). Does attentional selectivity in global/ localprocessing improve discretely or gradually? Frontiers inPsychology, 5, 1–11.
Hübner, R., Steinhauser, M., & Lehle, C. (2010). A dual-stagetwo-phase model of selective attention. PsychologicalReview, 117, 759–784.
Jones, E., Oliphant, E., Peterson, P., et al. (2001). SciPy:Open source scientific tools for Python. Retrieved fromwww.scipy.org/
Kayser, J., & Tenke, C. E. (2015). Issues and considerations forusing the scalp surface Laplacian in EEG/ERP research: Atutorial review. International Journal of Psychophysiology,97, 189–209.
Kelly, S. P., & O’Connell, R. G. (2013). Internal and externalinfluences on the rate of sensory evidence accumulationin the human brain. Journal of Neuroscience, 33,19434–19441.
Keuken, M. C., Van Maanen, L., Bogacz, R., Schafer, A.,Neumann, J., Turner, R., et al. (2015). The subthalamicnucleus during decision-making with multiple alternatives.Human Brain Mapping, 36, 4041–4052.
Kiani, R., & Shadlen, M. N. (2009). Representation of confidenceassociated with a decision by neurons in the parietal cortex.Science, 324, 759–764.
Koessler, L., Maillard, L., Benhadid, A., Vignal, J. P., Felblinger,J., Vespignani, H., et al. (2009). Automated cortical projectionof EEG sensors: Anatomical correlation via the international10-10 system. Neuroimage, 46, 64–72.
Leite, F. P., & Ratcliff, R. (2010). Modeling reaction time andaccuracy of multiple-alternative decisions. Attention,Perception, & Psychophysics, 72, 246–273.
Leuthold, H. (2011). The Simon effect in cognitiveelectrophysiology: A short review. Acta Psychologica(Amsterdam), 136, 203–211.
Leuthold, H., & Schröter, H. (2006). Electrophysiologicalevidence for response priming and conflict regulationin the auditory Simon task. Brain Research, 1097,167–180.
Logan, G. (1980). Attention and automaticity in Stroop andpriming tasks: Theory and data. Cognitive Psychology, 12,523–553.
Luce, R. D. (1986). Response times. New York: OxfordUniversity Press.
Mauchly, J. W. (1940). Significance test for sphericity of anormal n-variate distribution. Annals of MathematicalStatistics, 11, 204–209.
Meckler, C., Allain, S., Carbonnell, L., Hasbroucq, T., Burle,B., & Vidal, F. (2010). Motor inhibition and responseexpectancy: A Laplacian ERP study. Biological Psychology,85, 386–392.
Meynier, C., Burle, B., Possamai, C. A., Vidal, F., & Hasbroucq, T.(2009). Neural inhibition and interhemispheric connectionsin two-choice reaction time: A Laplacian ERP study.Psychophysiology, 46, 726–730.
O’Connell, R. G., Dockree, P. M., & Kelly, S. P. (2012). Asupramodal accumulation-to-bound signal that determinesperceptual decisions in humans. Nature Neuroscience, 15,1729–1735.
Peirce, J. W. (2007). PsychoPy—Psychophysics software inPython. Journal of Neuroscience Methods, 162, 8–13.
Perrin, F., Bertrand, O., & Pernier, J. (1987). Scalp currentdensity mapping: Value and estimation from potentialdata. IEEE Transactions on Biomedical Engineering, 34,283–288.
Piéron, H. (1913). Recherches sur les lois de variation destemps de latence sensorielle enfonction des intensitésexcitatrices. Année Psychologique, 22, 17–96.
Praamstra, P., & Oostenveld, R. (2003). Attention andmovement-related motor cortex activation: A high-densityEEG study of spatial stimulus–response compatibility. BrainResearch, Cognitive Brain Research, 16, 309–322.
Pratte, M. S., Rouder, J. N., Morey, R. D., & Feng, C. (2010).Exploring the differences in distributional propertiesbetween Stroop and Simon effects using delta plots.Attention, Perception, & Psychophysics, 72, 2013–2025.
Purcell, B. A., Heitz, R. P., Cohen, J. Y., Schall, J. D., Logan,G. D., & Palmeri, T. J. (2010). Neurally constrained modelingof perceptual decision making. Psychological Review, 117,1113–1143.
Purcell, B. A., Schall, J. D., Logan, G. D., & Palmeri, T. J. (2012).From salience to saccades: Multiple-alternative gatedstochastic accumulator model of visual search. Journal ofNeuroscience, 32, 3433–3446.
Ratcliff, R. (1978). A theory of memory retrieval. PsychologicalReview, 85, 59–108.
Ratcliff, R. (2013). Parameter variability and distributionalassumptions in the diffusion model. Psychological Review,20, 281–292.
Ratcliff, R., Cherian, A., & Segraves, M. (2003). A comparisonof macaque behavior and superior colliculus neuronalactivity to predictions from models of two-choice decisions.Journal of Neurophysiology, 90, 1392–1407.
Ratcliff, R., & McKoon, G. (2008). The diffusion decision model:Theory and data for two-choice decision tasks. NeuralComputation, 20, 873–922.
Ratcliff, R., & Smith, P. L. (2004). A comparison of sequentialsampling models for two-choice reaction time. PsychologicalReview, 111, 333–367.
Ratcliff, R., & Starns, J. J. (2013). Modeling confidencejudgments, response times, and multiple choices in decisionmaking: Recognition memory and motion discrimination.Psychological Review, 120, 697–719.
Ridderinkhof, K. R. (2002). Activation and suppression inconflict tasks: Empirical clarification through distributionalanalyses. In W. Prinz & B. Hommel (Eds.), Commonmechanisms in perception and action. Attention andperformance, XIX (pp. 494–519). Oxford: Oxford UniversityPress.
Roberts, S., & Pashler, H. (2000). How persuasive is a good fit?A comment on theory testing. Psychological Review, 107,358–367.
Roitman, J. D., & Shadlen, M. N. (2002). Response of neuronsin the lateral intraparietal area during a combined visualdiscrimination reaction time task. Journal of Neuroscience,22, 9475–9489.
Romo, R., Hernandez, A., Zainos, A., Lemus, L., & Brody,C. D. (2002). Neuronal correlates of decision-making insecondary somatosensory cortex. Nature Neuroscience, 5,1217–1225.
Roswarski, T. E., & Proctor, R. W. (2003). The role ofinstructions, practice, and stimulus-hand correspondenceon the Simon effect. Psychological Research, 67,43–55.
Schall, J. D. (2004). On building a bridge between brainand behavior. Annual Review of Psychology, 55,23–50.
1520 Journal of Cognitive Neuroscience Volume 28, Number 10
Schwarz, W., & Miller, J. (2012). Response time models ofdelta plots with negative-going slopes. Psychonomic Bulletinand Review, 19, 555–574.
Selen, L. P., Shadlen, M. N., & Wolpert, D. M. (2012).Deliberation in the motor system: Reflex gains track evolvingevidence leading to a decision. Journal of Neuroscience,32, 2276–2286.
Servant, M., Montagnini, A., & Burle, B. (2014). Conflict tasks andthe diffusion framework: Insight in model constraints basedon psychological laws. Cognitive Psychology, 72, 162–195.
Servant, M., White, C., Montagnini, A., & Burle, B. (2015). Usingcovert response activation to test latent assumptions offormal decision-making models in humans. Journal ofNeuroscience, 35, 10371–10385.
Simon, J. R., & Small, A. M., Jr. (1969). Processing auditoryinformation: Interference from an irrelevant cue. Journal ofApplied Psychology, 53, 433–435.
Tandonnet, C., Burle, B., Vidal, F., & Hasbroucq, T. (2006).Knowing when to respond and the efficiency of the corticalmotor command: A Laplacian ERP study. Brain Research,1109, 158–163.
Teller, D. Y. (1984). Linking propositions. Vision Research,24, 1233–1246.
Ulrich, R., Schröter, H., Leuthold, H., & Birngruber, T. (2015).Automatic and controlled stimulus processing in conflicttasks: Superimposed diffusion processes and delta functions.Cognitive Psychology, 78, 148–174.
Usher, M., & McClelland, J. L. (2004). Loss aversion andinhibition in dynamical models of multialternative choice.Psychological Review, 111, 757–769.
Valle-Inclan, F., & Redondo, M. (1998). On the automaticityof ipsilateral response activation in the Simon effect.Psychophysiology, 35, 366–371.
Vallesi, A., Mapelli, D., Schiff, S., Amodio, P., & Umilta, C.(2005). Horizontal and vertical Simon effect: Differentunderlying mechanisms? Cognition, 96, B33–B43.
Van Boxtel, G. J., Geraats, L. H., Van den Berg-Lenssen, M. M.,& Brunia, C. H. (1993). Detection of EMG onset in ERPresearch. Psychophysiology, 30, 405–412.
Van den Berg, R., Anandalingam, K., Zylberberg, A., Kiani, R.,Shadlen, M. N., & Wolpert, D. M. (2016). A common
mechanism underlies changes of mind about decisionsand confidence. Elife, 5, 1–21.
Van den Wildenberg, W. P., Wylie, S. A., Forstmann, B. U.,Burle, B., Hasbroucq, T., & Ridderinkhof, K. R. (2010).To head or to heed? Beyond the surface of selective actioninhibition: A review. Frontiers in Human Neuroscience,4, 222.
Van Maanen, L., Grasman, R. P., Forstmann, B. U., Keuken,M. C., Brown, S. D., & Wagenmakers, E. J. (2012). Similarityand number of alternatives in the random-dot motionparadigm. Attention, Perception, & Psychophysics, 74, 739–753.
Vidal, F., Burle, B., Grapperon, J., & Hasbroucq, T. (2011).An ERP study of cognitive architecture and the insertion ofmental processes: Donders revisited. Psychophysiology, 48,1242–1251.
Vidal, F., Grapperon, J., Bonnet, M., & Hasbroucq, T. (2003).The nature of unilateral motor commands in between-handchoice tasks as revealed by surface Laplacian estimation.Psychophysiology, 40, 796–805.
Wagenmakers, E.-J., & Brown, S. (2007). On the linearrelation between the mean and the standard deviationof a response time distribution. Psychological Review,114, 830–841.
Wallace, R. J. (1971). S-R compatibility and the idea of a responsecode. Journal of Experimental Psychology, 88, 354–360.
Wascher, E., Schatz, U., Kuder, T., & Verleger, R. (2001).Validity and boundary conditions of automatic responseactivation in the Simon task. Journal of ExperimentalPsychology: Human Perception and Performance, 27,731–751.
Wascher, E., & Wauschkuhn, B. (1996). The interaction ofstimulus- and response-related processes measuredby event-related lateralizations of the EEG.Electroencephalography and Clinical Neurophysiology,99, 149–162.
White, C. N., Ratcliff, R., & Starns, J. J. (2011). Diffusion modelsof the flanker task: Discrete versus gradual attentionalselection. Cognitive Psychology, 63, 210–238.
Winer, B. J. (1971). Statistical principles in experimentaldesign: Design and analysis of factorial experiments.New York: McGraw-Hill.
Servant et al. 1521