linking globalization to local land uses: how eco-consumers and
TRANSCRIPT
World Development Vol. xx, No. x, pp. xxx–xxx, 2012� 2012 Elsevier Ltd. All rights reserved
0305-750X/$ - see front matter
www.elsevier.com/locate/worlddevhttp://dx.doi.org/10.1016/j.worlddev.2012.05.018
Linking Globalization to Local Land Uses: How Eco-consumers
and Gourmands are Changing the Colombian Coffee Landscapes
XIMENA RUEDA and ERIC F. LAMBIN *
Stanford University, USA
Please care Cha
Summary. — Market trends are becoming prominent forces shaping local landscapes. The increasing demand for high-quality and sus-tainable coffees is driving land-use decisions among Colombian farmers. A value chain analysis shows that farmers who sell to differen-tiated markets significantly captured a larger portion of the value added and faced lower volatility than mainstream producers.Consequently, regions apt for producing differentiated coffees experienced the greatest increase in area planted. Tracing the value chainreveals how land use decisions increasingly depend on the pressures and opportunities created by global markets, with detectable impactson livelihoods and landscapes.� 2012 Elsevier Ltd. All rights reserved.
Key words — land change, value chain, globalization, Americas, Colombia
* We thank the Colombian Coffee Growers Federation (FNC) for its ge-
nerous support to conduct this research. In particular, we are grateful to
Luis Fernando Samper and Andres Valencia who granted us access to the
information and provided useful comments on the research proposal; to
Rodrigo Calderon, Alejandro Florez, Ana Marıa Gil, Carlos Alberto
Gonzalez, Jose Felipe Jaramillo, Carmen L. Parada, and Santiago Silva at
the Commercial Division for the information and time they devoted to
answer our questions. In the Technical Division we would like to thank
Juan Pablo Becerra and Martha Cordoba who went at great lengths to
provide access to spatial data and information from SICA. Dr. Edgar
Moreno, director of the Quality Laboratory at Almacafe as well as Ar-
mando Cortes and Henry Alirio Martınez, cuppers from the lab, provided
their expert judgment in identifying the terroirs with high-quality cup
profiles used for this analysis. We would like to thank the coordinators of
specialty coffees in the 15 regional committees for their assistance in co-
mpleting the information used in this study. We are especially grateful to
the two anonymous reviewers for their insightful comments. Final revisionaccepted: May 25, 2012.
1. INTRODUCTION
Land is one of the primary assets rural people depend on.Changes in land use are not only crucial for the functioningof natural ecosystems but also for the livelihoods of millionsof rural dwellers. As the flow of information, trade, and peoplearound the globe intensifies, global markets become promi-nent drivers of land-use decisions in distant landscapes(Lambin & Meyfroidt, 2011). Demand can trigger direct landchanges when natural ecosystems are cleared to make roomfor cash crops, timber plantations, or cattle ranching (Ger-bens-Leenes & Nonhebel, 2002; Gibbs et al., 2010; Meyfroidt,Rudel, & Lambin, 2010). The intensification in cross-borderflow of people, capital, goods, services and information, asso-ciated with globalization, also creates complex, less directinteractions between markets and land uses as the case of glob-alized labor force movements and bio-fuel energy mandatesillustrate (Fargione, Hill, Tilman, Polasky, & Hawthorne,2008; Hecht, 2010; Koh, Miettinen, Liew, & Ghazoul, 2011).
Traditional analyses of land-use decisions have focused onunderstanding and predicting land transformations in the pres-ence of exogenous variables such as non-farm income, laboravailability, proximity to markets, and land suitability, amongothers (Angelsen & Kaimowitz, 1999; Rindfuss et al., 2007;Turner, Geoghegan, & Foster, 2004). These study designs havebeen predicated on the assumption that land conversion orintensification mostly takes place in response to an increasein demand from local or national markets. The mechanismsthrough which market signals reach farmers and are incorpo-rated in farmers’ land-use decisions remain poorly understood.
Of particular interest is the production of normal or supe-rior goods, whose consumption rises as income increases(Rask & Rask, 2011). Superior goods such as coffee, cocoa,and tea tend to be highly intensive in labor and are produced,for the most part, in tropical regions by either small farmers orlarge plantations with hired labor.
This study takes the case of coffee, one of the most globallytraded commodities (Daviron & Ponte, 2005) whose demandhas increased steadily for at least a decade. The objectivewas to understand to which extent the increase in global de-mand has been reflected in higher prices to farmers, andhow those price signals have altered farmers’ land uses atthe local level for Colombian coffee growers. We start by
1
ite this article in press as: Rueda, X., & Lambin, E. F. Linking Glonging the Colombian Coffee Landscapes, World Development (20
introducing the global value chain (GVC) approach andmethods (Gereffi, Humphrey, & Sturgeon, 2005; Gereffi &Korzeniewicz, 1994a; Kaplinsky, 2000) to analyze the shareof value created to the consumer at the different stages inthe production, transformation, and delivery of roasted coffee.We then describe the evolution of the global coffee marketsince the collapse of the International Coffee Agreement(Gilbert, 1996) to the recent phase of market bifurcation intomainstream and high-end, differentiated coffees (Bitzer,Francken, & Glasbergen, 2008; Petkova, 2006), and its mani-festations in the Colombian coffee sector.
This background sets the framework to test the followinghypotheses: (i) farmers who sell to differentiated markets—either because of quality or claims to sustainability—capturea larger portion of the value added to consumers than farmersof mainstream coffee; (ii) premiums paid to farmers for differ-entiated coffees are independent of movements in internationalprices; and (iii) the country’s coffee landscapes have changedin response to exposure to global market trends as the regionswith the environmental, economic, and social conditions thatwere most appropriate to increase production of sustainable
balization toLocal Land Uses: How Eco-consumers and Gourmands12), http://dx.doi.org/10.1016/j.worlddev.2012.05.018
2 WORLD DEVELOPMENT
and high-quality cup profile coffee experienced the greatest in-crease in area planted.
2. BACKGROUND
(a) Globalized value chains
GVC analysis has been used to understand how firms orenterprises organize in a network that often spans many coun-tries to produce, transform, distribute, and deliver a specificcommodity (Gereffi & Korzeniewicz, 1994a). GVC has signif-icant links to the work of international business scholars andthe literature on international competitiveness (Kogut, 1985;Porter, 1985), but also to world-system theorists (Bair, 2005;Hopkins & Wallerstein, 1986) and network analysis (Gereffi& Korzeniewicz, 1994b). A unifying theory of global chainanalysis remains elusive, and the literature often focuses onthe individual firm or sector, ignoring the larger, hierarchicalstructures in which they are embedded (Bair, 2005). In the faceof increased integration of manufacturing, distribution, andconsumption across the globe, GVC has been also used to un-ravel the governance structures, including power asymetries,coordination among actors, and the underlying strategicbehavior of large actors along the value chain of today’s glo-bal industries (Gereffi et al., 2005; Gibbon, Bair, & Ponte,2008; Petkova, 2006). Particular attention has been paid toagricultural commodities produced in developing countriesand consumed largely in developed economies (Gereffi et al.,2005; Muradian & Pelupessy, 2005; Petkova, 2006).
More recently, the literature has expanded to include anal-yses on differentiated markets, with particular attention to theadvent of ethically traded products and its potential toproduce fairer conditions in the distribution of value amongactors and for improving the competitive position (upgrading)in the upstream links (Dauvergne & Lister, 2012; Giovannucci& Ponte, 2005; Lee, Gereffi, & Beauvais, 2010; Perez-Aleman,2011; Petkova, 2006). The global value chain for coffee has re-ceived significant attention, especially as it pertains to LatinAmerican farmers (Daviron & Ponte, 2005; Fitter &Kaplinsky, 2001; Giovannucci & Ponte, 2005; Muradian &Pelupessy, 2005; Perez-Aleman, 2011; Petkova, 2006; Ponte,2002; Talbot, 1997; Valkila, 2009). Most of these studies pointout the limited ability of certification to produce economicbenefits to farmers, given the increasing power concentrationof actors in consuming countries and the increased de-concen-tration in producing ones (Fitter & Kaplinsky, 2001; Ponte,2002). As there are costs associated with certification schemes,their ability to engage the most marginalized and impover-ished farmers remains questionable (Valkila, 2009). As inter-national prices for coffee have started to recover, theeffectiveness of the fair-trade price, established more thantwo decades ago, has come into question (Jaffee, 2012).Authors are more hopeful about the ability of standards tohelp farmers upgrade (Giovannucci & Ponte, 2005; Muradian& Pelupessy, 2005) and on the opportunities to establish newpartnerships (Petkova, 2006), although evidence in both areasis scant.
The incorporation of quality and sustainability standardsinto GVC analysis makes apparent the linkages betweenmacro-scale processes of industry concentration and productdifferentiation, and micro-level decision made by local produc-ers (Dauvergne & Lister, 2012; Lee et al., 2010; Perez-Aleman,2011). It has enabled research on the role of standards onredistributing value among actors and on creating opportuni-ties for upgrading. The spatial expression of those linkages on
Please cite this article in press as: Rueda, X., & Lambin, E. F. Linking Gloare Changing the Colombian Coffee Landscapes, World Development (20
land-use decisions remains understudied, and constitutes thefocus of this analysis.
(b) The coffee market: from the demise of the InternationalCoffee Agreement to champion of brand environmentalism
The International Coffee Agreement (ICA) betweenproducing and importing countries came to an end in 1989when countries failed to agree on the export quotas thathad kept prices relatively stable for over 30 years (Daviron& Ponte, 2005; Muradian & Pelupessy, 2005). The coinciden-tal increase in the production from Brazil and Vietnam leadto the further reduction of international prices that reached,in 2001, its lowest level in 33 years (Ramirez, Silva, Valenzu-ela, Villegas, & Villegas, 2002). Producers around the worldwere exposed not only to the extreme volatility of the market(Muradian & Pelupessy, 2005) but also to the increasingconcentration of power in the downstream links of the chain.Coffee is a labor-intensive crop grown in more than fiftycountries, affecting the livelihoods of millions of people.Movements in the global coffee market can thus haveprofound impacts on poverty and land use of many regionsof the globe.
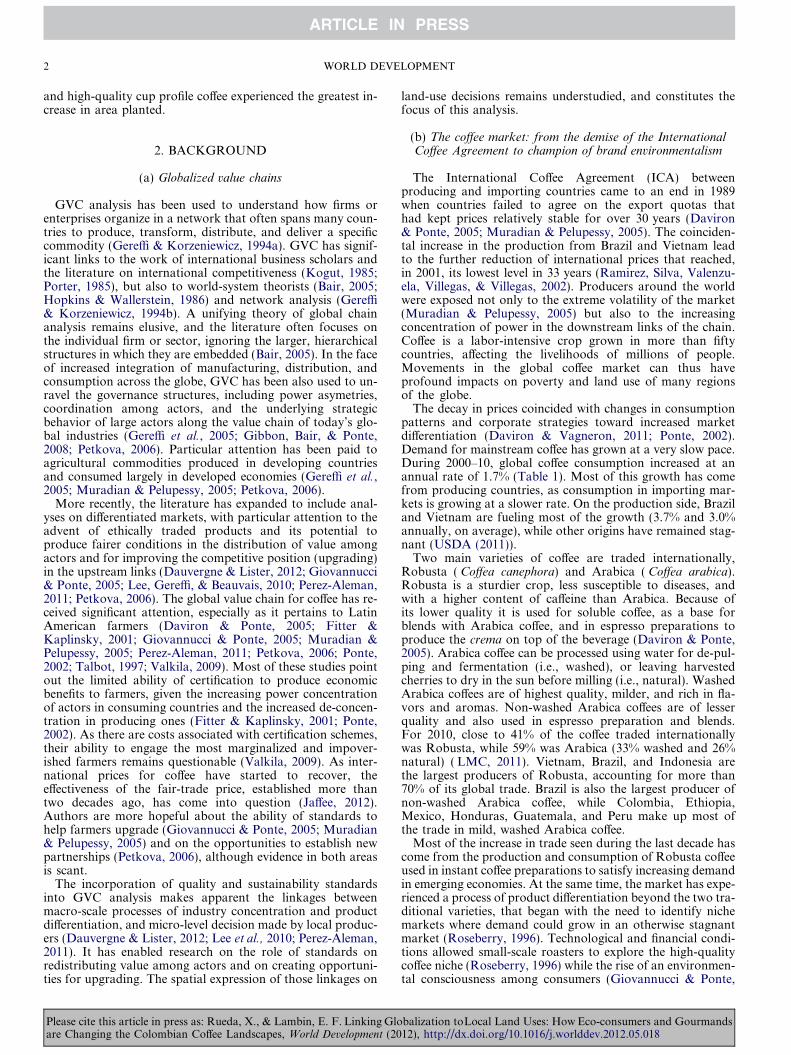
The decay in prices coincided with changes in consumptionpatterns and corporate strategies toward increased marketdifferentiation (Daviron & Vagneron, 2011; Ponte, 2002).Demand for mainstream coffee has grown at a very slow pace.During 2000–10, global coffee consumption increased at anannual rate of 1.7% (Table 1). Most of this growth has comefrom producing countries, as consumption in importing mar-kets is growing at a slower rate. On the production side, Braziland Vietnam are fueling most of the growth (3.7% and 3.0%annually, on average), while other origins have remained stag-nant (USDA (2011)).
Two main varieties of coffee are traded internationally,Robusta ( Coffea canephora) and Arabica ( Coffea arabica).Robusta is a sturdier crop, less susceptible to diseases, andwith a higher content of caffeine than Arabica. Because ofits lower quality it is used for soluble coffee, as a base forblends with Arabica coffee, and in espresso preparations toproduce the crema on top of the beverage (Daviron & Ponte,2005). Arabica coffee can be processed using water for de-pul-ping and fermentation (i.e., washed), or leaving harvestedcherries to dry in the sun before milling (i.e., natural). WashedArabica coffees are of highest quality, milder, and rich in fla-vors and aromas. Non-washed Arabica coffees are of lesserquality and also used in espresso preparation and blends.For 2010, close to 41% of the coffee traded internationallywas Robusta, while 59% was Arabica (33% washed and 26%natural) ( LMC, 2011). Vietnam, Brazil, and Indonesia arethe largest producers of Robusta, accounting for more than70% of its global trade. Brazil is also the largest producer ofnon-washed Arabica coffee, while Colombia, Ethiopia,Mexico, Honduras, Guatemala, and Peru make up most ofthe trade in mild, washed Arabica coffee.
Most of the increase in trade seen during the last decade hascome from the production and consumption of Robusta coffeeused in instant coffee preparations to satisfy increasing demandin emerging economies. At the same time, the market has expe-rienced a process of product differentiation beyond the two tra-ditional varieties, that began with the need to identify nichemarkets where demand could grow in an otherwise stagnantmarket (Roseberry, 1996). Technological and financial condi-tions allowed small-scale roasters to explore the high-qualitycoffee niche (Roseberry, 1996) while the rise of an environmen-tal consciousness among consumers (Giovannucci & Ponte,
balization toLocal Land Uses: How Eco-consumers and Gourmands12), http://dx.doi.org/10.1016/j.worlddev.2012.05.018
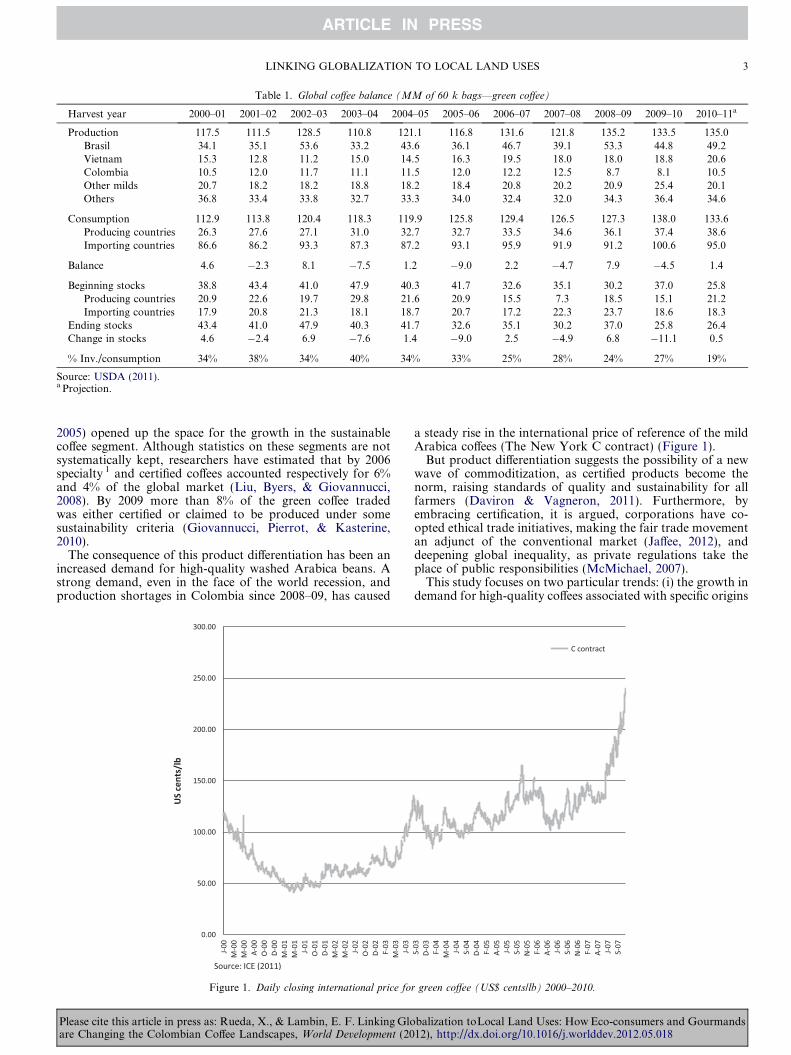
Table 1. Global coffee balance (MM of 60 k bags—green coffee)
Harvest year 2000–01 2001–02 2002–03 2003–04 2004–05 2005–06 2006–07 2007–08 2008–09 2009–10 2010–11a
Production 117.5 111.5 128.5 110.8 121.1 116.8 131.6 121.8 135.2 133.5 135.0Brasil 34.1 35.1 53.6 33.2 43.6 36.1 46.7 39.1 53.3 44.8 49.2Vietnam 15.3 12.8 11.2 15.0 14.5 16.3 19.5 18.0 18.0 18.8 20.6Colombia 10.5 12.0 11.7 11.1 11.5 12.0 12.2 12.5 8.7 8.1 10.5Other milds 20.7 18.2 18.2 18.8 18.2 18.4 20.8 20.2 20.9 25.4 20.1Others 36.8 33.4 33.8 32.7 33.3 34.0 32.4 32.0 34.3 36.4 34.6
Consumption 112.9 113.8 120.4 118.3 119.9 125.8 129.4 126.5 127.3 138.0 133.6Producing countries 26.3 27.6 27.1 31.0 32.7 32.7 33.5 34.6 36.1 37.4 38.6Importing countries 86.6 86.2 93.3 87.3 87.2 93.1 95.9 91.9 91.2 100.6 95.0
Balance 4.6 �2.3 8.1 �7.5 1.2 �9.0 2.2 �4.7 7.9 �4.5 1.4
Beginning stocks 38.8 43.4 41.0 47.9 40.3 41.7 32.6 35.1 30.2 37.0 25.8Producing countries 20.9 22.6 19.7 29.8 21.6 20.9 15.5 7.3 18.5 15.1 21.2Importing countries 17.9 20.8 21.3 18.1 18.7 20.7 17.2 22.3 23.7 18.6 18.3
Ending stocks 43.4 41.0 47.9 40.3 41.7 32.6 35.1 30.2 37.0 25.8 26.4Change in stocks 4.6 �2.4 6.9 �7.6 1.4 �9.0 2.5 �4.9 6.8 �11.1 0.5
% Inv./consumption 34% 38% 34% 40% 34% 33% 25% 28% 24% 27% 19%
Source: USDA (2011).a Projection.
LINKING GLOBALIZATION TO LOCAL LAND USES 3
2005) opened up the space for the growth in the sustainablecoffee segment. Although statistics on these segments are notsystematically kept, researchers have estimated that by 2006specialty 1 and certified coffees accounted respectively for 6%and 4% of the global market (Liu, Byers, & Giovannucci,2008). By 2009 more than 8% of the green coffee tradedwas either certified or claimed to be produced under somesustainability criteria (Giovannucci, Pierrot, & Kasterine,2010).
The consequence of this product differentiation has been anincreased demand for high-quality washed Arabica beans. Astrong demand, even in the face of the world recession, andproduction shortages in Colombia since 2008–09, has caused
Figure 1. Daily closing international price fo
Please cite this article in press as: Rueda, X., & Lambin, E. F. Linking Gloare Changing the Colombian Coffee Landscapes, World Development (20
a steady rise in the international price of reference of the mildArabica coffees (The New York C contract) (Figure 1).
But product differentiation suggests the possibility of a newwave of commoditization, as certified products become thenorm, raising standards of quality and sustainability for allfarmers (Daviron & Vagneron, 2011). Furthermore, byembracing certification, it is argued, corporations have co-opted ethical trade initiatives, making the fair trade movementan adjunct of the conventional market (Jaffee, 2012), anddeepening global inequality, as private regulations take theplace of public responsibilities (McMichael, 2007).
This study focuses on two particular trends: (i) the growth indemand for high-quality coffees associated with specific origins
r green coffee (US$ cents/lb) 2000–2010.
balization toLocal Land Uses: How Eco-consumers and Gourmands12), http://dx.doi.org/10.1016/j.worlddev.2012.05.018
4 WORLD DEVELOPMENT
and cup profiles (terroirs); and (ii) the increasing consumerpreference for “sustainable coffees”, those produced under ex-plicit codes of conduct that aim at more sustainable coffeepractices, emphasizing either the environmental, social, or eco-nomic pillar of sustainability and verified by an independentparty (Giovannucci & Ponte, 2005; Giovannucci et al.,2010). It takes the case of Colombia, the largest producer ofhigh-quality mild Arabica coffee and the fourth largest sup-plier of coffee in the world. An understanding of the processeslinking consumption trends to farmers’ land uses can providetools for catalyzing consumers’ demand toward more sustain-able human-environment arrangements throughout the world,for coffee and other commodities.
3. THE COFFEE SECTOR IN COLOMBIA
(a) The value chain for Colombian coffee
What follows is a description of the coffee chain for thecountry and of the role of the Colombian Coffee GrowersFederation (FNC) as the main player in the local coffee trade.
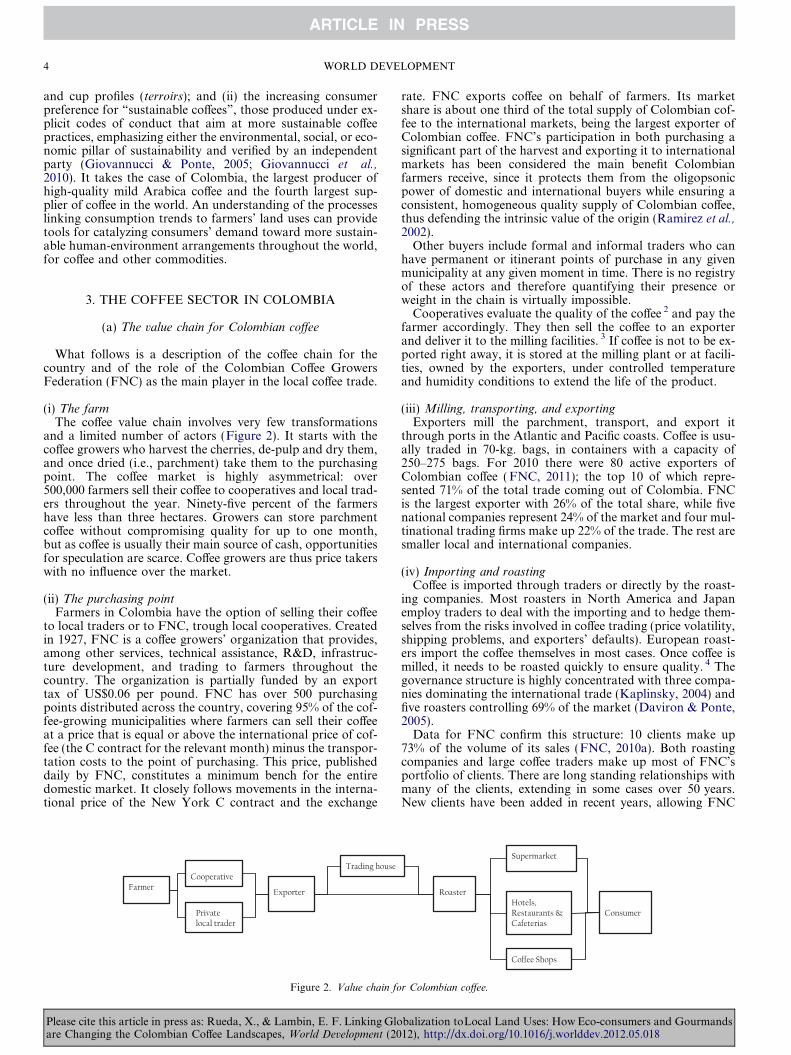
(i) The farmThe coffee value chain involves very few transformations
and a limited number of actors (Figure 2). It starts with thecoffee growers who harvest the cherries, de-pulp and dry them,and once dried (i.e., parchment) take them to the purchasingpoint. The coffee market is highly asymmetrical: over500,000 farmers sell their coffee to cooperatives and local trad-ers throughout the year. Ninety-five percent of the farmershave less than three hectares. Growers can store parchmentcoffee without compromising quality for up to one month,but as coffee is usually their main source of cash, opportunitiesfor speculation are scarce. Coffee growers are thus price takerswith no influence over the market.
(ii) The purchasing pointFarmers in Colombia have the option of selling their coffee
to local traders or to FNC, trough local cooperatives. Createdin 1927, FNC is a coffee growers’ organization that provides,among other services, technical assistance, R&D, infrastruc-ture development, and trading to farmers throughout thecountry. The organization is partially funded by an exporttax of US$0.06 per pound. FNC has over 500 purchasingpoints distributed across the country, covering 95% of the cof-fee-growing municipalities where farmers can sell their coffeeat a price that is equal or above the international price of cof-fee (the C contract for the relevant month) minus the transpor-tation costs to the point of purchasing. This price, publisheddaily by FNC, constitutes a minimum bench for the entiredomestic market. It closely follows movements in the interna-tional price of the New York C contract and the exchange
Figure 2. Value chain fo
Please cite this article in press as: Rueda, X., & Lambin, E. F. Linking Gloare Changing the Colombian Coffee Landscapes, World Development (20
rate. FNC exports coffee on behalf of farmers. Its marketshare is about one third of the total supply of Colombian cof-fee to the international markets, being the largest exporter ofColombian coffee. FNC’s participation in both purchasing asignificant part of the harvest and exporting it to internationalmarkets has been considered the main benefit Colombianfarmers receive, since it protects them from the oligopsonicpower of domestic and international buyers while ensuring aconsistent, homogeneous quality supply of Colombian coffee,thus defending the intrinsic value of the origin (Ramirez et al.,2002).
Other buyers include formal and informal traders who canhave permanent or itinerant points of purchase in any givenmunicipality at any given moment in time. There is no registryof these actors and therefore quantifying their presence orweight in the chain is virtually impossible.
Cooperatives evaluate the quality of the coffee 2 and pay thefarmer accordingly. They then sell the coffee to an exporterand deliver it to the milling facilities. 3 If coffee is not to be ex-ported right away, it is stored at the milling plant or at facili-ties, owned by the exporters, under controlled temperatureand humidity conditions to extend the life of the product.
(iii) Milling, transporting, and exportingExporters mill the parchment, transport, and export it
through ports in the Atlantic and Pacific coasts. Coffee is usu-ally traded in 70-kg. bags, in containers with a capacity of250–275 bags. For 2010 there were 80 active exporters ofColombian coffee (FNC, 2011); the top 10 of which repre-sented 71% of the total trade coming out of Colombia. FNCis the largest exporter with 26% of the total share, while fivenational companies represent 24% of the market and four mul-tinational trading firms make up 22% of the trade. The rest aresmaller local and international companies.
(iv) Importing and roastingCoffee is imported through traders or directly by the roast-
ing companies. Most roasters in North America and Japanemploy traders to deal with the importing and to hedge them-selves from the risks involved in coffee trading (price volatility,shipping problems, and exporters’ defaults). European roast-ers import the coffee themselves in most cases. Once coffee ismilled, it needs to be roasted quickly to ensure quality. 4 Thegovernance structure is highly concentrated with three compa-nies dominating the international trade (Kaplinsky, 2004) andfive roasters controlling 69% of the market (Daviron & Ponte,2005).
Data for FNC confirm this structure: 10 clients make up73% of the volume of its sales (FNC, 2010a). Both roastingcompanies and large coffee traders make up most of FNC’sportfolio of clients. There are long standing relationships withmany of the clients, extending in some cases over 50 years.New clients have been added in recent years, allowing FNC
r Colombian coffee.
balization toLocal Land Uses: How Eco-consumers and Gourmands12), http://dx.doi.org/10.1016/j.worlddev.2012.05.018
LINKING GLOBALIZATION TO LOCAL LAND USES 5
to reach new markets and develop commercial relationshipswith clients who demand products with specific attributes oforigin or claims to sustainability. Both roasters and tradersparticipate in these market segments, and they vary from largecorporations to small coffee shops that roast coffee in smallbatches. The level of coordination between roasters/importersand FNC varies from very loose, in which agreement isreached based solely on the differential above the C contractat which Colombian coffee will be traded for a specific monthof delivery, to very tight, in which clients and local expertsidentify specific cup profiles, linked to particular communitiesin the field. Clients, together with FNC, work to improve andensure quality and production methods, not only through thedevelopment of standards and traceability systems, but alsothrough direct investments in technical assistance, farmingpractices, and technological upgrade.
(v) Distribution: horeca, retailers, coffee shopsRoasters distribute coffee via three channels: coffee shops,
supermarkets, and horeca (hotels, restaurants and cafeterias).FNC does not participate directly from this market but hasshares in Procafecol, a local company with shops in Colombia,three other Latin American countries, Spain, and the US (FNC, 2010b). Procafecol has a significant share of the endmarket in Colombia but a minor presence elsewhere.
(vi) PricingAs in the case of many agricultural products, coffee is traded
internationally at a commodity exchange for both physicaltrading and derivatives. A standardized contract, the C con-tract of the New York’s Inter-Continental Exchange (ICE),is the world’s benchmark for trading Arabica coffee. It hasset criteria in terms of quality, quantity, delivery month, andlocation. The contract set the prices for coffee coming fromnineteen countries of origin 5 to be delivered to licensed ware-houses in ports in the United States and Europe. The contractsize is 37,500 lb and the delivery months for futures areMarch, May, July, September, and December (ICE, 2011).
Coffee is not a fully substitutable commodity, since attri-butes relating to origin, production systems, processing, cup,and physical defects alter the price it commands. To accountfor those differences, price is commonly set “at a differential”,this is, the amount of cents above or below the C contract thatboth exporter and importer agree upon. Exporters and buyersalso agree on who will decide the date at which the price of theC contract will be set (i.e., “buyers call” versus “sellers call”)and the maximum period for this call to be made. These con-tracts usually follow the norms designed and regulated by theGreen Coffee Association and the European Coffee Federa-tion, but can also be custom designed between the parties.
(b) Colombia’s value-added strategy
Aware of the increasing demand for high quality and sus-tainable coffees and as a response to the long-term trend ofdecreasing price for mainstream coffee, FNC put in place a va-lue-added strategy designed to create greater revenue to farm-ers by adding more value at origin, and entering new marketsegments that would create a larger recognition of the origin(Reina & Silva, 2008). The strategy focused on the develop-ment of “cafes especiales”, defined as those coffees for whichconsumers are willing to pay a higher price that is in turntransferred to the farmers (Reina & Silva, 2008). FNC workedalong three lines: (i) fostering the production and marketing ofthird-party certified or verified sustainable coffees; (ii) identify-ing and controlling quality of specific cup profiles attached to
Please cite this article in press as: Rueda, X., & Lambin, E. F. Linking Gloare Changing the Colombian Coffee Landscapes, World Development (20
particular origins within Colombia; and (iii) producing blendsand preparations to satisfy specific client’s requests. To do so,FNC relied on its contract with the Colombian governmentthat dates back to 1928 and has been periodically renewedsince that allows it to collect and invest the export tax paidby coffee growers in: (i) actively participating in purchasinga substantial part of the annual harvest; (ii) investing in re-search and development; (iii) maintaining a nation-wide exten-sion service; and (iv) promoting Colombian coffee atinternational markets. Resources are managed in the FondoNacional del Cafe, a public fund privately managed byFNC. Additional funding from the Colombian governmenthas been provided through the Plan de Apoyo a la Caficultura(2002–07 and 2008–11), investing more than one billion dol-lars in the decade, to help cover the cost of running all the pro-grams as the Fondo’s finances were hardly hit by the crisis ofthe 1990s.
In 2002, when the program was launched, FNC exported209,385 bags of coffee with some level of differentiation,roughly 8% of FNC’s total exports. Less than 5,000 bags ofsustainable coffees were exported, mainly organic, and about59,000 bags from specific origins within Colombia. By 2009,exports of specialty coffees rose to almost one million bags(about half of all FNC exports) of which 624,000 were sustain-able coffees 6 and almost 150,000 came from specific origins.The growth was spectacular in both segments: origin coffeesalmost tripled in 7 years, while sustainable coffees were 150times larger in 2009 than in 2002 (Figure 3). Three elementscontributed to the success of this endeavor: (i) FNC’s credibil-ity and long time engagement with farmers through the exten-sion service (Guhl, 2008) facilitated the adoption of thesustainability and quality standards; (ii) the network of coop-eratives that actively buy coffee throughout the country pro-vided both a price transfer mechanism and a traceabilitysystem that engaged farmers and clients in the trade of “cafesespeciales”; (iii) FNC’s participation in the export market andactive marketing strategies provided a portfolio of old andnew clients for the segments being promoted. Figures providedhere might underestimate the total exports of differentiatedcoffees that came from Colombia as data only exist forFNC. Nevertheless, FNC’s figures are representative since itis the largest exporter and the first to implement the value-added strategy launched in 2002.
(c) The geography of coffee production in Colombia
The rise in demand for certain types of coffee may have af-fected the geographic distribution of coffee production inColombia as only particular regions with desirable cup profilesor environmental conditions were suitable to satisfy this de-mand. Beyond market signals, other factors create incentivesand constraints for farmers’ land-use decisions. These includelabor availability (Caldas et al., 2007; Cropper, Griffiths, &Mani, 1999), non-farm income opportunities (Rudel et al.,2005), land endowments (Abizaid & Coomes, 2004), institu-tional factors such as local support for engaging in these marketsegments, and the reduction in violence in rural areas, whichhas been associated with economic development and invest-ment in rural activities (Munoz Mora, 2010; Rettberg, 2010).
Because of the additional value created at origin and the rel-ative scarcity of sustainable and high-quality coffees, farmers ofthese coffee producing regions are expected to capture a largerportion of the value added through the chain compared tomainstream coffees. Considering that the C contract and theColombian differential integrate the relative scarcity of boththe mild washed Arabicas and the Colombian origin, additional
balization toLocal Land Uses: How Eco-consumers and Gourmands12), http://dx.doi.org/10.1016/j.worlddev.2012.05.018
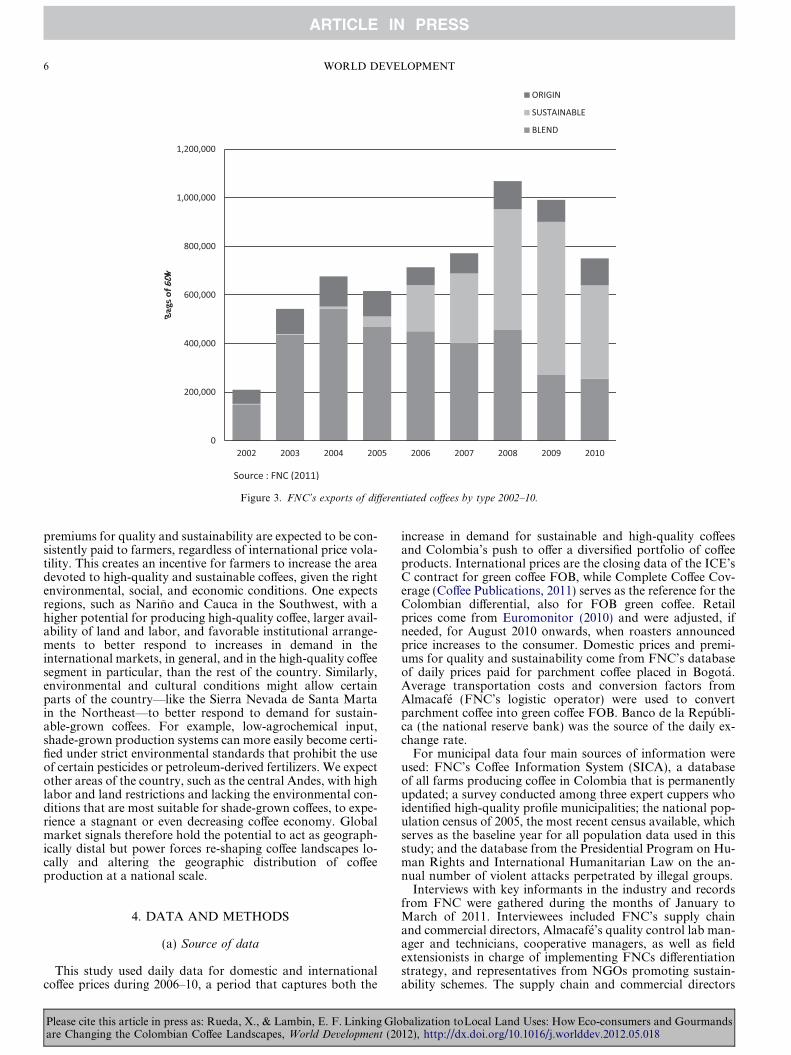
Figure 3. FNC’s exports of differentiated coffees by type 2002–10.
6 WORLD DEVELOPMENT
premiums for quality and sustainability are expected to be con-sistently paid to farmers, regardless of international price vola-tility. This creates an incentive for farmers to increase the areadevoted to high-quality and sustainable coffees, given the rightenvironmental, social, and economic conditions. One expectsregions, such as Narino and Cauca in the Southwest, with ahigher potential for producing high-quality coffee, larger avail-ability of land and labor, and favorable institutional arrange-ments to better respond to increases in demand in theinternational markets, in general, and in the high-quality coffeesegment in particular, than the rest of the country. Similarly,environmental and cultural conditions might allow certainparts of the country—like the Sierra Nevada de Santa Martain the Northeast—to better respond to demand for sustain-able-grown coffees. For example, low-agrochemical input,shade-grown production systems can more easily become certi-fied under strict environmental standards that prohibit the useof certain pesticides or petroleum-derived fertilizers. We expectother areas of the country, such as the central Andes, with highlabor and land restrictions and lacking the environmental con-ditions that are most suitable for shade-grown coffees, to expe-rience a stagnant or even decreasing coffee economy. Globalmarket signals therefore hold the potential to act as geograph-ically distal but power forces re-shaping coffee landscapes lo-cally and altering the geographic distribution of coffeeproduction at a national scale.
4. DATA AND METHODS
(a) Source of data
This study used daily data for domestic and internationalcoffee prices during 2006–10, a period that captures both the
Please cite this article in press as: Rueda, X., & Lambin, E. F. Linking Gloare Changing the Colombian Coffee Landscapes, World Development (20
increase in demand for sustainable and high-quality coffeesand Colombia’s push to offer a diversified portfolio of coffeeproducts. International prices are the closing data of the ICE’sC contract for green coffee FOB, while Complete Coffee Cov-erage (Coffee Publications, 2011) serves as the reference for theColombian differential, also for FOB green coffee. Retailprices come from Euromonitor (2010) and were adjusted, ifneeded, for August 2010 onwards, when roasters announcedprice increases to the consumer. Domestic prices and premi-ums for quality and sustainability come from FNC’s databaseof daily prices paid for parchment coffee placed in Bogota.Average transportation costs and conversion factors fromAlmacafe (FNC’s logistic operator) were used to convertparchment coffee into green coffee FOB. Banco de la Republi-ca (the national reserve bank) was the source of the daily ex-change rate.
For municipal data four main sources of information wereused: FNC’s Coffee Information System (SICA), a databaseof all farms producing coffee in Colombia that is permanentlyupdated; a survey conducted among three expert cuppers whoidentified high-quality profile municipalities; the national pop-ulation census of 2005, the most recent census available, whichserves as the baseline year for all population data used in thisstudy; and the database from the Presidential Program on Hu-man Rights and International Humanitarian Law on the an-nual number of violent attacks perpetrated by illegal groups.
Interviews with key informants in the industry and recordsfrom FNC were gathered during the months of January toMarch of 2011. Interviewees included FNC’s supply chainand commercial directors, Almacafe’s quality control lab man-ager and technicians, cooperative managers, as well as fieldextensionists in charge of implementing FNCs differentiationstrategy, and representatives from NGOs promoting sustain-ability schemes. The supply chain and commercial directors
balization toLocal Land Uses: How Eco-consumers and Gourmands12), http://dx.doi.org/10.1016/j.worlddev.2012.05.018
LINKING GLOBALIZATION TO LOCAL LAND USES 7
contributed to define the value chain, its main actors and typeof coordination mechanisms at different stages. The qualitycontrol lab helped define the municipalities where high-qualitycup profiles come from and to understand the development oftailor-made products with clients. Cooperative managers andfield extensionists clarified the implementation of sustainabil-ity and high-quality programs at the local level. NGO repre-sentatives helped clarify clients’ strategies with regard tosustainability. Additionally, the lead author worked in theColombian coffee sector for over 2 years, thus gaining experi-ence that informed this research.
(b) Methods
(i) Value created and captured at the farmThe first goal of the study was to assess to which extent the
increase in demand for high-quality and sustainable coffeestranslated into higher prices to producers of differentiated cof-fees. We did so by analyzing how value is added through thevalue chain and how it is captured by each actor, from thefarmer to the retailer. We focused on Colombian coffee pro-duced for the US market, for the year 2010, and includedone type of coffee for each market segment: coffee that is ex-ported and sold to consumers as a single origin 100% Colom-bian coffee; one type of sustainable coffee—the RainforestAlliance-certified coffee; and the high-quality single-origin cof-fee from southern Colombia that is sold for consumption insingle dose espresso preparations, representing the high-qual-ity segment. The Rainforest Alliance (RFA) certification hasbeen chosen as representative of the sustainable coffee marketbecause it is a broad certification program rather than a com-pany-owned one, and it is marketed directly to consumers, un-like other certification programs that may or may not bepublicized by roasting companies. From the producers’ per-spective, RFA is perhaps the most demanding certificationprogram to comply with (the code has more than 500 pointsthat are checked annually at the farm or group level), andincludes explicit considerations on land use and biodiversityconservation (SAN, 2010). We followed transactions betweenexporters and roasters for every month of 2010 to capture thevariability of the market and averaged the monthly price perpound. We used the month before shipment as the relevantmonth for transactions between farmers and cooperatives.Values are given in US dollars and in equivalent of a poundof roasted coffee.
(ii) Trends and volatility of domestic prices and premiums forquality and sustainability
In addition to a snapshot of the value added at each stage ofthe chain, we analyzed volatility characteristic of the coffeemarkets to test whether premiums for quality and sustainabil-ity were consistently transferred to farmers of differentiatedcoffees, thus producing a clear long-term signal to land users.We conducted a time series analysis for the 2006–10 period tocompare international prices of mainstream coffee to domesticprices of the three main market segments: mainstream, sus-tainable and high-quality coffee. Daily data for prices paidto farmers for the three market segments were converted toFOB prices for green coffee and compared against interna-tional prices at the ICE for the 2006–10 period. Depreciationof the US dollar increases the price of commodities traded inthat currency (Naylor & Falcon, 2010). The period underanalysis saw a weakening of the US dollar against the Colom-bia peso equivalent to 16%. This effect was removed by com-paring international and domestic prices in the domesticcurrency. Methods for comparison included the coefficient of
Please cite this article in press as: Rueda, X., & Lambin, E. F. Linking Gloare Changing the Colombian Coffee Landscapes, World Development (20
variations (CV) between international and domestic pricesfor the three market segments to capture differences in bothtrends and volatility (Naylor & Falcon, 2010). The analysisalso divided the time series into two sub-periods: 2006–07and 2008–10 to test whether the overall variability of the priceshad increased concurrently with the spike of the internationalprice since 2008. Price series were then de-trended using thedifferences in logarithmic prices (Gilbert & Morgan, 2010),to test whether movements in the international prices werecorrelated with changes in domestic prices for mainstream,high-quality, and sustainable coffees. A test of variance equal-ity was performed to assess whether premiums for differenti-ated coffees were pro-cyclical (i.e., whether they remainedstable as international prices moved) or counter-cyclical, buf-fering the effect of increases or decreases in internationalprices.
(iii) Effects of high-quality and sustainability premiums on landuse
We expected market trends to have had a clear impact onland use, modifying the total area planted in coffee, its spatialdistribution, and production systems. We analyzed municipaldata for the 579 municipalities that grow coffee in Colombiaduring 2007–10 to analyze the impact of demand for high-quality and sustainable coffees on the area planted in coffee,controlling for confounding variables. We chose area as therelevant variable over yields because production is highly var-iable from one year to the next, owing to climatic effects, lim-iting the ability to identify structural changes in such a shortperiod of time. Previous studies have identified that productiv-ity in Colombia has remained constant for the last 30 yearsafter the introduction and widespread adoption of sun-resis-tant varieties in the 1970s and 1980s (Giovannucci et al.,2002). No technological breakthrough has occurred sinceand, given that coffee is a labor-intensive crop that has seenno increases in labor productivity, attempts to further increaseproductivity by increasing crop density will face equally largerdemands of labor that will erode most of the productivitygains (Giovannucci et al., 2002). In the event that intensifica-tion had taken place during 2007–10, its effects on productionwould be incipient, due to the maturation time required by theplants to start bearing fruits.
A multivariate regression model tested the influence of terr-oirs and sustainability programs in explaining growth in areaplanted at the municipal level. Thus for each municipality i:
DAreai ¼ f ðterroiri; area certifiedi;X i; eÞwhere DAreai is the change in total area planted in coffee ofthe municipality during 2006–10; terroiri, is a dummy variablefor municipalities that produce a high-quality cup profile(according to the survey of expert cuppers conducted in2011); area certifiedi, is the total area planted in coffee inthe municipality that, as of 2010, was certified under thirdparty certification schemes 7; Xi are the control variables thatmight also explain differences in area planted in coffee amongmunicipalities. These include: labor availability, measured asboth the percentage and the total number of rural dwellersin each municipality according to the 2005 census; land avail-ability, measured as the total amount of farm land not culti-vated in coffee; agro-ecological conditions that facilitate theestablishment of third-party certified coffee, measured as thetotal area of coffee planted under shade or semi-shade in2007 8; and security risks in rural areas, measured as twodummy variables capturing increase/decrease and no changein violent attacks in municipalities between 2002–06 and2007–10.
balization toLocal Land Uses: How Eco-consumers and Gourmands12), http://dx.doi.org/10.1016/j.worlddev.2012.05.018

Table 2. Value added at each link of the chain for mainstream coffee sold inthe US during 2010 cents/lb (roasted coffee equivalent)
Month ofshipment
Farmer Exporter Roaster Final priceto consumer
January 213 5 781 999February 206 11 782 999March 212 10 777 999April 200 14 785 999May 200 43 756 999June 230 16 754 999July 254 33 712 999August 269 17 798 1083September 260 58 771 1089October 243 55 791 1089November 249 74 766 1089December 275 47 767 1089
Max 275 74 798 1089Min 200 10 712 999Mean 234 32 770 1036% of Total value 23% 3% 74% 100%
Source: FNC (2011) and Euromonitor (2010).
Table 3. Value added at each link of the chain for RainforestAlliance-certified coffee sold in the US during 2010 cents/lb
(roasted coffee equivalent)
Month ofshipment
Farmer Exporter Roaster Final priceto consumer
January 220 28 681 929February 214 42 674 929March 220April 207 59 663 929May 208 58 664 929June 237 34 658 929July 262 47 620 929August 277September 268 66 678 1013October 251 94 668 1013November 257 62 693 1013December 290 35 688 1013
Max 290 74 798 1089Min 207 10 712 999Mean 243 52 669 962% Of total value 25% 5% 69% 100%
Source: FNC (2011) and Euromonitor (2010).
Table 4. Value added at each link of the chain for high-quality single-servecoffee sold in the US during 2010 cents/lb (roasted coffee equivalent)
Month ofshipment
Farmer Exporter Roaster Final priceto consumer
January 241 58 4312 4610February 234 79 4315 4628March 240 69 4320 4630April 230 104 4310 4644May 236 87 4314 4638June 279 76 4333 4688July 285 82 4325 4692August 300 79 4326 4705September 292 110 4307 4709October 284 121 4298 4704November 280 146 4279 4705December 306 139 4284 4729
Max 306 74 798 1089Min 230 10 712 999Mean 267 96 4310 4673% Of total value 6% 2% 92% 100%
Source: FNC (2011) and Euromonitor (2010).
8 WORLD DEVELOPMENT
5. RESULTS
(a) Value created and captured at the farm
We expected the price paid by the consumer for both certi-fied and high-quality coffee to be higher than the value paidfor mainstream coffee and the difference between those pricesto be transferred, at least partially, to the farmer. The valuechain for mainstream coffee shows that, on average, farmerscapture 23% of the value perceived by consumers, while the ex-porter captures about 3%, and roasters capture 74% of theadded value (Table 2). Exporters can sell directly to roastersor to importers who in turn sell to roasters. As importerscharge a fixed fee per pound delivered, for simplicity, resultshere assume that all sales are made to roasters directly. Roast-ers in turn can sell directly to consumers in their own coffeeshops or through retailers. Again, to simplify the analysis, thisvalue chain refers to roasters who sell directly to consumers.
Both the C Contract and the differential for Colombian cof-fee increased during 2010 due to supply shortages. The sum ofthese two increased almost 30% during this period. The priceincrease was only transferred to the consumer at the end ofthe summer, when roasters throughout North America aug-mented the price to the consumers by 10%. Since most ofthe value added by the roaster comes from symbolic elements(i.e., branding, marketing, and publicity), their portion of theadded value remained practically unchanged during a periodof great variations (the coefficient of variation—CV—on theirvalue added was only 3%). Most of the variability was ab-sorbed by the exporter (CV = 73%) and to a lesser degreeby the producer (CV = 12%).
The value chains for RFA certified and high-quality coffees(Tables 3 and 4) show that certified farmers capture on average25% of the value perceived by consumers, 2 percentage pointsabove conventional farmers. The exporter captured 5% of thetotal value, 2 percentage points above the conventional chain,and the roaster captured the remaining 69%. The price to theconsumer for RFA-certified coffee is lower than for the 100%Colombian coffee. Premiums paid by roasters to exporters donot get transferred in this case to the consumer. Certificationis used as a strategy to gain market share. The variability of
Please cite this article in press as: Rueda, X., & Lambin, E. F. Linking Gloare Changing the Colombian Coffee Landscapes, World Development (20
the price is the same for farmers (CV = 12%) and slightly lowerfor the exporter (CV = 38%), reflecting a slightly lower devia-tion from the mean, but also a higher base price.
For high-quality single serve coffee, farmers get on average ahigher price than certified or conventional farmers ($2.67/lbversus $2.43/lb and $2.34/lb, respectively). The value addedas a proportion of the total value created to the consumer isonly 6%. In this value chain, the exporter also captures a high-er mean value ($0.96/lb) when compared to the certified($0.52/lb) and conventional chains ($0.32/lb). The roaster cap-tures 92% of the value which, besides branding and marketing,also reflects the technology that enables the preparation of asingle-serve high-quality beverage. The price variability isagain highest for the exporter, although it is smaller than forthe two other chains, owning to the larger mean value.
balization toLocal Land Uses: How Eco-consumers and Gourmands12), http://dx.doi.org/10.1016/j.worlddev.2012.05.018
LINKING GLOBALIZATION TO LOCAL LAND USES 9
(b) Trends and volatility of domestic prices and premiums forquality and sustainability
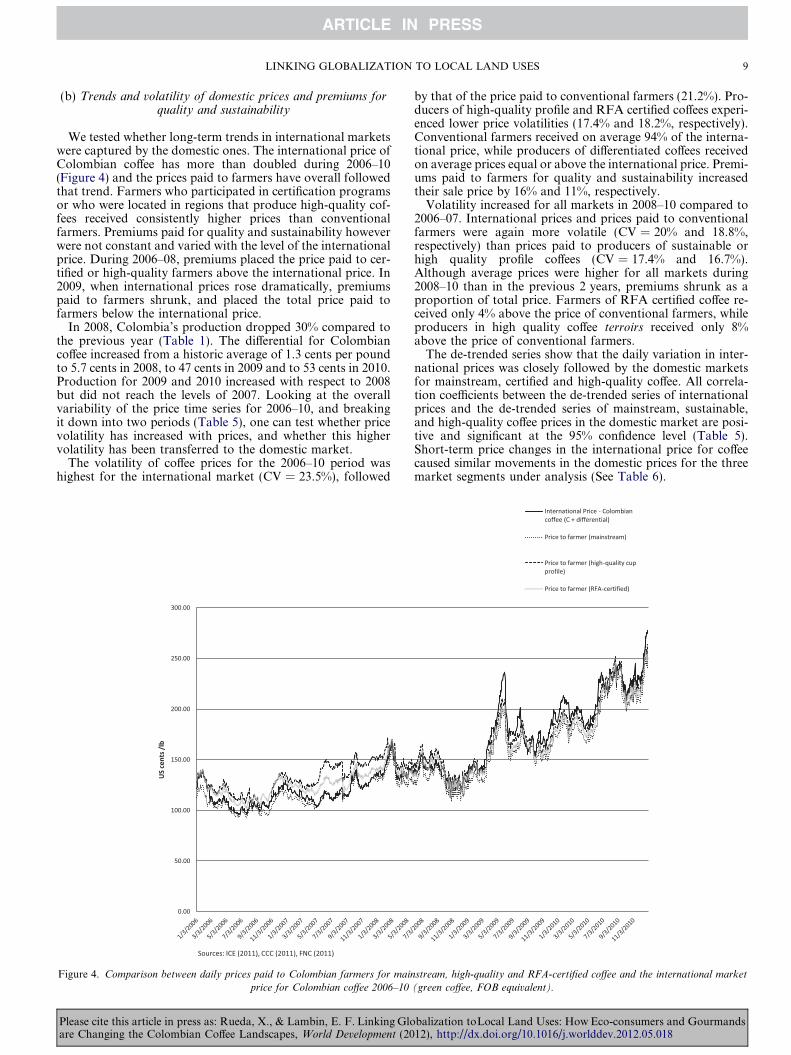
We tested whether long-term trends in international marketswere captured by the domestic ones. The international price ofColombian coffee has more than doubled during 2006–10(Figure 4) and the prices paid to farmers have overall followedthat trend. Farmers who participated in certification programsor who were located in regions that produce high-quality cof-fees received consistently higher prices than conventionalfarmers. Premiums paid for quality and sustainability howeverwere not constant and varied with the level of the internationalprice. During 2006–08, premiums placed the price paid to cer-tified or high-quality farmers above the international price. In2009, when international prices rose dramatically, premiumspaid to farmers shrunk, and placed the total price paid tofarmers below the international price.
In 2008, Colombia’s production dropped 30% compared tothe previous year (Table 1). The differential for Colombiancoffee increased from a historic average of 1.3 cents per poundto 5.7 cents in 2008, to 47 cents in 2009 and to 53 cents in 2010.Production for 2009 and 2010 increased with respect to 2008but did not reach the levels of 2007. Looking at the overallvariability of the price time series for 2006–10, and breakingit down into two periods (Table 5), one can test whether pricevolatility has increased with prices, and whether this highervolatility has been transferred to the domestic market.
The volatility of coffee prices for the 2006–10 period washighest for the international market (CV = 23.5%), followed
Figure 4. Comparison between daily prices paid to Colombian farmers for main
price for Colombian coffee 2006–10
Please cite this article in press as: Rueda, X., & Lambin, E. F. Linking Gloare Changing the Colombian Coffee Landscapes, World Development (20
by that of the price paid to conventional farmers (21.2%). Pro-ducers of high-quality profile and RFA certified coffees experi-enced lower price volatilities (17.4% and 18.2%, respectively).Conventional farmers received on average 94% of the interna-tional price, while producers of differentiated coffees receivedon average prices equal or above the international price. Premi-ums paid to farmers for quality and sustainability increasedtheir sale price by 16% and 11%, respectively.
Volatility increased for all markets in 2008–10 compared to2006–07. International prices and prices paid to conventionalfarmers were again more volatile (CV = 20% and 18.8%,respectively) than prices paid to producers of sustainable orhigh quality profile coffees (CV = 17.4% and 16.7%).Although average prices were higher for all markets during2008–10 than in the previous 2 years, premiums shrunk as aproportion of total price. Farmers of RFA certified coffee re-ceived only 4% above the price of conventional farmers, whileproducers in high quality coffee terroirs received only 8%above the price of conventional farmers.
The de-trended series show that the daily variation in inter-national prices was closely followed by the domestic marketsfor mainstream, certified and high-quality coffee. All correla-tion coefficients between the de-trended series of internationalprices and the de-trended series of mainstream, sustainable,and high-quality coffee prices in the domestic market are posi-tive and significant at the 95% confidence level (Table 5).Short-term price changes in the international price for coffeecaused similar movements in the domestic prices for the threemarket segments under analysis (See Table 6).
stream, high-quality and RFA-certified coffee and the international market
(green coffee, FOB equivalent).
balization toLocal Land Uses: How Eco-consumers and Gourmands12), http://dx.doi.org/10.1016/j.worlddev.2012.05.018
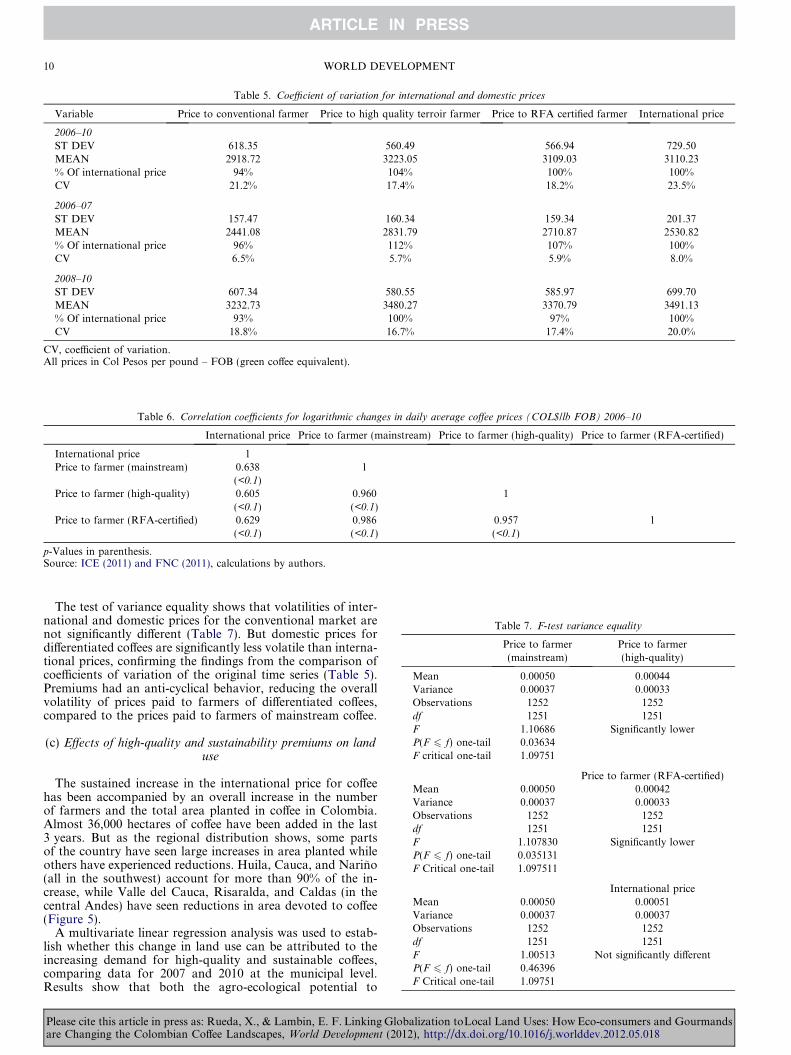
Table 5. Coefficient of variation for international and domestic prices
Variable Price to conventional farmer Price to high quality terroir farmer Price to RFA certified farmer International price
2006–10
ST DEV 618.35 560.49 566.94 729.50MEAN 2918.72 3223.05 3109.03 3110.23% Of international price 94% 104% 100% 100%CV 21.2% 17.4% 18.2% 23.5%
2006–07
ST DEV 157.47 160.34 159.34 201.37MEAN 2441.08 2831.79 2710.87 2530.82% Of international price 96% 112% 107% 100%CV 6.5% 5.7% 5.9% 8.0%
2008–10
ST DEV 607.34 580.55 585.97 699.70MEAN 3232.73 3480.27 3370.79 3491.13% Of international price 93% 100% 97% 100%CV 18.8% 16.7% 17.4% 20.0%
CV, coefficient of variation.All prices in Col Pesos per pound – FOB (green coffee equivalent).
Table 7. F-test variance equality
Price to farmer(mainstream)
Price to farmer(high-quality)
Mean 0.00050 0.00044Variance 0.00037 0.00033Observations 1252 1252df 1251 1251F 1.10686 Significantly lowerP(F 6 f) one-tail 0.03634F critical one-tail 1.09751
Price to farmer (RFA-certified)Mean 0.00050 0.00042Variance 0.00037 0.00033Observations 1252 1252df 1251 1251F 1.107830 Significantly lowerP(F 6 f) one-tail 0.035131F Critical one-tail 1.097511
International priceMean 0.00050 0.00051Variance 0.00037 0.00037Observations 1252 1252df 1251 1251F 1.00513 Not significantly differentP(F 6 f) one-tail 0.46396F Critical one-tail 1.09751
Table 6. Correlation coefficients for logarithmic changes in daily average coffee prices (COL$/lb FOB) 2006–10
International price Price to farmer (mainstream) Price to farmer (high-quality) Price to farmer (RFA-certified)
International price 1Price to farmer (mainstream) 0.638 1
(<0.1)Price to farmer (high-quality) 0.605 0.960 1
(<0.1) (<0.1)Price to farmer (RFA-certified) 0.629 0.986 0.957 1
(<0.1) (<0.1) (<0.1)
p-Values in parenthesis.Source: ICE (2011) and FNC (2011), calculations by authors.
10 WORLD DEVELOPMENT
The test of variance equality shows that volatilities of inter-national and domestic prices for the conventional market arenot significantly different (Table 7). But domestic prices fordifferentiated coffees are significantly less volatile than interna-tional prices, confirming the findings from the comparison ofcoefficients of variation of the original time series (Table 5).Premiums had an anti-cyclical behavior, reducing the overallvolatility of prices paid to farmers of differentiated coffees,compared to the prices paid to farmers of mainstream coffee.
(c) Effects of high-quality and sustainability premiums on landuse
The sustained increase in the international price for coffeehas been accompanied by an overall increase in the numberof farmers and the total area planted in coffee in Colombia.Almost 36,000 hectares of coffee have been added in the last3 years. But as the regional distribution shows, some partsof the country have seen large increases in area planted whileothers have experienced reductions. Huila, Cauca, and Narino(all in the southwest) account for more than 90% of the in-crease, while Valle del Cauca, Risaralda, and Caldas (in thecentral Andes) have seen reductions in area devoted to coffee(Figure 5).
A multivariate linear regression analysis was used to estab-lish whether this change in land use can be attributed to theincreasing demand for high-quality and sustainable coffees,comparing data for 2007 and 2010 at the municipal level.Results show that both the agro-ecological potential to
Please cite this article in press as: Rueda, X., & Lambin, E. F. Linking Globalization toLocal Land Uses: How Eco-consumers and Gourmandsare Changing the Colombian Coffee Landscapes, World Development (2012), http://dx.doi.org/10.1016/j.worlddev.2012.05.018
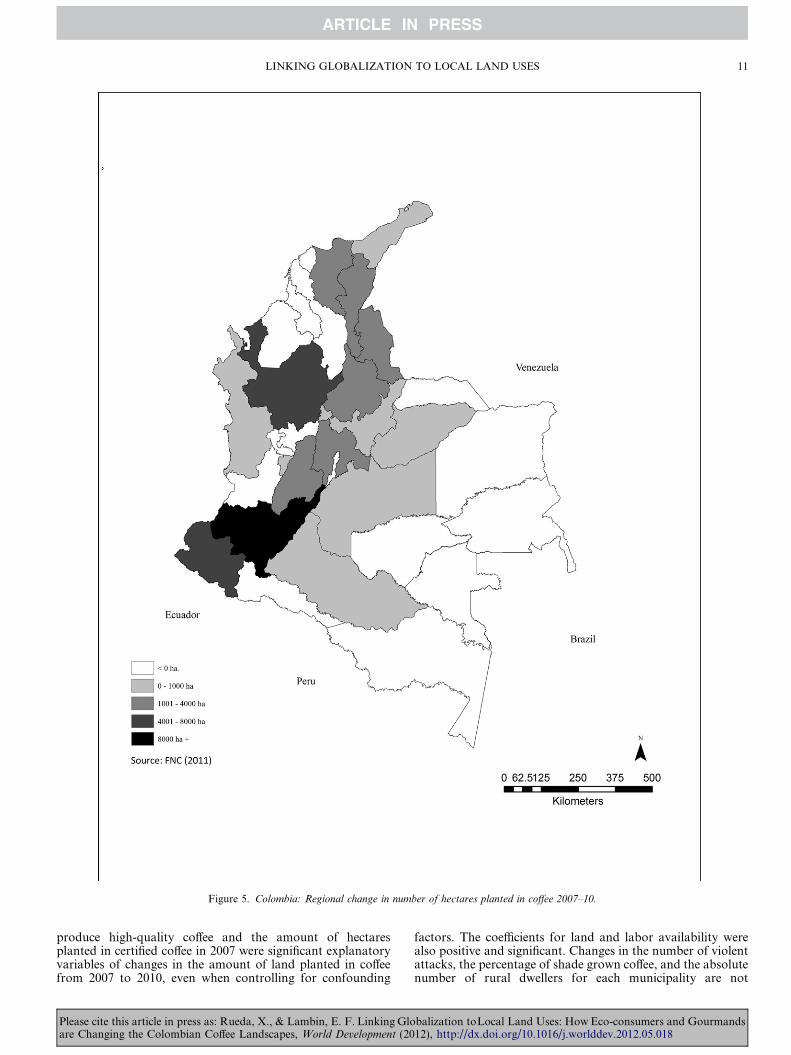
Figure 5. Colombia: Regional change in number of hectares planted in coffee 2007–10.
LINKING GLOBALIZATION TO LOCAL LAND USES 11
produce high-quality coffee and the amount of hectaresplanted in certified coffee in 2007 were significant explanatoryvariables of changes in the amount of land planted in coffeefrom 2007 to 2010, even when controlling for confounding
Please cite this article in press as: Rueda, X., & Lambin, E. F. Linking Gloare Changing the Colombian Coffee Landscapes, World Development (20
factors. The coefficients for land and labor availability werealso positive and significant. Changes in the number of violentattacks, the percentage of shade grown coffee, and the absolutenumber of rural dwellers for each municipality are not
balization toLocal Land Uses: How Eco-consumers and Gourmands12), http://dx.doi.org/10.1016/j.worlddev.2012.05.018
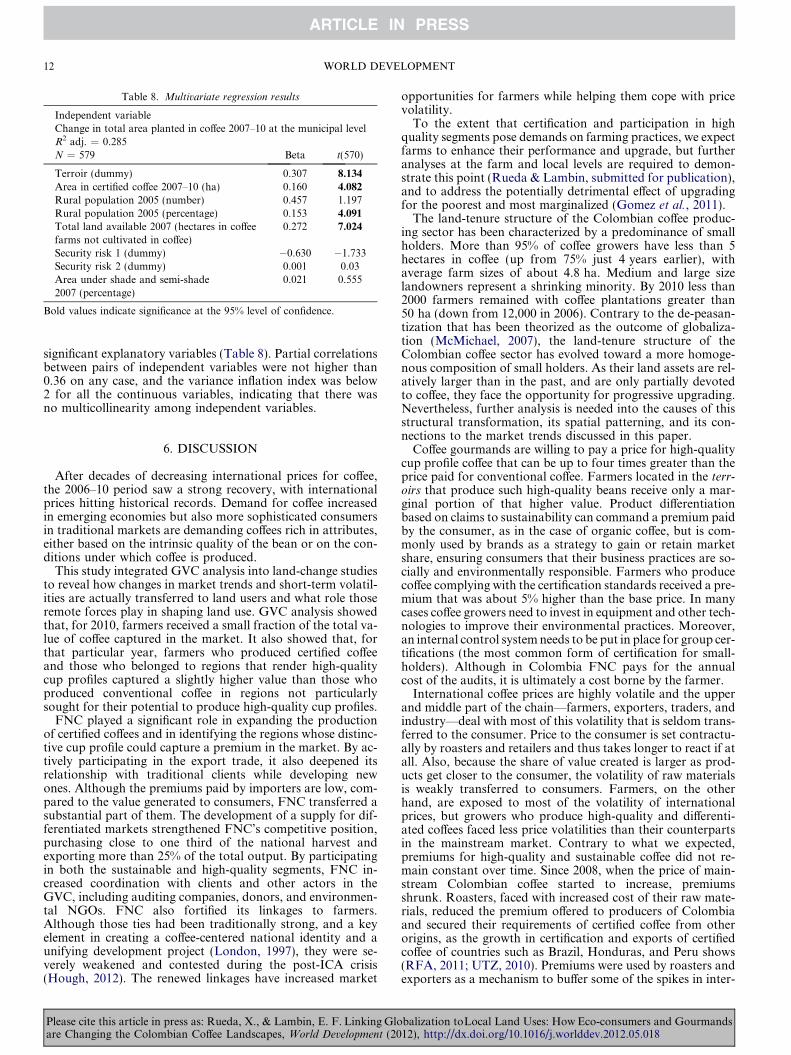
Table 8. Multivariate regression results
Independent variableChange in total area planted in coffee 2007–10 at the municipal levelR2 adj. = 0.285N = 579 Beta t(570)
Terroir (dummy) 0.307 8.134
Area in certified coffee 2007–10 (ha) 0.160 4.082
Rural population 2005 (number) 0.457 1.197Rural population 2005 (percentage) 0.153 4.091
Total land available 2007 (hectares in coffeefarms not cultivated in coffee)
0.272 7.024
Security risk 1 (dummy) �0.630 �1.733Security risk 2 (dummy) 0.001 0.03Area under shade and semi-shade2007 (percentage)
0.021 0.555
Bold values indicate significance at the 95% level of confidence.
12 WORLD DEVELOPMENT
significant explanatory variables (Table 8). Partial correlationsbetween pairs of independent variables were not higher than0.36 on any case, and the variance inflation index was below2 for all the continuous variables, indicating that there wasno multicollinearity among independent variables.
6. DISCUSSION
After decades of decreasing international prices for coffee,the 2006–10 period saw a strong recovery, with internationalprices hitting historical records. Demand for coffee increasedin emerging economies but also more sophisticated consumersin traditional markets are demanding coffees rich in attributes,either based on the intrinsic quality of the bean or on the con-ditions under which coffee is produced.
This study integrated GVC analysis into land-change studiesto reveal how changes in market trends and short-term volatil-ities are actually transferred to land users and what role thoseremote forces play in shaping land use. GVC analysis showedthat, for 2010, farmers received a small fraction of the total va-lue of coffee captured in the market. It also showed that, forthat particular year, farmers who produced certified coffeeand those who belonged to regions that render high-qualitycup profiles captured a slightly higher value than those whoproduced conventional coffee in regions not particularlysought for their potential to produce high-quality cup profiles.
FNC played a significant role in expanding the productionof certified coffees and in identifying the regions whose distinc-tive cup profile could capture a premium in the market. By ac-tively participating in the export trade, it also deepened itsrelationship with traditional clients while developing newones. Although the premiums paid by importers are low, com-pared to the value generated to consumers, FNC transferred asubstantial part of them. The development of a supply for dif-ferentiated markets strengthened FNC’s competitive position,purchasing close to one third of the national harvest andexporting more than 25% of the total output. By participatingin both the sustainable and high-quality segments, FNC in-creased coordination with clients and other actors in theGVC, including auditing companies, donors, and environmen-tal NGOs. FNC also fortified its linkages to farmers.Although those ties had been traditionally strong, and a keyelement in creating a coffee-centered national identity and aunifying development project (London, 1997), they were se-verely weakened and contested during the post-ICA crisis(Hough, 2012). The renewed linkages have increased market
Please cite this article in press as: Rueda, X., & Lambin, E. F. Linking Gloare Changing the Colombian Coffee Landscapes, World Development (20
opportunities for farmers while helping them cope with pricevolatility.
To the extent that certification and participation in highquality segments pose demands on farming practices, we expectfarms to enhance their performance and upgrade, but furtheranalyses at the farm and local levels are required to demon-strate this point (Rueda & Lambin, submitted for publication),and to address the potentially detrimental effect of upgradingfor the poorest and most marginalized (Gomez et al., 2011).
The land-tenure structure of the Colombian coffee produc-ing sector has been characterized by a predominance of smallholders. More than 95% of coffee growers have less than 5hectares in coffee (up from 75% just 4 years earlier), withaverage farm sizes of about 4.8 ha. Medium and large sizelandowners represent a shrinking minority. By 2010 less than2000 farmers remained with coffee plantations greater than50 ha (down from 12,000 in 2006). Contrary to the de-peasan-tization that has been theorized as the outcome of globaliza-tion (McMichael, 2007), the land-tenure structure of theColombian coffee sector has evolved toward a more homoge-nous composition of small holders. As their land assets are rel-atively larger than in the past, and are only partially devotedto coffee, they face the opportunity for progressive upgrading.Nevertheless, further analysis is needed into the causes of thisstructural transformation, its spatial patterning, and its con-nections to the market trends discussed in this paper.
Coffee gourmands are willing to pay a price for high-qualitycup profile coffee that can be up to four times greater than theprice paid for conventional coffee. Farmers located in the terr-oirs that produce such high-quality beans receive only a mar-ginal portion of that higher value. Product differentiationbased on claims to sustainability can command a premium paidby the consumer, as in the case of organic coffee, but is com-monly used by brands as a strategy to gain or retain marketshare, ensuring consumers that their business practices are so-cially and environmentally responsible. Farmers who producecoffee complying with the certification standards received a pre-mium that was about 5% higher than the base price. In manycases coffee growers need to invest in equipment and other tech-nologies to improve their environmental practices. Moreover,an internal control system needs to be put in place for group cer-tifications (the most common form of certification for small-holders). Although in Colombia FNC pays for the annualcost of the audits, it is ultimately a cost borne by the farmer.
International coffee prices are highly volatile and the upperand middle part of the chain—farmers, exporters, traders, andindustry—deal with most of this volatility that is seldom trans-ferred to the consumer. Price to the consumer is set contractu-ally by roasters and retailers and thus takes longer to react if atall. Also, because the share of value created is larger as prod-ucts get closer to the consumer, the volatility of raw materialsis weakly transferred to consumers. Farmers, on the otherhand, are exposed to most of the volatility of internationalprices, but growers who produce high-quality and differenti-ated coffees faced less price volatilities than their counterpartsin the mainstream market. Contrary to what we expected,premiums for high-quality and sustainable coffee did not re-main constant over time. Since 2008, when the price of main-stream Colombian coffee started to increase, premiumsshrunk. Roasters, faced with increased cost of their raw mate-rials, reduced the premium offered to producers of Colombiaand secured their requirements of certified coffee from otherorigins, as the growth in certification and exports of certifiedcoffee of countries such as Brazil, Honduras, and Peru shows(RFA, 2011; UTZ, 2010). Premiums were used by roasters andexporters as a mechanism to buffer some of the spikes in inter-
balization toLocal Land Uses: How Eco-consumers and Gourmands12), http://dx.doi.org/10.1016/j.worlddev.2012.05.018
LINKING GLOBALIZATION TO LOCAL LAND USES 13
national prices, at the expense of the producer of differentiatedcoffees. Thus, quite unexpectedly, the main benefits for farm-ers that engage into high-quality and sustainable coffee pro-duction may well be lower price volatility rather than a highand consistent price premium.
Our results also indicate that markets are contributing toshape the amount, location, and production system underwhich coffee is planted. More than 36,000 hectares were con-verted to coffee plantations during the last 3 years in Colombia,particularly in areas that render exceptional cup profiles. TheSouth and Southwest have been the main protagonists of thisincrease, aided by land and labor availability. Municipalitieswith a high rate of participation in sustainability programsexperienced the greatest coffee expansion. The Sierra Nevadade Santa Marta and the eastern Andes, where a large propor-tion of the certified coffee comes from, also increased their areaplanted. Other regions with less attractive profiles and morediversified and urban economies experienced losses in the areaplanted in coffee, particularly in the central and western Andes.Participation in certification schemes does not seem to be asso-ciated with the environmental conditions in which coffee isplanted as measured by area planted under shade. It could betied to institutional factors and other cultural enablers that re-quire further study, through farm-level surveys. The incidenceof violent attacks, which had been shown in previous studies tohave had a negative impact on coffee growers’ productive deci-sions, at least in some parts of the country (Munoz Mora, 2010;Rettberg, 2010), did not play a significant role on coffee expan-sion for the period under study.
The Colombian coffee landscape has changed substantiallyin a very short period of time. Today, Colombia has morethan 307,000 hectares in coffee that comes from regions of dis-tinct cup profiles (about one third of the country’s land culti-vated in coffee), and 77,000 under certification schemes (closeto 9% of the total area in coffee). Farmers in those regions re-ceive prices that are slightly higher than those perceived bygrowers everywhere else. Responding to market trends hasbeen possible thanks to the availability of land and labor. Cof-fee is a labor intensive crop. Regions that have abundant laborhave been able to increase coffee production. Land availabilityand lack of competition with more profitable land-uses hasalso facilitated the expansion in particular regions. It has alsohindered growth in regions with stronger urban centers such asCaldas, Risaralda, and Cundinamarca. In the future, increas-ing labor costs in a fast-urbanizing country and competingland uses can pose a limit to the expansion of differentiatedcoffees, unless a larger portion of the value created is shared.
This study has focused on the 2006–10 period in which thedemand for differentiated coffees has increased, which hascoincided with a spike in the price for green coffee, aided byclimatic factors and an increasing participation of investmentfunds in soft commodities. Separating the effects of those fac-tors has not been possible and only a longer time span, inwhich full economic cycles are captured, would enable the re-moval of temporary price increases from the long-term trend.
Results show how prices have acted as drivers of land usechange, allowing farmers in regions with appropriate condi-tions to increase the supply of high-quality and sustainablecoffees. The institutional, cultural, and socio-economic factorsthat enable certain farmers on specific locales to take advan-tage of these opportunities while preventing others from tak-ing that course were not addressed in this study. The nextresearch step is to understand, at the farm-level, how marketsignals are transformed into effective decisions that modifythe allocation of resources to comply with market require-ments.
Please cite this article in press as: Rueda, X., & Lambin, E. F. Linking Gloare Changing the Colombian Coffee Landscapes, World Development (20
7. CONCLUSION
Using the GVC framework, this study has shown that farm-ers who sell their coffee production to differentiated markets—either because of quality or claims to sustainability—capture alarger portion of the value added to consumers than farmers ofmainstream coffee. Over a longer period of time, premiums paidto farmers for differentiated coffees are not independent frommovements in international prices; quite the opposite, theyhave a counter-cyclical behavior, shrinking in times of highinternational prices. As a result, farmers who sell to differenti-ated markets do not secure a fixed premium but rather a lessvolatile price, when compared to providers of mainstream cof-fee. Participation in the high-quality and sustainability seg-ments has not substantially changed the distribution of valueamong actors or the governance structure of the chain. It hasprovided space for coordination and resource flows betweenFNC and clients, donors, and NGOs. Coordination has also in-creased between FNC and farmers, facilitated by the extensionservice and the local cooperatives, benefitting farmers in themore dynamic regions, as well as FNC’s competitive position.
Market signals in the form of premiums have been powerfulforces driving land change. Both high-quality profile regionsand regions participating in certification programs experiencedsignificantly larger increases in area planted in coffee than therest of the country, even when controlling for confoundingvariables such as land and labor availability.
Integrating GVC analysis into land-change science has beeninstrumental in understanding the price mechanisms throughwhich global markets drive land use, not only for large holdersbut mainly for small holders who, in the case of Colombia,represent most of the country’s coffee growers and the major-ity of the output. Besides their limited assets, small holdershave responded to market demands in a very short period oftime and have reconfigured the country’s coffee landscape.Farmers around the world are being exposed to similar trendsnot only for coffee but for other crops such as cocoa, tea,fruits, and flowers that are experiencing higher demand fromabroad and a process of product differentiation. The frame-work used here can be extended to those global markets andthe places that supply them, thus deepening our understandingof the distal forces driving land change, and the opportunitiesfor land users to create higher value while protecting their nat-ural assets.
As commodity markets become more volatile and farmersare more attuned to movements in international prices, weanticipate an increased plasticity of the landscape, reactingto global markets with great speed and force. Policies designedto improve the livelihoods of rural people need to take into ac-count the high exposure of local actors to international mar-kets. Opportunities arise for farmers to take advantage ofglobal markets, increase the value captured, and upgrade theiroperations, while preserving ecosystem services (Gomez et al.,2011) if prices and information are fully transmitted. But atthe same time, exposure to higher volatility in internationalprices increases the risk of their operations and their vulnera-bility to market shocks.
The role of FNC in stimulating farmers to join higher valueglobal chains sets an example for policy interventions else-where in producing countries. This institutional design notonly ensured that farmers received international price signalsin an otherwise highly asymmetrical market, but also providedthe needed infrastructure, technical and marketing support toenable farmers to engage in differentiated markets. By thesame token, FNC strengthened the linkages to its constitu-ency, increasing its legitimacy.
balization toLocal Land Uses: How Eco-consumers and Gourmands12), http://dx.doi.org/10.1016/j.worlddev.2012.05.018
14 WORLD DEVELOPMENT
Consumers’ concern for the wellbeing of local communitiesand the environment has spurred the first wave of eco-consum-erism. The emphasis has been placed on offering a small pre-mium to farmers who are willing to comply with a set ofcriteria. As demand for these types of products grows, theneed for mechanisms for scaling up becomes apparent. Envi-ronmental NGOs, governments, and industry will need to cre-
Please cite this article in press as: Rueda, X., & Lambin, E. F. Linking Gloare Changing the Colombian Coffee Landscapes, World Development (20
ate institutional designs that support both certified and non-certified farms, that take into account the long-term ecologicaland economic sustainability of the coffee sector as a whole—including its ability to recover from natural or economicshocks, and that addresses the ever-increasing role of consum-ers around the globe in changing local land uses.
NOTES
1. Authors do not provide a definition of what constitutes specialtycoffee. The Specialty Coffee Association of America describes the stepsthat need to be taken at each link of the chain of custody to produce a cupthat reveals all the potential of the coffee beans and meets the standards ofthe Association (http://www.scaa.org/?page=RicArtp2). The literatureuses gourmet, specialty and high-quality coffee indistinctively. For thispaper, high-quality coffee is the green coffee originating from a specificplace that, if processed properly though the value chain, produces adistinct cup profile recognized by international cuppers and standards asof superior quality.
2. Quality is evaluated by pre-milling a sample of the coffee brought bythe farmer in terms of humidity, the amount of shaft, and the proportionof defective beans.
3. Some cooperatives own milling facilities and thus also offer green(milled) coffee.
4. Some roasting companies have developed the technology and built theinfrastructure required for long-term storage, but most companies roastand sell their coffee in less than three months from the time it is deliveredto their factories.
5. Mexico, Salvador, Guatemala, Costa Rica, Nicaragua, Kenya, NewGuinea, Panama, Tanzania, Uganda, Honduras, and Peru all are deliveredat par, Colombia at 200 point premium, Burundi, Venezuela and India at
100 point discount, Rwanda at 300 point discount, and DominicanRepublic and Ecuador at 400 point discount. Effective with the March2013 delivery, the discount for Rwanda will become 100 points, and Brazilwill be deliverable at a discount of 900 points.
6. There are four major third-party certified coffee programs recognizedin the international market (Organic, UTZ, Rainforest Alliance, and FairTrade), one global verification program (4C), and company-promotedverification programs such as Nespresso’s AAA, and Starbuck’s CAFEPractices. A detailed description of each program is provided elsewhere(Giovannucci et al., 2010). Colombia participates to all of them, and thenumbers in this section represent the sum of these programs.
7. The variable includes the organic, Rainforest Alliance and UTZcertification programs but not Fair Trade. The first three requireadherence to strict environmental practices, and thus considerable effortson behalf of the farmers to comply, while Fair Trade emphasizes theeconomic dimension of sustainability by securing a minimum price paid tofarmers. The market price for the time period under consideration hasbeen well above the Fair-trade minimum of $1.25.
8. Shade-grown coffee can more easily comply with the environmentalrequirements of certification schemes.
REFERENCES
Abizaid, C., & Coomes, O. T. (2004). Land use and forest fallowingdynamics in seasonally dry tropical forests of the southern YucatanPeninsula, Mexico. Land Use Policy, 21(1), 71–84. http://dx.doi.org/10.1016/j.landusepol.2003.06.001.
Angelsen, A., & Kaimowitz, D. (1999). Rethinking the causes ofdeforestation: Lessons from economic models. World Bank ResearchObserver, 14(1), 73–98.
Bair, J. (2005). Global capitalism and commodity chains: Looking back,going forward. Competition & Change, 9(2), 153–180. http://dx.doi.org/10.1179/102452905x45382.
Bitzer, V., Francken, M., & Glasbergen, P. (2008). Intersectoral partner-ships for a sustainable coffee chain: Really addressing sustainability orjust picking (coffee) cherries? Global Environmental Change-Human andPolicy Dimensions, 18(2), 271–284. http://dx.doi.org/10.1016/j.gloenv-cha.2008.01.002.
Caldas, M., Walker, R., Arima, E., Perz, S., Aldrich, S., & Simmons, C.(2007). Theorizing land cover and land use change: The peasanteconomy of Amazonian deforestation. Annals of the Association ofAmerican Geographers, 97(1), 86–110. http://dx.doi.org/10.1111/j.1467-8306.2007.00525.x.
Coffee Publications, I. (2011). Complete coffee coverage. CT CoffeePublications, Inc.: Stamford.
Cropper, M., Griffiths, C., & Mani, M. (1999). Roads, populationpressures, and deforestation in Thailand, 1976–1989. Land Economics,75(1), 58–73. http://dx.doi.org/10.2307/3146993.
Dauvergne, P., & Lister, J. (2012). Big brand sustainability: Governanceprospects and environmental limits. Global Environmental Change,22(1), 36–45. http://dx.doi.org/10.1016/j.gloenvcha.2011.10.007.
Daviron, B., & Ponte, S. (2005). The coffee paradox: Global markets,commodity trade and the elusive promise of development. Ede, Nether-lands: Zed Books in association with the CTA.
Daviron, B., & Vagneron, I. (2011). From commoditisation to de-commoditisation... and back again: Discussing the role of sustainabil-ity standards for agricultural products. Development Policy Review,29(1), 91–113, doi: 10.1111/j.1467-7679.2011.00515.x.
Euromonitor (2010). Passport – Hot drinks – Americas. EuromonitorInternational.
Fargione, J., Hill, J., Tilman, D., Polasky, S., & Hawthorne, P. (2008).Land clearing and the biofuel carbon debt. Science, 319(5867),1235–1238. http://dx.doi.org/10.1126/science.1152747.
Fitter, R., & Kaplinsky, R. (2001). Who gains from product rents as thecoffee market becomes more differentiated? A value-chain analysis. IdsBulletin-Institute of Development Studies, 32(3), 69–82.
FNC (2010a). Federacion Nacional de Cafeteros/Gerencia Tecnica/Sistema de Informacion Cafetera SICA Bogota.
FNC (2010b). Prosperidad Cafetera: Informe del gerente general LXXVCongreso Nacional de Cafeteros Bogota: Federacion Nacional deCafeteros de Colombia.
FNC (2011). Commercial statistics. Federacion Nacional de Cafeteros deColombia. Bogota.
Gerbens-Leenes, P. W., & Nonhebel, S. (2002). Consumption patterns andtheir effects on land required for food. Ecological Economics, 42(1–2),185–199. http://dx.doi.org/10.1016/s0921-8009(02)00049-6.
Gereffi, G., Humphrey, J., & Sturgeon, T. (2005). The governance ofglobal value chains. Review of International Political Economy, 12(1),78–104. http://dx.doi.org/10.1080/09692290500049805.
balization toLocal Land Uses: How Eco-consumers and Gourmands12), http://dx.doi.org/10.1016/j.worlddev.2012.05.018
LINKING GLOBALIZATION TO LOCAL LAND USES 15
Gereffi, G., & Korzeniewicz, M. (1994a). Commodity chains and globalcapitalism. Westport, Conn.: Praeger.
Gereffi, G., & Korzeniewicz, M. (Eds.) (1994b). Commodity chains andglobal capitalism. Westport, CT: Praeger.
Gibbon, P., Bair, J., & Ponte, S. (2008). Governing global value chains: anintroduction. [Editorial material]. Economy and Society, 37(3),315–338. http://dx.doi.org/10.1080/03085140802172656.
Gibbs, H. K., Ruesch, A. S., Achard, F., Clayton, M. K., Holmgren, P.,Ramankutty, N., et al. (2010). Tropical forests were the primarysources of new agricultural land in the 1980s and 1990s. Proceedings ofthe National Academy of Sciences of the United States of America,107(38), 16732–16737. http://dx.doi.org/10.1073/pnas.0910275107.
Gilbert, C. L. (1996). International commodity agreements: An obituarynotice. World Development, 24(1), 1–19. http://dx.doi.org/10.1016/0305-750x(95)00121-r.
Gilbert, C. L., & Morgan, C. W. (2010). Food price volatility. Philosoph-ical Transactions of the Royal Society B-Biological Sciences, 365(1554),3023–3034. http://dx.doi.org/10.1098/rstb.2010.0139.
Giovannucci, D., Leibovich, J., Pizano, D., Paredes, G., Montenegro, S.,Arevalo, H., & Varangis, P. (2002). Colombia Coffee Sector StudyCentro de Estudios Sobre Desarrollo Economico Documento No.2002–15. Manizales.
Giovannucci, D., Pierrot, J., & Kasterine, A. (2010). Trends in the trade ofcertified coffees. Retrieved from <http://mpra.ub.uni-muenchen.de/27551/>.
Giovannucci, D., & Ponte, S. (2005). Standards as a new form of socialcontract? Sustainability initiatives in the coffee industry. Food Policy,30(3), 284–301. http://dx.doi.org/10.1016/j.foodpol.2005.05.007.
Gomez, M. I., Barrett, C. B., Buck, L. E., De Groote, H., Ferris, S., Gao,H. O., et al. (2011). Research principles for developing country foodvalue chains. Science, 332(6034), 1154–1155. http://dx.doi.org/10.1126/science.1202543.
Guhl, A. (2008). Cafe y cambio de paisaje en Colombia, 1970–2005.Medellin: Fondo Editorial Universidad EAFIT.
Hecht, S. (2010). The new rurality: Globalization, peasants and theparadoxes of landscapes. Land Use Policy, 27(2), 161–169. http://dx.doi.org/10.1016/j.landusepol.2009.08.010.
Hopkins, T. K., & Wallerstein, I. (1986). Commodity chains in the world-economy prior to 1800. Review (Fernand Braudel Center), 10(1),157–170.
Hough, P. A. a. J. B. (2012). Dispossession, class formation and thepolitical imaginary of Colombia’s coffee producers over the LongueDuree: Beyond the Polanyian Analytic. Journal of World-SystemResearch, XVIII(1).
ICE (2011). ICE product guide: Coffee. Retrieved August 8, 2011, from<https://www.theice.com/productguide/ProductDetails.shtml?spe-cId=15>.
Jaffee, D. (2012). Weak coffee: Certification and co-optation in the fairtrade movement. Social Problems, 59(1), 94–116. http://dx.doi.org/10.1525/sp. 2012, 59(1), pp. 94.
Kaplinsky, R. M. (2000). A handbook for value chain research. Brighton:University of Sussex Institute of Development Studies.
Kaplinsky, R. M. (2004). Competitions policy and the global coffee andcocoa value chain. Retrieved from <http://www.acp-eu-trade.org/library/files/Kaplinsky-Raphael_EN_052005_IDS_Competition-pol-icy-and-the-global-coffee-and-cocoa-value-chains.pdf>.
Kogut, B. (1985). Designing global strategies – comparative and compet-itive value-added chains. Sloan Management Review, 26(4), 15–28.
Koh, L. P., Miettinen, J., Liew, S. C., & Ghazoul, J. (2011). Remotelysensed evidence of tropical peatland conversion to oil palm. Proceed-ings of the National Academy of Sciences, 108(12), 5127–5132. http://dx.doi.org/10.1073/pnas.1018776108.
Lambin, E. F., & Meyfroidt, P. (2011). Global land use change, economicglobalization, and the looming land scarcity. Proceedings of theNational Academy of Sciences, 108(9), 3465–3472. http://dx.doi.org/10.1073/pnas.1100480108.
Lee, J., Gereffi, G., & Beauvais, J. (2010). Global value chains andagrifood standards: Challenges and possibilities for smallholders indeveloping countries. Proceedings of the National Academy of Sciences.http://dx.doi.org/10.1073/pnas.0913714108.
Liu, P., Byers, A., & Giovannucci, D. (2008). Value-adding standards in theNorth American food market – Trade opportunities in certified productsfor developing countries FAO trade and markets division. Rome.
LMC (2011). Coffee quarterly. Oxford, UK: LMC International Ltd.
Please cite this article in press as: Rueda, X., & Lambin, E. F. Linking Gloare Changing the Colombian Coffee Landscapes, World Development (20
London, C. E. (1997). Class relations and capitalist development:Subsumption in the Colombian coffee industry, 1928–92. Journal ofPeasant Studies, 24(4), 269–295. http://dx.doi.org/10.1080/03066159708438651.
McMichael, P. (2007). Globalization and the agrarian world. In G. Ritzer(Ed.), The Blackwell companion to globalization. Malden, MA: Black-well Pub.
Meyfroidt, P., Rudel, T. K., & Lambin, E. F. (2010). Forest transitions,trade, and the global displacement of land use. Proceedings of theNational Academy of Sciences of the United States of America, 107(49),20917–20922. http://dx.doi.org/10.1073/pnas.1014773107.
Munoz Mora, J. (2010). Los caminos del cafe: Aproximacion a los efectosdel conflicto armado rural en la produccion cafetera Colombiana.Economıa Cafetera (Colombia), 26, 29–52.
Muradian, R., & Pelupessy, W. (2005). Governing the coffee chain: Therole of voluntary regulatory systems. World Development, 33(12),2029–2044. http://dx.doi.org/10.1016/j.worlddev.2005.06.007.
Naylor, R. L., & Falcon, W. P. (2010). Food security in an era ofeconomic volatility. Population and Development Review, 36(4),693–723. http://dx.doi.org/10.1111/j.1728-4457.2010.00354.x.
Perez-Aleman, P. (2011). Global standards and local knowledge building:Upgrading small producers in developing countries. Proceedings of theNational Academy of Sciences. http://dx.doi.org/10.1073/pnas.1000968108.
Petkova, I. (2006). Shifting regimes of governance in the coffee market:From secular crisis to a new equilibrium? Review of InternationalPolitical Economy, 13(2), 313–339. http://dx.doi.org/10.1080/09692290600625587.
Ponte, S. (2002). The ‘Latte Revolution’? Regulation, markets andconsumption in the global coffee chain. World Development, 30(7),1099–1122, Doi: 10.1016/s0305-750x(02)00032-3.
Porter, M. E. (1985). Competitive advantage: creating and sustainingsuperior performance. New York: Free Press.
Ramirez, L., Silva, G., Valenzuela, L., Villegas, A., & Villegas, L. (2002).El Cafe, Capital Social Estrategico. Bogota: Comision de Ajuste de laInstitucionalidad Cafetera.
Rask, K. J., & Rask, N. (2011). Economic development and foodproduction-consumption balance. A growing global challenge [Arti-cle]. Food Policy, 36(2), 186–196. http://dx.doi.org/10.1016/j.foodpol.2010.11.015.
Reina, M., & Silva, G. (2008). Juan valdez: Strategy behind the brand.Bogota: Ediciones B Colombia.
Rettberg, A. (2010). Global markets, local conflict. Latin AmericanPerspectives, 37(2), 111–132. http://dx.doi.org/10.1177/0094582x09356961.
RFA (2011). Supply for rainforest alliance certified coffee: RainforestAlliance.
Rindfuss, R. R., Entwisle, B., Walsh, S. J., Mena, C. F., Erlien, C. M., &Gray, C. L. (2007). Frontier land use change: Synthesis, challenges,and next steps. Annals of the Association of American Geographers,97(4), 739–754.
Roseberry, W. (1996). The rise of yuppie coffees and the reimagination ofclass in the United States. American Anthropologist, 98(4), 762–775.http://dx.doi.org/10.1525/aa.1996.98.4.02a00070.
Rudel, T. K., Coomes, O. T., Moran, E., Achard, F., Angelsen, A., Xu, J.C., et al. (2005). Forest transitions: Towards a global understanding ofland use change. Global Environmental Change-Human and PolicyDimensions, 15(1), 23–31. http://dx.doi.org/10.1016/j.gloenvcha.2004.11.001.
Rueda, X., & Lambin, E. (submitted for publication). Building resiliencethrough globalization: The case of coffee certification in Colombia.Ecology and Society.
SAN (2010). Sustainable agriculture standard. San Jose, Costa Rica:Sustainable Agriculture Network.
Talbot, J. (1997). Where does your coffee dollar go? The division ofincome and surplus along the coffee commodity chain. Studies inComparative International Development (SCID), 32(1), 56–91. http://dx.doi.org/10.1007/bf02696306.
Turner, B. L., Geoghegan, J. M., & Foster, D. R. (2004). Integrated land-change science and tropical deforestation in the southern Yucatan: Finalfrontiers. Oxford, UK: Oxford University Press.
USDA (2011). Production, supply and distribution on line. Retrieved 08/08/2011, from United States Department of Agriculture – ForeignAgricultural Service <http://www.fas.usda.gov/psdonline/psdReport.
balization toLocal Land Uses: How Eco-consumers and Gourmands12), http://dx.doi.org/10.1016/j.worlddev.2012.05.018
16 WORLD DEVELOPMENT
aspx?hidReportRetrievalName=Table+01+Coffee+World+Produc-tion%2c+Supply+and+Distribution+++++++++++++++++++++++++++++++++++++++++++&hidReportRetrievalID=2051&hidReportRetrievalTemplateID=13>.
UTZ (2010). Annual report. Amsterdam: UTZ Certified.
Please cite this article in press as: Rueda, X., & Lambin, E. F. Linking Gloare Changing the Colombian Coffee Landscapes, World Development (20
Valkila, J. (2009). Fair Trade organic coffee production in Nicaragua –Sustainable development or a poverty trap?. Ecological Economics,68(12), 3018–3025. http://dx.doi.org/10.1016/j.ecolecon.2009.07.002.
balization toLocal Land Uses: How Eco-consumers and Gourmands12), http://dx.doi.org/10.1016/j.worlddev.2012.05.018