linking adaptation and mitigation to achieve climate compatible development in drylands
TRANSCRIPT

Linking adaptation and mitigation to achieve climate compatible development in drylandsHouria Djoudi, Lou Verchot, Denis Gautier, Christoffe Koffi Koame , Mathurin Zida, Djibril Dayamba, Nadia Djenontin
http://www.unccd.int

Why linking A and M? Synergies and trade-offs between
adaptation and mitigation The conceptual divide between A and M has
hindered to achieve sustainable development challenges of climate change
Failure to join up those strategies could lead to policy conflicts and institutional fragmentation (Berry et al. 2015)
Mal adaptive mitigation actions and adaptation action which have a negative impact on carbon
To achieve the sustainable development goals in the drylands a climate compatible development integrating synergies between A and M is key
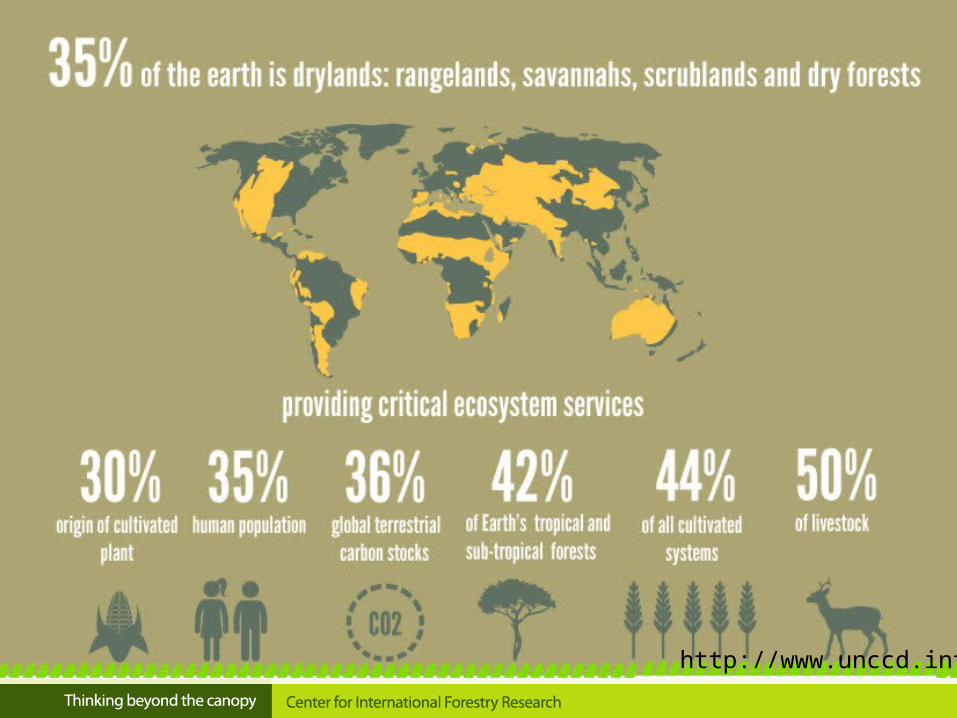
Why Drylands?
Smallholder traditionally developed adapted systems in those mosaic landscapes, however high climatic variability and extreme events are threatening traditional farming practices
The proportion of dryland areas affected by droughts is likely to increase (IPCC 2007a)
About 90% of the people living in the drylands are poor. High dependency of the poorest on natural resources and
ecosystem services to cope with food security shortages and crisis An increase of agricultural production would aggravate the risks of
further resource degradation
To adress those human and environemental challenges we need holistic and landscape approches including synergies
between A and M

Examples from CIFOR’s work in West Africa on AM linkages
To understand and maintream the role of forest and trees in adaptation
To better link the impact of land use
changes for both carbon and adaptive capacity
To provide sound evidence for policy makers to enhance AM co-benifits

Land use types considered in the mosaic landscapes: Forest (community managed and protected areas) Fallow lands Agroforestry parklands with indigenous food trees
(Shea butter and Parkia trees) Plantations (forest and non forest trees)
Tree aboveground, below ground (root) biomass and carbon stock, Soil carbon stock
Vegetation surveys; use of generalized biomass equation for dry forest (Chave et al., 2005) and global wood density database; C-stock = 50% of AGB
Excavation using cube of the size 25 cm × 25 cm × 20 cmC content (Walkley and Black, 1934); soil bulk density; proportion of fine soil
Adaptive Capacity Index (ACI)
Diversity of provisioning services provided, sensitivity of the land use to drought, Period of availability of the products, Income, Number of beneficiary
Gender Index (GI) Access and right over the ressources, inclusion in decision making, income, workload
Mitigation Adaptation

Vulnerability and food shortagesMonthly precipitation
Monthly temperature(data from CRU)
September = Youbim (“Eating the leave”), October = Tchab (“Hunger hurts”), November = Piekpakpa (name of a cooking tool, meaning of “Abundance”)
From sowing to harvestingPeriod of food shortages

Forest Land Restoration crucial for Food security during food shortages
Per
cent
of M
en h
arve
stin
g th
e pr
oduc
ts Food NTFPs (Fruits, Nuts, or Leaves)
* = Moringa o. Bombax c. Adansonia d.
MenP
erce
nt o
f Wom
en h
arve
stin
g th
e pr
oduc
ts Food NTFPs (Fruits, Nuts, or Leaves)
* = Moringa o. Bombax c. Adansonia d. Acacia macrostachya
Women

Forest areas : More cereal purchase by wood sellers
A household selling wood is about 4 times more likely to buy cereals

Agroforesterie Parklands : More cereal purchase by shea nut sellers
Clear evidence with this two examples that forest product are a safety net for food security in the Sahel

A-M linkages through the adaptive capacity index
Total0
5
COMFOREST - Carbon Index COMFOREST - ACI FOREST - Carbon Index FOREST - ACI FORESTPLANT - Carbon Index FORESTPLANT - ACIFRUITPLANT - Carbon Index FRUITPLANT - ACI RESTORATION - Carbon Index RESTORATION - ACI
20
40
60
80
100
120
140
Index Value
Landuse Class

AM Linkages through the gender index
0.0
2.5
5.0
COMFOREST - Carbon Index COMFOREST - Gender Index FALL - Carbon Index FALL - Gender Index FOREST - Carbon IndexFOREST - Gender Index FORESTPLANT - Carbon Index FORESTPLANT - Gender Index FRUITPLANT - Carbon Index FRUITPLANT - Gender IndexPARKLAND - Carbon Index PARKLAND - Gender Index RESTORATION - Carbon Index RESTORATION - Gender Index TEMOIN - Carbon IndexTEMOIN - Gender Index
20
60
100
140
Parklands
Landuse Class
Index Value
Rest.

Conclusions Mosaic landscapes including forests, agroforestry
areas, small scale FLR areas provide together crucial ES and are a crucial a safety for small holder HH to cope with food shortages
It is possible to implement land use plans which will simultaneously address both mitigation and adaptation needs if all the component of the landscape are included. Biodiversity is a requirement for both A and M
Arrangements to bring about climate change mitigation in drylands that simultaneously contribute to climate change adaptation is the only way to reach a climate compatible development in the specific context of drylands.

Andropogon roof
Metal roof
Thank you

4. Household adaptive capacity index under each tree-based adaptation strategy
Notes: RL = Reforested Lands; MG = Mango Plantations; CW= Cashew Plantations; EC= Eucalyptus Plantations
Key Research Findings
any significant difference among HHsless endowed in assets
Adaptive capacity Indexes RL MG CW EC
Assets-related Index (ACIA)
4.336 4.330 4.091 3.014
Diversification strategy-related Index(ACIS)
0.670 0.381 0.463 0.241
Overall AC Index 5.006 4.711 4.554 3.255
High ACI
Low ACI
Relatively good ACI

Résultats et messages clés
Ziro Balé
Land Use C stock (Mg/ha)
Land Use C stock (Mg/ha)
CMF02 73.95 AgriSF 56.84
CMF12 95.71 NVID-SF 58.9
CMF23 84.46 NVLD 93.74
NVLD 75.49 NVHD 50.67
NVID 66.2 Fall2 53.43
NVHD 66.14 Fall4 45.17
Fall1 57.27 Fall6 45.09
Fall2 59.36 VPark10 44.91
Fall3 55.94 VPark100 56.65
Fall7 68.05 VPark50 58.25
VPark10 48.31 Eucal30 66.88
VPark100 67.67
VPark50 59.7
Anac10 53.78
Anac3 43.05
Anac7 45.57
Mang3 57.33
Abo
vegr
ound
car
bon
stoc
k (M
g/H
a)
0
10
20
30
0
5
10
15
20
25
30
35
Roo
t car
bon
stoc
k (M
g/H
a)
0
5
10
15
20
25
0
5
10
15
20
25
Ziro Bale
Soi
l car
bon
stoc
k (M
g/H
a)
0
20
40
60
80
Land Use Types / Categories
0
20
40
60
80
AG-C + BG-C + Soil C

Some conclusions
In the dry forest context ES are a safety-net for women (specially the poorest)
A <->A Co-benefit approach actions is feasible of dry forest and adding the concept of adaptive capacity and vulnerability is likely to produce win-win gender outcomes
Landscape approaches to M including land uses outside
forest areas in the planning, «Gendered landscapes» approach including the safety net role of forest specially for food security
Overcome the current fragmentation of A and M institutions

Dimensions Components Indicators Explanation of indicators Measurement Sources
Assets-related index (50%)
Human Assets (25%)
Age of household Head (20%) Age of the head of households implementing the diversification strategy
Each strategy records its average actual value for this continuous variable
Sustainable Livelihoods Framework (DFID 2000); Yohe and Tol (2002); Sietchiping (2007); Vincent (2007).
Household size (20%) Number of persons living permanently in households who implement the diversification strategy
Each strategy records its average actual value for this continuous variable
Household Marital status: Polygamous status (20%)
Percentage of polygamous households using the diversification strategy
Each strategy takes score 1 if its average percentage is < to that of the whole sample and takes score 2 if >
Education level: Primary level (20%)
Percentage of households with primary education who implement the diversification strategy
Each strategy takes score 1 if its average percentage is < to that of the whole sample and takes score 2 if >
Literacy (20%) Percentage of literate households using the diversification strategy
Each strategy takes score 1 if its average percentage is < to that of the whole sample and takes score 2 if >
Social Assets and Institutions (25%)
Membership of Association (25%)
Percentage of Membership of association of households who develop each diversification strategy
Each strategy takes score 1 if its average percentage is < to that of the whole sample and takes score 2 if >
Yohe and Tol (2002) Adger (2004) Adger (2006) Pelling and High (2005); Sietchiping (2007); Vincent (2007).
Number of Social groups around NRM (25%)
Number of agriculture and forestry cooperative groups to which households implementing the diversification strategy belong to.
Each strategy records its average actual value for this continuous variable
Number of other Social groups (Credit, sensitizing…) (25%)
Number of credit groups, sensitizing groups or other social groups to which households implementing the diversification strategy belong to.
Each strategy records its average actual value for this continuous variable
Institutional rights over the land on which the strategy is implemented (tenure security) (25%)
Percentage of households with a legal tenure over the land that houses the strategy (legal tenure according to the official law.)
Each strategy takes score 1 if its average percentage is < to that of the whole sample and takes score 2 if >
Physical Assets (25%)
Number of Livestock-Cattle (20%)
Number of cattle owned by households who implement the diversification strategy
Each strategy records its average actual value for this continuous variable
Sustainable Livelihoods Framework (DFID 2000); Vincent (2007).
Number of small ruminants (20%)
Number of sheep and goats owned by households who implement the diversification strategy
Each strategy records its average actual value for this continuous variable
Means of Transportation: Number of Bicycle (20%)
Number of bicycle owned by households who implement the diversification strategy
Each strategy records its average actual value for this continuous variable
Production asset 1: Number of Plough (20%)
Number of plough owned by households who implement the diversification strategy
Each strategy records its average actual value for this continuous variable
Production asset 2: Number of Donkeys (20%)
Number of donkey owned by households who implement the diversification strategy
Each strategy records its average actual value for this continuous variable
Natural Assets (25%)
Total land size owned (100%) Hectares of farm owned by households who implement the diversification strategy
Each strategy records its average actual value for this continuous variable
Strategy outcomes-related index (50%)
Production diversity (25%)
Products diversity (100/3%) The number of products harvested by households who implement the diversification strategy.
Each strategy records its actual value for this variable. e.g. When households, who develop a strategy, harvest in average 3 products, the value recorded for the strategy = 3.
- Yohe and Tol (2002)
Framework for calculation of the household’s adaptive capacity index

Research Methodology
Measuring ADAPTIVE CAPACITY provided to HHs: a scalar that serves as an aggregate measure of the potential to cope with climate variability and change (Yohe and Tol 2002)
Aggregate adaptive capacity index:
Assets-related index (ACIA): (2i)
Strategy-related index (ACIS): (2ii)
Indicators index (ACI): (3)