linkedtv deliverable d1.4 visual, text and audio information analysis for hypervideo, final release
TRANSCRIPT

Deliverable D1.4 Visual, text and audio information analysis for hypervideo,final release
Evlampios Apostolidis / CERTHNikolaos Gkalelis / CERTH
Fotini Markatopoulou / CERTHDamianos Galanopoulos / CERTH
Eftichia Mavridaki / CERTHChristina Papagiannopoulou / CERTH
Vasileios Mezaris / CERTHDaniel Stein / FRAUNHOFER
Milan Dojchinovski / UEPTomas Kliegr / UEP
Milan Simunek / UEPVaclav Zeman / UEP
30/09/2014
Work Package 1: Intelligent hypervideo analysis
LinkedTVTelevision Linked To The Web
Integrated Project (IP)
FP7-ICT-2011-7. Information and Communication Technologies
Grant Agreement Number 287911

Visual, text and audio information analysis for hypervideo, final release D1.4
Dissemination level PU
Contractual date of delivery 30/09/2014
Actual date of delivery 30/09/2014
Deliverable number D1.4
Deliverable name Visual, text and audio information analysis for hypervideo, final re-lease
File linkedtv-d1.4.tex
Nature Report
Status & version Final & V1
Number of pages 62
WP contributing to the deliver-able
1
Task responsible CERTH-ITI
Other contributors FRAUNHOFER IAIS, UEP
Author(s) Evlampios Apostolidis / CERTHNikolaos Gkalelis / CERTHFotini Markatopoulou / CERTHDamianos Galanopoulos / CERTHEftichia Mavridaki / CERTHChristina Papagiannopoulou / CERTHVasileios Mezaris / CERTHDaniel Stein / FRAUNHOFERMilan Dojchinovski / UEPTomas Kliegr / UEPMilan Simunek / UEPVaclav Zeman / UEP
Reviewer Benoit Huet / EURECOM
EC Project Officer Thomas Kuepper
Keywords Multimodal Video Analysis, Shot Segmentation, Chapter Segmen-tation, Video Concept Detection, Video Event Detection, AutomaticSpeech Recognition, Speaker Identification, Keyword Extraction,REST Service
c© LinkedTV Consortium, 2014 2/62

Visual, text and audio information analysis for hypervideo, final release D1.4
Abstract (for dissemination) Having extensively evaluated the performance of the technologiesincluded in the first release of WP1 multimedia analysis tools, usingcontent from the LinkedTV scenarios and by participating in inter-national benchmarking activities, concrete decisions regarding theappropriateness and the importance of each individual method orcombination of methods were made, which, combined with an up-dated list of information needs for each scenario, led to a new setof analysis requirements that had to be addressed through the re-lease of the final set of analysis techniques of WP1. To this end, co-ordinated efforts on three directions, including (a) the improvementof a number of methods in terms of accuracy and time efficiency,(b) the development of new technologies and (c) the definition ofsynergies between methods for obtaining new types of informationvia multimodal processing, resulted in the final bunch of multimediaanalysis methods for video hyperlinking. Moreover, the different de-veloped analysis modules have been integrated into a web-basedinfrastructure, allowing the fully automatic linking of the multitude ofWP1 technologies and the overall LinkedTV platform.
c© LinkedTV Consortium, 2014 3/62

Visual, text and audio information analysis for hypervideo, final release D1.4
0 Content
0 Content 4
1 Introduction 6
2 Shot segmentation 102.1 Problem statement and brief overview of the state of the art . . . . . . . . . . . . . . . . . 102.2 LinkedTV approach . . . . . . . . . . . . . . . . . . . . . . . . . . . . . . . . . . . . . . . 11
2.2.1 Detection of abrupt transitions . . . . . . . . . . . . . . . . . . . . . . . . . . . . . 112.2.2 Detection of gradual transitions . . . . . . . . . . . . . . . . . . . . . . . . . . . . . 122.2.3 Advances in comparison to previous versions . . . . . . . . . . . . . . . . . . . . . 13
2.3 Experimental evaluation and comparisons . . . . . . . . . . . . . . . . . . . . . . . . . . . 152.4 Discussion . . . . . . . . . . . . . . . . . . . . . . . . . . . . . . . . . . . . . . . . . . . . 16
3 Chapter segmentation 163.1 Problem statement and brief overview of the state of the art . . . . . . . . . . . . . . . . . 163.2 LinkedTV approach . . . . . . . . . . . . . . . . . . . . . . . . . . . . . . . . . . . . . . . 17
3.2.1 Generic topic segmentation algorithm . . . . . . . . . . . . . . . . . . . . . . . . . 183.2.2 Chapter segmentation algorithm for the LinkedTV documentary scenario . . . . . 183.2.3 Topic segmentation algorithm for the LinkedTV news scenario . . . . . . . . . . . 193.2.4 Keyframe selection . . . . . . . . . . . . . . . . . . . . . . . . . . . . . . . . . . . . 203.2.5 Advances in comparison to previous versions . . . . . . . . . . . . . . . . . . . . . 21
3.3 Experimental evaluation and comparisons . . . . . . . . . . . . . . . . . . . . . . . . . . . 223.4 Discussion . . . . . . . . . . . . . . . . . . . . . . . . . . . . . . . . . . . . . . . . . . . . 22
4 Automatic speech recognition 224.1 Problem statement and brief overview of the state of the art . . . . . . . . . . . . . . . . . 22
4.1.1 Acoustic Model . . . . . . . . . . . . . . . . . . . . . . . . . . . . . . . . . . . . . . 234.1.2 Language Model . . . . . . . . . . . . . . . . . . . . . . . . . . . . . . . . . . . . . 24
4.2 LinkedTV approach . . . . . . . . . . . . . . . . . . . . . . . . . . . . . . . . . . . . . . . 244.2.1 Advances in comparison to previous versions . . . . . . . . . . . . . . . . . . . . . 25
4.2.1.1 New acoustic model paradigm: deep neural networks . . . . . . . . . . . 254.2.1.2 New training material: GER-TV1000h corpus . . . . . . . . . . . . . . . . 254.2.1.3 N-gram language model . . . . . . . . . . . . . . . . . . . . . . . . . . . 264.2.1.4 Recurrent Neural Network Language Model . . . . . . . . . . . . . . . . 26
4.3 Experimental evaluation and comparisons . . . . . . . . . . . . . . . . . . . . . . . . . . . 274.4 Discussion . . . . . . . . . . . . . . . . . . . . . . . . . . . . . . . . . . . . . . . . . . . . 27
5 Speaker identification 285.1 Problem statement and overview of the state of the art . . . . . . . . . . . . . . . . . . . . 285.2 LinkedTV approach . . . . . . . . . . . . . . . . . . . . . . . . . . . . . . . . . . . . . . . 28
5.2.1 Advances in comparison to previous versions . . . . . . . . . . . . . . . . . . . . . 285.2.1.1 VideoOCR based speaker database extraction . . . . . . . . . . . . . . . 285.2.1.2 i-vector paradigm . . . . . . . . . . . . . . . . . . . . . . . . . . . . . . . 29
5.3 Experimental evaluation and comparisons . . . . . . . . . . . . . . . . . . . . . . . . . . . 295.4 Discussion . . . . . . . . . . . . . . . . . . . . . . . . . . . . . . . . . . . . . . . . . . . . 31
6 Keyword extraction 316.1 Problem statement and brief review over the state of the art . . . . . . . . . . . . . . . . . 316.2 LinkedTV experimental approach – Entity Salience Model . . . . . . . . . . . . . . . . . . 32
6.2.1 Features with local scope . . . . . . . . . . . . . . . . . . . . . . . . . . . . . . . . 326.2.2 Features with global scope . . . . . . . . . . . . . . . . . . . . . . . . . . . . . . . 326.2.3 Advances in comparison with the previous version . . . . . . . . . . . . . . . . . . 33
6.3 Experimental evaluation and comparisons . . . . . . . . . . . . . . . . . . . . . . . . . . . 346.3.1 Generation of an entity salience corpus . . . . . . . . . . . . . . . . . . . . . . . . 346.3.2 Experimental setup . . . . . . . . . . . . . . . . . . . . . . . . . . . . . . . . . . . 346.3.3 Results . . . . . . . . . . . . . . . . . . . . . . . . . . . . . . . . . . . . . . . . . . 34
c© LinkedTV Consortium, 2014 4/62
Visual, text and audio information analysis for hypervideo, final release D1.4
6.4 Discussion . . . . . . . . . . . . . . . . . . . . . . . . . . . . . . . . . . . . . . . . . . . . 35
7 Video concept detection 357.1 Problem statement and brief overview of the state of the art . . . . . . . . . . . . . . . . . 357.2 LinkedTV approach . . . . . . . . . . . . . . . . . . . . . . . . . . . . . . . . . . . . . . . 36
7.2.1 Combining visual and audio information for visual concept detection . . . . . . . . 367.2.2 Recent advances in the visual information analysis pipeline . . . . . . . . . . . . . 387.2.3 Advances in comparison to previous versions . . . . . . . . . . . . . . . . . . . . . 41
7.3 Experimental evaluation and comparisons . . . . . . . . . . . . . . . . . . . . . . . . . . . 427.3.1 Impact of exploiting audio information . . . . . . . . . . . . . . . . . . . . . . . . . 427.3.2 Extended visual analysis pipeline . . . . . . . . . . . . . . . . . . . . . . . . . . . . 44
7.4 Discussion . . . . . . . . . . . . . . . . . . . . . . . . . . . . . . . . . . . . . . . . . . . . 45
8 Video event detection 458.1 Problem statement and brief overview of the state of the art . . . . . . . . . . . . . . . . . 458.2 LinkedTV approach . . . . . . . . . . . . . . . . . . . . . . . . . . . . . . . . . . . . . . . 46
8.2.1 Video representation . . . . . . . . . . . . . . . . . . . . . . . . . . . . . . . . . . . 468.2.2 Dimensionality reduction . . . . . . . . . . . . . . . . . . . . . . . . . . . . . . . . . 478.2.3 Event detection . . . . . . . . . . . . . . . . . . . . . . . . . . . . . . . . . . . . . . 478.2.4 Advances in comparison to previous versions . . . . . . . . . . . . . . . . . . . . . 48
8.3 Experimental evaluation and comparisons . . . . . . . . . . . . . . . . . . . . . . . . . . . 488.3.1 Datasets . . . . . . . . . . . . . . . . . . . . . . . . . . . . . . . . . . . . . . . . . 488.3.2 Experimental setup . . . . . . . . . . . . . . . . . . . . . . . . . . . . . . . . . . . 488.3.3 Results . . . . . . . . . . . . . . . . . . . . . . . . . . . . . . . . . . . . . . . . . . 50
8.4 Discussion . . . . . . . . . . . . . . . . . . . . . . . . . . . . . . . . . . . . . . . . . . . . 50
9 WP1 REST Service 51
10 Conclusions 53
Bibliography 55
c© LinkedTV Consortium, 2014 5/62

Visual, text and audio information analysis for hypervideo, final release D1.4
1 Introduction
This deliverable describes the final release of the set of multimedia analysis tools for hypervideo, asdesigned and developed by WP1 of the LinkedTV project. The starting point for this release was thegroup of methods presented in D 1.2. The performance of these techniques was extensively evaluatedduring the third year of the project, either using collections of multimedia content from the scenarios ofthe LinkedTV project, or by participating in international benchmarking activities, such as TRECVID 1
and MediaEval 2. This evaluation resulted in a set of concrete decisions regarding the appropriatenessand the importance of each individual method or combination of methods, for addressing the analysisrequirements of the LinkedTV scenarios.
The extracted conclusions, combined with an updated list of information needs and demands foreach scenario, led to a set of goals that had to be achieved through the release of the final set ofanalysis techniques. So, our target during this year in the project was to implement a new toolbox ofmethods that would offer more accurate and meaningful analysis results, while demanding less time forprocessing, and for doing so we worked on three directions: (a) we improved a subset of techniquesfrom the first release both in terms of detection accuracy and time efficiency (e.g., shot segmentation,concept detection), (b) we introduced new analysis components (e.g., optical character recognition) and(c) we created synergies between these methods aiming to provide new analysis results (e.g., chaptersegmentation and face tracking) and support multimodal analysis (e.g., topic segmentation). Our effortsresulted in a new set of techniques and links among them, as illustrated in Fig. 1.
Figure 1: The group of techniques included in the final release of WP1 multimedia analysis tools, and thesynergies among them for supporting multimodal analysis for video hyperlinking. Dashed lines indicatetechniques or connections among them that we developed and tested but decided not to include in thedefault automatic analysis pipeline of WP1 that is realized by the WP1 REST service.
The following sections, presenting with the different analysis techniques, are structured in the sameway: they start with a problem statement, including a short review of the current state of the art. Sub-sequently we introduce the LinkedTV approach we developed for LinkedTV, we explain the advances incomparison to previous similar LinkedTV technique that were presented in D1.2, if any, and report theresults of experiments conducted for evaluation. Finally we discuss the evaluation results and therebygive an outlook on future research directions.
The first two sections of the deliverable concentrate on techniques for the temporal decomposition ofa video at different granularity levels. Specifically, Section 2 deals with the segmentation of videos intoshots, which are sequences of frames captured uninterruptedly from a single camera. These temporallyand visually coherent parts of the video can be seen as the most elementary structural units of the video,thus making shot segmentation the fundamental analysis step of most high-level video content analysisapproaches that were developed in LinkedTV. Section 3 concentrates on methods for segmenting videosinto story-telling parts, called topics or chapters. Three different techniques are presented: (a) a genericmultimodal approach that relies on a combination of audio, text and visual analysis, aiming to identify thedifferent topics discussed in a video, (b) a method adapted to the needs and characteristics of the videosfrom the LinkedTV documentary scenario, which defines chapter segments based on the re-detection ofa visual cue, called “bumper”, and a set of rules about the structure of the videos, and (c) a techniquethat is customized for videos from the LinkedTV news show scenario, and defines the different topics of
1http://trecvid.nist.gov/2http://www.multimediaeval.org/
c© LinkedTV Consortium, 2014 6/62

Visual, text and audio information analysis for hypervideo, final release D1.4
the show based on the detection of the anchorperson.Subsequently we focus on audio analysis, presenting the underlying technology for automatic speech
recognition (ASR) and speaker identification. Section 4 initially describes the three main components ofASR analysis, i.e., the used acoustic model, the defined dictionary of words and the employed languagemodel. Then reports the progress made in each of these components since the previous release ofASR analysis techniques (D1.2), highlighting the achieved improvements based on the new developedmodels and the enriched dictionaries. Section 5 briefly discusses methods for distinguishing the differ-ent speakers in a video. Afterwards, a multimodal approach for speaker identification, that relies on adatabase of speakers (created by applying Optical Character Recognition (OCR) on the banners of avideo) and a method for describing the vocal characteristics of each speaker, is presented and evaluatedusing data from the LinkedTV project.
The output of ASR can be further processed by the text analysis technique presented in Section 6.This section deals with methods for identifying important words, termed “keywords”, from textual sourcesrelated to a multimedia content, such as the subtitles or the metadata of a video, or transcripts automati-cally extracted from ASR analysis. The extracted keywords can be used as tags for annotating either theoverall multimedia content of smaller fragments of it, allowing the retrieval, clustering and categorizationof media fragments with related content.
We proceed in Section 7 with the presentation of a technique for video concept detection, which isone of the most challenging tasks of high-level multimedia analysis. Using the video keyframes extractedfor each defined fragment by the shot segmentation technique as input, this analysis module focuses onthe detection of concepts depicted in each one of them, aiming to provide a higher level description ofa video and to automatically identify videos belonging to various domains. Moreover, the output of thisanalysis is also utilized by the video event detection algorithm presented in Section 8, which can be usedas an advanced technique for more effective ways of indexing, summarizing, browsing, and retrievingof video content, by enriching the video annotations resulting from concept detection with additionalevent-related annotations.
After the presentation of each individual technique from the final release of the set of multimedia anal-ysis tools, in Section 9 we describe the developed framework for establishing a simplified and automatedcommunication channel between the multimedia analysis toolbox of WP1 and the overall LinkedTV plat-form. This web-based framework, termed “WP1 REST Service”, consists of a set of inter-linked RESTservices, that cooperate in order to support all the different types of analysis provided by WP1 of theLinkedTV project.
The deliverable concludes with a discussion in Section 10, on future plans and opportunities forextending the developed infrastructure for multimedia analysis.
c© LinkedTV Consortium, 2014 7/62

Visual, text and audio information analysis for hypervideo, final release D1.4
List of Figures
1 The group of techniques included in the final release of WP1 multimedia analysis tools,and the synergies among them for supporting multimodal analysis for video hyperlinking. 6
2 Video decomposition at the frame and the shot level, and indicative examples of abruptand gradual transition between consecutive shots of the video. . . . . . . . . . . . . . . . 11
3 Analysis of the similarity scores for the detection of gradual transitions. . . . . . . . . . . . 144 The “bumper” that is used for denoting chapter transitions in the videos of the documen-
tary scenario and an example of wipe transition between shots, using the “bumper”. . . . 205 Indicative samples from the positive set that was used for training the “RBB Studio Anhor-
person” visual classifier. . . . . . . . . . . . . . . . . . . . . . . . . . . . . . . . . . . . . . 216 Example of feedforward deep neural network (two hidden layers). . . . . . . . . . . . . . . 237 Recurrent neural network based language model [MKD+11]. . . . . . . . . . . . . . . . . 248 Workflow for a an automatically crawled person identification database, using news show
banner information. . . . . . . . . . . . . . . . . . . . . . . . . . . . . . . . . . . . . . . . . 299 DET curve for the speaker identification experiment on RBB material. . . . . . . . . . . . 3010 Detection-error-trade-of curve for the GMM-UBM approach in comparison for the i-vector/PLDA
approach for speaker identification. . . . . . . . . . . . . . . . . . . . . . . . . . . . . . . . 3111 Meta-classification and second level linear fusion pipeline. . . . . . . . . . . . . . . . . . . 3712 The general pipeline of the employed concept detection system. . . . . . . . . . . . . . . 3913 Block diagram of color SURF/ORB descriptor extraction, where d denotes the dimension
of the original local descriptor. . . . . . . . . . . . . . . . . . . . . . . . . . . . . . . . . . . 4014 XinfAP performance per concept, for audio-visual averaging strategies (arithmetic, geo-
metric and harmonic mean) and comparison with the audio and visual baselines. . . . . . 4215 XinfAP per concept for meta-classification for visual baseline, OVA and OV pA after the
second level linear fusion. . . . . . . . . . . . . . . . . . . . . . . . . . . . . . . . . . . . . 4316 The developed WP1 REST Service, the established communication channels and the
analysis modules that have been integrated into the service. . . . . . . . . . . . . . . . . . 52
List of Tables
1 Experimental results for the considered techniques. . . . . . . . . . . . . . . . . . . . . . 152 Complete list of labels used for the annotation of the new training corpus. . . . . . . . . . 253 Training sets for acoustic modelling derived from GER-TV1000h Corpus. . . . . . . . . . . 264 Development set and evaluation sets. . . . . . . . . . . . . . . . . . . . . . . . . . . . . . 275 WER results of ASR system configurations on various data sets. . . . . . . . . . . . . . . 276 Size of the German Parliament Corpus as used in the evaluation of the speaker identifi-
cation. . . . . . . . . . . . . . . . . . . . . . . . . . . . . . . . . . . . . . . . . . . . . . . . 307 Speaker identification experiments of Equal Error Rate, on German Parliament data. 128
GMM mixtures for UBM, i-vector size of 10. . . . . . . . . . . . . . . . . . . . . . . . . . . 308 The features computed from information available within the document. . . . . . . . . . . 329 The features computed from information available outside the scope of the documents. . 3310 Results from the evaluation of (P)recision, (R)ecall, (F)measure and accuracy for the pure
unsupervised TF-IDF based model and our trained model using K-NN classification algo-rithm. . . . . . . . . . . . . . . . . . . . . . . . . . . . . . . . . . . . . . . . . . . . . . . . 34
11 Results from the evaluation of (P)recision, (R)ecall and (F)measure for three algorithms,with different feature combinations. A baseline classifier, which always predicts the ma-jority class less salient has P=0.261, R=0.511 and F=0.346. . . . . . . . . . . . . . . . . . 35
12 TRECVID concepts that are used for experimentation (showing also their number IDs, 1to 34). . . . . . . . . . . . . . . . . . . . . . . . . . . . . . . . . . . . . . . . . . . . . . . . 42
13 MXinfAP performance for averaging fusion strategies and comparison with the visualbaselines. . . . . . . . . . . . . . . . . . . . . . . . . . . . . . . . . . . . . . . . . . . . . . 43
14 MXinfAP performance for meta-classification fusion. . . . . . . . . . . . . . . . . . . . . . 4315 Performance (MXinfAP %) for the different descriptors, when typical and channel-PCA
for dimensionality reduction is used, compared on the TRECVID 2013 dataset. In paren-thesis we show the relative improvement w.r.t. the corresponding original grayscale localdescriptor for each of the SIFT, SURF and ORB color variants. . . . . . . . . . . . . . . . 44
c© LinkedTV Consortium, 2014 8/62

Visual, text and audio information analysis for hypervideo, final release D1.4
16 Performance (MXinfAP %) for different combinations of descriptors, (a)when features areextracted only from keyframes, (b) when horizontal and vertical tomographs described bySIFT, RGB-SIFT and Opponent-SIFT are also examined, (c) when the second layer isinstantiated with the Label Powerset algorithm [MMK14]. . . . . . . . . . . . . . . . . . . . 44
17 Target events of TRECVID MED 2010 (T01-T03) and 2012 (E01-E15, E21-E30) datasets. 4918 Performance evaluation on the TRECVID MED 2010 dataset; the last column depicts the
boost in performance of GSDA-LSVM over KSVM. . . . . . . . . . . . . . . . . . . . . . . 4919 Performance evaluation on the TRECVID MED 2012 dataset; the last column depicts the
boost in performance of GSDA-LSVM over KSVM. . . . . . . . . . . . . . . . . . . . . . . 4920 Time (in minutes) for selecting the parameters C and ρ of KSVM and GSDA-LSVM with
H = 2 during training in MED 2012 dataset from a 5×5 grid; for LSVM a 5×1 grid is usedas only C needs to be identified. . . . . . . . . . . . . . . . . . . . . . . . . . . . . . . . . 50
21 Performance evaluation on the TRECVID MED 2010 dataset using motion information;the last column depicts the boost in performance of GSDA-LSVM over LSVM. . . . . . . . 51
c© LinkedTV Consortium, 2014 9/62

Visual, text and audio information analysis for hypervideo, final release D1.4
2 Shot segmentation
2.1 Problem statement and brief overview of the state of the artConsidering a video as a sequence of frames, as illustrated in the first row of Fig 2, its segmentationinto shots can be interpreted as the identification of video fragments that are composed by consecutiveframes captured uninterruptedly from a single camera. The inherent temporal and visual coherence ofthese fragments, which are called shots, makes them self-contained visual entities that constitute thebasic building blocks of the video. Based on this, shot segmentation aims to identify the elementarystructure of the video, thus being the basis of a number of high-level video analysis techniques, such asvideo semantic analysis, higher-level video segmentation (e.g., into story-telling parts), video summa-rization, indexing and retrieval.
The decomposition of the video into the shot level is depicted in the second row of Fig. 2, and isperformed by detecting the transition between pairs of consecutive shots of the video. The most com-monly used visually-related shot transition techniques in the post-production process of the video editingphase can be divided in two general classes. The first class includes abrupt transitions, or cuts, wherethe last frame of a shot is followed by the first frame of the next shot. An indicative example of abrupttransition is presented in the third row of Fig 2. The second class contains gradual transitions, where ashort transition period exists between the shots, including frames that are composed by combining thevisual content of these shots, using one or more video editing effects such as dissolve, wipe, fade in/outand morph. The last row of Fig 2 shows an example of dissolve transition. In addition to accuratelydetecting both of the aforementioned types of shot transitions, the required computation time is anothercritical property of a video segmentation algorithm, similarly to any algorithm that needs to be applicableto vast amounts of video content.
Early approaches to shot segmentation in uncompressed video were based on pair-wise pixel com-parisons and/or the comparison of color histograms between video frames, calculated either for eachentire frame or at a finer block level [ZKS93]. Other techniques exploited structural features of the videoframes, such as edges, and performed shot segmentation by estimating for instance the edge changeratio between frames [ZMM99]. Recent extensions of such methods include [QLR+09] and [LL10],where the video shots are detected based on the combination of edge information with color histogramsand motion, respectively.
After the introduction of Support Vector Machines (SVM) [Vap95] several approaches used themfor shot segmentation, as a way of classifying video frames into “boundary” and “non-boundary”. Amethod that compares normalized RGB histograms and uses a trained SVM classifier was introducedin [CLG09], while another SVM-based approach that employs intensity pixel-wise comparisons, HSVhistograms and edge histograms was proposed in [LYHZ08]. Furthermore, visual features that are nottypically used for video shot segmentation, such as the Color Coherence [PZM96] and the LuminanceCenter of Gravity, were combined in a SMV-based approach for abrupt and gradual transition detectionin [TMK08].
Following the development of scale- and rotation-invariant local descriptors (e.g., SIFT [Low04] andSURF [BETVG08]), several algorithms that rely on them were also proposed. In [LK13] a techniquebased on the detection and tracking of objects in successive video frames was introduced. Accordingto this, the SIFT descriptors extracted from the frames are clustered into a predefined number of bins,creating a codebook of visual words. Each frame is then represented by a histogram of words and theshot boundaries are determined based on the similarity of these histograms. In [LDSL10], a divide-and-rule scheme that combines SIFT descriptors and SVM classifiers for capturing the changing statistics ofseveral kinds of transitions was proposed, while a different approach based on frame entropy and SURFdescriptors was presented in [BADB11]. Local feature extraction and processing was also used at thekernel-based shot segmentation method described in [LZZ08], as a part of a post refinement strategyfor minimizing the false alarms caused by camera flash-lights and fast background change.
Indicative examples of alternative methods for shot segmentation include techniques applied on thecompressed data stream, such as the ones introduced at [PC02] and [DVZP04], and algorithms that usepolynomial data (B-spline) interpolation [NT05], a linear transition detection scheme [GC07], a graph-partitioning technique [CNP06] and a method based on QR-decomposition [AF09].
For a more detailed overview of the state-of-the-art techniques for shot segmentation, the reader isreferred to Section 3.1 of D1.1.
c© LinkedTV Consortium, 2014 10/62

Visual, text and audio information analysis for hypervideo, final release D1.4
Figure 2: Video decomposition at the frame and the shot level, and indicative examples of abrupt andgradual transition between consecutive shots of the video.
2.2 LinkedTV approachThe LinkedTV shot segmentation technique is based on the algorithm we proposed in [AM14]. Startingfrom this approach, we further modified some parts and we extended some others, ending up with a newshot segmentation algorithm that exhibits improved performance both in terms of detection accuracy andtime efficiency.
Our algorithm exploits the descriptive efficiency of both local and global descriptors for assessingframe similarity. Specifically, each frame of the video is represented by an HSV color histogram and a setof ORB descriptors (proposed in [RRKB11]), allowing the algorithm to detect effectively the differencesbetween a pair of frames, both in color distribution and at a more fine-grained structure level. Thenboth abrupt and gradual transitions are detected by quantifying the change in the content of successiveor neighboring frames of the video, and comparing it against experimentally specified thresholds thatindicate the existence of abrupt and gradual shot transitions. Finally, a simple fusion approach (i.e.,taking the union of the detected abrupt and gradual transitions) is used for forming the output of thealgorithm.
The detection strategies applied by the shot segmentation algorithm for the identification of each typeof transition are described in details in the following sub-sections.
2.2.1 Detection of abrupt transitions
Abrupt transitions are detected between successive video frames where there is a sharp change inthe visual content, which is expressed by a very low similarity score. For measuring the resemblancebetween a pair of frames (e.g., frames i and i+1) we use the formula:
F(i) =d(Hi,Hi+1)+(1−b(Hi,Hi+1))
2Oi +O′i
2(1)
In the above formula F(i) is the calculated similarity score, d(Hi,Hi+1) is the normalized correlationof the HSV histograms Hi and Hi+1, which have W bins (50 bins for hue and 60 for saturation), andb(Hi,Hi+1) denotes the Bhattacharryya factor for the same pair of histograms. d(Hi,Hi+1) and b(Hi,Hi+1)are computed as follows:
c© LinkedTV Consortium, 2014 11/62

Visual, text and audio information analysis for hypervideo, final release D1.4
d(Hi,Hi+1) =
W∑j=1
(Hi( j)−H ′i )(Hi+1( j)−H ′i+1)√W∑j=1
(Hi( j)−H ′i )2W∑j=1
(Hi+1( j)−H ′i+1)2
(2)
b(Hi,Hi+1) =
√√√√1− 1√H ′i H
′i+1W 2
W
∑j=1
√Hi( j)Hi+1( j) (3)
where H ′i =1
W
W
∑j=1
Hi( j) (4)
The ORB parameter that affects the number of detected keypoints was set to 400, while the matchingof the calculated descriptors was performed in a brute force manner (i.e., each descriptor extracted fromone frame was matched against all the descriptors extracted from the following frame), looking each timefor the 2 best matches via k-Nearest Neighbor (k-NN) search. So, for each detected keypoint in framei we search for the best matches in frame i+ 1 that correspond to the two nearest neighbors N1 andN2. Erroneous matches are then filtered-out based on the following rule: we keep a keypoint in frame iand its corresponding best match in frame i+1 if ‖N1‖ / ‖N2‖ ≤ 0.8, where ‖ ·‖ is the Hamming distancebetween the corresponding nearest neighbor and the keypoint. Then, the factors Oi and O′i of Eq. (1)are computed as the ratio of the matched keypoints Mi to the number of detected keypoints in each ofthe compared video frames, Ki and Ki+1, respectively.
Oi =Mi
Ki, O′i =
Mi
Ki+1(5)
Based on the resulting similarity scores (Eq. (1)), an abrupt transition is declared in between everypair of frames with a similarity score lower than a threshold Ta = 0.03. Furthermore, noting that aninstant change in the luminance of a frame, caused by camera flash-lights, can be interpreted as anabrupt transition by many shot segmentation algorithms, we apply a flash detector on each detectedabrupt transition aiming to filter out possible outliers due to flashes. Assuming that a shot boundary wasdetected between frames i and i+ 1, the flash detector skips frames i+ 1 and i+ 2 which usually arestrongly affected by the change in luminance, and evaluates the visual similarity between frames i andi+ 3, using Eq. (1). The computed score is compared against the same threshold Ta and if it is higherthen the shot transition is recognized as a false alarm and is removed, while in a different case the shottransition is identified as a valid one.
The calculation and comparison of HSV histograms and the extraction and matching of ORB de-scriptors between pairs of frames was realized using version 2.4.7 of the OpenCV library 3. Aiming tospeed-up the analysis we consider the number of video frames T and we create four equally balancedgroups of them. These groups contain T/4 consecutive frames of the video and are overlapping in thefollowing way: group 1 contains frames from 1 to T/4, group 2 contains frames from T/4 to T/2, group3 contains frames from T/2 to 3T/4 and group 4 contains frames from 3T/4 to T . By adopting thispartition scheme we ensure that all pairs of successive frames will be evaluated in terms of their visualsimilarity. After this splitting, the sequential procedure of pairwise frame comparisons is replaced byfour parts that performed in parallel, after invoking the multi-threading/multi-processing operations of theIntel OpenMP runtime library 4. The latter combined with the Threading Building Blocks (TBB) libraryof Intel 5, guarantee that the entire processing power of all the available CPU cores will be exploited formaking the analysis as fast as possible.
2.2.2 Detection of gradual transitions
For the detection of gradual transitions, we further analyse the computed similarity scores trying to iden-tify patterns that correspond to progressive changes of the visual content over sequences of frames.Denoting F the curve (see Fig. 3) formed by the similarity scores computed in the first part of process-ing (Eq. (1)) for all frames, then the potential shot boundaries due to gradual transition are detected
3http://opencv.org/4http://openmp.org/wp/5https://www.threadingbuildingblocks.org/
c© LinkedTV Consortium, 2014 12/62

Visual, text and audio information analysis for hypervideo, final release D1.4
as described in Alg. 1. The output of this algorithm is a vector C of scores that represent the visualdissimilarity between each frame that corresponds to a local minimum of the moving average curve G(Alg. 1) and two frames that correspond to local maxima of the same curve and surround the formerlocal minimum. Video frames where the computed dissimilarity is higher than a threshold Tb = 0.3 aredeclared as candidate shot boundaries due to gradual transition.
Algorithm 1 Detection of potential gradual transitions.Notation: T is the number of frames of the video, F(i), i = 1...(T − 1) are the similarity scores, G(k),
k = 1...(T −2V −1) is the moving average curve, V = 5 is the temporal window for computing G(k),E(k) is the first order derivative of G(k), vectors Gmin and Gmax store the local minima and maximaof G(k), D(k) is the dissimilarity vector, C(k) is the clustered dissimilarity vector, R is the video’sframe-rate and Y = 0.15.
Input: The similarity scores F(i).Ensure: The clustered dissimilarity vector C(k).
1: Load F(i) (top graph in Fig. 3) and compute the moving average vector G(k) (middle graph in Fig. 3)as:for k = 1→ (T −2V −1)
G(k) = ∑Vm=−V
F(k+V+m)2V+1
2: Calculate E(k) as the first order derivative of G(k) and store the local minima and maxima of G(k) invectors Gmin and Gmax, respectively
3: Calculate D(k) (bottom graph in Fig. 3) as:for k = 1→ (T −2V −1)
if frame k is the p− th element of Gmin then D(k) =|F(Gmin(p))−F(Gmax(p−1))|+ |F(Gmin(p))−F(Gmax(p)|, else D(k) = 0
4: Calculate C(k) (bottom graph in Fig. 3), as:for k = 1→ (T −2V −1)
if D(k)> Y then C(k) = ∑R/2l=−R/2 D(k+ l) (pro-
viding that D(k+ l) exists), else C(k) = 0
As depicted in the middle and bottom graphs of Fig. 3, some of the detected gradual transitions mightcorrespond to sequences of frames exhibiting object or camera movement. Aiming to identify theseoutliers, two different gradual transition detectors are combined with a movement detector, consideringeach time a restricted neighborhood of frames around each defined candidate.
Specifically, given a candidate, a dissolve transition detector that is based on the approach of [SLT+05],examines the monotony of the pixel intensity values for the frames lying between the frames that corre-spond to its previous and following local maxima from vector Gmax, and compares it against pre-definedpatterns that indicate the existence of dissolve transition. In case of dissimilarity between these patterns,the detected gradual transition is rejected as being a false alarm, while otherwise a movement detectoris applied, assessing the visual similarity between the first and the last frame of the considered neigh-borhood of frames, based on the formula of Eq. (1). If the calculated score is higher than a thresholdTc = 0.05, we consider that the compared frames belong to the same shot and we remove the detectedshot boundary as a false alarm due to object/camera movement. If the detected candidate go throughthis two-step filtering procedure, then we retain it as a valid shot boundary due to gradual transition.
A different approach is utilized for the identification of wipe transitions. For each defined candidate,a detector that is based on the the algorithm proposed in [SPJ09] extracts the so-called Visual RhythmSpectrum and analyzes it aiming to evaluate the existence of wipe transition. The area of frames that isexamined by the wipe detector for a given candidate, is a temporal window that starts from the previouslocal maxima of this candidate, from vector Gmax, and is extended to the next 20 frames. If the result ofthis analysis declares inexistence of wipe transition, then the detected candidate is removed as a falsealarm. In a different case the movement detection criterion described above is applied again, leadingto the final judgement regarding the validity of the detected candidate as shot boundary due to gradualtransition.
2.2.3 Advances in comparison to previous versions
Starting from the shot segmentation algorithm described in Section 2.2 of D1.2 (denoted as T0 in thesequel), our aim was to improve it, both in terms of detection accuracy and time efficiency. Both of these
c© LinkedTV Consortium, 2014 13/62

Visual, text and audio information analysis for hypervideo, final release D1.4
Figure 3: Analysis of the similarity scores for the detection of gradual transitions. The top graph illustratesthe frame similarity scores calculated by HSV histogram comparison (first fraction in Eq. (1)), ORBdescriptor matching (second fraction in Eq. (1)) and their combination (F), for 350 frames of a video.The middle graph presents the computed moving average (curve G) for each of these score curves. Thebottom graph shows the calculated dissimilarity vectors before (D) and after (C) clustering.
goals were challenging due to the fact that the algorithm already exhibited high performance, achievingprecision and recall scores greater than 90% in our experiments using a small set of videos from theLinkedTV content (described in Section 2.3 of D1.2), while its time efficiency was varying between 1.5−2times of the video’s actual duration (i.e., 1.5− 2 times slower than real-time processing), depending onthe number of gradual transitions that had to be classified by the utilized SVM-based framework.
The choices were either to create a faster and more accurate variation/extension of this algorithm orto designing and develop a new one from scratch. After some internal tests with the algorithm T0 our de-cision was to build a new method. These efforts resulted in the implementation of the shot segmentationalgorithm described in [AM14] (denoted as T1 in the sequel). As described in [AM14], the algorithm ex-hibited slightly improved performance in terms of precision, recall and F-Score, compared to the alreadyhigh detection efficiency of T0, while at the same time a remarkable reduction of the needed processingtime had been achieved by utilizing GPU-based parallel processing. This reduction made the algorithm4 times faster than T0, and thus capable (3 times faster) of real-time processing.
The next version of the shot segmentation algorithm (denoted as T2 in the sequel) occurred afterreplacing the extraction and matching of SURF descriptors, by the extraction and matching or ORBdescriptors. This modification led to further minor improvement of the detection accuracy, keeping thealgorithm’s time performance at the same levels.
Aiming to handle gradual transitions (which is the most tricky for a shot segmentation algorithm todetect) in a more effective way, we extended T2 by integrating two detectors that were dedicated tothe identification of dissolves and wipes. This extension led to a newer version of the shot segmenta-tion algorithm (denoted as T3 in the sequel), which was further improved the detection accuracy of T2,achieving over 30% better performance, in terms of F-Score, at the detection of gradual transitions.
Finally, motivated by the goal for even faster processing we tried to accelerate the sequential pair-wise frame similarity evaluation, which is the most time consuming part and one of the core elementsof the algorithm. For this purpose, we divided the overall volume of frames in 4 equal parts, whereeach part includes consecutive frames of the video and is overlapping in 1 frame with the next one.These parts are analyzed by 4 different threads that run in parallel by utilizing the multi-threading/multi-
c© LinkedTV Consortium, 2014 14/62

Visual, text and audio information analysis for hypervideo, final release D1.4
processing operations supported by the Intel OpenMP 6 and Thread Building Block 7 runtime libraries.This, in combination with the replacement of the GPU-based extraction and matching of ORB descrip-tors by CPU-based processing (the CPU-based implementation of ORB descriptor in version 2.4.7 of theOpenCV library 8 exhibited much more faster performance then the GPU-based one, on the machinesthat were used for the development of these algorithms) resulted in the final and utilized version of theshot segmentation algorithm (denoted as T4 in the sequel; this is the complete algorithm described indetail in Section 2.2 above). The applied changes led to further significant reduction of the neededprocessing time, making the T4 algorithm at least 2 times faster, compared to T3.
All this progress is described in details, by the experimental results that are reported in the followingsection of the deliverable.
2.3 Experimental evaluation and comparisonsThe experiments were conducted on a PC with an Intel i7 processor at 3.4 GHz, 8 GB of RAM and aCUDA-enabled NVIDIA GeForce GTX560 graphics card. The employed dataset was a collection of 15videos from three different categories: i) 151 min. of news shows from the German public broadcasterRBB9, ii) 140 min. from a cultural heritage show of the Dutch public broadcaster AVRO10, called “An-tiques Roadshow”, and iii) 140 min. of videos from the archive of the Netherlands Institute for Soundand Vision11.
Ground-truth segmentation of the employed video dataset was created by human annotation of theshot boundaries. Overall, our dataset contains 3647 shot transitions, where 3216 of them are abruptand the remaining 431 are gradual. For each one of the tested approaches we counted the numberof correct detections, misdetections and false alarms and expressed them in terms of Precision, Recalland F-Score. Time efficiency was evaluated by expressing the required processing time as a factor ofreal-time processing, i.e., comparing these times with the actual duration of the processed videos (afactor below 1 indicates faster-than-real-time processing).
The performance of the utilized shot segmentation approach T4, concerning both the detection ac-curacy and the time efficiency, was evaluated and compared against the performance of techniques T0to T3, while in addition our experiments included a technique similar to the method proposed in [LK13],using SIFT descriptors, dense sampling and a predefined codebook of 1K visual words, (denoted as T5in the sequel), and an extension of the previous technique, also presented in [LK13], combining SIFTdescriptors, dense sampling, a predefined codebook of 1K visual words and RGB color histograms,(denoted as T6 in the sequel). The experimental results are summarized in Table 1.
Table 1: Experimental results for the considered techniques.Technique Precision Recall F-Score Processing Time
(x Real-Time)T0 [TMK08] 0.860 0.906 0.882 1.254T1 [AM14] 0.887 0.917 0.902 0.297
T2 0.913 0.910 0.912 0.292T3 0.939 0.931 0.935 0.295T4 0.943 0.941 0.942 0.135
T5 [LK13] 0.745 0.469 0.576 2 (as reported in [LK13])T6 [LK13] 0.919 0.377 0.535 2 (as reported in [LK13])
This table illustrates the progress made step-by-step during the previous year in LinkedTV regardingvideo shot segmentation analysis. Aiming each time at further improvement we constantly made someprogress, resulting to a technique which compared to the previous shot segmentation algorithm reportedin Section 2.2 of D1.2, is considerable better in terms of detection accuracy and is remarkably faster(seven times faster than real time processing). As can be seen, the utilized in the LinkedTV projecttechnique T4 (highlighted in bold in Table 1), surpasses the previously used or developed techniques
6http://openmp.org/wp/7https://www.threadingbuildingblocks.org/8http://opencv.org/9http://www.rbb-online.de
10http://avro.nl11http://www.beeldengeluid.nl
c© LinkedTV Consortium, 2014 15/62

Visual, text and audio information analysis for hypervideo, final release D1.4
T0 to T3, showing considerably better performance in terms of precision, recall and F-score. Moreover,this algorithm clearly outperforms the other tested methods T5 and T6 that rely on the use of SIFT localdescriptors. As shown in Table 1, these techniques exhibit similar precision scores for significantly lowerrecall scores, which is consistent with the findings of [LK13].
Regarding the time performance, the running time of T4 is almost 9 times faster than the previouslyused shot segmentation algorithm T0 (D1.2). The difference between these techniques is reasonablesince the method in [TMK08] employs visual features that introduce higher computational complexity,compared to the calculation of HSV histograms and ORB descriptors, while the detection of shot bound-aries via SVM classifiers is more time consuming compared to simple tests with predefined thresholds.Moreover, by using CPU-based processing in combination with multi-threading/multi-processing tech-niques for parallelizing the computing of the most computationally intensive part of the algorithm weachieve significant gains, even compared to the GPU-based implementations T1 to T3, as shown in thelast column of Table 1 (over 2 times faster processing). Concerning the other methods, the reportedtime in [LK13] is half of the video’s frame-rate, which means twice the video’s duration. This is explainedby the fact that the calculation of SIFT descriptors over a dense pixel-grid and their assignment to acodebook, as in [LK13], require significant amounts of computations.
2.4 DiscussionHaving already available the shot segmentation algorithm described in Section 2.2 of D1.2, which hasshown remarkably good performance, in terms of detection accuracy, in the experiments reported inSection 2.3 of D1.2, our main concern was to improve the time performance of the algorithm, aiming atfaster-than-real-time-processing. This goal was set by the fact that real-time (or even faster) processingof video content was considered as one of the core demands for supporting effectively the video analysisand enrichment operations that take place at the video editing phase.
Motivated by this goal we developed techniques that achieved processing times many times fasterthan real-time processing using either GPU-based parallel computing or CPU-based multi-threading op-erations. Simultaneously, each time we aimed to improve the detection performance of the shot segmen-tation algorithm via integrating specific criteria and techniques that address efficiently the challengingtask of gradual transition detection. The result of these efforts is the shot segmentation algorithm thatwas described in Section 2.2. Moreover, the experiments reported in Section 2.3 is strong evidence ofthe significant progress that were made on this field during the last year in the project.
The developed approach represents the current state-of-the-art. However, an open research direc-tion around the developed shot segmentation algorithm would be to think of a way for extracting anddescribing information hidden in the motion flow of the video. The exploitation of such information wouldenable the extinction of the remaining few false alarms due to object and/or camera movement, lead-ing to detection accuracy near to 100%. On this other side, a challenging task is to test how the timeefficiency will be affected by this and what is finally the best balance that can be achieved betweendetection accuracy and time performance.
3 Chapter segmentation
3.1 Problem statement and brief overview of the state of the artOne of the most challenging tasks of video analysis is the identification of the story-telling parts of thevideo, i.e., semantically coherent temporal segments covering either a single event or several relatedevents taking place in parallel. The relevant literature describes this problem as video scene segmenta-tion, while adopting it to the characteristics of the multimedia content related to the LinkedTV scenarios,we refer to this higher-level temporal decomposition as topic or chapter segmentation.
Primarily, video scene segmentation builds upon the output of video shot segmentation, performedeither automatically (e.g., using one of the techniques discussed in Section 2.1) or manually, by groupingthe defined shot segments into scenes, according to the semantic similarity of shots. Several methodshave been introduced for performing this task, relying either on the visual stream only, or on the combi-nation of different modalities of the multimedia content, such as the audio stream or the video subtitles.
A category of techniques for scene segmentation includes graph-based methods, where the tempo-ral links between shots are represented using graphs and scene segmentation is performed by applyingsome graph partitioning method. Such an approach has been introduced in [YYL98]. The proposedScene Transition Graph (STG) algorithm groups similar shots based on their similarity and a set of
c© LinkedTV Consortium, 2014 16/62

Visual, text and audio information analysis for hypervideo, final release D1.4
temporal constraints, where the similarity is assessed by computing the visual resemblance betweenextracted keyframes for each shot. The created sets of shots form the nodes of a graph, while thetemporal connections between the nodes of the graph (i.e., between pairs of shots from individualgroups) are represented by the edges of the graph. The result of this procedure is a directed graph,where the scene boundaries of the video are defined by finding the cut edges of the graph. Similarapproaches that rely on graph representations of the shot level segmentation of the video were alsoproposed in [RS05], [NMZ05] and [ZWW+07].
Methods that evaluate the inter-shot similarity and perform scene segmentation by applying differentsegmentation strategies have been also proposed. In [CKL09] the visual content of each keyframeis represented by utilizing two local descriptors (SIFT [Low04] and Contrast Context Histogram (CCH)[HCC06]). The extracted descriptor vectors are then clustered into k groups that correspond to the k“words” of a pre-defined vocabulary of visual words, forming a “bag-of-words” representation for eachkeyframe. Finally a histogram of “words” is created for the video, and the scene boundaries of the videoare defined by applying a temporal smoothing strategy that is based on a gaussian smoothing kernel,similar to the approach presented in [LMD07]. In [ZL09] scene segments are shaped by evaluatingthe spatio-temporal coherence of the video shots, based on a temporal constraint and the difference inactivity between keyframes from different shots, measured by the inter-frame correlation. Alternatively,in [RS03] a two-pass algorithm was proposed; in the first step, potential scene boundaries are definedby grouping shots based on the Backward Shot Coherence (BSC) metric, while in the second stepa function, called scene dynamics (SD), that considers the shot length and the motion content in thepotential scenes is measured. Based on the output of this function, a scene merging criteria is appliedin order to filter weak candidates, forming the final output of the algorithm.
Another approach is the hierarchical method of [HLZ04], which merges the most similar adjacentshots step-by-step into scenes, using as similarity measure the intersection of HSV color histogramsand a stop condition based either on a similarity threshold or to the final scene numbers, while anun-supervised clustering algorithm that combines multi-resolution analysis and Haar wavelet transfor-mations was introduced [LZ07]. Moreover, methods that rely on statistical analysis and perform sceneboundary detection using the Markov Chain Monte Carlo (MCMC) technique, the Hidden Markov Mod-els (HMM) and the Gaussian Mixture Models (GMM) were proposed in [ZS06], [XXC+04] and [LLT04]respectively.
Besides the approaches reported above, multimodal techniques that also exploit information ex-tracted from the audio channel were described. Such an approach was introduced in [SMK+11], wherethe authors developed a Generalized STG (GSTG) approach that jointly exploits low-level and high-levelfeatures automatically extracted from the visual and the auditory channel, using a probabilistic frame-work that alleviates the need for manual STG parameter selection. The GSTG algorithm is utilizedby the method proposed in [Bre12], where, besides color histograms, semantic information extractedfrom a speaker diarization and a speech recognition method is also incorporated in the framework,by applying various kinds of fusion. Following a different strategy, the algorithm in [CMPP08] groupsshots into scenes based on the analysis of visual and audio attentive features, where visual attention iscomputed by extracting the salient regions from the video keyframes and analyzing the created trajecto-ries of these regions between successive keyframes of the video, and audio attention is described andmeasured based on the audio background. Other audio-visual-based approaches have been proposedin [CTKO03], [KCK+04], [WDL+08] and [VNH03].
For a more detailed overview of the state-of-the-art techniques for scene segmentation, the readeris referred to Section 3.2 of D1.1.
3.2 LinkedTV approachThree different techniques have been developed in the scope of LinkedTV; the first is a generic multi-modal topic segmentation approach that relies on visual, audio and text analysis; the second is a chaptersegmentation approach that exploit prior knowledge about the structure of the videos from the documen-tary scenario, and is based on the detection of a pre-defined “bumper” which demarcates the end of achapter; the third is a different chapter segmentation algorithm adapted to the analysis needs for thevideos from the news show scenario, which defines the different chapters based on the detection of theanchorperson and a set of rules related to the structure of the news show. Each of these methods isdescribed in details in the following subsections of the deliverable.
It should be noted that the latter two techniques presented in this section, although tuned for thecontent of the LinkedTV scenarios, can be adapted to other similar content (documentaries and news
c© LinkedTV Consortium, 2014 17/62

Visual, text and audio information analysis for hypervideo, final release D1.4
content, respectively) or other genres of video that exhibit a structure that is detectable by means ofobject re-detection or frame visual classification techniques (e.g. various sitcom shows). This adapta-tion can be achieved by specifying the exact visual cues that demarcate the transitions between videochapters, e.g. the different graphics or logos that are used as chapter ”bumpers”, while it would generallyrequire limited effort (e.g. providing to the algorithm a few images of the graphics or logos that need tobe re-detected, or re-training a specific visual classifier).
3.2.1 Generic topic segmentation algorithm
The developed topic segmentation algorithm is a multimodal approach that relies on a combination ofvisual, audio and text analysis. Specifically, the visual stream of the multimedia content is analysedby the shot segmentation algorithm described in Section 2.2, resulting in the video’s shot segmentsand a number of representative keyframes for each of these shots. The defined shots and keyframesare utilized as input to the scene segmentation method of [SMK+11]. The output of this analysis is avector of scores V(i), where i = 1...(S− 1) and S is the total number of video’s shots, that express theappropriateness of each shot boundary as being also a scene boundary. The range of these valuesis [1,P], where P is a user-defined parameter of the scene segmentation algorithm. This parameterdetermines the number of different created STGs that will be combined via the developed probabilisticframework of the algorithm, alleviating the need for manual STG parameter selection.
In parallel to the visual stream analysis, automatic speech recognition (ASR) is applied on the au-ditory channel, following the algorithm presented in Section 4.2. Following, the created transcripts areprocessed by a keyword extraction algorithm (see Section 6), aiming to identify the main concepts ortopics discussed in the multimedia content. The outcome of this audio- and text-based processing is avector of keywords, while the time information of the occurrence of each keyword in the video is alsostored. Based on this information the extracted set of keywords is divided into subsets, where eachsubset is temporally aligned to a shot of the video and includes the keywords that are lying within thiswindow. In case that no keywords were detected for a video shot, then the corresponding subset ofkeywords would be an empty one. The defined subsets of keywords are then processed in a sequentialpairwise fashion, evaluating the lexical cohesion between pairs of successive subsets and a score iscalculated for each pair of subsets, by penalizing splits that break the word coherence. The result of thisanalysis is a vector of non-normalized scores L(i), where i = 1...(S− 1), with each score representingthe suitability of a shot boundary as being a good splitting point based on the lexical cohesion.
Given the vectors of scores coming from visual and audio-text analysis, the end boundaries of thetopic segments are detected according to the following algorithm:
Given the fact that topic segments, similar to the shots segments, are non-overlapping successivevideo fragments, the starting frame of the first topic corresponds to the first frame of the video, while thestarting frame of the remaining segments is determined by the frame that follows the ending frame ofthe previous segment. This 2xK matrix that contains the starting and ending times of each defined topicsegment, expressed in frames, is the final output of the algorithm.
3.2.2 Chapter segmentation algorithm for the LinkedTV documentary scenario
A chapter segmentation method adapted to the analysis requirements and the characteristics of thevideos from the documentary scenario was also developed. This technique exploits prior knowledgeabout the structure of the videos and the editing operations that take place at the post-production stage,and segments the videos into big chapters that are temporally demarcated by the appearance of anartificially created logo, called “bumper”. This “bumper” (see Fig. 4(a)) is used for the transition betweenthe chapters of these videos, which is most commonly performed by utilizing the wipe effect (an exampleof such a transition is depicted in Fig. 4(b).
Based on this knowledge, the videos of the documentary scenario are segmented into chapters, via atwo-step procedure. Initially, the videos are segmented into shots using the shot segmentation algorithmpresented in Section 2.2, while one representative keyframe is selected for each shot. As reported inthis section, the developed method is capable of detecting both types of transitions (i.e., abrupt andgradual) with high accuracy, so the wipe transitions that include the “bumper” are identified successfully.Following, the output of the shot segmentation analysis and an instance of the utilized “bumper” are givenas input in the object re-detection algorithm described in [AMK13]. This algorithm is an improved versionof the object re-detection approach presented in Section 8.2 of D1.2. Specifically, the detection accuracywas increased by employing two artificially created instances of the object of interest, in order to enhancethe detection of extremely close (zoomed in) or extremely far (zoomed out) appearances of the object
c© LinkedTV Consortium, 2014 18/62

Visual, text and audio information analysis for hypervideo, final release D1.4
Algorithm 2 Detection of topic boundaries.Notation: S is the number of shots of the video, B(i), i = 1...(S− 1) is the vector with the detected
shot boundaries expressed in frames, V(i), i = 1...(S− 1) is the vector of scores based on visualanalysis, Vn(i), i = 1...(S− 1) is the vector of normalized scores based on visual analysis, L(i),i = 1...(S−1) is the vector of scores based on audio-text analysis, Ln(i), i = 1...(S−1) is the vector ofnormalized scores based on audio-text analysis, F(i), i = 1...(S−1) is the created vector after fusingthe normalized scores, T h is the lower threshold that indicates the existence of a topic boundary,T( j), j = 1...K is the vector with the defined topic boundaries, and K is the number of detectedtopics.
Input: The vectors of scores V(i) and L(i).Ensure: The topic boundaries of the video T( j).
1: Load V(i) and compute Vn(i) by normalizing the computed scores in the range [0,1] as:for i = 1→ (S−1)
Vn(i) = mathb fV (i)max(mathb fV )
2: Load L(i) and compute Ln(i) by normalizing the computed scores in the range [0,1] as:for i = 1→ (S−1)
Ln(i) = mathb f L(i)max(mathb f L)
3: Calculate F(i) as:for i = 1→ (S−1)
F(i) = 0.5∗mathb fV n(i)+0.5∗mathb f Ln(i)4: Define the number of topic segments K, by applying the formula: K = 2.69∗S0.43
5: Define the lower threshold T h by sorting the values of F(i) in decreasing order and selecting the Kthvalue of the sorted list of scores
6: Define the vector with the topic boundaries expressed in frames T( j) as:Set j = 1for i = 1→ (S−1)
if F(i)≥ T h then T( j) = B(i) and j = j+1Set T(K) = B(S)
in the video frames. Time efficiency was improved by replacing the CPU-based processing of the mosttime consuming parts of the analysis (i.e., local feature description and matching) by GPU-based parallelcomputing, while the exploitation of prior knowledge about the structure of the video extracted by theshot segmentation analysis, allowed the replacement of the sequential analysis of the video framesby a more efficient frame sampling strategy that led in a further remarkable reduction of the neededprocessing time. In total, the new object re-detection approach proposed in [AMK13] showed slightlybetter performance than the initial implementation that was included in the first release of analysis toolsfor hyperlinking, achieving higher levels of detection accuracy (99.9% Precision, 87.2% Recall and 0.931F-Score), while at the same time is 40 times faster, being capable for faster-than-real-time processing(the needed time is 0.10 x real-time).
The outcome of this two-step analysis is a vector with the shots that include the re-detected “bumpers”.These shots, and more specifically their ending frames, define the ending boundaries of the detectedchapters of these videos. Similarly to the topic segments, the chapter segments are non-overlappingconsecutive fragments of the video, which means that the starting frame of a chapter is the very nextof the ending frame of the previous chapter. Moreover, for each defined chapter segment five repre-sentative keyframes, that can be used as visual overview of the chapter, are extracted by applying thekeyframe extraction approach described in Section 3.2.4. So, the final output of the developed chaptersegmentation approach is composed by a 7xK matrix (with K being the number of detected chapters),where the first two columns correspond to the starting and ending times of the chapters (expressed inframes) and the following five columns include the frames that were selected as keyframes for each oneof the defined chapters.
3.2.3 Topic segmentation algorithm for the LinkedTV news scenario
Following a similar strategy with the implementation of the chapter segmentation algorithm for the doc-umentary scenario and based on human observation, we defined the visual cues and a set of rulesthat can be used for detecting the different structural parts of the videos from the LinkedTV news showscenario (which revolves around RBB news videos). The developed approach relies on the output of the
c© LinkedTV Consortium, 2014 19/62

Visual, text and audio information analysis for hypervideo, final release D1.4
(a) The used “bumper”. (b) Wipe shot transition using the “bumper”.
Figure 4: The “bumper” that is used for denoting chapter transitions in the videos of the documentaryscenario and an example of wipe transition between shots, using the “bumper”.
shot segmentation algorithm of Section 2.2 and the detection of the news studio or the anchorperson.For this purpose we trained a set of 10 new visual classifiers that are used for the identification of videoframes that depict instances of the studio where the news show takes place, or appearances of the an-chorpersons that run the show. The utilized framework for training the visual classifiers and using themfor the detection of the news studio and the anchorpersons, is the one described in Section 4.2 of D1.2using a subset of 10 base classifiers that rely on the extraction of low level feature descriptors (SIFT,RGB-SIFT and Opponent-SIFT). Moreover, indicative samples from the positive training data are givenin Fig. 5.
Again, a two-step analysis is performed, where the first step includes the detection of the shot seg-ments of the video and the extraction of one representative keyframe per each defined shot. Then,the trained classifier, denoted as “RBB Studio Anchorperson” classifier in the sequel, is applied on theextracted keyframes identifying the shots that include either an instance of the news show studio or oneof the news show moderators. The result of this procedure is a binary vector of size S (with S being thenumber of detected shots) where an element of this vector with value 0 means that the correspondingshot does not contain any instance of the news studio or any of the anchorpersons, while an elementof this vector with value 1 indicates that the corresponding shot includes a detected occurrence of thestudio or one of the anchorpersons. This vector undergoes further processing, where some restrictionsand rules related to the structure of the news show are applied, in order to identify pairs or groups ofsuccessive shots with value 1 (i.e., with detected instances of the studio or the anchorperson) that ei-ther have to be merged into one (e.g., when there is a distant shot of the studio followed by a close-upinstance of the anchorperson) or must be considered as parts of the same segment (e.g., when there isa dialogue between the anchorperson and a guest in the studio), concluding to the final set of shots thatcompose the ending boundaries of the detected topic segments.
Similarly to the algorithm of the documentary scenario, a 7xK matrix is formed, containing the startingand ending times and a set of 5 representative keyframes for each topic. This matrix is the final outcomeof the developed topic segmentation technique for the videos of the LinkedTV news show scenario.
3.2.4 Keyframe selection
By grouping shots into chapters or topics, using one of the approaches presented in the previous sec-tions, a large number of keyframes become available for each chapter/topic (all keyframes of the cor-responding shots). Aiming to provide a number of representative images that could be used as a briefoverview of events that take place, either at the video level or at the more detailed chapter/topic level, weextract for each chapter/topic a small number of most representative ones, by clustering the completeset of available keyframes for the video or chapter/topic.
In order to avoid including keyframes with degraded visual content in chapters representation weperform image blur detection as a filtering step before clustering. Our image partial blur assessmentapproach presented in [MM14], exploits the information derived from the frequency spectrum of an im-age/keyframe. The original image is partitioned into 9 equal blocks according to the rule of thirds. Subse-quently, the Fourier transform of the entire image and each of the 9 image patches is computed in orderto extract the appropriate information about their frequency distribution. We achieve the quantification ofhigh frequencies distribution by subdividing the frequency amplitude according to the following ranges:
c© LinkedTV Consortium, 2014 20/62

Visual, text and audio information analysis for hypervideo, final release D1.4
Figure 5: Indicative samples from the positive set that was used for training the “RBB Studio Anhorper-son” visual classifier.
[1, 100], [100, 150], [150, 200], [200, 300] and [300, max] and calculating this frequency histogram foreach of the ten “images” (initial image, 9 image patches). Finally, all the aforementioned histogram binsare concatenated in a vector which serves as the input to an SVM classifier which provides a confidencevalue indicating the probability of an image being blurred. Thus, taking into account the blur confidencescore we remove the blurred keyframes so as not to be included in the final clustering process.
Following this filtering step, our keyframe selection algorithm takes as input the set of the remainingkeyframes for a video chapter, and represents each one of them by extracting a low-level feature vector(e.g., HSV histogram). In [PM14] we experimented with high level visual concepts instead of using low-level features, but while in image collections the visual concepts give better results, in video keyframesbelonging to a single cluster (where several keyframes are very similar), low-level features seem towork better. The K-means algorithm is then utilized for grouping the extracted feature vectors from thekeyframes of each chapter, into a pre-specified number of clusters, while the keyframe with the featurevector that is closest to the center of each defined cluster is the selected one. The maximum number ofkeyframes that can be selected as representatives for each chapter is set to 5, however in case that thenumber of keyframes for a chapter is less than 5 (either from the output of the filtering described aboveor due to a small number of shots that compose the chapter) then all the available keyframes for thischapter are selected by the algorithm.
3.2.5 Advances in comparison to previous versions
The first scene segmentation algorithm that was evaluated for its performance using content from theLinkedTV documentary scenario is the one introduced in [SMK+11]. Based on the findings of thisevaluation, and as reported in Section 3.6 of D1.1, the performance of this method was limited, sinceroughly half of the scenes detected were deemed unnecessary by the annotators.
The first release of WP1 tools did not include any segmentation method for the creation of videofragments in a level higher than the shot level. However, based on a variety of experiments conductedduring the second year in the project and discussions with the content providers about the analysisrequirements, it was more than obvious that the shot segmentation alone was not enough, since thecreated fragments were judged as too fine-grained for use in hyperlinking as, e.g., the end-points ofhyperlinks. For this purpose, we developed the chapter segmentation algorithms that are aligned to thespecific analysis needs of each LinkedTV scenario, while moreover we combined all the different modal-ities of the multimedia content (i.e., visual, audio and text data), building a generic topic segmentationalgorithm that is applicable to any kind of content.
c© LinkedTV Consortium, 2014 21/62

Visual, text and audio information analysis for hypervideo, final release D1.4
3.3 Experimental evaluation and comparisonsThe developed chapter segmentation algorithm for the videos of the LinkedTV documentary scenarioperformed excellently, building on the high detection accuracy of the utilized object re-detection com-ponent. The experimental dataset composed by 70 videos from the documentary scenario, having 513chapter segments in total. The ground-truth for this dataset was created based on human observation.Based on the conducted experiments, the algorithm achieved 100% accuracy, both in terms of precisionand recall, identifying correctly all shots that included the predefined “bumper” and demarcating suc-cessfully all the chapter segments of these videos. Regarding the time performance of the algorithm,the employed object re-detection analysis module is extremely fast, as mentioned in Section 3.2.2, re-quiring processing time around 10% of the video’s total duration. This in combination with the timeefficiency of the shot segmentation module reported in Section 2.3 (running time 13,5% of the video’sduration), allow the overall algorithm to run 4 times faster than real-time processing.
Similar performance, in terms of detection accuracy, was exhibited by the topic segmentation algo-rithm for the content of the news show scenario. The efficiency of this approach was tested using acollection of 40 videos from this scenario, composed by 524 topic segments that were also defined viahuman observation. The accuracy of the algorithm in terms of recall score was measured 96.5%, whilea small number of false alarms resulted in precision score 97.7%. This great performance is due to thedetection efficiency of the set of trained visual concept classifiers, however, the needed time for thisanalysis is about 8.5 times of the video’s duration. This considerable requirement in processing time isexplained by the fact that the decision about the existence/in-existence of specific high-level concepts(such as the news studio or the different moderators of the show) in the visual content of the videokeyframes by utilizing trained visual concept detectors, is much more challenging and computationallyexpensive task, compared to the re-detection of a predefined visual pattern (e.g., the “bumper” of thedocumentary scenario) by applying image matching techniques. We are currently working on optimizingthe concept detection software and as a result of this optimization we expect to achieve significantlylower running times in the coming months.
The efficiency of the developed multimodal topic segmentation approach is being evaluated by meansof the LinkedTV participation to the Search and Hyperlinking task of the MediaEval 2014 InternationalBenchmarking activity, which is in progress. The results of this evaluation will be reported in deliverableD1.6.
3.4 DiscussionThe developed approaches for chapter/topic segmentation of content from the LinkedTV scenarios wereshown to work very well on LinkedTV content, addressing the specific LinkedTV analysis requirements.The utilized visual cues for finding the temporal boundaries of each chapter/topic in these videos aresuitable for obtaining a meaningful segmentation of these videos into story-telling parts, which is achiev-able due to the detection accuracy of the employed visual analysis components (i.e., shot segmentation,object re-detection and video concept detection). Regarding the developed multimodal topic segmen-tation approach, this is being evaluated as part of LinkedTV’s MediaEval 2014 participation, and theresults will be reported in D1.6.
4 Automatic speech recognition
4.1 Problem statement and brief overview of the state of the artAs stated in D1.2, Automatic Speech Recognition (ASR) describes the process of automatically con-verting spoken words into text. Typical large-vocabulary systems capable of recognizing conversationalspeech (as opposed to command and control applications with only relatively few possible commands)are built upon three main information sources:
Acoustic model - The acoustic model contains the statistical representation of the features extractedfrom the audio stream and phonemes or triphones, which are essentially the building blocks ofspeech.
Dictionary - The dictionary defines the set of words that can be recognized and contains the pronunci-ation alternatives, thus mapping phonemes to actual words.
c© LinkedTV Consortium, 2014 22/62

Visual, text and audio information analysis for hypervideo, final release D1.4
Input #1
Input #2
Input #3
Input #4
Output #1
Output #2
Output #3
Output #4
Output #5
Hiddenlayer #1
Hiddenlayer #2
Inputlayer
Outputlayer
Figure 6: Example of feedforward deep neural network (two hidden layers).
Language model - The language model assigns probabilities to sequences of words (n-grams), there-fore modelling the typical use and phrases in a language.
In order to improve the performance of our automatic speech recognition system, starting from theapproach described in D1.2, we changed the underlying paradigm for both the acoustic model and thelanguage model. For the sake of completeness, we describe the relevant approaches in more detailbelow.
4.1.1 Acoustic Model
The acoustic models can be build on generatively-trained Hidden Markov Models (HMM) with state-dependent Gaussian Mixture Models (GMM), as in the HTK-Toolkit v 3.4.1 [YEG+06]. Newer approachesutilize HMMs with Deep Neural Networks (DNN). The main difference between the HMM-GMM and theHMM-DNN is that the state-dependent GMM are replaced by a multilayer perceptron (MLP) with manyhidden layers (i.e., DNN). Such systems are employed in, e.g., the KALDI toolkit [PGB+11].
The GMM-HMM approach utilizes GMM to determine how well each state of each HMM fits a frame ora short window of frames of coefficients that represent acoustic input. The DNN-HMM method evaluatesthe fit by using a feed-forward neural network that takes several frames of coefficients as input andproduces posterior probabilities of HMM states as output. The DNN technique uses multiple hiddenlayers (that is why they are called “deep”) of non-linear hidden units and a very large output layer toaccommodate the large number of HMM states because each phone is modelled by a number of differentcontext-dependent triphone HMMs.
Each hidden unit typically uses the non-linear logistic function or hyberbolic tangent function (bothwith well-behaved derivative and hence, unproblematic for training) to map its total input from the layerbelow to the output scalar. For multi-class classification, like in our case, we classify multiple triphonestates, the output unit on the output layer converts its total input into a class probability by using thesoftmax non-linearity:
p j =exp(x j)
∑k exp(xk), (6)
where k is an index over all classes.DNNs can be discriminatively trained by stochastic gradient descent by back-propagating derivatives
of a cost function that measures the discrepancy between the target outputs and the actual outputsproduced for each training case. DNNs with many hidden layers are not straight-forward to optimize.However, using generative pre-training and subsequent discriminative fine-tuning, stable results can beachieved.
After training, the DNN outputs probabilities of the form p(HMMstate|AcousticInput). To compute aViterbi alignment or forward-backward algorithm, procedures which are already successfully employedover decades in GMM-HMM ASR decoding, we require the likelihood p(AcousticInput|HMMstate). The
c© LinkedTV Consortium, 2014 23/62

Visual, text and audio information analysis for hypervideo, final release D1.4
posterior probabilities from the DNN output can be converted by dividing them by the frequencies of theHMM-states from the forced alignment derived during DNN training. Detailed information on DNN-HMMfor acoustic modeling in automatic speech recognition can be found in [HDY+12].
4.1.2 Language Model
A n-gram language model is a statistical model where the probability of observing a sentence P(w1, ...,wm)is approximated by only considering n preceding words:
P(w1, ...,wm) =m
∏i=1
P(wi|w1, ...,wi−1)≈m
∏i=1
P(wi|w1−(n−1), ...,wi−1) (7)
where the conditional probabilities are calculated from n-gram frequency counts derived from n-grammodel training. Especially for higher n-grams, estimating the amount of unseen n-grams, i.e., the n-gramcombination not encountered in training but in theory possible (especially for spontaneous speech), isan important sub-task, so that probability mass can be shifted accordingly via, e.g., linear discounting.The IRSTLM Toolkit [FBC08] provides such functionality.
A more recent approach is the Recurrent Neural Network (RNN) LM technique we use for rescoring.One possible architecture is shown in Fig. 7 and is usually called Elman network, or simple RNN. Theinput layer uses the representation of the previous word w(t) concatenated with the previous state ofthe hidden layer s(t − 1). The neurons in the hidden layer s(t) use sigmoid activation function. Theoutput layer y(t), when already trained, represents the probability distribution of the next word giventhe previous word and the state of the hidden layer in the previous time step. Training is performed bystandard stochastic gradient descent algorithm and the matrix W which represents recurrent weight istrained by the backpropagation through time algorithm (BPTT).
Figure 7: Recurrent neural network based language model [MKD+11].
Instead of using the first best hypothesis provided from the ASR system, the ASR system providesa lattice (which can also be converted to an n-best list) of hypotheses. This lattice is rescored by theRNNLM which was previously trained on a text corpus. The rescoring is performed by computing thesentence-level scores given by both n-gram and RNN model, and a subsequent weighted linear inter-polation of the log-scores given by the LMs and a final reranking of the hypotheses. For evaluationpurposes we use the likeliest hypothesis after reranking (1-best).
4.2 LinkedTV approachIn D1.2, we relied on the HMM-GMM approach for the acoustic model, but we switched to the HMM-DNNparadigm since. Since the last deliverable, we massively extended our training material by establish-ing the GER-TV1000h corpus [SSSK14], which covers slightly over 1000 hours of German broadcastspeech data recorded in 16 kHz sampling rate, single channel and stored in 16 bit PCM waveform files.We also improved the language model (LM) of the speech recognition system by using more training
c© LinkedTV Consortium, 2014 24/62

Visual, text and audio information analysis for hypervideo, final release D1.4
label description〈int〉 If an utterance contains clearly audible background noises, it is tagged
with 〈int〉. The type and volume of noise was not differentiated in thisannotation sequence.
〈spk〉 This tag denotes various speaker noises, such as breathing, throatclearing or coughing.
〈fil〉 All kinds of hesitations are labeled with this tag.〈spk change〉 If the speaker changes during the utterance, 〈spk change〉 is inserted
at the corresponding position. Using this annotation, speaker turns canbe inferred and then used for speaker-adaptive training schemes in latersteps.
〈overlap〉 If more than one speaker is talking at the same time, the utterance ismarked with this tag.
〈foreign〉 One or more foreign words, sometimes proper names but most of thetime original material with a voice-over.
〈mispron〉WORD〈mispron〉 Clearly mispronounced words are enclosed in this tag.〈reject〉 If a whole utterance can not be transcribed, it is marked with this tag.** If one or more words are unintelligible (e.g., due to background noise),
they are transcribed with **.= Word fragments are transcribed and end with =, marking them as in-
complete.
Table 2: Complete list of labels used for the annotation of the new training corpus.
data, by increasing the dictionary size, by applying more sophisticated training algorithms and by apply-ing a modern lattice hypothesis rescoring approach based on RNNs.
Speech recognition is commonly measured as the word error rate (WER), which is defined by theLevenshtein distance [Lev66] (i.e., the minimum number of substitutions, deletions, and insertions nec-essary to transform the hypothesis into the reference), divided by the reference length. An evaluation ofthe system and its configurations can be found in Section 4.3.
4.2.1 Advances in comparison to previous versions
We reported improvements to our overall architecture in: [SOA+13, SSS13, SSS13, NSS14, SSSK14].We continue to describe the individual advances in the models.
4.2.1.1 New acoustic model paradigm: deep neural networks
Now, we switched the whole architecture to the KALDI-toolkit [PGB+11], and hence, the HMM-DNNparadigm. The reason for this is two-fold: first, the development on HTK-Toolkit has been discontinuedsince March 2009 (HTK-Version 3.4.1), and second, the ASR research community reports huge gainsvia DNNs in the last few years, and Kaldi-Toolkit is able to provide these for our needs.
4.2.1.2 New training material: GER-TV1000h corpus
We collected and manually transcribed a new huge training corpus of German broadcast video material,containing 2,705 recordings with a volume of just over 900 h. The new corpus is segmented into utter-ances with a mean duration of approximately 5 seconds, yielding 662,170 utterances, and is transcribedmanually on word level. The total number of running words is 7,773,971 without taking additional an-notation into account. Individual speakers are not annotated, but speaker changes within an utteranceare marked and allow for a rough speaker adaptive training scheme. The recorded data covers a broadselection of news, interviews, talk shows and documentaries, both from television and radio contentacross several stations. In addition to the verbatim transcript, the tags in Table 2 were used to furtherdescribe the recordings.
The audio is recorded and stored in 16-bit PCM waveform files, with 16 kHz sampling frequency anda single mono channel. Utterances containing one or more annotations with 〈int〉, 〈overlap〉, 〈foreign〉,〈mispron〉, 〈reject〉, 〈**〉 or 〈=〉 were excluded for the following experiments from the clean speech train-ing data. This preselection leads together with older data sources to a training collection of 292,133utterances with a total duration of 322 h and 3,204,599 running words with 118,891 distinct types. Look-
c© LinkedTV Consortium, 2014 25/62

Visual, text and audio information analysis for hypervideo, final release D1.4
ing at the occurrences of 〈spk〉, we observe an average respiratory rate of 9 breaths per minute, and 26words per breath.
We restricted ourselves to clean speech sections. In this deliverable, we report results on up to 636hours of training, as listed in Table 3.
Training Set Duration (h) # Utterances # Words # Wordstotal unique
TS I [BSB+10] 105 119.386 997.996 62.206TS II 322 292.133 3.204.599 118.891TS III 636 529.207 5.940.193 181.638
Table 3: Training sets for acoustic modelling derived from GER-TV1000h Corpus.
4.2.1.3 N-gram language model
For the older models as in D1.2 we used a 3-gram (i.e., n-gram with n = 3 or trigram) language modelwith a dictionary size of approximately 200,000 words derived from a text corpus of approximately 30million words containing German text from different domains, e.g., news, broadcast, rss-feeds.
We noticed from file inspection that some ending variants of words were missing, and hence it wouldbe obvious to increase dictionary size. This text-corpus is naturally error prone, i.e., some words aremisspelled or do not even exist. A way to circumvent this is to only put words in the dictionary and in theLM which occur more often than or equal to a certain number count c. To be on the safe side we choosec = 5. With c = 5 we noticed that the former text corpus of 30 million words was not enough to increasethe dictionary size, so we increased the text corpus size to 85 million words of German text. We filter thetext corpus in a way that every line of text is unique in the corpus and do not occur twice, which would beredundant information. With the word count threshold of c = 5 we were able to raise the dictionary sizeto approximately 365,000 words. We further increased the complexity of the n-gram model from n = 3to n = 5 model. More complex language model naturally are more computational expensive ergo ASRdecoding takes longer time and is more memory consumptive.
Fortunately there is a way to both increase the performance of the system while approximately main-taining the computational cost. This technique is called language model pruning. After training a complexlanguage model we can prune it i.e., we delete entries of phrases (i.e., n-grams with n > 1) which arevery unlikely. Hence, phrases that have been seen very rarely in the text corpus are deleted, while thelikely phrases, those which occur often, are retained. Using that technique the pruned language modelcovers most of the important information of the unpruned model, but is significantly less complex andhence, less computational consumptive. Without going into detail, decoding with the new pruned 5-grammodel trained on 9 millions lines of text and having a dictionary size of approximately 350,000 words iseven slightly faster than the older 3-gram model.
We will also see in the evaluation section (Section 4.3) that we improve the performance of the ASRsystem significantly by applying this 5-gram model. For n-gram LM training we use IRSTLM Toolkit[FBC08].
4.2.1.4 Recurrent Neural Network Language Model
We apply RNNs for LM rescoring, which is delivered by Recurrent Neural Network Language Modeling(RNNLM) Toolkit [MKD+11]. In our case we use the text corpus with 85 million words for both n-gramand RNN LM training, so the dictionaries of the LM from both methods are consistent. In our system weset N = 20 (parameter N from N-best list) derived from empirical optimization. Using a lower number de-creases performance significantly, using a higher number only improves performance slighty but makesrescoring slow. N = 20 is also within the recommendation of the authors. We use 200 hidden units inthe hidden layer of the RNNLM. Both parameters are within the recommended range of values from theauthors.
We will see in the evaluation section (Section 4.3) that applying RNNLM rescoring improves theperformance of the ASR system. Without going into details RNNLM rescoring is fast, but memoryconsumptive when using large LM.
c© LinkedTV Consortium, 2014 26/62

Visual, text and audio information analysis for hypervideo, final release D1.4
4.3 Experimental evaluation and comparisonsAn overview of all development and evaluation sets which were used during this evaluation is givenin Table 4. For development, we use a corpus of German broadcast shows which contains a mixof planned (i.e., read news) and spontaneous (i.e., interviews) speech, for a total of 2,348 utterances(3:29 h, 33,744 words). For evaluation, we make use of clean speech segments of the DiSCo corpus asdescribed in [BSB+10], and use “planned clean speech” (0:55 h,1,364 utterances, 9,184 words) as wellas “spontaneous clean speech” (1:55 h, 2,861 utterances, 20,740 words).
Dataset Type Duration (h) # Utterances # WordsDevelopment Development 3:29 2.348 33.744DiSCo [BSB+10] planned clean 0:55 1.364 9.184DiSCo spontaneous clean 1:55 2.861 20.780LinkedTV planned 1:08 787 10.984LinkedTV spontaneous 0:44 596 8.869
Table 4: Development set and evaluation sets.
Additionally, we tested the decoding performance on content from the RBB provided to the LinkedTVproject, again separated into a planned set (1:08 h, 787 utterances, 10,984 words) and a spontaneousset (0:44 h, 596 utterances, 8,869 words).
AM LM WER [%]Dev. DiSCo DiSCo LinkedTV LinkedTV
planned spont. planned spont.GMM, 105h [BSB+10] 3g, 200k 30.2 26.4 33.5 27.0 52.5GMM, 322h 3g, 200k 29.6 24.0 31.1 26.4 50.0DNN, 322h 3g, 200k 23.9 18.4 22.6 21.2 37.6DNN, 636h 3g, 200k 22.7 17.4 21.5 19.9 35.3DNN, 636h 5g, 365k 21.6 16.3 20.6 17.3 33.0DNN, 636h 5g, 365k, RNN 20.5 15.2 18.8 15.2 30.9
Table 5: WER results of ASR system configurations on various data sets.
In Table 5 the evaluation results of the different ASR system configurations are presented. Due to theparadigm shift from HMM-GMMs to HMM-DNNs, we witnessed a massive performance boost in termsof decreased WER (6.4% absolute on LinkedTV planned data). Further, we enlarged the quantity of thetraining data to 636 hours (DNN,636h/3g,200k) and improved the word error rate (WER) of the system byapproximately 1 % absolute on the development set and the four test sets. We also improved to n-gramlanguage model, which former was a 3-gram model with a dictionary of approximately 200,000 words,to a 5-gram model with 365,000 words. This language model was pruned in a way to retain performanceand to reducing computational cost as described in 4.2.1.3. Using the 5-gram LM the performance ofthe system (DNN,636h,5g,365k) again improved by additional approximately 1 % WER. Finally we arenot using the 1-best (i.e the likeliest) hypothesis from the n-gram LM. Instead we compute a 20-besthypothesis list from n-gram LM and utilize a RNNLM to rescore the hypotheses to gain a new besthypothesis. This improves our ASR system performance again by approximately 1 % absolute WER.
4.4 DiscussionSince subsequent enrichment steps crucially depend on the quality of the ASR transcripts, considerableefforts have been conducted to boost the algorithm’s performance. All above steps (AM paradigm shift,new training data, LM improvement, RNN lattice rescoring) individually and together as well, improvedthe system by a total of 11.8% WER absolute (56.2% relative) on LinkedTV planned speech data and21.6% WER absolute (58.8% relative) on LinkedTV spontaneous speech data. We are probably able toincrease the size of the training material once more in the near future, but not all utterances were suitedfor AM training because e.g., some words are mispronounced or unintelligible or multiple speakers aretalking. We have to think if we should, and how, to smartly include these files, which we excludedfrom training in previous models. Another open point is the current dictionary, as regional variantsin pronunciation are still covered poorly. We are currently catching some artifacts by semi-automatic
c© LinkedTV Consortium, 2014 27/62

Visual, text and audio information analysis for hypervideo, final release D1.4
pronunciation entries within the dictionary itself, but on the long run more sophisticated methods, suchas automatic confusion matrices on regional data and/or linguistically based rules, should be appliedhere.
5 Speaker identification
5.1 Problem statement and overview of the state of the artSpeaker identification (SID) aims at recognizing persons based on their voice. As reported in D1.2,SID system usually employ a two-step approach. In the first step, called the enrollment, a new speakeris added to internal database and a statistical model representing the characteristical voice features isconstructed. Once this step is done, this person can be distinguished from other speakers automaticallyby scoring utterances against all available models, and normally a special “unknown speaker” model.
The models for the speakers are often based on Gaussian Mixture Models (GMMs), with featurescapturing the spectral properties of a voice via Mel-Frequency Cepstral Coefficients (MFCCs), andsometimes high-level speech information such as pronunciation variations, prosody, idiolect or char-acteristic conversational topics [RQD00, RAC+03, PNA+03, AKC+02, D+01]. Newer models are oftenutilizing the i-vector approach (e.g., [MMvL12]). Here, a speaker-dependent and channel-dependentsupervector M(s,h) of concatenated GMM means, based on the audio observation, is projected in lowdimensionality space named Total Variability space:
M(s,h) = m+Tw(s,h),
where m is a mean super-vector of a gender-dependent Universal Background Model, T Total Vari-ability matrix and w(s,h) is the resulting i-vector. The matrix is optimized so that the distance in the vectorspace is maximized for each utterance (note that each speaker’s utterance is treated separately). In asecond step, the i-vectors are treated as simple observations, and a Probabilistic Linear DiscriminantAnalysis (PLDA) is applied:
For R utterances of a speaker, collection of corresponding i-vectors denoted as {ηr : r = 1, . . . ,R}.The assumption is that the i-vectors can be decomposed as:
ηr = m+φβ +Wαr + εr
with: m global offset, φ basis for speaker-specific subspace (eigenvoices), β latent identity vector(normal distr.), W basis for channel subspace (eigenchannels), αr latent vector (normal distr.), εr residualterm (Gaussian, zero mean, diagonal covariance).
5.2 LinkedTV approachConcerning the need for speaker identification on the LinkedTV data, a limited number of importantpersons that are already known appear in the videos from the documentary scenario (i.e., the moderatorof the show and the art experts), while the focus of interest in this scenario are the presented art objectswhich can be detected using the object re-detection approach described in Section 8.2 of D1.2, giventhat the instances of these objects are available. However, the videos from the news show scenariomay contain an unlimited number of persons of interest that could be aligned to information extractedfrom the spoken content, thus making person identification far more crucial for analysing videos fromthis scenario.
5.2.1 Advances in comparison to previous versions
5.2.1.1 VideoOCR based speaker database extraction
In D1.2, we described the challenge of obtaining a reasonable person identification database for localcontext. To overcome this, we exploit the fact that for most news show, banner information is shownwhenever a specific person is interviewed.Manually checking videos of one show over the course of twomonths, it seems reasonable to assume that (a) the banner is only shown when the person is speaking,and (b) mostly – but not always – only this single person is seen in these shots. We can thus use thisinformation (extracted via optical character recognition; OCR) for speaker identification, and we couldfurther extend this to face recognition (see Fig. 8 for a graphical representation of this work flow).
c© LinkedTV Consortium, 2014 28/62

Visual, text and audio information analysis for hypervideo, final release D1.4
Video OCR
Speech Segmentation
Face Detection
Face
Recognition
Database
Speaker
Identification
Database
subtitles (if available)Automatic Speech Recognition
Keyword extractionPhonetizer
frequent words
dictionary
Figure 8: Workflow for a an automatically crawled person identification database, using news showbanner information.
5.2.1.2 i-vector paradigm
Starting with a straight-forward GMM-UBM approach in D1.2, we shifted speaker identification towardsi-vectors. Shifting from the GMM-UBM approach to the i-vector approach has two main advantages.First, i-vectors are reported to outperform the GMM-UBM approach in international benchmark activitiesin terms of accuracy and robustness (e.g., [MMvL12]). Second, the i-vectors can be stored once duringaudio processing and do not need to be recreated for retrieval, even if the speaker is unknown at creationtime. Their size (less than 100 Bytes in our setting) allow for storage in the annotation files. Further,creation does not cause time delay.
5.3 Experimental evaluation and comparisons
For the show “Brandenburg aktuell”12, we downloaded 50 videos over the course of two month, witheach of 30 minutes length. Each show contains on average around seven interviewed persons with theirname contained in the banner. Since the banner will be always at a certain position, we employ a simpleyet effective OCR heuristic using tesseract [Smi07]: we check each screen-shot made every half secondand decide that a name is found whenever the Levenshtein distance over three consecutive screen-shotsis below 2. On manually annotated 137 screen-shots, the character accuracy is at convenient 97.4%,which further improves to 98.4% when optimizing tesseract on the shows font, using a distinct trainingset of 120 screen-shots.
This was used as a first reasonable basis for a speaker identification database. To obtain the audioportions of a speaker in a news excerpt, the banner is time-aligned to the speaker clustering segment,and other segments which have been assigned to be the same speaker via un-supervised clusteringare also aligned to the same data collection. 269 instances with banner information were detected. Thelength of the spoken parts for a speaker in one show varied between 6 and 112 seconds, for an averageof 31 seconds. 32 speakers appeared in more than one video.
For the evaluation of the speaker identification, we took every speaker that appeared more than once(32 speakers total) and divided video material from two months into a 2:1 ratio for training and testing.See Fig. 9 for a Detection error tradeoff (DET) curve. The Equal Error Rate (EER) is at 10.0%. For i-vectors, we kept the experiments consistent with those from D1.2, i.e., we used a collection of speechesfrom 253 German politicians, taken from the archive of the German parliament13. In total, this consistsof 2581 files with 324 hours of training material. To make training of the models feasible, we use 2minutes per file (see Table 6). On a with-held development corpus, we determined 128 GMM mixturesto be optimal in terms of Equal Error Rate (EER), as the performance saturated after testing 16, 32, 64and 128, respectively. Eigenvoices seem to perform best at 10. The number of Eigenchannels did notseem to matter much for this material. See Table 7 for the results of the best setting.
Using this setting, we compared this i-vector approach with the GMM-UBM approach as used in D1.2in a detection-error-trade-of curve as depicted in Fig. 10. As can be seen, the i-vector/PLDA approachoutperforms our last evaluation results by roughly 30% relative, and has an EER of 5.5% (compared to8.1%). We noticed though that for such limited data with different acoustic environments, i-vectors donot necessarily surpass GMM performance [SOA+13], which is something we want to investigate furtherin the future.
12http://www.rbb-online.de/brandenburgaktuell/13webtv.bundestag.de/iptv/player/macros/bttv
c© LinkedTV Consortium, 2014 29/62

Visual, text and audio information analysis for hypervideo, final release D1.4
1
2
5
10
20
1 2 5 10 20
Miss probability (in %)
False Alarm probability (in %)
Speaker Detection Performance
Figure 9: DET curve for the speaker identification experiment on RBB material.
Table 6: Size of the German Parliament Corpus as used in the evaluation of the speaker identification.total training
# of speakers 253# of files 8166 2581total time of material [h] 889 324
Table 7: Speaker identification experiments of Equal Error Rate, on German Parliament data. 128 GMMmixtures for UBM, i-vector size of 10.φ W 1 2 3 4 5 6 7 8 9 10 11 12 13 14 15 16 17 18 19 20
1 24.8 23.8 24.5 25.5 26.5 24.5 25.2 23.5 23.8 24.9 25.4 23.8 24.1 25.7 24.9 24.8 25.0 25.0 25.0 25.3
2 15.2 14.8 16.1 15.8 15.2 16.0 15.5 15.3 15.8 14.1 16.3 16.3 16.0 15.8 16.3 16.2 15.3 15.8 16.0 15.8
3 10.7 10.0 11.9 10.4 10.5 10.9 10.4 10.4 9.9 10.2 10.7 10.4 10.9 10.4 10.9 10.6 11.2 10.4 10.4 10.4
4 9.0 8.5 9.0 8.8 8.8 8.3 9.0 9.2 9.4 9.4 9.2 9.3 9.0 9.0 9.0 9.2 9.2 9.0 9.0 9.0
5 7.8 7.0 7.5 7.8 7.5 7.3 7.5 7.3 7.6 7.7 7.5 7.5 7.5 7.8 7.8 8.0 8.0 7.8 7.5 7.7
6 6.8 6.8 6.6 7.1 7.1 6.8 7.2 7.3 7.0 6.8 7.0 6.8 7.0 7.3 6.8 7.0 7.0 6.8 7.1 6.8
7 5.9 6.1 5.8 5.9 6.3 6.1 5.8 5.9 6.4 5.8 6.1 6.0 5.9 5.9 5.8 6.0 5.8 5.8 6.0 6.0
8 5.4 5.4 5.3 5.3 5.3 5.3 5.3 5.6 5.6 5.5 5.4 5.8 5.5 5.3 5.6 5.6 5.8 5.5 5.6 5.6
9 5.1 5.3 5.3 5.1 5.1 5.1 5.3 5.1 5.1 5.1 5.6 5.1 5.6 5.3 5.3 5.3 5.3 5.4 5.3 5.3
10 4.9 4.9 4.9 4.9 4.9 4.9 4.9 4.9 4.9 4.9 4.9 4.9 4.9 4.9 4.9 4.9 4.9 4.9 4.9 4.9
11 4.9 4.9 4.9 4.9 4.9 4.9 4.9 4.9 4.9 4.9 4.9 4.9 4.9 4.9 4.9 4.9 4.9 4.9 4.9 4.9
12 4.9 6.8 4.9 26.9 49.3 4.9 7.3 4.9 5.1 6.1 4.9 5.2 4.9 9.0 24.5 35.4 4.9 5.8 7.5 28.9
13 6.1 4.9 6.8 4.9 36.2 9.7 13.9 37.9 8.7 100 100 7.3 15.5 6.3 13.1 9.5 5.6 8.5 41.7 55.8
14 6.6 27.4 4.9 7.8 24.5 50.2 5.3 5.6 11.9 7.1 5.9 32.8 9.5 44.4 10.9 13.4 9.0 8.5 44.6 4.9
15 7.6 67.0 70.4 8.2 5.1 13.3 11.7 42.8 24.3 16.8 6.0 100 7.5 19.7 5.1 7.5 32.8 7.5 9.2 22.8
16 5.5 21.4 7.5 25.2 9.3 10.9 5.1 57.5 11.7 60.9 14.6 10.4 45.6 8.7 29.4 5.8 45.9 66.1 36.7 68.9
17 100 7.0 9.4 28.1 10.4 22.1 15.8 12.4 8.0 8.0 33.0 31.3 7.5 5.9 9.9 9.7 100 100 49.0 8.7
18 47.1 10.5 7.3 7.2 100 52.0 8.5 6.3 100 6.4 22.6 7.6 40.8 22.1 22.6 6.6 10.0 100 100 100
19 11.8 34.5 10.4 25.5 15.6 21.8 8.5 7.8 51.5 10.7 27.2 11.9 23.7 12.4 18.4 100 5.2 10.0 11.2 100
20 26.0 6.8 47.8 7.5 19.5 100 25.2 9.5 13.6 13.6 100 38.6 49.5 7.7 11.6 39.1 74.8 100 31.1 100
c© LinkedTV Consortium, 2014 30/62

Visual, text and audio information analysis for hypervideo, final release D1.4
1
2
5
10
20
40
1 2 5 10 20 40
Miss probability (in %)
False Alarm probability (in %)
Speaker Detection Performance
GMM-UBM
SphereNorm-PLDA
Figure 10: Detection-error-trade-of curve for the GMM-UBM approach in comparison for the i-vector/PLDA approach for speaker identification.
5.4 DiscussionThe core speaker identification algorithm has now been updated to the latest state-of-the-art algorithm.By exploiting banner information in news shows, we are able to create a localized speaker database“from scratch” and in a multimodal fashion (i.e., by incorporating OCR). The i-vector approach makesboth inter-document speaker clustering and retrieval feasible, which is a functionality we want to tacklein the future. Further, accessing the banner information via OCR is currently optimized on a particularshow, while we might want to extend this to other media streams as well.
6 Keyword extraction
6.1 Problem statement and brief review over the state of the artVideo subtitles, automatic speech recognition transcripts and other metadata information are valuablesources of information which can better describe the storyline of the videos and their aboutness. Theproblem of understanding the aboutness of textual documents has been primarily framed as determiningthe top-K most relevant keywords in the document. However, it is a recent trend that many NLP systemsare moving towards understanding documents in terms of entities. In this section, we describe theexperimental LinkedTV approach for entity salience classification that could supersede the keywordextraction approach (described in the previous deliverable D1.2) that has been already deployed to theLinkedTV WP1 pipeline.
Currently there are many named entity recognition (NER) systems which perform entity recognition,classification and linking. However, these systems, at large, do not evaluate the actual importance ofthe entities in the documents. The task of identification of salient entities amounts to finding the setof entities which play an important role in the story described in the document. This problem has beenstudied e.g., in the two recent works [DG14, GYS+13] (the first with authors from Microsoft research, thesecond one with authors from Google) that we have drawn inspiration from for the LinkedTV experimentalapproach. In [GYS+13] the authors propose a supervised machine learning model which uses featuresderived from web logs to train the model, while [DG14] uses features derived from a coreference systemin combination with features derived from a background knowledge about the relationships betweenentities.
The most common approach for determining the level of salience of the entities is to perform a TF-IDF weighting. Similarly as in the keyword-based approach, one entity can correspond to multiple words.
c© LinkedTV Consortium, 2014 31/62

Visual, text and audio information analysis for hypervideo, final release D1.4
The advantage of the entity based representation is that multiple originally different keywords (differentsurface forms) are disambiguated to one entity URI. In our approach, we not only replace the keywordswith entities, but also try to improve on the top N TF-IDF baseline, which is deployed as the LinkedTVkeyword extraction tool, by employing a supervised machine learning model.
6.2 LinkedTV experimental approach – Entity Salience ModelThe developed LinkedTV approach utilizes a supervised machine learned model for the identification ofsalient entities. Each entity–document pair from a corpus is represented as vector of selected features.The model is trained on a dataset where each entity has one of the three following classes (following theapproach taken in [DG14]) assigned:
• Most Salient (MS) - A most prominent entity with highest focus of attention in the document.
• Less Salient (LS) - A less prominent entity with focus of attention in some parts of the document.
• Not Salient (NS) - The document is not about the entity.
For training the model we developed two sets of features: local and global. The set of features withlocal scope is derived from the information available within the document. The second set of featureswith global scope is computed using information outside the document.
6.2.1 Features with local scope
Only a limited feature set is employed by the developed algorithm, since many of the local features usedin [GYS+13] are HTML specific. However, according to the results presented in [GYS+13], the strongestsalient clues are position and the frequency of the entity, which are both present in our feature set.
Feature 1st-begin-index holds the positional index of the first occurrence of the the entity, featureentity-type holds the type of the entity, whether the entity in question is named or common entity.The entity-occurrences feature holds the total number of occurrences of the entity in the document,while the entity-mentions feature represent the total number entities mentioned in the document. Thelast feature is unique-entities which holds the number of unique entities in the document. This set offeatures is presented in Table 8.
Table 8: The features computed from information available within the document.Feature name Feature type Description
1st-begin-index numeric Begin index of the first occurrence of the entity in the doc-ument.
entity-type nominal The type of the entity: named entity, common entity.entity-occurrences numeric Number of mentions of the entity in the doc.entity-mentions numeric Total number of entity mentions in the document.unique-entities numeric Number of unique entities in the document.
6.2.2 Features with global scope
The features presented in Table 8 are of a local character and they are computed from content availablein the document. For the experiments we also built an additional set of features computed from infor-mation outside the scope of the document. For this purpose, we utilized three algorithms to computethe set of global features. Below we provide a brief description of the algorithms and the way we usedthem to compute the features. To the best of our knowledge, several of these features (esa-score andwlm-score) have not yet been reported to be used for entity salience experiments.Entity Frequency-Inverse Document Frequency. The EF–IDF adopts the common TF–IDF algorithmto perform weighting of entities instead of terms. The key difference is that the EF–IDF uses the URIsassigned to the entities when counting the occurrences of the entities, while the TF-IDF relies on thesurface forms of the terms (entities). In the evaluation we experimented with both variants.Explicit Semantic Analysis. The Explicit Semantic Analysis (ESA) is a method for computing semanticrelatedness of natural language texts [GM07]. The input documents are represented as vectors ofWikipedia concepts and the semantic similarity of two documents is computed as the cosine between
c© LinkedTV Consortium, 2014 32/62

Visual, text and audio information analysis for hypervideo, final release D1.4
the corresponding Wikipedia concept vectors. With the help of ESA we perform weighting of each entity.The ESA-based weight is computed according to the following formula:
esa-score(e) =∑ei∈D ESA(text(e), text(ei))
|D|(8)
The feature value (esa-score) is computed as the average similarity of a text describing the entity inquestion e and text describing each other entity ei, which occurs in the document. Since the entities areidentified with URIs from the DBpedia namespace, as the text for the description of the entities we usetheir short abstract (dbpedia-owl:abstract property) found in DBpedia.Wikipedia Link Measure. The Wikipedia Link-based Measure [WM08] is an approach which uses theWikipedia links structure to measure semantic relatedness of Wikipedia articles. WLM is used in asimilar way to ESA. The formula for weighting entities with WLM is as follows:
wlm-score(e) =∑ei∈D WLM(wiki page id(e),wiki page id(ei))
|D|(9)
The feature value (wlm-score) for an entity e is computed as the average of the relatedness WLMscores computed for the Wikipedia article describing the entity and the Wikipedia article of each other en-tity ei occurring in the document. The Wikipedia page ID for the entities is retrieved from the dbpedia-owl:
wikiPageID DBpedia property. The list of features with global character, computed with the algorithmsdescribed above, are presented in Table 9.
Table 9: The features computed from information available outside the scope of the documents.Feature name Feature type Description
ef-idf-score numeric The EF-IDF score of the entity in the document.wlm-score numeric The WLM based score computed for the entity in the document.esa-score numeric The ESA based score computed for the entity in the document.
6.2.3 Advances in comparison with the previous version
The existing system, described in detail in D1.2, is based on TF-IDF weighting of candidate keywords,which are noun chunks obtained with language-specific tagging. The main drawback of the existingsolution is that it outputs top n keywords from a text, where n is an externally set parameter. The genericnature of this parameter causes the system to provide keywords of varying quality depending on inputtext length. Generally, for short input texts most or even all candidate noun chunks are tagged as akeyword. On the other hand, the advantage of this approach is its unsupervised character, which helpsto maintain stable performance across a range of different corpora.
In this section, we have described the work towards an improvement of results of the LinkedTVkeyword extraction tool. The new version is based on a supervised model, which is trained on a taggedcorpora and additionally uses entities instead of keywords. Our previous keyword extraction model usestwo classes, relevant and not relevant, to classify each extracted keyword as relevant and not relevant tothe document. Using the current settings it considers the top 20 keywords with highest TF-IDF score asrelevant keywords for the document. However, in our entity salience model, we use three classes (most,less and not salient) for the classification. Therefore, in order to have comparable results, we adoptedthe keyword extraction algorithm to classify each keyword into the three classes. Half of the recognizedrelevant keywords are classified as most salient, and the other half as less salient. The not relevantkeywords are classified as not salient. Note that, there can be less than 20 keywords in the document,and this can lead to only most and less salient entities, and no not salient entities. This is one crucialdrawback of the previous keyword extraction technique.
Table 10 shows the results from the evaluation of the current keyword extraction approach and ournew Entity Salience model which is based on the local features. These results indicate that with the su-pervised model we can get an improvement for the F-Measure of nearly 82% and 30% for the accuracy.Please refer to Section 6.3 for more details about the evaluation methodology and the used dataset.
c© LinkedTV Consortium, 2014 33/62

Visual, text and audio information analysis for hypervideo, final release D1.4
Table 10: Results from the evaluation of (P)recision, (R)ecall, (F)measure and accuracy for the pureunsupervised TF-IDF based model and our trained model using K-NN classification algorithm.
Method P R F1 Accuracy
TF-IDF based 0.407 0.433 0.293 0.407Supervised K-NN with local features 0.533 0.531 0.532 0.531
6.3 Experimental evaluation and comparisons
6.3.1 Generation of an entity salience corpus
For the validation and evaluation of our approach we extended the Reuters–128 dataset14, which ispart of the N3 datasets collection [RUH+14]. The Reuters–128 dataset is an English corpus stored inthe NLP Interchange Format (NIF) and it contains 128 economic news articles. The dataset providesinformation for 880 named entities with their position in the document (beginOffset, endOffset) and a URIof a DBpedia resource identifying the entity. Since the dataset only provides information about namedentities found in the corpus, we further extended the dataset with common entities. To this end, we usedour Entityclassifier.eu NER tool, developed within the WP2, to enrich the dataset with commonentities. This resulted in additional 3551 common entities.
Furthermore, aiming to obtain a gold standard entity salience judgements we used a crowdsourcingtool to collect judgements from non-expert paid judges. For each named and common entity in theReuters–128 dataset, we collected three judgements from annotators based in 15 different countries,including English-speaking countries, such as United Kingdom, Canada and United States. We alsomanually created a set of test questions, which helped us to determine contributor’s trust score. Onlyjudgements from contributors with trust score higher than 70% were considered as trusted judgements.If the trust score of a contributor falls bellow 70%, all his/her judgements were disregarded. In total wecollected 18,058 judgements from which 14,528 we considered as “trusted” and 3,530 as “untrusted”judgements. The interannotator agreement, in cases where the annotators judgements differed, wasdetermined by the crowdsourcing tool15.
6.3.2 Experimental setup
The calculated features were used to create a training dataset composed of 1319 instances. We appliedthree machine learning algorithms: Naive Bayes (NB), k-Nearest Neighbor (k-NN) with an euclidean dis-tance function and k=1, and Support Vector Machines (SVM) with a polynomial kernel. The ground-truthwas determined based on the crowdsourcing annotation (see Subs. 6.3.1). The results were computedbased on 3-fold cross-validation.
We evaluated our approach by incrementally adding our five features starting with the 1st-begin-index
feature. We also individually evaluated each of the three features with a global character. Finally, weevaluated a model which uses the complete feature set. Our baseline is a system which predicts themajority class, less salient. The majority class baseline has precision = 0.261, recall = 0.511 andF-measure = 0.346. Table 11 reports the results for the three learners and different combination offeatures.
6.3.3 Results
The best results were achieved by the model that is based exclusively on local features and uses thek-NN classifier. This indicates that the salience of the entities is more related to the structure of thedocuments than to the overall importance of the entities within the collection (tf-idf or ef-idf scores),or a semantic similarity between the text and the entity (wlm and esa scores). For the Naive Bayesclassifier, it can be also observed that each incrementally added local feature increases the F-measure.All local features together improve the baseline approach (F-Measure 0.346) by 54%. F-Measure is thestandard way of computing the performance of entity salience algorithms. If the comparison with thebaseline algorithm is performed in terms of accuracy, then the relative improvement over the majorityclass baseline is nearly 3%.
14http://aksw.org/Projects/N3nernednif15Aggregate result is chosen based on the response with the greatest confidence, agreement is weighted by contributor trust
score
c© LinkedTV Consortium, 2014 34/62

Visual, text and audio information analysis for hypervideo, final release D1.4
Table 11: Results from the evaluation of (P)recision, (R)ecall and (F)measure for three algorithms, withdifferent feature combinations. A baseline classifier, which always predicts the majority class less salienthas P=0.261, R=0.511 and F=0.346.
Feature name SVM k-NN NBP R F1 P R F1 P R F1
Local feat.
1st-begin-index 0.410 0.510 0.371 0.454 0.447 0.448 0.454 0.532 0.441+ entity-occurrences 0.409 0.509 0.370 0.453 0.447 0.448 0.510 0.531 0.450+ entity-mentions 0.418 0.513 0.375 0.496 0.497 0.496 0.497 0.525 0.463+ unique-entities 0.418 0.513 0.367 0.506 0.506 0.506 0.516 0.535 0.506+ entity-type 0.422 0.514 0.387 0.533 0.531 0.532 0.540 0.549 0.532
Global feat.
tf-idf-score 0.261 0.511 0.346 0.508 0.540 0.511 0.405 0.431 0.397ef-idf-score 0.261 0.511 0.346 0.505 0.534 0.508 0.466 0.442 0.416wlm-score 0.261 0.511 0.346 0.398 0.458 0.405 0.261 0.511 0.346esa-score 0.261 0.511 0.346 0.393 0.466 0.394 0.376 0.508 0.375global-combined 0.261 0.511 0.346 0.485 0.496 0.488 0.464 0.422 0.387
All feat. all-combined 0.423 0.514 0.389 0.52 0.518 0.519 0.499 0.474 0.467
6.4 DiscussionOur efforts during the third year in the project were focused to a shift from understanding documents interms of keywords, to understanding them in terms of salient entities. Since our algorithmic approachwas supervised, and there was no suitable public training dataset available, we had to first create atraining dataset. We plan to release the dataset, contributing (to the best of our knowledge) with the firstpublicly available resource for training and evaluation of entity salience algorithms.
For the creation of the dataset we leveraged the tools developed within WP2, and specifically the En-tityclassifer.eu NER system, creating the loop between the two workpackages foreseen in the descriptionof work. The Entityclassifer.eu system was used to enrich the dataset with common entities, which arefurther curated by annotators. The annotation process itself was performed in a robust way: we em-ployed a commercial crowdsourcing platform where each entity was judged by three annotators fromEnglish speaking countries. The platform establishes the agreement considering also the trustfulness ofthe annotators, which derives from their performance on other tasks.
The entity salience dataset was used to train an entity salience classifier. The experimental resultsindicate that there is a significant improvement in performance compared to the previous version whichwas an unsupervised system based on TF-IDF scores. It should be noted that part of this improvementcan be attributed to the fact that the unsupervised approach is unable to produce a threshold separatingsalient and not salient entities. The entity salience model is being integrated into the Entityclassifer.euNER system. This will allow the users of the LinkedTV system not only to recognize, classify and linkentities, but also to get information about the importance of the entities within a single system.
Another research direction that we aim to follow includes the utilization of a text clustering algorithm.This algorithm would allow to cluster documents into implicit topics and use the most discriminativefeatures of each cluster as “keyword” labels, describing the documents in the cluster. For this purpose,the MCluster-Miner module, that relies on the bisecting k-means clustering algorithm, has been alreadyintegrated within the LISp-Miner data mining system 16. Based on the experimental validation of thismethod, which will be performed in conjunction with entity analysis within the scope of WP2, the textclustering functionality may be integrated, in the near future, as an optional feature of the WP1 keywordanalysis component.
7 Video concept detection
7.1 Problem statement and brief overview of the state of the artVideo concept detection (also known as semantic-level indexing or high-level feature extraction) is thetask of assigning one or more semantic concepts (e.g., sun, boat, running) to video sequences, based
16http://lispminer.vse.cz
c© LinkedTV Consortium, 2014 35/62

Visual, text and audio information analysis for hypervideo, final release D1.4
on a predefined concept list [SW09]. By exploiting this kind of information, groups of videos, as well aslinks between them, can be established, thus contributing to the vision of interactive and interlinked tele-vision. Automatically understanding the content of unconstrained video is a challenging and intensively-investigated problem, and TRECVID [PO13] is one of the most important relevant international bench-marking activities, establishing datasets that comprise several hundred hours of heterogeneous videoclips and ground-truth annotations for hundreds of concepts.
The representation of the video content for the purpose of concept detection is mainly based onthe extraction and description of visual features from a set of characteristic key-frames that are ex-tracted at shot level (i.e. each video shot is represented by one or more key-frames). Various imagefeatures have been utilized in the relevant literature, representing either global or local visual character-istics, while motion information was also considered by some techniques. The most dominant approachthough, is based on the extraction and description of local features from video keyframes (see [SMK14]),and to this direction, the local descriptors reported in D1.2 are still among the most commonly used.This brief review included descriptors such as SIFT [Low04], color extensions of SIFT (termed RGB-SIFT [VdSGS10a], Opponent-SIFT [VdSGS10a] and Colored-SIFT [AHF06]), and SURF [BETVG08],which has been proposed as a fast approximation of SIFT. For the selection of local areas of interestwithin an image many interest point detection techniques were introduced, such as the Harris-Laplacecorner detector [MS04], however, as underlined also in D1.2, the last years these approaches havebeen fully or partially replaced in many concept detection schemes by applying dense sampling on thepixel grid (i.e., selecting pixels with a predefined constant distance between them), using more than onesquare regions at different scale levels, aiming to extract many more features from the same interestpoint [BZM07], [CLVZ11].
Following the extraction of local descriptors a process known as feature encoding is applied, whichaggregates the calculated descriptor vectors into a predefined number clusters, forming a global imagerepresentation. The Bag-of-words algorithm (BoW) [Qiu02], which has been the most popular encod-ing approach in the last years [VdSSS14], [CLVZ11], has been recently replaced by Fisher vector (FV)[PSM10], Super Vector (SV) [ZYZH10] and VLAD (Vector of Locally Aggregated Descriptors) [JDSP10].These three state-of-the-art encoding methods outperform significantly the BoW approach, howeverdue to the fact that the dimensionality of the encoded vector is strongly affected by the dimensionalityof the utilized local descriptors, a dimensionality reduction method, such as PCA, may be also appliedon the vectors before and after encoding [JPD+12], making a more compact image representation priorto learning/classification operations. Finally, for learning the associations between the image repre-sentations and concept labels, algorithms reported in D1.2, such as Linear Support Vector Machines(LSVMs), Logistic Regression (LR) and kernel SVMs (preferring the histogram intersection kernel), stillrepresent the state-of-the art.
Deep learning techniques have also been recently proposed for concept detection (see for exam-ple [KSH12] and [SSF+13]). However these methods are associated with high computational cost, thusbeing not so suitable for use in LinkedTV.
7.2 LinkedTV approachMotivated by the goal for more accurate concept detection we initially experimented with a multimodalapproach that relies on the combination of information extracted from both the visual and the audio chan-nel of the multimedia content. To this end, as it will be described in Section 7.2.1, the visual conceptdetection framework presented in D1.2 is extended by a set of audio concept detectors that aim to ex-ploit information included in the spoken content of the video, which were trained using ASR transcripts.However, the conducted experiments showed that the integration of audio concept detectors can lead toonly a small improvement compared to the performance of the visual-based concept detection methoddescribed in D1.2. Based on this outcome, we subsequently directed our research efforts to the im-provement of the accuracy of the visual concept detectors. For this purpose we introduced a new set oflocal descriptors, we tested new encoding approaches and we utilized more elaborate machine learningalgorithms, as it will be discussed in Section 7.2.2. The experimental results regarding the accuracyof developed concept detection algorithm show that significant progress was made, compared to theconcept detection framework of the first release of WP1 analysis tools that was described in D1.2.
7.2.1 Combining visual and audio information for visual concept detection
As briefly discussed in Section 7.1, the developed multimodal concept detection approach exploits infor-mation extracted from both visual and audio (i.e., speech) stream, via utilizing a set of trained concept
c© LinkedTV Consortium, 2014 36/62

Visual, text and audio information analysis for hypervideo, final release D1.4
Figure 11: Meta-classification and second level linear fusion pipeline.
detectors for each modality. Specifically, the video concept detection algorithm described in Section 4.2of D1.2 was employed for analyzing the visual content of the extracted keyframes of the video, whilean audio-based concept detection approach, which is a variation of the method described in [KCN+08]and relies on the Explicit Semantic Analysis (ESA) technique [GM07], was applied on the extractedASR transcripts of the video. Since ESA estimates the relatedness between two text fragments (or twowords), it can be easily adapted for text classification. Considering that each class (in our case concept)has a textual description and that the output of ASR analysis is a document including the spoken contentof the video, we can use ESA to estimate the semantic similarity between a part of speech segment (i.e.,a fragment of the ASR transcript) and each class description. ESA gets as input an ASR fragment andthe set of concepts with their definitions, and returns a relatedness value, which expresses the Degreeof Confidence (DoC) regarding the existence of each concept in the considered text fragment.
Assuming that the number of considered concepts is N, the developed multimodal framework repre-sents the i-th shot of the video by two feature vectors xi
V and xiA where xi
V = [xi1,V ,x
i2,V , . . . ,x
iN,V ] contains
the calculated DoC scores based on visual analysis and xiA = [xi
1,A,xi2,A, . . . ,x
iN,A] includes the computed
DoC scores based on audio analysis.Moreover, motivated by the fact that, in contrary to the visual concepts that are always present in the
visual content of a keyframe (i.e., shot), the audio concepts may not occur only in a specific shot segmentbut in a broader temporal window around this shot, we perform a post-processing of the calculated DoCscores from audio analysis. Specifically, for the audio-based vector xi
A with the calculated DoC scoresfor the i-th shot of the video, we compute a new vector xi
pA by averaging the calculated audio vectors forthe shots of the video that lie within a window of ±α shots. The output vector xi
pA = 〈xi−α
A , . . . ,xiA, . . . ,x
i+α
A 〉integrates information from a wider temporal fragment composed by 2α +1 shots.
After performing this post-processing step, the sets of vectors xV and xA are fused in order to form a
c© LinkedTV Consortium, 2014 37/62

Visual, text and audio information analysis for hypervideo, final release D1.4
new set of vectors z, where zi = [zi1,z
i2, . . . ,z
iN ] includes the resulting DoC scores after fusing the corre-
sponding vectors from visual- and audio-based concept detection analysis of the i-th shot of the video. Inorder to find the best fusion strategy, three classes of late fusion techniques were originally considered:linear combination, meta-classification and second level linear fusion.
For linear combination three types of averaging were examined: arithmetic, geometric and har-monic mean. Based on human observation we concluded that every visually-based calculated DoCscore was higher than the corresponding calculated DoC scores by performing audio analysis and thepost-processing step, techniques such as choosing the maximum of individual scores or voting, cannotbe used directly without some normalization step, since the result of the fusion would always be identicalwith the dominating visual baseline (see Example 1).
Example 1. Let xiV = [0.1169,0.1657,0.07,0.134] and xi
A = [0.009,0.01,0.01,0.008] be the visual andthe audio baseline for the i-th video shot. So, the new DoC after the fusion with arithmetic meanwill be zi
arith. = [0.063,0.0878,0.04,0.071]. If the vectors are fused with harmonic or geometric mean,the results will be zi
harm. = [0.0167,0.0189,0.0175,0.0151] and zigeom. = [0.0324,0.0407,0.0265,0.0327]
respectively. Each value of zi is the new DoC of shot i for the 4 concepts.
Another class of techniques we considered for fusing the visual and audio DoCs, alternative to thelinear combination discussed above, was meta-classification techniques [LH02]. According to this ap-proach, if Oi
VA denotes the concatenation of the visual and audio vectors for the i-th shot OiVA = [xi
V , xiA],
then it can be considered as a new representation of the shot i.Another class of techniques we considered for fusing the visual and audio DoCs, alternative to the
linear combination discussed above, was meta-classification techniques [LH02]. Let OiVA denote the
concatenation of the visual and audio baselines for the shot i, OiVA = [xi
V , xiA]. This can be considered
as a new representation of shot i. Consequently, a kernel SVM or a two-class logistic regression modelis trained using a properly partitioned video shot dataset [STV11]. In this way, we train N SVMs orregression models, where each one of them corresponds to one concept. The output of each model znlies in the range [0,1] and represents the new DoC score for the corresponding concept, while the overallset of the computed scores from all trained models, forms the new vector zi for the shot i.
The result of this meta-classification analysis can be considered as the fusion between concepts,and can be seen is a new classifier [HMQ13]. The fusion of this classifier with the initial visual baselineclassifier, which is a robust one, has shown to further improve the results. So, a second level linear fusionwas performed as an additional step to the applied meta-classification approach: the new feature vectorzi produced by meta-classification is further fused with the visual baseline xi
V using an arithmetic meanaveraging strategy, in order to produce the final DoC. This meta-classification approach is visualized inFig. 11 and further explained in Example 2, while the same procedure is followed for the combination ofvisual and post-processed audio baselines.
Example 2. In case of meta-classification, after concatenation of the baselines, we have the vectorOi
VA = [0.1169,0.1657,0.07,0.134,0.009,0.01,0.01,0.008], which is the new representation of videoshot i. The vector Oi
VA is the input to 4 trained SVMs, where their outputs is 4 new DoCs zi =[0.04,0.034,0.02,0.07]. Finally, at the second level linear fusion stage, the zi and xi
V are averagedwith arithmetic mean, to produce the final DoCs [0.0785,0.0998,0.0450,0.1020].
7.2.2 Recent advances in the visual information analysis pipeline
Figure 12 shows the pipeline of the employed two-layer concept detection system. The first layer buildsmultiple independent concept detectors. The video stream is initially sampled, generating for instanceone keyframe or two visual tomographs per shot [SMK14]. Subsequently, each sample is representedusing one or more types of appropriate features (e.g., SIFT [Low04], SURF [BETVG08], ORB [RRKB11]etc.). These features are aggregated into global image descriptor vectors (e.g. using the VLAD encod-ing), which are given as input to a number of base classifiers (e.g. LR) in order to build concept detectorsthat solve the problem of associating image descriptor vectors and concept labels. Then, when a newunlabeled video shot arrives, the trained concept detectors will return confidence scores that show thebelief of each detector that the corresponding concept appears in the shot. Finally, the output from all thedifferent concept detectors and for the same concept, is fused to estimate a final score for this concept.The parameter sets that control the employed classifiers are predefined (i.e., they have been learned at
c© LinkedTV Consortium, 2014 38/62

Visual, text and audio information analysis for hypervideo, final release D1.4
Figure 12: The general pipeline of the employed concept detection system.
the classifier training stage), using similar features extracted from training data. It should be noted thatthis process is executed multiple times, independently for each one of the considered concepts that areto be detected.
In the second layer of the stacking architecture, the fused scores from the first layer are aggregated inmodel vectors and refined by two different approaches. The first approach uses a multi-label learning al-gorithm that incorporates concept correlations [MMK14]. The second approach is a temporal re-rankingmethod that re-evaluates the detection scores based on video segments as proposed in [SQ11].
The novel modules of this pipeline are:
1. The introduction of five new local descriptors: a binary local descriptor namely ORB (OrientedFAST and Rotated BRIEF) [RRKB11], which was originally proposed for similarity matching be-tween local image patches; two color extensions for SURF and ORB, inspired by the two colorextensions of SIFT [VdSGS10a], namely RGB-SIFT and Opponent-SIFT.
2. An improved way of performing Principal Component Analysis (PCA) [WF05] for feature reduc-tion, which improves the results of SIFT/SURF/ORB color extensions when combined with VLADencoding.
3. A new methodology for building concept detectors, where an ensemble of five LR models, called aBag of Models (BoMs) in the sequel, is trained for each local descriptor and each concept.
4. The introduction of multi-label classification algorithms in the second layer of the stacking architec-ture to capture label correlations.
Apart from these novelties, all other components have been built following well-known state-of-the-art approaches such as [CLVZ11] and [JPD+12]. More specifically, we use the dense SIFT descriptor,that accelerates the original SIFT descriptor, in combination with the Pyramid Histogram Of visual Words(PHOW approach) [BZM07]. PHOW is a simple modification of dense SIFT that uses more than onesquare regions at different scale levels in order to extract features. The same square regions at differ-ent scale levels of the PHOW approach are used as the image patches that were described by ORBand SURF. We calculate 128-SIFT, 128-SURF and 256-ORB grayscale descriptors; then, each colorextension of a descriptor results in a color descriptor vector three times larger than that of the corre-sponding original descriptor. All the local descriptors, except for the original ORB, are compacted (to80 dimensions for SIFT, SURF and their color extensions; and, to 256 dimensions for ORB color exten-sions) using PCA and are subsequently aggregated using the VLAD encoding. Each image is dividedinto eight regions using spatial binning and sum pooling is used to combine the encodings from differentregions. As a result of the above process, a VLAD vector of 163840 elements for SIFT or SURF andof 524288 elements for ORB is extracted for each image (by image we mean here either a keyframeor a visual tomograph). These VLAD vectors are compressed into 4000-element vectors by applyinga modification of the random projection matrix [BM01]. These reduced VLAD vectors served as inputto the Logistic Regression (LR) classifiers. Following the bagging methodology of [MMT+13], we trainfive LR classifiers per concept and per local descriptor (SIFT, ORB, RGB-ORB etc.), and combine their
c© LinkedTV Consortium, 2014 39/62

Visual, text and audio information analysis for hypervideo, final release D1.4
Figure 13: Block diagram of color SURF/ORB descriptor extraction, where d denotes the dimension ofthe original local descriptor.
output by means of late fusion (averaging). When different descriptors are combined, again late fusionis performed by averaging of the classifier output scores. In all cases, the final step of concept detectionis to refine the calculated detection scores by employing the approaches on the second layer of thestacking architecture.
Using a Binary Local Descriptor for Concept DetectionORB [RRKB11] is a binary local image detector and descriptor that presents similar discriminative
power with SIFT and SURF in image matching problems, it has similar properties such as invariance inrotation, scale and illumination, but at the same time is more compact and faster to be computed. A 256-element binary ORB vector requires 256 bits to be stored; in contrast, an integer-quantized 128-elementSIFT vector requires 1024 bits. In addition, according to [RRKB11], ORB is an order of magnitude fasterthan SURF to compute, and more than two orders of magnitude faster than SIFT. We introduce ORB inthe video concept detection in the same way as its non-binary counterparts. Specifically, let us assumethat I is a set of images and xi i = 1, ...,N are ORB descriptors extracted from I, where xi ∈ {0,1}d . N isthe total number of extracted local descriptors and d is the dimension of the ORB descriptor. From thesebinary descriptors, we generate a floating-point codebook of K visual codewords wk ∈ Rd , k = 1, ...,K.The distances between the binary ORB descriptors and the codewords are calculated by the L2 norm.Averaging is performed to update cluster centres, as in the original K-means algorithm (calculating themean of a set of vectors).
Color Extensions of Binary and Non-binary local descriptorsBased on the good results of two color extensions of SIFT, namely RGB-SIFT and Opponent-SIFT
[VdSGS10a], we use the same methodology for introducing color information to other descriptors (SURF,ORB). We have concluded that this is a methodology that can benefit different local descriptors andis therefore generally applicable. Figure 13 summarizes the process of extracting RGB-SURF, RGB-ORB, OpponentSURF and OpponentORB descriptors. Let d denote the dimension of the original localdescriptor (typically, d will be equal to 64 or 128 for SURF and 128 or 256 for ORB). Our RGB-SURF/ORB(Fig. 13:(a)) descriptors apply the original SURF or ORB descriptors directly to each of the three R, G, Bchannels and for each keypoint extract three d-element feature vectors. These are finally concatenatedinto one 3 ·d-element feature vector, which is the RGB-SURF or RGB-ORB descriptor vector. Similarly,our OpponentSURF/ORB (Fig. 13:(b)) descriptors firstly transform the initial RGB image to the opponentcolor space [VdSGS10a]. Secondly, the original SURF or ORB descriptors are applied separately toeach transformed channel and the final 3 ·d-element feature vectors are the concatenation of the threefeature vectors extracted from the three channels.
Reducing the Dimensionality of Local Color DescriptorsState-of-the-art encoding methods generate high-dimensional vectors that make difficult the train-
ing of machine learning algorithms. For example, while the BoW model generates a k-element featurevector, where k equals to the number of visual words, VLAD encoding generates a k · l-element featurevector (where l is the dimension of the local descriptor; in the case of the color extensions of descriptorsdiscussed in the previous section, l = 3 ·d). Thus, a common strategy is to apply a dimensionality reduc-tion method (mainly using PCA [WF05]) directly on the local descriptor vectors, before the construction
c© LinkedTV Consortium, 2014 40/62

Visual, text and audio information analysis for hypervideo, final release D1.4
of the VLAD vectors. Directly applying PCA to the full vector of color descriptors, as implied from pre-viously published works (e.g., [CLVZ11]; termed “typical-PCA” in the sequel), is not the only possiblesolution, and we propose a simple modification of this descriptor dimensionality reduction process thatit experimentally shown to improve the concept detection results.
PCA aims to find those directions in the data space that present high variance. When PCA is applieddirectly to the entire vector of one of the color extensions of (binary or non-binary) local descriptors,if one or two of the three color channels of the descriptor exhibit lower diversity than the others, thenthese risk being under-represented in the reduced dimensionality space. To avoid this, we propose per-forming PCA separately for each color channel and consider an equal number of principal componentsfrom each of them, to create three projection matrices that correspond to each of the three channels,instead of one projection matrix that corresponds to the complete descriptor vector. The three reducedsingle-channel descriptor vectors that can be obtained for a color descriptor using the aforementionedprojection matrices are finally concatenated in a reduced color-descriptor vector.
Learning Bags-of-modelsThe TRECVID SIN dataset consists of 346 semantic concepts where many of them either present
strong imbalance between the size of positive and negative class or/and have been annotated with a verylarge number of video shots. To deal with the class imbalance problem we select a variable proportionof positive to negative samples. This proportion ranges from 1:5 to 1:1. In addition, to use the majorityof available training examples and increase the concept detection performance we build a bag of five LRmodels for each local descriptor and each concept. Every LR model is trained with a different subsetof the training examples following a process similar to the cross validated committees method [PMD96].More details can be found in [MMT+13].
Capture concept correlationsWe introduce a second layer on the concept detection pipeline in order to capture concept correla-
tions. Our stacking architecture learns concept correlations in the second layer both from the outputsof first-layer concept detectors and by modelling correlations directly from the ground-truth annotationof a meta-level training set. More specifically, we obtain concept score predictions from the individualconcept detectors in the first layer, in order to create a model vector for each shot. These vectors forma meta-level training set, which is used to train a multi-label learning algorithm. We choose multi-labelalgorithms that explicitly consider label relationships. This is achieved by instantiating our architecturein our experiments with different second-layer algorithms that model:
• Correlations between pairs of concepts;
• Correlations among sets of more than two concepts;
• Multiple correlations in the neighbourhood of each testing instance.
7.2.3 Advances in comparison to previous versions
The current concept detection system extends the previous system described in deliverable D1.2 on thefollowing points:
• Combines the local descriptors presented in D1.2 (SIFT, RGB-SIFT, Opponent-SIFT) with newfaster descriptors (ORB, SURF and their color variants); calculates descriptors using only densesampling at different scale levels (PHOW approach [BZM07]);divides the image into eight spatialregions instead of four using spatial binning.
• Accelerates the process of feature extraction by considering GPU-based processing.
• Replaces the BoW encoding with VLAD.
• Introduces a second layer that refines the initial scores using concept correlations [MMK14] andtemporal re-ranking [SQ11].
• Trains a bag of five LR models for each local descriptor and each concept instead of a singleLSVM (employed in D1.2). This technique gives the opportunity to use the majority of the trainingexamples and increase the concept detection accuracy.
c© LinkedTV Consortium, 2014 41/62
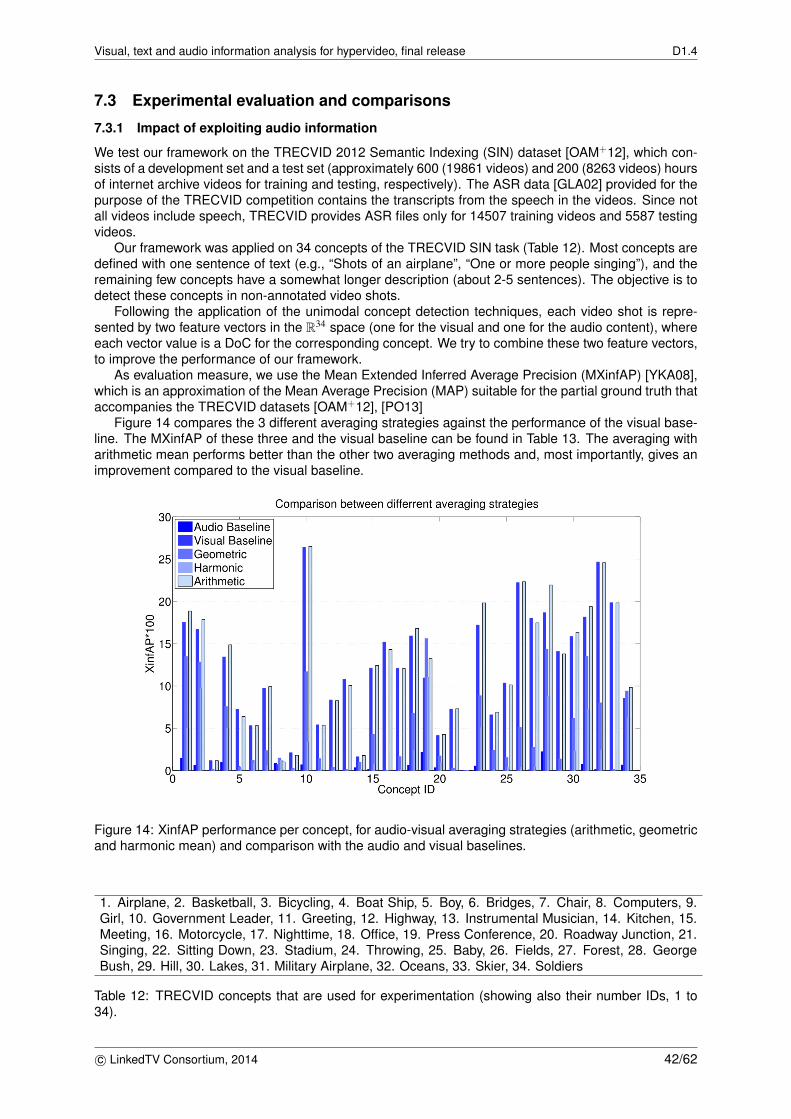
Visual, text and audio information analysis for hypervideo, final release D1.4
7.3 Experimental evaluation and comparisons
7.3.1 Impact of exploiting audio information
We test our framework on the TRECVID 2012 Semantic Indexing (SIN) dataset [OAM+12], which con-sists of a development set and a test set (approximately 600 (19861 videos) and 200 (8263 videos) hoursof internet archive videos for training and testing, respectively). The ASR data [GLA02] provided for thepurpose of the TRECVID competition contains the transcripts from the speech in the videos. Since notall videos include speech, TRECVID provides ASR files only for 14507 training videos and 5587 testingvideos.
Our framework was applied on 34 concepts of the TRECVID SIN task (Table 12). Most concepts aredefined with one sentence of text (e.g., “Shots of an airplane”, “One or more people singing”), and theremaining few concepts have a somewhat longer description (about 2-5 sentences). The objective is todetect these concepts in non-annotated video shots.
Following the application of the unimodal concept detection techniques, each video shot is repre-sented by two feature vectors in the R34 space (one for the visual and one for the audio content), whereeach vector value is a DoC for the corresponding concept. We try to combine these two feature vectors,to improve the performance of our framework.
As evaluation measure, we use the Mean Extended Inferred Average Precision (MXinfAP) [YKA08],which is an approximation of the Mean Average Precision (MAP) suitable for the partial ground truth thataccompanies the TRECVID datasets [OAM+12], [PO13]
Figure 14 compares the 3 different averaging strategies against the performance of the visual base-line. The MXinfAP of these three and the visual baseline can be found in Table 13. The averaging witharithmetic mean performs better than the other two averaging methods and, most importantly, gives animprovement compared to the visual baseline.
Figure 14: XinfAP performance per concept, for audio-visual averaging strategies (arithmetic, geometricand harmonic mean) and comparison with the audio and visual baselines.
1. Airplane, 2. Basketball, 3. Bicycling, 4. Boat Ship, 5. Boy, 6. Bridges, 7. Chair, 8. Computers, 9.Girl, 10. Government Leader, 11. Greeting, 12. Highway, 13. Instrumental Musician, 14. Kitchen, 15.Meeting, 16. Motorcycle, 17. Nighttime, 18. Office, 19. Press Conference, 20. Roadway Junction, 21.Singing, 22. Sitting Down, 23. Stadium, 24. Throwing, 25. Baby, 26. Fields, 27. Forest, 28. GeorgeBush, 29. Hill, 30. Lakes, 31. Military Airplane, 32. Oceans, 33. Skier, 34. Soldiers
Table 12: TRECVID concepts that are used for experimentation (showing also their number IDs, 1 to34).
c© LinkedTV Consortium, 2014 42/62

Visual, text and audio information analysis for hypervideo, final release D1.4
Averaging Strategy MXinfAPVisual baseline 11.75Arithmetic mean 12.16Harmonic mean 2.23Geometric mean 4.68
Table 13: MXinfAP performance for averaging fusion strategies and comparison with the visual base-lines.
kernel SVM Logistic Regression
xV OVA OV pA xV OVA OV pA
visual baseline 11.97 11.97 11.97 11.97 11.97 11.97meta-classification 12.00 13.46 13.60 12.24 12.33 12.54second level linear fusion 15.36 16.12 16.35 14.46 14.48 14.55
Table 14: MXinfAP performance for meta-classification fusion.
In the meta-classification approach, we try two different classification techniques, kernel SVM [CL11]and logistic regression [FCH+08]. For each classification technique, three different feature vectors weretested. As was mentioned, xi
V and xiA are the visual and audio baselines, xi
pA the post-processed audiobaseline and Oi
VA = [xiV ,xi
A]. So we have three feature vectors xiV , Oi
VA and OiV pA where the latter is
defined as OiV pA = [xi
V ,xipA]. These vectors are the inputs for 34 kernel SVM or logistic regression models,
which are trained in order to learn the relations between the concepts and improve the evaluation results.After the training phase the models were tested on the evaluation set producing a new set of 34 DoCfor every video shot. In the second level linear fusion, these DoCs were fused with the visual baselineusing arithmetic averaging producing the final DoC for every video shot.
Figure 15: XinfAP per concept for meta-classification for visual baseline, OVA and OV pA after the secondlevel linear fusion.
Figure 15 shows the performance of the meta-classification approach with SVM for different audiobaselines (OVA,OV pA) compared with the visual baseline. It is clear from these results that there isan improvement for the majority of concepts. However, some concepts do not benefit from the post-processing step. For example, in concepts such as basketball (id=2), boat ship (id=4), chair (id=7),fields (id=26) etc. the performance of Visual+Audio Meta is better than Visual+PostAudio Meta.
In Table 14 the overall results of every classification method are shown. We can notice that the SVM
c© LinkedTV Consortium, 2014 43/62

Visual, text and audio information analysis for hypervideo, final release D1.4
Table 15: Performance (MXinfAP %) for the different descriptors, when typical and channel-PCA fordimensionality reduction is used, compared on the TRECVID 2013 dataset. In parenthesis we show therelative improvement w.r.t. the corresponding original grayscale local descriptor for each of the SIFT,SURF and ORB color variants.
Descriptor Descriptor Keyframes, Keyframes, Boost (%) w.r.tsize in bits typical-PCA channel-PCA typical-PCA
SIFT 1024 12.74 12.74 -RGB-SIFT 3072 12.42 (-2.5%) 13.34 (+4.7%) 7.4%Opponent-SIFT 3072 12.34 (-3.1%) 13.14 (+3.1%) 6.5%SIFT combination - 17.08 (+34.1%) 17.79 (+39.6%) 4.2%SURF 1024 9.72 9.72 -RGB-SURF 3072 11.74 (+20.8%) 12.84 (+32.1%) 9.4%OpponentSURF 3072 11.61 (+19.4%) 11.80 (+21.4%) 1.6%SURF combination - 16.05 (+65.1%) 16.31 (+67.8%) 1.6%ORB 256 10.36 10.36 -RGB-ORB 768 13.02 (+25.7%) 13.58 (+31.1%) 4.3%OpponentORB 768 12.61 (+21.7%) 12.73 (+22.9%) 1.0%ORB combination - 16.58 (+60.0%) 16.80 (+62.2%) 1.3%SIFT/SURF combination - 20.03 20.34 1.5%SIFT/ORB combination - 20.40 20.75 1.7%SURF/ORB combination - 19.91 20.19 1.4%SIFT/SURF/ORB combination - 21.58 21.68 0.5%
Table 16: Performance (MXinfAP %) for different combinations of descriptors, (a)when features areextracted only from keyframes, (b) when horizontal and vertical tomographs described by SIFT, RGB-SIFT and Opponent-SIFT are also examined, (c) when the second layer is instantiated with the LabelPowerset algorithm [MMK14].
Descriptor (a) Keyframes (b) Keyframes+ (c) Keyframes+(channel-PCA) Tomographs Tomographs+LP
SIFT combination 17.79 19.78 21.04SURF combination 16.31 18.63 20.13ORB combination 16.80 18.63 19.55SIFT/SURF/ORB combination 21.68 23.53 24.72
classification performs better when it takes as input the combination of visual and post-processed audiobaselines (OV pA) (13.6%), rather than the combination of visual and audio baselines (OVA) (12.4%). Inthe second level linear fusion, there was a significant improvement of about 20.2% on top of the meta-classification’s performance and 36.6% improvement in comparison to the visual baseline. In contrast,the performance of OVA is improved by 19.8% and 34.7% compared to the meta-classification and thevisual baseline, respectively.
Using logistic regression as a classification method instead of SVM still resulted in an improvementcompared to the baselines, but this improvement is lower than that gained when using SVM. Morespecifically, the improvement from the visual baseline was 3% for the OVA and 4.7% for the OV pA. Afterthe second level linear fusion the final improvement for the OVA was 17.4% from the meta-classificationand 21% from the visual baseline, and for OV pA, the improvement was 16% and 21.6% from meta-clas-sification and visual baseline performance respectively.
7.3.2 Extended visual analysis pipeline
Our experiments were performed on the TRECVID 2013 Semantic Indexing (SIN) dataset [PO13], whichconsists of a development set and a test set (approximately 800 and 200 hours of internet archive videosfor training and testing, respectively). We evaluate our system on the test set using the 38 concepts thatwere evaluated as part of the TRECVID 2013 SIN Task, and we follow the TRECVID methodology forthe evaluation of the results [PO13]. Tables 15 and 16 present the results of our experiments in termsof Mean Extended Inferred Average Precision (MXinfAP) [YKA08]. In all experiments we train a BoMsas described in Section 7.2.2. In all cases, the final step of concept detection is to refine the calculateddetection scores by employing the re-ranking method proposed in [SQ11].
In Table 15 we evaluate the different local descriptors and their color extensions presented in Section7.2.2, as well as combinations of them. First, from the comparison of the original ORB descriptor withthe other two non-binary descriptors (SIFT, SURF), we can see that ORB performs similarly to its non-binary counterparts, producing concept detection results that are a bit worse than those of SIFT butbetter than those of SURF. This similar performance is achieved despite ORB and its extensions beingmuch more compact than SIFT and SURF, as seen in the second column of Table 15. Subsequently,concerning the methodology for introducing color information to local descriptors, we can see that the
c© LinkedTV Consortium, 2014 44/62

Visual, text and audio information analysis for hypervideo, final release D1.4
combination of the two known color SIFT variants that we examine with the original SIFT descriptor(“SIFT combination” in Table 15) outperforms the original SIFT descriptor by 34.1% (39.6% for channel-PCA). The similar combinations of the SURF color variants with the original SURF descriptor, and ofthe color variants of ORB with the original ORB descriptor, are shown in Table 15 to outperform theoriginal SURF and ORB by 65.1% and 60.0%, respectively (which increase to 67.8% and 62.2% forchannel-PCA). These results show that the relatively straightforward way we used for introducing colorinformation to SURF and ORB, based on the similar SIFT extensions, is in fact generally applicable toheterogeneous local descriptors.
Aiming to analyze the influence of PCA on the vectors of local color descriptors, we also comparedin Table 15 the channel-PCA of Section 7.2.2 with the typical approach of applying PCA directly on theentire color descriptor vector. In both cases PCA was applied before the VLAD encoding, and in applyingchannel-PCA we kept the same number of principal components from each color channel. Accordingto the relative improvement figures reported in the last column of Table 15, performing the proposedchannel-PCA always improves the concept detection results, compared to the typical-PCA alternative,irrespective of the employed local descriptor or combination of descriptors.
Another observation of Table 15 is that the concept detection performance increases when pairs of lo-cal descriptors (including their color extensions) are combined (e.g., SIFT/SURF combination, SIFT/ORBcombination and SURF/ORB combination), which shows a complementarity in the information that thedifferent local descriptors capture. The best overall results among the experiments of Table 15 areachieved when all the local descriptors and their color variants are combined, reaching a MXinfAP of21.68%.
In Table 16 we report experiments for the second layer of the stacking architecture that exploits theconcept correlations and refines the initial first-layer scores. Specifically, we instantiate the second layerof our stacking architecture with the Label Powerset algorithm [MMK14]. In all experiments of this table,for the color variants of SIFT, SURF and ORB, channel-PCA was used. Before applying the secondlayer learning we further improve the performance of our baseline system by using video tomographs[SMK14], which was a technique presented in D1.2 (for simplicity these are described using only SIFTand its two color extensions). The results of Table 16 indicate that considering the correlations amongconcepts (through LP) can give an additional 5.1% relative improvement with respect to the first layerindependent concept detectors (MXinfAP increased from 23.53 to 24.72). The interested reader canrefer to [MMK14] for an extensive comparison of second layer multi-label learning methods that captureconcept correlations.
Finally, we compared the new video concept detection system with the previous system presentedin D1.2. A relative boost of 50.7% is presented (MXinfAP increasing from 16.4 to 24.72). Our previoussystem was evaluated on the TRECVID 2012 SIN dataset and 46 semantic concepts. Some of theconcepts are common with the 38 concepts evaluated as part of the TRECVID 2013 SIN task. Thetwo systems were evaluated on different datasets although, these results are comparable as the twodatasets are similar to size and constructed by similar videos. As a result this increase of conceptdetection accuracy can be considered as significant.
7.4 DiscussionBased on the results of these experiments, we conclude that the state-of-the-art VLAD encoding in com-bination with binary and non-binary local descriptors can increase the concept detection performance.Also, the combination of visual and audio content can give a boost to the visual concept detection sys-tem but it can not outperform the performance of the new extended visual analysis pipeline that wasdescribed above. Possible future directions for improving the image representations are to considermore binary local descriptors, and better feature encodings (e.g., introducing spatial information in theVLAD encoding).
8 Video event detection
8.1 Problem statement and brief overview of the state of the artVideo event detection is the process of augmenting the concept-level annotations of a video, generatedvia the processes described in the previous section, with additional annotations (labels) that howevercapture and express even higher-level semantics of the content, such as interactions between peopleand objects, or complex situations. This is a very challenging task that has been receiving increasing
c© LinkedTV Consortium, 2014 45/62

Visual, text and audio information analysis for hypervideo, final release D1.4
attention in the last few years. One major effort towards this direction is the annual multimedia eventdetection (MED) task initiated by NIST TRECVID in 2010 [PO13]. In this task a large-scale video datasetis provided for training and evaluating different event detection approaches. Despite the large progressduring the last years, the automatic detection of events in unconstrained videos remains a very challeng-ing problem due to the complexity and variability of real-world events and the computational difficultiesassociated with processing large-scale video collections. To deal with these problems, most event de-tection approaches extract a rich set of low-level features (visual and/or audio, static and/or dynamic,etc.) in order to generate an informative video content representation. For each feature type a baseevent classifier is then created, and the different classifiers are combined utilizing an appropriate fusionscheme [JBCS13, SN13, OVS13]. For instance, in [SN13], motion features (STIP, DT) are extracted,Fisher vector (FV) encoding is applied to represent a video signal, and KSVMs with Gaussian radialbasis function (RBF) kernel are used to build the event detectors. Experimental results in a subset ofthe MED 2012 dataset containing 25 events showed that FV-based representation provides superiorperformance in comparison to the Bag-of-Words-based (BoW) one. The same subset of MED 2012 isused in [OVS13] to evaluate the algorithm proposed there, which exploits a compact set of low-levelfeatures (SIFT, MBH and MFCC), FV encoding, power normalization (which can be seen as explicitnon-linear embedding) and linear SVMs (LSVMs). From their evaluation the authors conclude that theMBH features provide rich video content information, and their combination with SIFT features (and toa smaller degree with the MFCC audio features) leads to significant performance improvements. Inanother direction to event detection several researchers exploit a set of concept detectors to provide amore informative video representation, instead of trying to learn to detect the events by looking directlyat the low-level features. In [MGvdSS13], videos are represented using the so-called model vectors[MHX+12, GMK11] (feature vectors describing detection results for the TRECVID semantic indexing(SIN) concepts), and a cross-entropy based criterion is applied to select the most informative conceptsfor the MED 2011 events. In [HvdSS13], a subset of the MED 2012 dataset is used to study the effect ofconcept vocabulary properties in the performance of the event detectors, such as vocabulary size, diver-sity, and other. Finally, low-level video features and model vector representations are often combined,aiming at better event detection performance [MHX+12, NPU12, MNJ13, LJS13, R. 13]. For instance, inthe context of the MED 2013 challenge, MultiModal Pseudo Relevance Feedback (MMPRF) is proposedin [LJS13] to leverage information across different feature modalities (ASR, model vectors, dense trajec-tories, SIFT, etc.), while [R. 13] introduces a new feature (improved dense trajectories) which is shownto lead to very good detection performance. Most of the event detection approaches proposed until nowput the emphasis on how the video is represented and exploit new such techniques for improving theaccuracy of the event detection system. On the machine learning front, for learning event detectorsfrom these representations, standard machine learning methods (typically KSVMs) are employed. Incontrary, we focus on classifier design for improving event detection in terms of both computational effi-ciency and accuracy. Other recent methods that focus on the machine learning part for improving eventdetection include [GMK11, GV13]. Most of these methods utilize fusion schemes of KSVM based de-tectors, which are among the most effective pattern classifiers. However, the direct exploitation of SVMsin noise feature vectors and in large-scale video collections may not be optimal in terms of both classifi-cation response times and accuracy. Therefore, more efficient and effective computational approachesare necessary for the practical use of event detection.
8.2 LinkedTV approachMotivated from the discussion in the previous section, we propose the use of a nonlinear discriminantanalysis (DA) algorithm [BA00, MRW+99] to derive a lower dimensional embedding of the original data,and then use fast LSVMs in the resulting subspace to learn the events. For realizing dimensionalityreduction we utilize kernel subclass-based methods, which have been shown to outperform other DAapproaches. In particular, a new method called generalized subclass DA (GSDA) is proposed whichexploits the special structure of the inter-between-subclass scatter to provide an efficient solution to theKSDA eigenvalue problem [GMKS13, YHM11, CYLB07, CHH11].
8.2.1 Video representation
Model vectors are adopted in this work as feature vectors for the purpose of event detection. A modelvector representation of videos is created, similarly to [MHX+12, GMK11], in three steps: a) low-levelfeature extraction, b) evaluation of a set of external concept detectors at keyframe level, and, c) a poolingstrategy to retrieve a single model vector at video level. For the first two steps, the concept detection
c© LinkedTV Consortium, 2014 46/62

Visual, text and audio information analysis for hypervideo, final release D1.4
processes described in Section 7 of this document or in Section 2.4 of D1.2 can be used. Specifically, avideo signal is represented with a sequence of keyframes extracted at uniform time intervals, and thendifferent feature extraction procedures are applied to derive a low-level feature vector representationof each keyframe. This includes a point sampling strategy (e.g., Harris-Laplace, dense sampling), theextraction of local feature descriptors (e.g., SIFT, color SIFT variants), and a coding technique (e.g.,BoW with hard/soft assignment, Fisher vectors; pyramidal decomposition) to represent each keyframewith a fixed dimensional feature vector. By applying the above feature extraction procedure and using apool of F external concept detectors the model vector xn,t corresponding to the t-th keyframe of the n-thvideo in class is formed; that is, the f -th element is the response of the f -th concept detector expressingthe DoC that the respective concept is depicted in the keyframe. The concept detectors are createdby exploiting an external dataset of videos or images annotated at concept level (e.g., TRECVID SIN[PO13], ImageNet LSVRC [ima], etc.), the adopted feature extraction procedure, and an LSVM patternclassifier. Finally, average pooling along the keyframes is performed to retrieve the model vector xn atvideo level.
Alternatively to the use of model vectors for event detection, rich low-level features such as densemotion trajectories can be extracted in the first step for the entire video and be used directly for learninga mapping between them and the event labels, using machine learning methods. An experiment withthis alternative (and complementary to model vectors) approach will also be reported in the sequel.
8.2.2 Dimensionality reduction
The derived model vectors in the columns of matrix X are used as input to the proposed GSDA algorithm.GSDA exploits an implicit nonlinear transformation φ(·) : RF →F , and computes the parameters of akernel function k(xi,x j) (e.g., the scale parameter of Gaussian RBF) and the transformation matrix W formapping the F-dimensional observation x to a vector z in the D-dimensional discriminant subspace byz = WT k. The i-th component k(xi,x) of vector k is retrieved by evaluating the kernel function k(,) usingthe i-th training feature observation and x. The GSDA transformation matrix is identified by solving thefollowing generalized eigenvalue problem
argmaxW
((WT KAKW)−1(WT KKW)), (10)
where K is the kernel Gram matrix and A is the between subclass factorization matrix. In the discriminantsubspace observation belonging to the same class are expected to form more compact clusters andbe far apart from clusters representing different classes. For more details concerning the theoreticalanalysis of the proposed GSDA the interested reader is referred to [GM14].
8.2.3 Event detection
Following dimensionality reduction, an LSVM classifier is used for learning an event detector in thediscriminant subspace. Given the lower dimensional embedding of the training set, Z the LSVM opti-mization problem is defined as
ming,b,ξn
12‖g‖2 +C
N
∑n=1
ξn, (11)
subject to the constraints
yn(gT zn +b) ≥ 1−ξn, ∀n ∈ [1,N] (12)ξn ≥ 0, ∀n ∈ [1,N], (13)
where g,b are the weight vector and bias, respectively, defining the separating hyperplane between thetwo classes, C > 0 is the penalty term, and ξn and yn is the slack variable and class label correspondingto xn. The above problem is usually reformulated to its dual quadratic form using standard Lagrangianmethods, and solved using an appropriate optimization technique. The decision function that classifiesa test observation zt is then given by
h(zt) = sign(gT zt +b) (14)
In addition to the binary classification decisions, class likelihoods, which are very useful for event-basedretrieval applications and for the evaluation of event detection accuracy using measures such as averageprecision, are derived using an appropriate sigmoid function that maps SVM outputs to probabilities[LLW07].
c© LinkedTV Consortium, 2014 47/62

Visual, text and audio information analysis for hypervideo, final release D1.4
8.2.4 Advances in comparison to previous versions
In D1.2, we proposed the SRECOC algorithm in order to handle data nonlinearities more effectively andexploit the subclass structure of the event. This framework combined multiple KSVM-based classifierstrained at different regions of the feature space, since it has been shown that such fusion schemes areamong the most effective pattern classifiers. However, the direct exploitation of SVMs in feature vec-tors, which usually contain noise or irrelevant components, can degrade the classification performance.Moreover, KSVM-based techniques are very difficult to scale during training in big data problems. Forinstance, in the TRECVID MED 2013 challenge [PO13] the reported learning times typically range froma few days to several weeks, depending on the employed computational resources, i.e., the use of su-percomputers or small-sized clusters, respectively. In this section, we propose a two-phase approach forevent detection as an alternative to the KSVM-based approaches such as SRECOC. Using the GSDA-LSVM, in contrary to the costly training of KSVM, the SVM penalty term can be rapidly identified in thelower dimensional subspace. Moreover, an additional speed up in deriving this lower-dimensional spaceis achieved by using the proposed GSDA method instead of conventional nonlinear subclass DA meth-ods such as KSDA or KMSDA. Finally, the utilization of motion features provides a further improvementin event recognition rate in comparison to the method described in D1.2.
8.3 Experimental evaluation and comparisonsThe MED 2010 and 2012 video collections [PO13, HvdSS13] are used for the comparison of the pro-posed method (GSDA-LSVM) with LSVM and KSVM [Vap98]. The Gaussian radial basis function[Vap98] is used as the base kernel for the nonlinear methods (GSDA, KSVM). Moreover, the averageprecision, APi is utilized for assessing the retrieval performance of the i-th event detector. The overallperformance of a method is then measured using the mean AP (MAP) along all events in a dataset.
8.3.1 Datasets
The TRECVID MED 2010 dataset consists of 1745 training and 1742 test videos belonging to one of 3target events (shown in the first (upper) part of Table 17) or to the “rest-of-world” event category. For ex-tracting the model vectors representing these videos, the video signal is decoded and one keyframe ev-ery 6 seconds is extracted. The spatial information within each keyframe is encoded using a 1×3 pyrami-dal decomposition scheme, a dense sampling strategy and the Opponent-SIFT descriptor [vdSGS10b].Subsequently, for each pyramid cell a Bag-of-Words (BoW) model of 1000 visual words is derived usingthe k-means algorithm and a large set of feature vectors. A soft assignment technique is then applied torepresent each keyframe with a BoW feature vector [vGVSG10] of 4000 dimensionality. Then, a set of346 visual concept detectors, based on LSVM classifiers and trained on the TRECVID SIN 2012 dataset,is used for deriving a model vector for each keyframe. The final model vector at video-level is computedby averaging the keyframe model vectors along the video. For this dataset we also extracted motionfeatures, specifically dense trajectories and motion boundary descriptors as described in [WKSL13].The TRECVID MED 2012 video corpus consists of more than 5500 hours of user-generated video be-longing to one of 25 target events or to other uninteresting events. The target events are shown in thesecond (lower) part of Table 17. For ease of comparison, we use the publicly available dataset andcorresponding model vectors provided in [HvdSS13]. This subset comprises 13274 annotated modelvectors corresponding to an equal number of MED 2012 videos, and is divided to a training and evalua-tion partition of 8840 and 4434 model vectors, respectively. These model vectors were extracted usinga 1×3 spatial pyramid decomposition scheme, three SIFT-based descriptors (SIFT, Opponent-SIFT andC-SIFT) and Fisher vector coding [HvdSS13]. The above feature extraction procedure along with theTRECVID SIN 2012 and ImageNet ILSVRC 2011 datasets, annotated with 346 and 1000 concepts re-spectively, were used for creating a pool of F = 1346 LSVM-based concept detectors. Then, the MED2012 model vectors were extracted by applying the concept detectors to one frame every two seconds,and averaging them along the video as previously.
8.3.2 Experimental setup
In the stage of model selection during the training of event detectors, for LSVM we need to identify thepenalty term, for KSVM both the penalty and the scale parameter of the Gaussian RBF kernel, whilefor GSDA-LSVM we additionally need to estimate the number of subclasses. These parameters areestimated using a grid search on a 3-fold cross-validation procedure, where at each fold the develop-ment set is split to 70% training set and 30% validation set. During optimization, the LSVM penalty
c© LinkedTV Consortium, 2014 48/62

Visual, text and audio information analysis for hypervideo, final release D1.4
T01: Assembling a shelterT02: Batting a run inT03: making a cakeE01: Attempting a board trickE02: Feeding an animalE03: Landing a fishE04: Wedding ceremonyE05: Working on a woodworking projectE06: Birthday partyE07: Changing a vehicle tireE08: Flash mob gatheringE09: Getting a vehicle unstuckE10: Grooming an animalE11: Making a sandwichE12: ParadeE13: ParkourE14: Repairing an applianceE15: Working on a sewing projectE21: Attempting a bike trickE22: Cleaning an applianceE23: Dog showE24: Giving directions to a locationE25: Marriage proposalE26: Renovating a homeE27: Rock climbingE28: Town hall meetingE29: Winning a race without a vehicleE30: Working on a metal crafts project
Table 17: Target events of TRECVID MED 2010 (T01-T03) and 2012 (E01-E15, E21-E30) datasets.
Event LSVM KSVM GSDA-LSVM % BoostT01 0.106 0.213 0.252 18.3%T02 0.477 0.651 0.678 4.1%T03 0.103 0.293 0.295 0.6%MAP 0.229 0.385 0.408 5.8%
Table 18: Performance evaluation on the TRECVID MED 2010 dataset; the last column depicts the boostin performance of GSDA-LSVM over KSVM.
Event LSVM KSVM GSDA-LSVM % BoostE01 0.156 0.488 0.583 19.5%E02 0.030 0.175 0.161 -7.8%E03 0.234 0.441 0.460 4.4%E04 0.273 0.579 0.668 15.4%E05 0.051 0.156 0.256 64.2%E06 0.131 0.181 0.243 34.6%E07 0.059 0.285 0.383 34.4%E08 0.383 0.564 0.577 2.4%E09 0.252 0.463 0.464 0.2%E10 0.061 0.260 0.285 9.8%E11 0.043 0.308 0.307 -0.2%E12 0.115 0.253 0.286 13.1%E13 0.078 0.480 0.510 6.4%E14 0.175 0.512 0.515 0.7%E15 0.112 0.388 0.451 16.2%E21 0.406 0.556 0.572 2.9%E22 0.045 0.174 0.168 -3.5%E23 0.406 0.612 0.633 3.5%E24 0.032 0.150 0.142 -5.2%E25 0.043 0.047 0.078 66.4%E26 0.086 0.288 0.327 13.8%E27 0.331 0.382 0.441 15.6%E28 0.354 0.410 0.479 17.1%E29 0.124 0.252 0.277 10.3%E30 0.020 0.142 0.197 39.2%MAP 0.160 0.341 0.379 10.9%
Table 19: Performance evaluation on the TRECVID MED 2012 dataset; the last column depicts the boostin performance of GSDA-LSVM over KSVM.
c© LinkedTV Consortium, 2014 49/62

Visual, text and audio information analysis for hypervideo, final release D1.4
and the Gaussian RBF scale of KSVM and GSDA-LSVM are searched in the range [2−10,24]. For theidentification of the optimum number of GSDA subclasses, the k-means algorithm is used to evaluatedifferent data partitions by varying the number of subclasses of the target event in the range [2,6] (i.e.,the “rest-of-the-world” class is not divided into subclasses).
8.3.3 Results
The performance of the different methods in terms of AP (and MAP along all events) in MED 2010 and2012 is shown in Table 18 and Table 19 respectively, where the best performance is printed in bold. Fromthe obtained results we observe that GSDA-LSVM provides the best performance in both datasets. Inmore detail, in the MED 2010 dataset we observe that GSDA-LSVM provides an approximate boost inperformance over KSVM of approximately 5.8%, and that both kernel-based methods (KMSDA, GSDA-LSVM) achieve a MAP boost of more than 68% over the linear one (LSVM). From Table 19 we see thatthe performance of all methods is somewhat lower, in absolute numbers, in the more challenging (interms of event diversity and scale) MED 2012 dataset. However, the performance differences betweenthe methods are increased, in comparison to the differences observed in MED 2010; GSDA-LSVMprovides a MAP boost of approximately 11% and 137% over KSVM and LSVM respectively.
For the evaluation of the proposed method in terms of time complexity two experiments are per-formed, as described in the following. GSDA extends KSDA (and similarly other subclass DA methods)by providing a new formulation of the eigenvalue problem that can be solved more efficiently. To thisend, we compare GSDA with KSDA in terms of computational time for learning one MED 2012 event.In this experiment a speed up of around 25% of GSDA over KSDA was observed. This performancegain is achieved because the eigenanalysis performed in GSDA involves matrices of smaller dimension.In more detail, KSDA solves a generalized eigenvalue problem involving two 8840× 8840, (8840 is thenumber of kernel evaluations executed for constructing the kernel Gram matrix in, which is equal to thenumber of videos in the training dataset); in contrary, GSDA requires the spectral decomposition of twomatrices, specifically, an 8840×8840 matrix and a much smaller one of dimension J× J, where J ∈ [3,7](for more details see [GM14]).
Secondly, GSDA-LSVM was compared with KSVM and LSVM. In this experiment, a grid searchwas performed for identifying the optimum parameters of the above approaches on an Intel i7 3.5-GHzmachine. In particular, we recorded the training times of GSDA-LSVM (where we fix the number ofsubclasses to two), and KSVM for identifying the Gaussian RBF scale and penalty parameter in a 5×5optimization grid; for LSVM only a 5×1 grid is used as this approach includes only the penalty parameter.The evaluation results are shown in Table 20. From the obtained results we can see that GSDA-LSVMis approximately two times faster than KSVM. This performance gain is achieved because GSDA-LSVMcan efficiently identify the best penalty value in the reduced dimensionality space after the applicationof the GSDA phase of this approach. Finally, concerning testing times, similar values were observedfor both GSDA-LSVM and KSVM. This was expected as testing time performance in kernel approachesis dominated by the kernel evaluations between the test observation and the annotated observations inthe training dataset.
LSVM KSVM GSDA-LSVMTime (min) 8.67 103.54 52.10
Table 20: Time (in minutes) for selecting the parameters C and ρ of KSVM and GSDA-LSVM with H = 2during training in MED 2012 dataset from a 5×5 grid; for LSVM a 5×1 grid is used as only C needs tobe identified.
Finally, the proposed method was compared with LSVM in the MED 2010 dataset using dense motiontrajectories features [WKSL13] (the computational cost of KSVM was very high and thus was excludedfrom this evaluation). From the results depicted in Table 21 we observe that the proposed method offersa boost of 15.3%.
8.4 DiscussionA novel video event detection method was presented that exploits a new efficient kernel subclass DAalgorithm (GSDA) to extract the most discriminant concepts (or the most discriminant dimensions of alow-level feature vector, in the case of dense trajectories) for the event, and LSVM for detecting the eventin the GSDA subspace. The evaluation of the proposed method on the TRECVID MED corpora of 2010
c© LinkedTV Consortium, 2014 50/62

Visual, text and audio information analysis for hypervideo, final release D1.4
Event LSVM GSDA-LSVM % BoostT01 0.476 0.519 9%T02 0.702 0.751 7%T03 0.269 0.398 48%MAP 0.482 0.556 15.3%
Table 21: Performance evaluation on the TRECVID MED 2010 dataset using motion information; thelast column depicts the boost in performance of GSDA-LSVM over LSVM.
and 2012 for the detection of 28 events in total showed that it favorably compares to the correspondinglinear or kernel SVM-based one in terms of both efficiency and accuracy.
9 WP1 REST Service
Aiming to provide a fully automated way of communication between the overall LinkedTV platform andthe multitude of developed multimedia analysis tools discussed in this deliverable and the previous de-liverable D1.2, we developed a web-based WP1 REST service. As shown in Fig. 16 this REST serviceis composed by three different parts, where each one of them is responsible for analyzing a specificmodality of the multimedia content.
The text analysis part is a REST service hosted by UEP. This sub-component performs keywordextraction analysis (see Fig 16) on all different types of textual data, such as video subtitles, video meta-data and automatically created transcripts after ASR according to the method described in Section 4.2.The visual analysis part is performed by a REST service hosted in CERTH and can be considered asthe heart of the overall WP1 REST Service, since it is also responsible for the communication with theLinkedTV platform, and the data transmission between the different components of the service. The inte-grated analysis techniques at this part of the service (see Fig 16) are: shot segmentation, chapter/topicsegmentation, video concept detection and face detection and tracking. Face detection is performedby the algorithm described in Section 3.2 of D1.2, and it was part of the framework for semanticallyenriched hyperlinking proposed in [SOA+13], while the tracking is performed by combining informationextracted from face detection and shot segmentation under a simple strategy that computes trajectoriesof detected faces over the shots of the video. All other visual analysis processes are performed usingthe algorithms described in different sections of the present deliverable. Finally, the audio analysis partis handled by a REST service hosted by Fraunhofer and includes the methods presented earlier in thisdeliverable for automatic speech recognition (ASR) and speaker identification (see Fig 16).
As illustrated in Fig. 16, the communication between the platform and the WP1 REST Service isasynchronous. The reason for adopting this communication pattern was to allow the simultaneous pro-cessing of different multimedia content. Specifically, after making a call to the WP1 REST Service, theplatform does not have to wait until the analysis results are available (which would be the case if thecommunication was performed in a synchronous mode), but it is able to send a new call requesting theanalysis of new content. The same model was utilized for transferring data between the visual and theaudio analysis parts of the service. On the contrary, the communication channel between the visualand the text analysis part is performed in a synchronous way, since the needed running time for gettingthe results of keyword extraction analysis is just a few seconds for a one hour video, which practicallyeliminated the need for asynchronous communication.
As input, the service gets a REST call from the LinkedTV platform. Via this call the user (i.e., the ad-ministrator of the LinkedTV platform) is able to send three different sources of data: (a) a video file, (b) afile with the video’s subtitles (following the standard SRT format) and (c) a file with the video’s metadata(following the standard OAI DC format 17). Moreover, by giving specific values to the parameters withinthe body of the REST call, the user can freely select the set of analysis methods that will be applied onthe provided data. This set can be either the entire group of techniques integrated into the service, orwhichever sub-group of them, considering the dependencies between the analysis modules (e.g., thechapter/topic segmentation of a video requires the prior analysis of the video by the shot segmenta-tion algorithm). If no textual data are available, the keyword extraction analysis can be applied on thetranscripts created after processing the audio stream of the video using the ASR module.
The general form of the REST call is illustrated in the following Example 3. According to this example,the user of the service must provide some authentication details (i.e., User and Pass), and the URLs
17http://www.openarchives.org/OAI/openarchivesprotocol.html
c© LinkedTV Consortium, 2014 51/62

Visual, text and audio information analysis for hypervideo, final release D1.4
Figure 16: The developed WP1 REST Service, the established communication channels and the analy-sis modules that have been integrated into the service.
of the video (VideoURL), the subtitles (SubtitlesURL) and the metadata files (MetadataURL). TheseURLs can be either FTP-based or HTTP-based ones. Then, the required analysis technique(s) is(are)specified by setting the value 1.0 to the appropriate flag, where:
• ’asr’ stands for automatic speech recognition and speaker identification
• ’ke’ stands for keyword extraction
• ’sh’ stands for shot segmentation
• ’shco’ stands for shot segmentation and concept detection
• ’shch’ stands for shot segmentation and chapter/topic segmentation
• ’shfa’ stands for shot segmentation and face detection-tracking
• ’shcofa’ stands for shot segmentation, concept detection and face detection-tracking
• ’shchfa’ stands for shot segmentation, chapter/topic segmentation and face detection-tracking
• ’shcochfa’ stands for shot segmentation, concept detection, chapter/topic segmentation and facedetection-tracking
The last element in the body of the call (Language) defines the content’s language, and can beGerman (\”de\”), Dutch (\”nl\”) or English (\”en\”). Finally, all this information is provided to the WP1REST Service by making a POST call at http://xxx.xxx.xxx.xxx:port/notify (the IP address and the portof the WP1 REST Service are hidden here, for avoiding unrestricted and unauthorized access to theservice).
Example 3. A REST call to the WP1 REST Service asking for multimedia analysis, via a Windowscommand prompt terminalcurl -X POST –data ”{’username’:\”User\”,’password’:\”Pass\”,’video url’:\”VideoURL\”,’subs url’:\”SubtitlesURL\”,’meta url’:\”MetadataURL\”,’asr’:\”0.1\”,’ke’:\”0.1\”,’sh’:\”0.1\”,’shco’:\”0.1\”,’shch’:\”0.1\”,’shcoch’:\”0.1\”,’shfa’:\”0.1\”,’shcofa’:\”0.1\”,’shchfa’:\”0.1\”,’shcochfa’:\”0.1\”,’lang’:\”Language\”}” http://xxx.xxx.xxx.xxx:port/notify
c© LinkedTV Consortium, 2014 52/62

Visual, text and audio information analysis for hypervideo, final release D1.4
After receiving a call from the platform, the service initially downloads the provided data (i.e., videoand text files) in a local directory of the server. When this is done, the service responds to the plat-form that the analysis is about to begin and the communication is interrupted, turning into the asyn-chronous mode that we discussed above. Following this, the processing of the downloaded contentstarts, based on the selected set of analysis methods. During the analysis, the service allows the user(i.e., the administrator of the platform) to monitor the status of the processing in an automated way viaa REST call similar to the one described in Example 4. According to this, the user must define thename of the video without its extension (VideoName), while the response of the service can be either“XXX ANALYSIS STARTED” or “XXX ANALYSIS COMPLETED”, where XXX corresponds to the nameof the selected technique. When the analysis is finished, the results can be retrieved by sending anotherREST call to the service, including again the name of the video (VideoName) and following the formatof the call presented in Example 5.
Example 4. A REST call to the WP1 REST Service asking for the status of the analysis, via aWindows command prompt terminalcurl GET http://xxx.xxx.xxx.xxx:port/status/VideoName
Example 5. A REST call to the WP1 REST Service asking for the results of the analysis, via aWindows command prompt terminalcurl GET http://xxx.xxx.xxx.xxx:port/result/VideoName
The output of the WP1 REST Service is an EXB file that incorporates the analysis results fromthe different selected analysis modules. This file is readable by the Exmaralda annotation tool 18 (see[SWHL11]), and uses a variation of the XML format for the representation of the created data. Theoverall outcome of the WP1 multimedia analysis which is included in the created EXB, is then passedvia the platform to the next processing step which is performed by the components of the WP2 of theLinkedTV project.
10 Conclusions
This document presents the final release of multimedia analysis tools for video hyperlinking, as devel-oped by the WP1 of the LinkedTV project, building upon and extending the first release of analysis toolsthat was described in D1.2. Based on the outcomes of extensive evaluations and of our participation tointernational benchmarking activities with the WP1 techniques, and guided by the analysis requirementsof each LinkedTV scenario, as these were updated in the course of the project, we developed in thislast year our final release of analysis tools. These aim to support the video hyperlinking procedure byproviding more accurate and meaningful results, as presented in detail in the different sections of thisdeliverable.
The basis for video hyperlinking is the definition of media fragments that can be used as starting andending points of links between related content. To this end, different temporal segmentation approacheswere described in Sections 2 and 3 of this deliverable, which result in temporal segments of variousgranularities. The shot segmentation algorithm described in Section 2 aims to identify the elementarytemporal units that compose the video, called shots. Drawing input from this analysis, the chapter/topicsegmentation methods presented in Section 3, exploit previous knowledge about the structure of thevideos from the LinkedTV scenarios and detect specific visual cues for grouping the detected shots intobigger temporal fragments that correspond to the story-telling parts of the multimedia content. Moreover,a more generic multimodal approach that combines information extracted from the visual and the audiomodality and performs topic segmentation based on visual and topic coherence among shots was alsodiscussed in Section 3.
In the acoustic domain, an automatic speech recognition (ASR) method was described in Section 4,which can be utilized for converting the spoken content of a video (when no subtitles are available) intotextual data (i.e., transcripts). Moreover, a framework for speaker identification, that relies on a databaseof speakers created after combining audio analysis and a video optical character recognition method,was presented in Section 5. Using as input the outcome of the ASR analysis (i.e., the created ASRtranscripts), as well as other sources of textual information related to a media fragment (e.g., videos
18http://www.exmaralda.org/index.html
c© LinkedTV Consortium, 2014 53/62

Visual, text and audio information analysis for hypervideo, final release D1.4
subtitles or metadata), the keyword extraction algorithm discussed in Section 6 of this deliverable aimsto identify the most relevant words or phrases, called keywords, that could be considered as tags forestablishing links to other sources with relevant information, or media fragments with related content.
Higher-level video analysis approaches were described in Sections 7 and 8. After representing thecontent of a video using a number of keyframes for each automatically detected shot (using the shotsegmentation approach of Section 2), the developed framework for video concept detection presentedin Section 7 aims to understand the rich semantics of the video, by analyzing the visual content of thekeyframes, utilizing a set of trained visual concept classifiers. The outcome of this analysis can be usedfor identifying content belonging to various domains, while it can also be given as input to the video eventdetection approach of Section 8. The output of the methods presented in both Section 7 and 8 is a setof labels (concept labels and event labels, respectively), which describe the contents of the video andthus support operations such as semantics-based indexing of video and the retrieval of related videosfor subsequently establishing hyperlinks among them.
Finally, aiming to enable a simple and fully automatic way of communication between the LinkedTVplatform and the bunch of multimedia analysis modules that were developed in LinkedTV’s WP1 andwere presented in Sections 2 to 8 of the present document, we constructed a web-based analysisservice integrating the above analysis modules, which we termed WP1 REST Service and which wasdescribed in Section 9.
So in conclusion WP1 offers a rich set of multimedia analysis tools that can efficiently address theanalysis requirements of each of the LinkedTV scenarios, either via improved versions of algorithms fromthe first release, or by introducing new multimodal approaches that exploit information from differenttechniques and modalities. Moreover, the developed web-based framework gathers all the differentdeveloped analysis components, being a self-contained entity for multimedia analysis and one of thecore components of the overall architecture of the LinkedTV platform.
c© LinkedTV Consortium, 2014 54/62

Visual, text and audio information analysis for hypervideo, final release D1.4
Bibliography
[AF09] A. Amiri and M. Fathy. Video shot boundary detection using qr-decomposition and gaus-sian transition detection. EURASIP Journal of Advanced Signal Processing, pages –1–1,2009.
[AHF06] AE. Abdel-Hakim and AA Farag. Csift: A sift descriptor with color invariant characteris-tics. In IEEE Computer Society Conference on Computer Vision and Pattern Recognition,volume 2, pages 1978–1983, 2006.
[AKC+02] W. D. Andrews, M. A. Kohler, J. P. Campbell, J. J. Godfrey, and J. Hernandez-Cordero.Gender-dependent phonetic refraction for speaker recognition. In 2002 IEEE InternationalConference on Acoustics, Speech, and Signal Processing (ICASSP), volume 1, pagesI–149. IEEE, 2002.
[AM14] E. Apostolidis and V. Mezaris. Fast shot segmentation combining global and local visualdescriptors. In 2014 IEEE International Conference on Acoustics, Speech and SignalProcessing (ICASSP), pages 6583–6587, May 2014.
[AMK13] E. Apostolidis, V. Mezaris, and I Kompatsiaris. Fast object re-detection and localizationin video for spatio-temporal fragment creation. In 2013 IEEE International Conference onMultimedia and Expo Workshops (ICMEW), pages 1–6, July 2013.
[BA00] G. Baudat and F. Anouar. Generalized discriminant analysis using a kernel approach.Neural Computing, 12(10):2385–2404, October 2000.
[BADB11] J. Baber, N. Afzulpurkar, M.N. Dailey, and M. Bakhtyar. Shot boundary detection fromvideos using entropy and local descriptor. In 17th International Conference on DigitalSignal Processing (DSP), pages 1–6, 2011.
[BETVG08] H. Bay, A. Ess, T. Tuytelaars, and L. Van Gool. Speeded-up robust features (surf). Com-puter Vision and Image Understanding, 110(3):346–359, June 2008.
[BM01] E. Bingham and H. Mannila. Random projection in dimensionality reduction: Applicationsto image and text data. In 7th ACM SIGKDD Int. Conf. on Knowledge Discovery and DataMining, pages 245–250, NY, 2001. ACM.
[Bre12] H. Bredin. Segmentation of tv shows into scenes using speaker diarization and speechrecognition. In 2012 IEEE International Conference on Acoustics, Speech and SignalProcessing (ICASSP), pages 2377–2380, March 2012.
[BSB+10] D. Baum, D. Schneider, R. Bardeli, J. Schwenninger, B. Samlowski, T. Winkler, andJ. Khler. DiSCo — A German Evaluation Corpus for Challenging Problems in the Broad-cast Domain. In Proc. Seventh conference on International Language Resources andEvaluation (LREC), Valletta, Malta, may 2010.
[BZM07] A. Bosch, A. Zisserman, and X. Muoz. Image classification using random forests andferns. In IEEE International Conference of Computer Vision (ICCV) 2007, pages 1–8, Riode Janeiro, 2007.
[CHH11] Deng Cai, Xiaofei He, and Jiawei Han. Speed up kernel discriminant analysis. The VLDBJournal, 20(1):21–33, February 2011.
[CKL09] V. Chasanis, A. Kalogeratos, and A. Likas. Movie segmentation into scenes and chaptersusing locally weighted bag of visual words. In Proceedings of the 2009 ACM InternationalConference on Image and Video Retrieval, CIVR ’09, pages 35:1–35:7, New York, NY,USA, 2009. ACM.
[CL11] C.-C. Chang and C.-J. Lin. LIBSVM: A library for support vector machines. ACM Trans-actions on Intelligent Systems and Technology, 2:27:1–27:27, 2011. Software available athttp://www.csie.ntu.edu.tw/~cjlin/libsvm.
c© LinkedTV Consortium, 2014 55/62

Visual, text and audio information analysis for hypervideo, final release D1.4
[CLG09] V. Chasanis, A. Likas, and N. Galatsanos. Simultaneous detection of abrupt cuts anddissolves in videos using support vector machines. Pattern Recogition Letters, 30(1):55–65, January 2009.
[CLVZ11] K. Chatfield, V. Lempitsky, A. Vedaldi, and A. Zisserman. The devil is in the details: anevaluation of recent feature encoding methods. In British Machine Vision Conference,pages 76.1–76.12. British Machine Vision Association, 2011.
[CMPP08] A. Chianese, V. Moscato, A. Penta, and A. Picariello. Scene detection using visual andaudio attention. In Proceedings of the 2008 Ambi-Sys workshop on Ambient media deliv-ery and interactive television, AMDIT ’08, pages 1–7, ICST, Brussels, Belgium, Belgium,2008. ICST (Institute for Computer Sciences, Social-Informatics and TelecommunicationsEngineering).
[CNP06] Z. Cernekova, N. Nikolaidis, and I. Pitas. Temporal video segmentation by graph par-titioning. In Proc. of IEEE International Conference on Acoustics, Speech and SignalProcessing, 2006. ICASSP 2006, volume 2, pages II–II, 2006.
[CTKO03] Y. Cao, W. Tavanapong, K. Kim, and J.H. Oh. Audio-assisted scene segmentation forstory browsing. In Proceedings of the 2nd international conference on Image and videoretrieval, CIVR’03, pages 446–455, Berlin, Heidelberg, 2003. Springer-Verlag.
[CYLB07] B. Chen, L. Yuan, H. Liu, and Z. Bao. Kernel subclass discriminant analysis. Neurocom-puting, 71(1–3):455–458, December 2007.
[D+01] G. Doddington et al. Speaker recognition based on idiolectal differences between speak-ers. In Proc. Eurospeech, volume 1, pages 2521–2524, 2001.
[DG14] J. Dunietz and D. Gillick. A new entity salience task with millions of training examples.14th Conference of the European Chapter of the Association for Computational Linguistics2014, page 205, 2014.
[DVZP04] C. Doulaverakis, S. Vagionitis, M. Zervakis, and E. Petrakis. Adaptive methods for mo-tion characterization and segmentation of mpeg compressed frame sequences. In AurlioCampilho and Mohamed Kamel, editors, Image Analysis and Recognition, volume 3211of Lecture Notes in Computer Science, pages 310–317. Springer Berlin Heidelberg, 2004.
[FBC08] M. Federico, N. Bertoldi, and M. Cettolo. IRSTLM: An Open Source Toolkit for HandlingLarge Scale Language Models. In Proc. INTERSPEECH, pages 1618–1621. ISCA, 2008.
[FCH+08] R.-E. Fan, K.-W. Chang, C.-J. Hsieh, X.-R. Wang, and C.-J. Lin. LIBLINEAR: A library forlarge linear classification. Journal of Machine Learning Research, 9:1871–1874, 2008.
[GC07] C. Grana and R. Cucchiara. Linear transition detection as a unified shot detection ap-proach. IEEE Transactions on Circuits and Systems for Video Technology, 17(4):483–489,2007.
[GLA02] J.-L. Gauvain, L. Lamel, and G. Adda. The limsi broadcast news transcription system.Speech Communication, 37(1):89–108, 2002.
[GM07] E Gabrilovich and S Markovitch. Computing semantic relatedness using wikipedia-basedexplicit semantic analysis. In Proceedings of the 20th International Joint Conference onArtifical Intelligence, IJCAI’07, pages 1606–1611, San Francisco, CA, USA, 2007. MorganKaufmann Publishers Inc.
[GM14] N. Gkalelis and V. Mezaris. Video event detection using generalized subclass discriminantanalysis and linear support vector machines. In Proc. IEEE ACM ICMR, Glasgow, UK,April 2014.
[GMK11] N. Gkalelis, V. Mezaris, and I. Kompatsiaris. High-level event detection in video exploitingdiscriminant concepts. In Proc. 9th Int. Workshop on Content-Based Multimedia Indexing,pages 85–90, Madrid, Spain, June 2011.
c© LinkedTV Consortium, 2014 56/62

Visual, text and audio information analysis for hypervideo, final release D1.4
[GMKS13] N. Gkalelis, V. Mezaris, I. Kompatsiaris, and T. Stathaki. Mixture subclass discriminantanalysis link to restricted gaussian model and other generalizations. IEEE Trans. NeuralNetw. Learn. Syst, 24(1):8–21, January 2013.
[GV13] N. Gkalelis and V. Mezaris et al. Video event detection using a subclass recoding error-correcting output codes framework. In Proc. IEEE ICME, pages 1–6, San Jose, CA, USA,July 2013.
[GYS+13] M. Gamon, T. Yano, X. Song, J. Apacible, and P. Pantel. Identifying salient entities inweb pages. In Proceedings of the 22nd ACM international conference on Conference onInformation & Knowledge Management (CIKM’13), pages 2375–2380. ACM, 2013.
[HCC06] C.-R. Huang, C.-S. Chen, and P.-C. Chung. Contrast context histogram - a discriminatinglocal descriptor for image matching. In 18th International Conference on Pattern Recog-nition (ICPR), 2006, volume 4, pages 53–56, 2006.
[HDY+12] G. Hinton, Li Deng, Dong Yu, G. E. Dahl, A. Mohamed, N. Jaitly, A. Senior, V. Vanhoucke,P. Nguyen, T. N. Sainath, and B. Kingsbury. Deep Neural Networks for Acoustic Model-ing in Speech Recognition: The Shared Views of Four Research Groups. IEEE SignalProcessing Magazine, 29(6):82–97, November 2012.
[HLZ04] X.-S. Hua, L. Lu, and H.-J. Zhang. Optimization-based automated home video editingsystem. IEEE Transactions on Circuits and Systems for Video Technology, 14(5):572–583, May 2004.
[HMQ13] A. Hamadi, P. Mulhem, and G. Quenot. Conceptual feedback for semantic multimediaindexing. In 2013 11th International Workshop on Content-Based Multimedia Indexing(CBMI), pages 53–58. IEEE, 2013.
[HvdSS13] A. Habibian, K. E. A. van de Sande, and C. G. M. Snoek. Recommendations for videoevent recognition using concept vocabularies. In Proc. ACM ICMR, pages 89–96, Dallas,Texas, USA, 2013.
[ima] Imagenet large scale visual recognition challenge 2011. http://www.image-net.org/
challenges/LSVRC/2011, accessed 2013-09-21.
[JBCS13] Y.-G. Jiang, S. Bhattacharya, S.-F. Chang, and M. Shah. High-level event recognitionin unconstrained videos. International Journal of Multimedia Information Retrieval, Jan.2013.
[JDSP10] H. Jegou, M. Douze, C. Schmid, and P. Perez. Aggregating local descriptors into a com-pact image representation. In IEEE on Computer Vision and Pattern Recognition (CVRP2010), pages 3304–3311, San Francisco, CA, 2010.
[JPD+12] H. Jegou, F. Perronnin, M. Douze, J. Sanchez, P. Perez, and C. Schmid. Aggregatinglocal image descriptors into compact codes. IEEE Transactions on Pattern Analysis andMachine Intelligence, 34(9):1704–1716, 2012.
[KCK+04] M. Kyperountas, Z. Cernekova, C. Kotropoulos, M. Gavrielides, and I Pitas. Audio pca ina novel multimedia scheme for scene change detection. In IEEE International Conferenceon Acoustics, Speech, and Signal Processing, 2004 (ICASSP ’04), volume 4, pages iv–353–iv–356 vol.4, May 2004.
[KCN+08] T. Kliegr, K. Chandramouli, J. Nemrava, V. Svatek, and E. Izquierdo. Combining imagecaptions and visual analysis for image concept classification. In Proceedings of the 9thInternational Workshop on Multimedia Data Mining: held in conjunction with the ACMSIGKDD 2008, pages 8–17. ACM, 2008.
[KSH12] A. Krizhevsky, I. Sutskever, and G. E. Hinton. Imagenet classification with deep convo-lutional neural networks. In F. Pereira, C.J.C. Burges, L. Bottou, and K.Q. Weinberger,editors, Advances in Neural Information Processing Systems 25, pages 1097–1105. Cur-ran Associates, Inc., 2012.
c© LinkedTV Consortium, 2014 57/62

Visual, text and audio information analysis for hypervideo, final release D1.4
[LDSL10] J. Li, Y. Ding, Y. Shi, and W. Li. A divide-and-rule scheme for shot boundary detectionbased on sift. Journal of Digital Content Technology and its Applications, pages 202–214,2010.
[Lev66] V. I. Levenshtein. Binary codes capable of correcting deletions, insertions and reversals.Soviet Physics Doklady, 10:707–710, February 1966.
[LH02] W.-H. Lin and A. Hauptmann. News video classification using svm-based multimodalclassifiers and combination strategies. In Proceedings of the tenth ACM internationalconference on Multimedia, pages 323–326. ACM, 2002.
[LJS13] Z.-Z. Lan, L. Jiang, and S.-I. Yu et al. CMU-Informedia at TRECVID 2013 multimedia eventdetection. In Proc. TRECVID 2013 Workshop, Gaithersburg, MD, USA, Nov. 2013.
[LK13] J. Lankinen and J.-K. Kamarainen. Video shot boundary detection using visual bag-of-words. In International Conference on Computer Vision Theory and Applications (VIS-APP), Barcelona, Spain, 2013.
[LL10] L. Liu and J.-X. Li. A novel shot segmentation algorithm based on motion edge feature. InPhotonics and Optoelectronic (SOPO), 2010 Symposium on, pages 1 –5, june 2010.
[LLT04] H. Lu, Z. Li, and Y.-P. Tan. Model-based video scene clustering with noise analysis. InProceedings of the 2004 International Symposium on Circuits and Systems, ISCAS ’04,volume 2, pages 105–108, May 2004.
[LLW07] H.-T. Lin, C.-J. Lin, and R. C. Weng. A note on Platt’s probabilistic outputs for supportvector machines. Mach. Learn., 68(3):267–276, October 2007.
[LMD07] G. Lebanon, Y. Mao, and J. Dillon. The locally weighted bag of words framework fordocument representation. J. Mach. Learn. Res., 8:2405–2441, December 2007.
[Low04] D. G. Lowe. Distinctive image features from scale-invariant keypoints. International Journalof Computer Vision, 60(2):91–110, November 2004.
[LYHZ08] X. Ling, O. Yuanxin, L. Huan, and X. Zhang. A method for fast shot boundary detectionbased on svm. In Congress on Image and Signal Processing (CISP’08), 2008, volume 2,pages 445 –449, may 2008.
[LZ07] J. Liao and B. Zhang. A robust clustering algorithm for video shots using haar wavelettransformation. In Proceedings of SIGMOD2007 Ph.D. Workshop on Innovative DatabaseResearch (IDAR2007), Beijing, China, June 2007.
[LZZ08] S. Liu, M. Zhu, and Q. Zheng. Video shot boundary detection with local feature postrefinement. In 9th International Conference on Signal Processing (ICSP), 2008, pages1548 –1551, oct. 2008.
[MGvdSS13] M. Mazloom, E. Gavves, Koen E. A. van de Sande, and Cees G. M. Snoek. Searchinginformative concept banks for video event detection. In Proc. ACM ICMR, pages 255–262,Dallas, Texas, USA, April 2013.
[MHX+12] M. Merler, B. Huang, L. Xie, G. Hua, and A. Natsev. Semantic model vectors for complexvideo event recognition. IEEE Trans. Multimedia, 14(1):88–101, February 2012.
[MKD+11] T. Mikolov, S. Kombrink, A. Deoras, L. Burget, and J. Honza Cernocky. RNNLM - RecurrentNeural Network Language Modeling Toolkit. IEEE Automatic Speech Recognition andUnderstanding Workshop, December 2011.
[MM14] E. Mavridaki and V. Mezaris. No-reference blur assessment in natural images using fouriertransform and spatial pyramids. In Proc. of International Conference on Image Processing(ICIP 2014). IEEE, 2014.
[MMK14] F. Markatopoulou, V. Mezaris, and I. Kompatsiaris. A comparative study on the use ofmulti-label classification techniques for concept-based video indexing and annotation.In Cathal Gurrin, Frank Hopfgartner, Wolfgang Hurst, Hvard Johansen, Hyowon Lee,and Noel OConnor, editors, MultiMedia Modeling, volume 8325 of LNCS, pages 1–12.Springer, 2014.
c© LinkedTV Consortium, 2014 58/62
Visual, text and audio information analysis for hypervideo, final release D1.4
[MMT+13] F. Markatopoulou, A. Moumtzidou, C. Tzelepis, K. Avgerinakis, N. Gkalelis, S. Vrochidis,V. Mezaris, and I. Kompatsiaris. ITI-CERTH participation to TRECVID 2013. In TRECVID2013 Workshop, Gaithersburg, MD, USA, 2013.
[MMvL12] M.I Mandasari, M. McLaren, and D.A van Leeuwen. The effect of noise on modern auto-matic speaker recognition systems. In 2012 IEEE International Conference on Acoustics,Speech and Signal Processing (ICASSP), pages 4249–4252, March 2012.
[MNJ13] G. K. Myers, R. Nallapati, and J. van Hout et al. Evaluating multimedia features and fusionfor example-based event detection. Machine Vision and Applications, July 2013.
[MRW+99] S. Mika, G. Ratsch, J. Weston, B. Scholkopf, and K. R. Mullers. Fisher discriminant anal-ysis with kernels. In Proc. IEEE Signal Processing Society Workshop in Neural Networksfor Signal Processing IX, pages 41–48, Madison, WI, USA, August 1999.
[MS04] K. Mikolajczyk and C. Schmid. Scale and affine invariant interest point detectors. Interna-tional Journal of Computer Vision, 60(1):63–86, October 2004.
[NMZ05] C.-W. Ngo, Y.-F. Ma, and H.-J. Zhang. Video summarization and scene detection by graphmodeling. IEEE Transactions on Circuits and Systems for Video Technology, 15(2):296–305, February 2005.
[NPU12] P. Natarajan, R. Prasad, and U. Park et al. Multimodal feature fusion for robust eventdetection in web videos. In Proc. CVPR, pages 1298–1305, Providence, RI, USA, June2012.
[NSS14] T. L. Nguyen, D. Stein, and M. Stadtschnitzer. Gradient-free decoding parameter optimiza-tion on automatic speech recognition. In ICASSP, pages 3261–3265, 2014.
[NT05] J. Nam and A.H. Tewfik. Detection of gradual transitions in video sequences using b-splineinterpolation. IEEE Transactions on Multimedia, 7(4):667–679, 2005.
[OAM+12] P. Over, G. Awad, M. Michel, J. Fiscus, G. Sanders, B. Shaw, W. Kraaij, A.F. Smeaton, andG. Queenot. Trecvid 2012 – an overview of the goals, tasks, data, evaluation mechanismsand metrics. In Proceedings of TRECVID 2012, 2012.
[OVS13] D. Oneata, J. Verbeek, and C. Schmid. Action and event recognition with Fisher vectorson a compact feature set. In IEEE ICCV, Sydney, Australia, December 2013.
[PC02] S.-C. Pei and Y.-Z. Chou. Effective wipe detection in mpeg compressed video using macroblock type information. IEEE Transactions on Multimedia, 4(3):309–319, September 2002.
[PGB+11] D. Povey, A. Ghoshal, G. Boulianne, L. Burget, O. Glembek, N. Goel, M. Hannemann,P. Motlicek, Y. Qian, P. Schwarz, J. Silovsky, G. Stemmer, and K. Vesely. The KaldiSpeech Recognition Toolkit. In IEEE 2011 Workshop on Automatic Speech Recognitionand Understanding. IEEE Signal Processing Society, December 2011. IEEE Catalog No.:CFP11SRW-USB.
[PM14] C. Papagiannopoulou and V. Mezaris. Concept-based Image Clustering and Summariza-tion of Event-related Image Collections. In Proc. of Int. Workshop on Human CenteredEvent Understanding from Multimedia (HuEvent14), at the ACM Multimedia conference,2014.
[PMD96] B. Parmanto, P. W. Munro, and H. R. Doyle. Improving committee diagnosis with resam-pling techniques. In D.S. Touretzky, M.C. Mozer, and M. E. Hesselmo, editors, Advancesin Neural Information Processing Systems, volume 8, pages 882–888, Cambridge, MA.,1996. MIT press.
[PNA+03] B. Peskin, J. Navratil, J. Abramson, D. Jones, D. Klusacek, D. A. Reynolds, and B. Xi-ang. Using prosodic and conversational features for high-performance speaker recogni-tion: Report from jhu ws’02. In Acoustics, Speech, and Signal Processing, 2003. Pro-ceedings.(ICASSP’03). 2003 IEEE International Conference on, volume 4, pages IV–792.IEEE, 2003.
c© LinkedTV Consortium, 2014 59/62

Visual, text and audio information analysis for hypervideo, final release D1.4
[PO13] M. Michel J. Fiscus G. Sanders W. Kraaij A. F. Smeaton G. Quenot P. Over, G. Awad.Trecvid 2013 – an overview of the goals, tasks, data, evaluation mechanisms and metrics.In Proceedings of TRECVID 2013. NIST, USA, 2013.
[PSM10] F. Perronnin, J. Sanchez, and T. Mensink. Improving the fisher kernel for large-scale imageclassification. In 11th Eur. Conf. on Computer Vision: Part IV, pages 143–156. Springer-Verlag, 2010.
[PZM96] G. Pass, R. Zabih, and J. Miller. Comparing images using color coherence vectors. InProceedings of the 4th ACM international conference on Multimedia, MULTIMEDIA ’96,pages 65–73, New York, NY, USA, 1996. ACM.
[Qiu02] G. Qiu. Indexing chromatic and achromatic patterns for content-based colour image re-trieval. Pattern Recognition, 35:1675–1686, 2002.
[QLR+09] Z. Qu, Y. Liu, L. Ren, Y. Chen, and R. Zheng. A method of shot detection based on colorand edge features. In 1st IEEE Symposium on Web Society (SWS), pages 1–4, 2009.
[R. 13] R. Aly et al. The AXES submissions at TRECVID 2013. In Proc. TRECVID 2013 Work-shop, Gaithersburg, MD, USA, Nov. 2013.
[RAC+03] Douglas Reynolds, Walter Andrews, Joseph Campbell, Jiri Navratil, Barbara Peskin, An-dre Adami, Qin Jin, David Klusacek, Joy Abramson, Radu Mihaescu, et al. The su-persid project: Exploiting high-level information for high-accuracy speaker recognition.In 2003 IEEE International Conference on Acoustics, Speech, and Signal Processing(ICASSP’03), volume 4, pages IV–784. IEEE, 2003.
[RQD00] D.A. Reynolds, T.F. Quatieri, and R.B. Dunn. Speaker Verification Using Adapted GaussianMixture Models. Digital Signal Processing, 10:19–41, 2000.
[RRKB11] E. Rublee, V. Rabaud, K. Konolige, and G. Bradski. Orb: An efficient alternative to siftor surf. In 2011 IEEE International Conference on Computer Vision (ICCV), pages 2564–2571, Nov 2011.
[RS03] Z. Rasheed and M. Shah. Scene detection in hollywood movies and tv shows. In Pro-ceedings of the 2003 IEEE Computer Society Conference on Computer Vision and PatternRecognition, volume 2, pages 343–348, June 2003.
[RS05] Z. Rasheed and M. Shah. Detection and representation of scenes in videos. IEEE Trans-actions on Multimedia, 7(6):1097–1105, December 2005.
[RUH+14] M. Roder, R. Usbeck, S. Hellmann, D. Gerber, and A. Both. N3 - a collection of datasetsfor named entity recognition and disambiguation in the nlp interchange format. In The9th edition of the Language Resources and EvaluationConference, 26-31 May, Reykjavik,Iceland, 2014.
[SLT+05] C.-W. Su, H.-Y.M. Liao, H.-R. Tyan, K.-C. Fan, and L.-H. Chen. A motion-tolerant dissolvedetection algorithm. IEEE Transactions on Multimedia, 7(6):1106–1113, 2005.
[Smi07] R. Smith. An Overview of the Tesseract OCR Engine. In ICDAR ’07: Proceedings of theNinth International Conference on Document Analysis and Recognition (ICDAR 2007) Vol2, pages 629–633, Washington, DC, USA, 2007. IEEE Computer Society.
[SMK+11] P. Sidiropoulos, V. Mezaris, I. Kompatsiaris, H. Meinedo, M. Bugalho, and I. Trancoso.Temporal video segmentation to scenes using high-level audiovisual features. IEEE Trans-actions on Circuits and Systems for Video Technology, 21(8):1163 –1177, August 2011.
[SMK14] P. Sidiropoulos, V. Mezaris, and I Kompatsiaris. Video tomographs and a base detectorselection strategy for improving large-scale video concept detection. IEEE Transactionson Circuits and Systems for Video Technology, 24(7):1251–1264, 2014.
[SN13] C. Sun and R. Nevatia. Large-scale web video event classification by use of Fisher vectors.In IEEE Workshop on Applications of Computer Vision, WACV, pages 15–22, ClearwaterBeach, FL, USA, January 2013.
c© LinkedTV Consortium, 2014 60/62

Visual, text and audio information analysis for hypervideo, final release D1.4
[SOA+13] D. Stein, A. Oktem, E. Apostolidis, V. Mezaris, J. L. Redondo Garcıa, M. Sahuguet, andB. Huet. From raw data to semantically enriched hyperlinking: Recent advances in thelinkedtv analysis workflow. In Proc. of NEM Summit, Nantes, France, October 2013.
[SPJ09] K. Seo, S. Park, and S. Jung. Wipe scene-change detector based on visual rhythm spec-trum. IEEE Transactions on Consumer Electronics, 55(2):831–838, May 2009.
[SQ11] B. Safadi and G. Quenot. Re-ranking by local re-scoring for video indexing and retrieval.In 20th ACM Int. Conf. on Information and Knowledge Management, pages 2081–2084,NY, 2011. ACM.
[SSF+13] C. G. M. Snoek, K. E. A. Van De Sande, D. Fontijne, A. Habibian, and M. Jain. MediaMillat TRECVID 2013 : Searching Concepts , Objects , Instances and Events in Video. 2013.
[SSS13] J. Schwenninger, D. Stein, and M. Stadtschnitzer. Automatic parameter tuning and ex-tended training material: Recent advances in the fraunhofer speech recognition system.In Proc. Workshop Audiosignal- und Sprachverarbeitung, pages 1–8, Koblenz, Germany,September 2013.
[SSSK14] M. Stadtschnitzer, J. Schwenninger, D. Stein, and J. Koehler. Exploiting the Large-ScaleGerman Broadcast Corpus to boost the Fraunhofer IAIS Speech Recognition System. InProc. Language Resources and Evaluation Conference (LREC), Reykjavik, Island, May2014.
[STV11] K. Sechidis, G. Tsoumakas, and I. Vlahavas. On the stratification of multi-label data.In Machine Learning and Knowledge Discovery in Databases, pages 145–158. Springer,2011.
[SW09] C. G. M. Snoek and M. Worring. Concept-Based Video Retrieval. Foundations and Trendsin Information Retrieval, 2(4):215–322, 2009.
[SWHL11] T. Schmidt, K. Worner, H. Hedeland, and T. Lehmberg. New and future developments inexmaralda. In Multilingual Resources and Multilingual Applications. Proceedings of theGSCL Conference, Hamburg, Germany, 2011.
[TMK08] E. Tsamoura, V. Mezaris, and I. Kompatsiaris. Gradual transition detection using colorcoherence and other criteria in a video shot meta-segmentation framework. In ImageProcessing, 2008. ICIP 2008. 15th IEEE International Conference on, pages 45 –48, oct.2008.
[Vap95] V. N. Vapnik. The nature of statistical learning theory. Springer-Verlag New York, Inc.,New York, NY, USA, 1995.
[Vap98] V. Vapnik. Statistical learning theory. New York: Willey, 1998.
[VdSGS10a] K. E. A. Van de Sande, T. Gevers, and C. G. M. Snoek. Evaluating color descriptorsfor object and scene recognition. IEEE transactions on pattern analysis and machineintelligence, 32(9):1582–1596, 2010.
[vdSGS10b] K. E. A. van de Sande, T. Gevers, and C. G. M. Snoek. Evaluating color descriptors forobject and scene recognition. IEEE Trans. Pattern Anal. Mach. Intell., 32(9):1582–1596,September 2010.
[VdSSS14] K. E. A. Van de Sande, C. G. M. Snoek, and A. W. M. Smeulders. Fisher and vlad withflair. In IEEE Conference on Computer Vision and Pattern Recognition, 2014.
[vGVSG10] J. C. van Gemert, C. J. Veenman, A. W. M. Smeulders, and J. M. Geusebroek. Visual wordambiguity. IEEE Trans. Pattern Anal. Mach. Intell., 32(7):1271–1283, September 2010.
[VNH03] A. Velivelli, C.-W. Ngo, and T. S. Huang. Detection of documentary scene changes byaudio-visual fusion. In Proceedings of the 2nd international conference on Image andvideo retrieval, CIVR’03, pages 227–238, Berlin, Heidelberg, 2003. Springer-Verlag.
c© LinkedTV Consortium, 2014 61/62

Visual, text and audio information analysis for hypervideo, final release D1.4
[WDL+08] J. Wang, L. Duan, Q. Liu, H. Lu, and J.S. Jin. A multimodal scheme for program segmen-tation and representation in broadcast video streams. IEEE Transactions on Multimedia,10(3):393–408, April 2008.
[WF05] I. Witten and E. Frank. Data Mining Practical Machine Learning Tools and Techniques.Morgan Kaufmann, San Francisco, second edition, 2005.
[WKSL13] H. Wang, A. Klaser, C. Schmid, and C.-L. Liu. Dense trajectories and motion boundarydescriptors for action recognition. Int. J. Computer Vision, 103(1):60–79, 2013.
[WM08] I Witten and David Milne. An effective, low-cost measure of semantic relatedness ob-tained from wikipedia links. Proceeding of AAAI Workshop on Wikipedia and ArtificialIntelligence: an Evolving Synergy, AAAI Press, Chicago, USA, pages 25–30, 2008.
[XXC+04] L. Xie, P. Xu, S.-F. Chang, A. Divakaran, and H. Sun. Structure analysis of soccer videowith domain knowledge and hidden markov models. Pattern Recogn. Lett., 25(7):767–775, May 2004.
[YEG+06] S. J. Young, G. Evermann, M. J. F. Gales, T. Hain, D. Kershaw, G. Moore, J. Odell, D. Ol-lason, D. Povey, V. Valtchev, and P. C. Woodland. The HTK Book, version 3.4. CambridgeUniversity Engineering Department, Cambridge, UK, 2006.
[YHM11] D. You, O. C. Hamsici, and A. M. Martinez. Kernel optimization in discriminant analysis.IEEE Trans. Pattern Anal. Mach. Intell., 33(3):631–638, March 2011.
[YKA08] E. Yilmaz, E. Kanoulas, and J. A. Aslam. A simple and efficient sampling method forestimating ap and ndcg. In 31st ACM SIGIR Int. Conf. on Research and Development inInformation Retrieval, pages 603–610, USA, 2008. ACM.
[YYL98] M. Yeung, B.-L. Yeo, and B. Liu. Segmentation of video by clustering and graph analysis.Computer Vision Image Understanding, 71(1):94–109, July 1998.
[ZKS93] H.J. Zhang, A. Kankanhalli, and S.W. Smoliar. Automatic partitioning of full-motion video.Multimedia Systems, 1(1):10–28, January 1993.
[ZL09] S. Zhu and Y. Liu. Video scene segmentation and semantic representation using a novelscheme. Multimedia Tools and Applications, 42(2):183–205, April 2009.
[ZMM99] R. Zabih, J. Miller, and K. Mai. A feature-based algorithm for detecting and classifyingproduction effects. Multimedia Systems, 7(2):119–128, March 1999.
[ZS06] Y. Zhai and M. Shah. Video scene segmentation using markov chain monte carlo. IEEETransactions on Multimedia, 8(4):686 –697, August 2006.
[ZWW+07] Y. Zhao, T. Wang, P. Wang, W. Hu, Y. Du, Y. Zhang, and G. Xu. Scene segmentationand categorization using N-cuts. In IEEE Conference on Computer Vision and PatternRecognition, CVPR ’07, pages 1–7, June 2007.
[ZYZH10] X. Zhou, K. Yu, T. Zhang, and T. S. Huang. Image classification using super-vector codingof local image descriptors. In 11th European Conf. on Computer Vision: Part V, ECCV2010, pages 141–154. Springer-Verlag, 2010.
c© LinkedTV Consortium, 2014 62/62