linkage between environmental outputs and human services
TRANSCRIPT

LINKAGES BETWEEN ENVIRONMENTAL OUTPUTS ANDHUMAN SERVICES
by
Richard A. ColeDepartment of Fishery and Wildlife Sciences
New Mexico State University
John B. LoomisDepartment of Agricultural and Resource Economics
Colorado State University
and
Timothy D. FeatherDonald T. Capan
of
Planning and Management Consultants, Ltd.Carbondale, IL 62903
for
U.S. Army Corps of EngineersInstitute for Water Resources
Alexandria, VA
U.S. Army Corps of EngineersWaterways Experiment Station
Environmental LaboratoryVicksburg, MS
Evaluation of Environmental IWR Report 96-R-4Investments Research Program February 1996

ii

iii
PREFACE
This study was conducted as part of the Evaluation of Environmental Investments ResearchProgram (EEIRP). The EEIRP is sponsored by Headquarters, U.S. Army Corps of Engineers(HQUSACE). It is jointly assigned to the U.S. Army Engineer Water Resources Support Center(WRSC), Institute for Water Resources (IWR), and the U.S. Army Engineer Waterways ExperimentStation (WES), Environmental Laboratory (EL). Mr. William J. Hansen of IWR is the ProgramManager and Mr. H. Roger Hamilton is the WES Manager. Program Monitors during this studywere Mr. John W. Bellinger and Mr. K. Brad Fowler, HQUSACE. The Field Review Groupmembers that provided overall Program direction and their District of Division affiliations were: Mr.David Carney, New Orleans; Mr. Larry M. Kilgo, Lower Mississippi Valley; Mr. Richard Gorton,Omaha; Mr. Bruce D. Carlson, St. Paul; Mr. Glendon L. Coffee, Mobile; Ms. Susan E. Durden,Savannah; Mr. Scott Miner, San Francisco; Mr. Robert F. Scott, Fort Worth; Mr. Clifford J. Kidd,Baltimore; Mr. Edwin J. Woodruff, North Pacific; and Dr. Michael Passmore, Walla Walla. Thework was conducted under the Monetary and Other Valuation Techniques Work Unit of EEIRP. Mr.Gerald D. Stedge of IWR is the Principal Investigator.
The work was performed by Planning and Management Consultants, Ltd. (PMCL), underTask Order 0013, Contract No. DACW72-94-D-0003. Dr. Richard A. Cole of New Mexico StateUniversity and Dr. John B. Loomis of Colorado State University were the authors in collaborationwith Dr. Timothy D. Feather and Mr. Donald T. Capan of PMCL.
This report contains a series of tables which link ecosystem outputs to human services andgoods. As such, they are quite detailed and may be difficult for the reader to digest. In an effort tomake the tables more accessible, and thus more useful within the planning process, IWR is currentlyinvestigating the feasibility of producing on-line hypertext versions of the tables.
The report was prepared under the general supervision at IWR of Mr. Michael R. Krouse,Chief, Technical Analysis and Research Division; and Mr. Kyle E. Schilling, Director, IWR; and atEL of Mr. H. Roger Hamilton, Chief, RAB; Dr. Robert M. Engler, Chief, NRD; and Dr. John W.Keeley, Director, EL.
At the time of publication of this report, Mr. Kyle E. Schilling was Acting Director of WRSCand Dr. Robert W. Whalin was Director of WES. Commander of WES was COL Bruce K. Howard,EN.

iv

v
TABLE OF CONTENTS
PREFACE . . . . . . . . . . . . . . . . . . . . . . . . . . . . . . . . . . . . . . . . . . . . . . . . . . . . . . . . . . . . . . . . iii
LIST OF FIGURES . . . . . . . . . . . . . . . . . . . . . . . . . . . . . . . . . . . . . . . . . . . . . . . . . . . . . . . . vii
LIST OF TABLES . . . . . . . . . . . . . . . . . . . . . . . . . . . . . . . . . . . . . . . . . . . . . . . . . . . . . . . . . ix
I. INTRODUCTION . . . . . . . . . . . . . . . . . . . . . . . . . . . . . . . . . . . . . . . . . . . . . . . . . . . . . . . 1BACKGROUND . . . . . . . . . . . . . . . . . . . . . . . . . . . . . . . . . . . . . . . . . . . . . . . . . . . . . 1PROJECT SCOPE AND INTENT . . . . . . . . . . . . . . . . . . . . . . . . . . . . . . . . . . . . . . . . 2STUDY APPROACH AND PHILOSOPHY . . . . . . . . . . . . . . . . . . . . . . . . . . . . . . . . 4
Systems Approach to Defining Environmental Outputs . . . . . . . . . . . . . . . . . . . 5Systems Interaction Between Ecology and Economics . . . . . . . . . . . . . . . . . . . 6
REPORT CONTENTS AND STRUCTURE . . . . . . . . . . . . . . . . . . . . . . . . . . . . . . . . 7
II. BASIC PRINCIPLES OF ECOLOGICAL SYSTEMS AND ENVIRONMENTALECONOMICS . . . . . . . . . . . . . . . . . . . . . . . . . . . . . . . . . . . . . . . . . . . . . . . . . . . . . . . 9BASIC ECOSYSTEM INTERACTIONS . . . . . . . . . . . . . . . . . . . . . . . . . . . . . . . . . . 9
System Characterization . . . . . . . . . . . . . . . . . . . . . . . . . . . . . . . . . . . . . . . . . . 9Energy and Material Flow . . . . . . . . . . . . . . . . . . . . . . . . . . . . . . . . . . . . . . . . 10Ecological Control of Flow Rates . . . . . . . . . . . . . . . . . . . . . . . . . . . . . . . . . . 11Management Impact Considerations . . . . . . . . . . . . . . . . . . . . . . . . . . . . . . . . 12Impact of Human Use . . . . . . . . . . . . . . . . . . . . . . . . . . . . . . . . . . . . . . . . . . . 13Ecosystem Context of Water Resource Interactions . . . . . . . . . . . . . . . . . . . . 13
Watershed Processes . . . . . . . . . . . . . . . . . . . . . . . . . . . . . . . . . . . . . . 13Cross-Watershed Processes . . . . . . . . . . . . . . . . . . . . . . . . . . . . . . . . . 17
ECONOMIC VALUES OF ECOSYSTEM SERVICES AND INDICATORS OFTHE DEMAND FOR ECOSYSTEM SERVICES . . . . . . . . . . . . . . . . . . . . . 18Services of Ecosystems . . . . . . . . . . . . . . . . . . . . . . . . . . . . . . . . . . . . . . . . . . 18Supply and Demand for Ecosystem Services . . . . . . . . . . . . . . . . . . . . . . . . . . 19Nonmarket Economic Values . . . . . . . . . . . . . . . . . . . . . . . . . . . . . . . . . . . . . 24NED Measures of the Economic Value of Ecosystem Services . . . . . . . . . . . . 25
SUMMARY . . . . . . . . . . . . . . . . . . . . . . . . . . . . . . . . . . . . . . . . . . . . . . . . . . . . . . . 27
III. ECOSYSTEMS-BASED SERVICES FOR PLAN FORMULATION . . . . . . . . . . . . . . 29TABLE PURPOSE IN PLANNING PROCESS . . . . . . . . . . . . . . . . . . . . . . . . . . . . 29ORGANIZATION AND SUMMARY OF TABLES . . . . . . . . . . . . . . . . . . . . . . . . . 87
Table Structure and Sequence . . . . . . . . . . . . . . . . . . . . . . . . . . . . . . . . . . . . . 88Morphology, Table III-7 . . . . . . . . . . . . . . . . . . . . . . . . . . . . . . . . . . . 88Water and Material Transport, Table III-8 . . . . . . . . . . . . . . . . . . . . . . 88Substrate,Table III-9, and Habitat Arrangement, Table III-10 . . . . . . . 88Water Quality, Table III-11, and Biological Quality,
Table III-12 . . . . . . . . . . . . . . . . . . . . . . . . . . . . . . . . . . . . . . . 89Indirect Effects and Feedback . . . . . . . . . . . . . . . . . . . . . . . . . . . . . . . . . . . . . 89
vi
TABLE OF CONTENTS (Continued)
APPLICATION ISSUES FOR PLANNING . . . . . . . . . . . . . . . . . . . . . . . . . . . . . . . 90Basic Steps . . . . . . . . . . . . . . . . . . . . . . . . . . . . . . . . . . . . . . . . . . . . . . . . . . . 90Refining List of Service Categories for Analysis . . . . . . . . . . . . . . . . . . . . . . . 90Illustrative Application of Linkage Tables . . . . . . . . . . . . . . . . . . . . . . . . . . . . 93
Planning Setting . . . . . . . . . . . . . . . . . . . . . . . . . . . . . . . . . . . . . . . . . 93Hypothetical Site and Project Description . . . . . . . . . . . . . . . . . . . . . . 94Candidate Ecosystem Outputs and Human Services . . . . . . . . . . . . . . 94Screening Criteria for Further Analysis . . . . . . . . . . . . . . . . . . . . . . . . 112
Legal . . . . . . . . . . . . . . . . . . . . . . . . . . . . . . . . . . . . . . . . . . . . 113Demand . . . . . . . . . . . . . . . . . . . . . . . . . . . . . . . . . . . . . . . . . . 113Importance of Stakeholders . . . . . . . . . . . . . . . . . . . . . . . . . . . 113Determination of Meaningful Differences Across
Alternatives . . . . . . . . . . . . . . . . . . . . . . . . . . . . . . . . . 114Data Availability . . . . . . . . . . . . . . . . . . . . . . . . . . . . . . . . . . . 114
Final Thoughts on Application . . . . . . . . . . . . . . . . . . . . . . . . . . . . . . . . . . . . 114CLOSING DISCUSSION . . . . . . . . . . . . . . . . . . . . . . . . . . . . . . . . . . . . . . . . . . . . . 115
GLOSSARY . . . . . . . . . . . . . . . . . . . . . . . . . . . . . . . . . . . . . . . . . . . . . . . . . . . . . . . . . . . . . 117
REFERENCES . . . . . . . . . . . . . . . . . . . . . . . . . . . . . . . . . . . . . . . . . . . . . . . . . . . . . . . . . . . 122
APPENDIX: ECOSYSTEM PROCESSES UNDERLYING ECOLOGICAL OUTPUTS . . 128

vii
LIST OF FIGURES
Figure I-1 Plan Formulation Steps . . . . . . . . . . . . . . . . . . . . . . . . . . . . . . . . . . . . . . . . . . . . 4
Figure II-1 General Pathways by which Materials are Transported Among Ecosystems,Including Ecosystems Targeted by Project Consideration . . . . . . . . . . . 10
Figure II-2 General Pathways Identified in Figure II-1 Applied to a Reservoir-Based SystemTargeted for Project Consideration . . . . . . . . . . . . . . . . . . . . . . . . . . . . 11
Figure II-3 General Relationships Existing Among Corps Water Resource Categories Used in the Linkage Tables . . . . . . . . . . . . . . . . . . . . . . . . . . . . . . . . . 15Figure II-4 Supply-Demand Curves Regarding Environmental Restoration Opportunities . . 22
Figure III-1 Relations Between Ecological Output Categories Either Directly or IndirectlyInfluenced by Corps Management . . . . . . . . . . . . . . . . . . . . . . . . . . . . . 30
Figure III-2 Criteria for Selection of Candidate Services for Valuation of Restoration Efforts . . . . . . . . . . . . . . . . . . . . . . . . . . . . . . . . . . . . . . . . . . . . . . . . . 92

viii

ix
LIST OF TABLES
Table I-1 EEIRP Work Units . . . . . . . . . . . . . . . . . . . . . . . . . . . . . . . . . . . . . . . . . . . . . . 2
Table III-1 Ecological Outcomes and Services Directly Affected by Watershed, Basin,and Channel Morphological and Topographic Process . . . . . . . . . . . . . 32
Table III-2 Ecological Outcomes and Services Directly Affected by Water and MaterialTransport Process Including USACE Impact on EcosystemTransport Process . . . . . . . . . . . . . . . . . . . . . . . . . . . . . . . . . . . . . . . . 37
Table III-3 Ecological Outcomes and Services Directly Affected by Substrate Includingthe USACE Impacts on Substrate . . . . . . . . . . . . . . . . . . . . . . . . . . . . 38
Table III-4 Ecological Outcomes and Services Directly Affected by Habitat Arrange-ment and Landscape Process Including USACE Impacts onLandscape . . . . . . . . . . . . . . . . . . . . . . . . . . . . . . . . . . . . . . . . . . . . . . 39
Table III-5 Ecological Outcome and Service Directly Affected by Water and SedimentQuality Including USACE Impacts on Quality Factors . . . . . . . . . . . . 41
Table III-6 Ecological Outputs and Services Directly Affected by Biological Qualities,Including USACE Impact on Biological Qualities . . . . . . . . . . . . . . . . 44
Table III-7 Ecological Outcomes and Services Affected by Watershed, Basin,and Channel Morphological and Topographic Process . . . . . . . . . . . . . 46
Table III-8 Ecological Outcomes and Services Affected by Water and MaterialTransport Process Including USACE Impact on EcosystemTransport Process . . . . . . . . . . . . . . . . . . . . . . . . . . . . . . . . . . . . . . . . 56
Table III-9 Ecological Outcomes and Services Affected by Substrate Including theUSACE Impacts on Substrate . . . . . . . . . . . . . . . . . . . . . . . . . . . . . . . 59
Table III-10 Ecological Outcomes and Services Affected by Habitat Arrangementand Landscape Process Including USACE Impacts on Landscape . . . . 64
Table III-11 Ecological Outcome and Service Affected by Water and SedimentQuality Including USACE Impacts on Quality Factors . . . . . . . . . . . . 70
Table III-12 Ecological Outputs and Services Affected by Biological Qualities,Including USACE Impact on Biological Qualities . . . . . . . . . . . . . . . . 78
Table III-13 Illustrative Example: Direct Ecosystem Impacts and Candidate HumanServices . . . . . . . . . . . . . . . . . . . . . . . . . . . . . . . . . . . . . . . . . . . . . . . . 95
Table III-14 Illustrative Example: Indirect Ecosystem Impacts and Candidate HumanServices . . . . . . . . . . . . . . . . . . . . . . . . . . . . . . . . . . . . . . . . . . . . . . . 101

x

1
I. INTRODUCTION
BACKGROUND
A critical part of planning for environmental restoration projects is assessing the impacts ofalternative plans. There are many dimensions to this assessment that are critical to formulating themost appropriate (socially, environmentally, etc.) alternative plan. Among these aspects are twofoundational elements that require evaluation: the ecologic impacts and the resultant socioeconomiceffects. Ecology and economics are academic disciplines in their own right and are supported by vastliteratures. Each has displayed varying degrees of success in pragmatic application, such as what isrequired for U.S. Army Corps of Engineers (Corps or USACE) environmental plan formulation.Building a bridge between these two disciplines, ecology and economics, in support of environmentalplan formulation is the aim of this study.
The Corps civil works mission is to support national economic development. This necessarilybrings economics into the analytical picture for project justification and plan formulation. Projectsthat produce benefits that outweigh costs of construction and maintenance have traditionally beenviewed favorably in the Corps and Congress. Although there has been considerable debate inacademic circles about the potential measures of benefit-cost analysis, the Corps and other agencieshave generally found it both useful and appropriate for making investment and management decisions.
Complications arise when project outputs are not readily measurable in monetary terms, whichis a very common situation for environmental restoration projects. The benefits associated withenvironmental improvement often cannot readily be measured)or more specifically, there are nostandard methods used by Corps planners to place economic values on improvements to theenvironment. Although traditional Corps projects, such as flood control and navigation, are readilysupported through Corps-developed analytical techniques for benefits calculations, suitable technicalsupport is lacking in the case of environmental projects, which is one of the chief motivations of theCorps Evaluation of Environmental Investments Research Program (EEIRP).
The EEIRP is an aggressive research effort set out by the Corps Institute for Water Resourcesand Waterways Experiment Station to develop analytical methods and models to determineobjectives, measure outputs, and analyze cost-effectiveness in support of an evaluation frameworkfor environmental investment decisions. The formal direction of the EEIRP is to develop analyticaltools to assist planners, managers, and regulators in addressing the following two questions, referredto as the "site" and "portfolio" questions, respectively:
(1) How can the Corps determine whether the recommended action from a range ofalternatives is the most desirable in terms of the environmental objective beingaddressed?
(2) How should the Corps allocate limited resources among many “most desirable”environmental investment decisions?

2
These questions are underlain by many issues of ecology and economics. These twodisciplines provide essential theoretical platforms for addressing the site and portfolio questions, andelements of ecology and economics can be seen in almost all the EEIRP work units shown in TableI-1.
TABLE I-1
EEIRP WORK UNITS
C Determining and Describing Environmental SignificanceC Determining Objectives and Measuring OutputsC Objective Evaluation of Cultural ResourcesC Engineering Environmental InvestmentsC Cost-Effectiveness Analysis TechniquesC Monetary and Other Valuation TechniquesC Incorporating Risk and Uncertainty into Environmental EvaluationC Environmental Databases and Information ManagementC Evaluation Framework
This research was conducted under the EEIRP work unit Monetary and Other Valuation Techniques.The objectives of this work unit are:
C To identify relevant socioeconomic use and nonuse values associated withenvironmental projects
C To improve the linkages between environmental output measures and necessary inputsfor socioeconomic evaluation
C To develop, test, and provide guidance with regard to monetary and nonmonetaryevaluation techniques
C To develop a greater understanding of the decision processes of USACE projectstakeholders.
PROJECT SCOPE AND INTENT
The present study focuses on the linkage improvement objective shown above for theMonetary and Other Valuation Techniques work unit. Publications resulting from research conductedwithin this work unit, (Russell 1992; Feather et al. 1995) cover many of the important foundationalelements of the ecology-economics linkage challenge. The ultimate goal of the EEIRP is to produce"how-to" manuals that can aid Corps planners involved with development of environmental projects.

3
This study creates linkages based upon contemporary biological and economic thinking and servesas an entree into the procedures manuals. The specific research question addressed in this report is:
What are the possible changes in the ecosystem that may result from Corpsenvironmental mitigation and restoration projects, and what outputs and services dothese changes provide society?
Forging an understanding of the effectiveness, both biological and sociological, of Corpsenvironmental improvements is critical to effective planning. Without an ability to predict theeffectiveness of management actions, the Corps is severely limited in making decisions for allocatingfunds among proposed projects. For water management decisions, outcome prediction is based onthe understanding of systematic cause-and-effect relations defined by physical, chemical, biological,and sociological processes, once appropriate input information is made available. Ecological andmanagement processes generate intermediate ecological outputs, which serve as inputs for otherprocesses and for the ultimate outcome, which is typically human benefit.
Environmental restoration is a relatively recent addition to the well-established Corps civilworks mission. The Corps uses its resources to respond to those local project proposals that bestserve the national interest. To successfully pursue this mission, the Corps must be able to link theecological outputs of environmental management to human services and benefits provided at the localand national levels. The intent of this report is to identify categories of ecological outputs that mightresult from projects developed anywhere under Corps authority and to illustrate how those outputsprovide human services and benefits in general form. This report does not address project-specificdetails for design features. Rather, it provides a checklist of outputs and services that can beconsidered at the project level, thus guiding the development of site-specific information.
In terms of the Corps environmental plan formulation process (see Figure I-1), this studydirectly supports the fourth step, estimate effects of alternatives. The tools and methodsidentified in this report are important to other elements of the process, especially comparealternatives. Some of the theoretical perspectives provided in this report, particularly theecological systems approach, could also be very useful in the earlier plan formulation steps suchas problem definition and objective formulation.

4
FIGURE I-1PLAN FORMULATION STEPS
STUDY APPROACH AND PHILOSOPHY
Few studies prior to the present have undertaken such an aggressive effort toward bridgingthe gap between ecology and economics. However, each discipline has addressed thisinterdisciplinary challenge in some forum. For example, economics offers several journals such asEnvironmental and Resource Economics. In Feather et al. (1995) academicians representing thefields of ecology, economics, engineering, and psychology offered their perspectives on Corpsevaluation challenges for environmental projects:
While no agency, academic discipline, or research entity can claim the “right answer”to the environmental restoration challenge, the Corps seeks to uncover, organize, andbuild upon the foundations of existing approaches to better understand which canreasonably be used and is open to well-established recommendations on an approachto the problem.
This study utilizes an interdisciplinary approach but with a sharp focus on the central elementof the challenge, the link between ecological effects and socioeconomic impacts. Russell et al.

5
(1992), which offered an environmental valuation research agenda, made strong suggestions for aclearer link between ecological and economic impacts. This study responds directly to therecommendations offered in Feather et al. (1995):
The panel of experts shared their diverse perspectives on the services and outputs thatecosystems provide to society and how they could be addressed in the environmentaldecision process. The lists of outputs developed by the expert panel members, whileproviding an excellent starting point for future research, are not uniform enough topermit the development of guidance on monetary valuation and nonmonetaryevaluation protocols. Thus, it is recommended that a hierarchical structured list ofecosystem outputs and services that might arise from possible Corps mitigation andrestoration projects be developed.
In this vein, a research team, led by an applied biologist and supported closely by a resourceeconomist, began developing a list of ecosystem and socioeconomic outputs resulting from Corpsrestoration endeavors. At a critical juncture of the project, the research team was given access to aninteragency team of environmental practitioners to gain perspectives and insights on the direction ofthe product. Along with commentary on specific details of the preliminary products, the interagencyteam offered counsel as to how this product and its descendant products could be used in the planningprocess.
Identification of the basis for portrayal of ecosystems that could readily link to economicanalysis while maintaining integrity to the biology community received a great deal of attention.Compromises had to be made to accommodate the pragmatic draw of the intended research tools.For example, describing an ecosystem in a static form such as tables was considered less than optimalfrom the biological perspective because of the numerous interrelationships and dynamic nature of anecosystem. However, in light of the need for pragmatic inputs for further analysis and review,ecosystem specificity was reduced, and tables were created that form the basis of this researchproduct. Other important ideological positions were formed that set the stage for the resultantproducts and are discussed below.
Systems Approach to Defining Environmental Outputs
Ecological outputs from management activities are typically diverse, often unexpected, andmore numerous than can be cost-effectively monitored. Ecological outputs include many differentphysical, chemical, and biological manifestations of ecosystem processes; most prominently, theabundance and renewal rates of desired species, sequestering and export of various water transportedmaterials, and biological integrity of ecosystems. Targeting the most appropriate outcome categoriesand the most desirable output levels for decision criteria is a prerequisite for the most effectivemanagement. There is an effort currently being conducted through the EEIRP's DeterminingObjectives and Measuring Outputs work unit that identifies important environmental parameters forproject planning and available models that can be used to measure the parameters.
Criteria targeted by past water-based environmental policy analyses have emphasized specificmaterial or species outputs, or select groups of outputs, such as suspended sediment, salinity, oxygen,

6
heat, food, endangered species, waterfowl, and sport fish. Policy analyses relied on indices that linkhabitat conditions to water-quality status or individual-species status, often through model predictionsof habitat suitability or more generic indicators of habitat quality. More recently, policy has inclinedtoward a more holistic and diffuse view, seeking criteria more representative of diverse ecosystemfunctions and their sustainability. Ecosystem functions include those processes that directly affecthuman welfare as well as those that indirectly affect future human welfare by sustaining futureecosystem functions.
Present practice in the Corps relies heavily on the use of HEP-based (habitat evaluationprocedures) techniques for describing the environmental status of the project at hand, mainly becausethey are readily available and widely used. Feather and Capan (1995) describe the present planningperspective based on case studies of ten Corps environmental projects:
HEP has been applied many times to describe the outputs of a wetland of anenvironmental region, and the model has also been revised quite often or adapted fora particular case. Despite the popularity of these models, there is general agreementthat they do not adequately represent the environmental system affected by theproposed project.
The results of this study provide more opportunities for identifying potential ecological andsocioeconomic impacts of a project. This, in turn, gives additional information to support and/orprovide a better explanation of HEP results as part of project evaluation. A more robust accountingof the impacts of restoration projects could garner added support from project partners that oftenpossess a range of perspectives to be accommodated in the proposed project. It could lead towardcloser examination of project alternatives and better project design.
The previous narrow focus on species-centered production quotas (e.g., trees harvested,waterfowl use days, sport-fish catch rates), models, and indices has widened to encompass indicesof ecosystem diversity and integrity. Ecosystem integrity suggests wholeness needed to sustaindiverse ecological outputs, some of which have no present use value. Ecosystem integrity andorganism health are often treated as analogous concepts, but the concept of ecosystem health canimply "superorganism" attributes without scientific foundation. Therefore, the term is avoided here.To the extent that functional wholeness sustains a full set of future output options, the concept ofecosystem integrity probably incorporates the primary concern associated with the concept ofecosystem health (see Ryder 1990). Evaluation procedures have responded to a limited extent tocontemporary need for better indices of ecosystem integrity. HEP, for example, has been modifiedto incorporate broader measures of wetlands condition than indicated by a single species (Adamuset al. 1991; Schroeder et al. 1993). Yet the complexity of ecosystem processes and integrity mostlyremains beyond capture in existing indices. Those wishing to link ecological outputs to humanservices need an appreciation for that complexity to avoid promoting inappropriate decisions.
Systems Interaction Between Ecology and Economics
One intent of this report is to illustrate how indicators of ecosystem functions, such as speciesdiversity and biological integrity, are conceptually related to specific ecological outputs and economic

7
outcomes. This discussion is intended to facilitate a more integrated systems approach tounderstanding the links that exist between ecological outputs and human services. Some of thisdiscussion is presented in Chapter II; detailed discussion is presented in the Appendix. The goal isto develop a tool, in table format, that would impart the systems nature of links as well as list theecological outputs and human services of concern.
From a management perspective, an important advantage of water quality and habitatsuitability indices is their identification of input parameters that can be targeted as measurableecological outputs resulting from environmental restoration, impact, or mitigation. Such simpleindices, however, do not always appear logically connected to ecosystem processes, other importantoutputs, or water management tactics. This is especially applicable to decision makers who are onlybroadly familiar with the specialized sciences that constitute the field of environmental science. Thusthe reason for this present study, as stated earlier, is to develop an ecosystem basis for the selectionof ecological outputs relevant to water management decision making and to connect those outputsto human services and economic value, most often through indirect effects.
REPORT CONTENTS AND STRUCTURE
The general model that is followed in this study takes typical Corps restoration activities,identifies possible effects (both direct and indirect) on the ecosystem resulting from the Corps action,then ties socioeconomic impacts (e.g., NED benefit categories) to each ecosystem effect. The reportcan guide the Corps planning team in developing an extensive list of impacts to pursue in the planformulation and justification process. Factors such as planning budget, political setting, fundingauthority, and local preferences will influence the ultimate choice of project outputs that the planningteam will fully develop.
The contents of the report converge on a set of tables in Chapter III that provide a cross-referencing between Corps-influenced input for environmental restoration projects, their potentialecological effects, and the associated human services. Corps input is the management approach usedto effect a physical change in an ecosystem. The outputs and benefits of a management approach donot always result from a direct action, such as taking steps that control erosion that indirectly benefitssubstrate in an aquatic community. The detailed structure and content of the tables are described inChapter III. Also provided in Chapter III are the procedures for using the tables, which aresupported by an illustrative example.
Chapter II serves as theoretical background to the tables in Chapter III. It is essentially aprimer on systems ecology and economics. The first part of the chapter covers the general principlesof ecosystems and highlights features that have important implications to Corps restoration planning.Interaction among water resource types in a watershed system is discussed. The rest of Chapter IIdescribes the basic principles of economics and some of the related application issues in defining valueof ecosystem goods and services. Both sections in Chapter II are laced with technical terms andjargon that the authors have attempted to define. Entire books are written on each of these chapters(many of which are referenced) thus presenting the challenge of surfacing the right combination ofterms and concepts. Readers are encouraged to spend time studying Chapter II. This will

8
appropriately allow one to understand and employ the linkage tables efficiently and will promote afuller understanding of the tables' inherent strengths and limitations.
The Appendix provides important foundational material for the ecological principles advancedin Chapter II. Critical topics such as energetics, diversity, and ecosystems size are technicallydescribed and the implications of Corps management is highlighted. A Glossary has been providedfor the explanation of technical terms.

9
II. BASIC PRINCIPLES OF ECOLOGICALSYSTEMS AND ENVIRONMENTAL ECONOMICS
The model and tables provided in Chapter III are the ultimate product of this research effortand represent a matured version of many important ecological and economic ideas. The tables (III-7through III-12), while useful to the casual reader, provide significantly more utility to the planner thathas a reasonable grasp of the theoretical concepts supporting the tables.
Chapter II is dedicated to providing important ecological and economic concepts. Basicecosystem interactions are defined, including human influences. Energy and material flows thatconvert ecosystems are described. A section dedicated to large-scale interaction and relatedwatershed processes is provided.
The concepts behind translating environmental restoration impacts from ecological effects tovalued socioeconomic goods and services are the subject of the second half of Chapter II. The fieldof economics provides numerous tools and conceptual frameworks for addressing valuation issues.This section reviews selected economic concepts and discusses their importance as related toecosystem goods and services. A detailed and involved discussion of advanced ecosystem topics isprovided in the Appendix.
BASIC ECOSYSTEM INTERACTIONS
System Characterization
Figure II-1 demonstrates basic ecosystem interactions, incorporating management strategiesas well as other human impacts, and Figure II-2 places these general interactions into more concretewater resource terms. The symbols used in the flowcharts are defined below and are described inmore detail by Grant (1986). In Figures II-1 and II-2, targeted ecosystems, in which potentialprojects are situated, are manageable states (state variables are in rectangles) that vary through timeand culminate at some future planning endpoint according to planning needs. The appropriatefineness of the time step used in analysis depends on prediction purposes and data availability. Thetargeted ecosystems in Figure II-1 include a large set of unidentified subsystems, each of whichfunctions based on energy and material inputs from other ecosystems.
A newly constructed reservoir, for example (Figure II-2), includes many subsystems, each ofwhich is an ecosystem. Major ecosystem divisions often are defined by habitat, natural communities,and the role of humans in the system. The new reservoir may develop subsystems of marshes,swamps, pelagic plankton, and tributary streams. Within each system a unique natural communitydevelops and changes over time. Individual marshes around the reservoir margin may be separatedby large expanses of pelagic habitat, yet be routinely interconnected through fish and waterfowlmovement and through exchange of water-transported nutrients and

OtherEcosystems
EcologicalForces
Mgt
Nat
HumanBenefits
Socio-ecological
Forces
Mgt
Nat
TargetedEcosystems
EcologicalForces
Mgt
Nat
OtherEcosystems
Time t
OtherEcosystems
EcologicalForces
Mgt
Nat
HumanBenefits
Socio-ecological
Forces
Mgt
Nat
TargetedEcosystems
EcologicalForces
Mgt
Nat
OtherEcosystems
Time t...1 n
1. Elliptical symbols indicate either sources or sinks for materials, including human use. Rectangles indicate state variables, which export and trapmaterials that sustain or threaten ecological functions. Diamonds indicate driving variables, which export material flows at control points (bow ties onthe flow lines). Driving variables are modified by augmentation variables in the circles (mgt = management variables; nat = natural variables). The twolarge boxes defined by dashed lines enclose ecosystem states at some initial time and some terminal time.
10
FIGURE II-1GENERAL PATHWAYS BY WHICH MATERIALS ARE TRANSPORTED1
AMONG ECOSYSTEMS, INCLUDING ECOSYSTEMS TARGETEDBY PROJECT CONSIDERATION
organic matter. As water levels change in that reservoir, the extent of each subsystem communityalso will change, usually in nonlinear ways, as will the intensities of interactions among thecommunities. Targeted populations can serve to identify ecosystem dimensions, which will differdepending on whether the population is composed of mallards, largemouth bass, cypress, orotherwise.
Energy and Material Flow
Energy and material flows connect ecosystems. In Figure II-1, materials move from "source"ecosystems to the targeted ecosystem and from the targeted ecosystem to "sink" ecosystems (sourcesand sinks are symbolized by ellipses or rectangles with rounded ends). Material transport by water

11
is the main process by which materials are moved to, from, and through ecosystems. Although muchtransport remains inobvious within biological processes, fluvial transport is more evident and moredirectly affected by Corps activity.
Ecological Control of Flow Rates
Ecological forces drive rates of material flows among ecosystems, such as material outputfrom the reservoir watershed, control of reservoir inputs of nutrients, sediments, and contaminants(diamond symbols are driving variables in Figures II-1 and II-2). Depending on the dimensions of
12
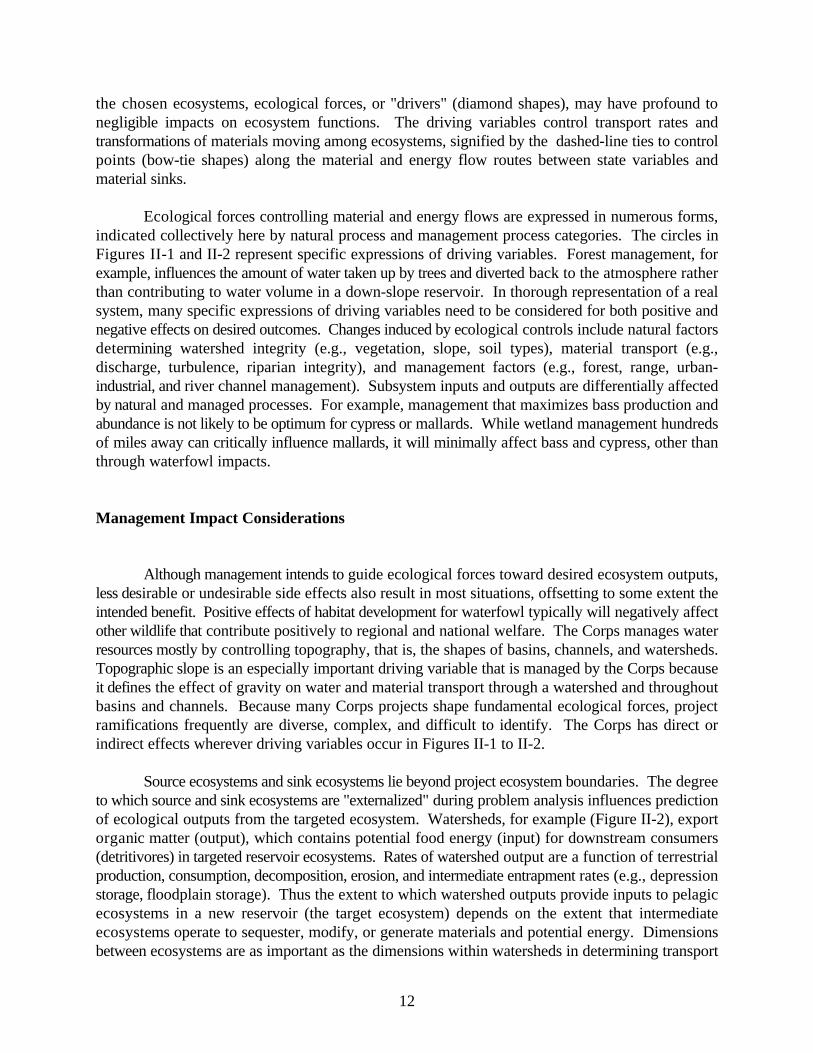
the chosen ecosystems, ecological forces, or "drivers" (diamond shapes), may have profound tonegligible impacts on ecosystem functions. The driving variables control transport rates andtransformations of materials moving among ecosystems, signified by the dashed-line ties to controlpoints (bow-tie shapes) along the material and energy flow routes between state variables andmaterial sinks.
Ecological forces controlling material and energy flows are expressed in numerous forms,indicated collectively here by natural process and management process categories. The circles inFigures II-1 and II-2 represent specific expressions of driving variables. Forest management, forexample, influences the amount of water taken up by trees and diverted back to the atmosphere ratherthan contributing to water volume in a down-slope reservoir. In thorough representation of a realsystem, many specific expressions of driving variables need to be considered for both positive andnegative effects on desired outcomes. Changes induced by ecological controls include natural factorsdetermining watershed integrity (e.g., vegetation, slope, soil types), material transport (e.g.,discharge, turbulence, riparian integrity), and management factors (e.g., forest, range, urban-industrial, and river channel management). Subsystem inputs and outputs are differentially affectedby natural and managed processes. For example, management that maximizes bass production andabundance is not likely to be optimum for cypress or mallards. While wetland management hundredsof miles away can critically influence mallards, it will minimally affect bass and cypress, other thanthrough waterfowl impacts.
Management Impact Considerations
Although management intends to guide ecological forces toward desired ecosystem outputs,less desirable or undesirable side effects also result in most situations, offsetting to some extent theintended benefit. Positive effects of habitat development for waterfowl typically will negatively affectother wildlife that contribute positively to regional and national welfare. The Corps manages waterresources mostly by controlling topography, that is, the shapes of basins, channels, and watersheds.Topographic slope is an especially important driving variable that is managed by the Corps becauseit defines the effect of gravity on water and material transport through a watershed and throughoutbasins and channels. Because many Corps projects shape fundamental ecological forces, projectramifications frequently are diverse, complex, and difficult to identify. The Corps has direct orindirect effects wherever driving variables occur in Figures II-1 to II-2.
Source ecosystems and sink ecosystems lie beyond project ecosystem boundaries. The degreeto which source and sink ecosystems are "externalized" during problem analysis influences predictionof ecological outputs from the targeted ecosystem. Watersheds, for example (Figure II-2), exportorganic matter (output), which contains potential food energy (input) for downstream consumers(detritivores) in targeted reservoir ecosystems. Rates of watershed output are a function of terrestrialproduction, consumption, decomposition, erosion, and intermediate entrapment rates (e.g., depressionstorage, floodplain storage). Thus the extent to which watershed outputs provide inputs to pelagicecosystems in a new reservoir (the target ecosystem) depends on the extent that intermediateecosystems operate to sequester, modify, or generate materials and potential energy. Dimensionsbetween ecosystems are as important as the dimensions within watersheds in determining transport

13
process and rate. Although water is a main avenue by which materials are transported, otherpathways may be important, including animal migration and aerial transport.
Management of targeted ecosystems produces ecological outputs that have both positive andnegative outcomes in the form of social service and benefit. Ecosystems include human users andconsumers, who affect ecological outputs as much if not more than other ecosystem elements.Humans benefit from both natural and managed processes, depending on their demand for the outputand output scarcity. Demand is a key driving variable that depends on human perception of need.The extent to which people collectively perceive benefit also contributes to determining the extentto which they continue to support management policies.
Impact of Human Use
Rates of resource use by people also directly influence functions of a targeted ecosystem.Most obviously, consumptive use of ecological outputs, such as fish and waterfowl species, has adirect impact on the abundance and production of those populations. While nonconsumptive use alsocontributes to determining natural and ecological processes, it may have a direct affect on the targetedecosystems. For example, catch-and-release fisheries increase fish mortality even though no fish areconsumed by humans in the process. When a policy decision is made to protect a particular species,for whatever reason, including nonuse values, there may often be effects (both positive and negative)on other species.
Ecosystem Context of Water Resource Interactions
Use of the tables in Chapter III for identifying ecological linkages to human services shouldencourage a wider ecosystem perspective of project dimensions than might otherwise be considered.Further appreciation of large-scale ecosystem interactions may help table users to understand tablecontent. The following section employs the systems perspectives presented earlier and discusses theinteraction between types of water resources in a watershed context. This type of systems thinkingis directly applicable to the Corps watershed planning philosophy.
Watershed Processes
Projects often are characterized in terms of their water resource category. However, projectsmay have numerous off-site effects, or projects may perform with varying success, depending on howthey are impacted by off-site processes. Broader awareness of large-scale cumulative processesresulting from past water management activity also may aid definition of the "most desirable"environmental investments via restoration projects. The most common ties among projects and off-site conditions are watershed processes (Figure II-3). Project ecological outputs are various,including intended and unintended outputs both on and off the project site. Deciding the location of

14
project development goes a long way in determining the extent to which ecological outputs occur offsite in other water resource areas. The tables need to be used while considering links to off-siteconditions.
Project position along watershed gradients signals potential for off-site impacts, which mayeither bolster or diminish the benefits derived from on-site outputs. The force of gravity operatingon water and material running over a slope is a primary determinant of ecological outputdisplacement. Wind and tide also are critical forces for material transport and off-site consequencesof project activity such as, most obviously, sediment displacement.
The general watershed relationship of the six basic water resource categories are schematicallyshown in Figure II-3. Among these categories, wetlands probably are most diverse and the mostdiffusely positioned in the watershed. Each of the other water resource categories often have uniquewetland associations, which add to the variety of water resource attributes. Maximization of projectenvironmental benefits both on and off site depends on understanding watershed-based and otherenvironmental connections. It also depends on recognition of more specific water resource attributesthan are illustrated here. But project planners should be aware of watershed relationships and thesecondary role of wind and tides in transporting project effects to distant water resource areas.
Although Corps project activities rarely incorporate whole watersheds, all projects influencewatersheds draining to the project water body or to other locations. The watershed is the primalwater resource, the source of all down-slope water except for on-site precipitation or pumped water.Watershed flows include both surface and groundwater. Subsurface water emerges at springs andseeps, which initiate and sustain rivers and diverse wetlands. These wetlands may be extensive butoften form little more than pocket marshes and bogs. Wetlands may drain at the surface to otherwater resource areas, or they may recharge groundwaters, which remain in place or drain throughsubsurface routes, emerging somewhere down slope. The form and amounts of material transportto down-slope locations greatly depend on the extent and speed that water moves over erosivesurfaces and through filtering substrates.
Riverine systems include river channels and floodplains. In upper, steeper watersheds,floodplains usually are narrow or nonexistent. Many of the smallest riverine systems haveephemeral or intermittent runoff, especially in arid watersheds. Wetlands associated with upper-watershed riverine systems most usually form the natural or artificial damming of streamflows ordiversions into natural depressions or excavations. Beaver activity is a common source of upper-watershed wetlands associated with riverine systems. In arid areas, earthen stock tanks are thehuman-built equivalent. Because groundwater is limited or transitory in narrow valleys, such wetlands are sustained by riverine flow or by precipitation where it exceeds or equalsevapotranspiration. Wetland character therefore much depends on the quality of river water,especially the amount of suspended sediment and its nutrient and contaminant content. Manyupper watershed wetlands have been filled or altered by tributary-quality changes, especially inareas with high human population density.

15
16
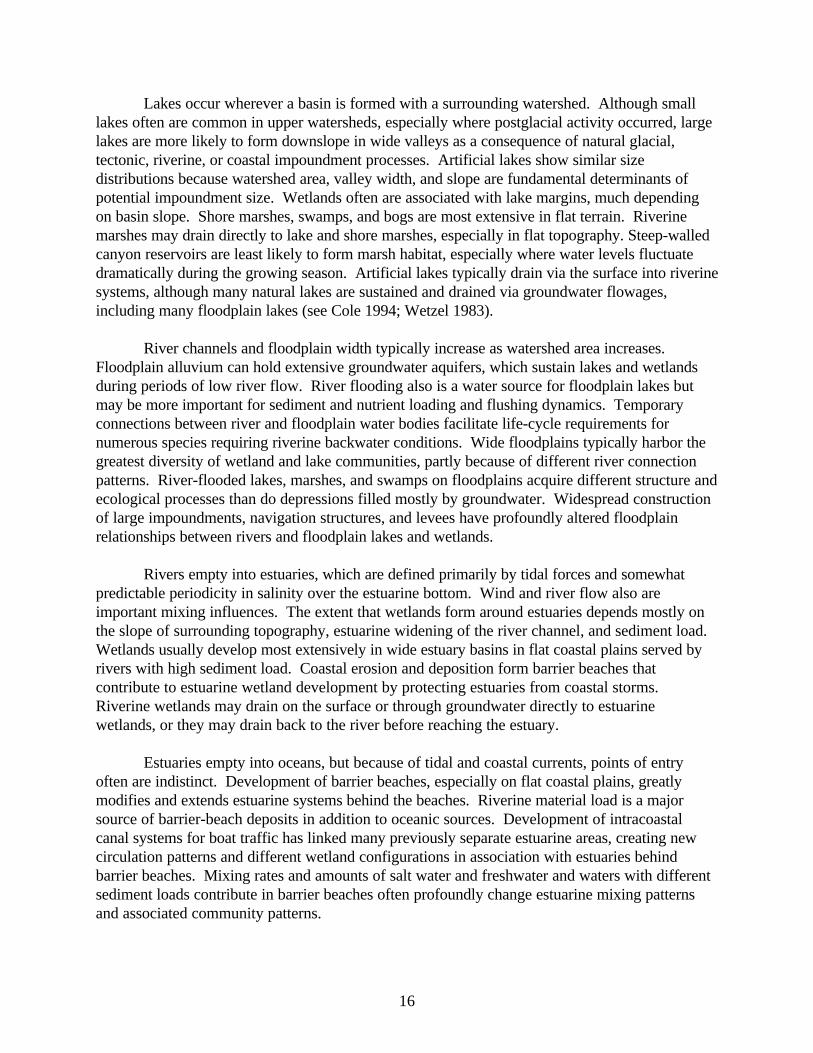
Lakes occur wherever a basin is formed with a surrounding watershed. Although smalllakes often are common in upper watersheds, especially where postglacial activity occurred, largelakes are more likely to form downslope in wide valleys as a consequence of natural glacial,tectonic, riverine, or coastal impoundment processes. Artificial lakes show similar sizedistributions because watershed area, valley width, and slope are fundamental determinants ofpotential impoundment size. Wetlands often are associated with lake margins, much dependingon basin slope. Shore marshes, swamps, and bogs are most extensive in flat terrain. Riverinemarshes may drain directly to lake and shore marshes, especially in flat topography. Steep-walledcanyon reservoirs are least likely to form marsh habitat, especially where water levels fluctuatedramatically during the growing season. Artificial lakes typically drain via the surface into riverinesystems, although many natural lakes are sustained and drained via groundwater flowages,including many floodplain lakes (see Cole 1994; Wetzel 1983).
River channels and floodplain width typically increase as watershed area increases. Floodplain alluvium can hold extensive groundwater aquifers, which sustain lakes and wetlandsduring periods of low river flow. River flooding also is a water source for floodplain lakes butmay be more important for sediment and nutrient loading and flushing dynamics. Temporaryconnections between river and floodplain water bodies facilitate life-cycle requirements fornumerous species requiring riverine backwater conditions. Wide floodplains typically harbor thegreatest diversity of wetland and lake communities, partly because of different river connectionpatterns. River-flooded lakes, marshes, and swamps on floodplains acquire different structure andecological processes than do depressions filled mostly by groundwater. Widespread constructionof large impoundments, navigation structures, and levees have profoundly altered floodplainrelationships between rivers and floodplain lakes and wetlands.
Rivers empty into estuaries, which are defined primarily by tidal forces and somewhatpredictable periodicity in salinity over the estuarine bottom. Wind and river flow also areimportant mixing influences. The extent that wetlands form around estuaries depends mostly onthe slope of surrounding topography, estuarine widening of the river channel, and sediment load. Wetlands usually develop most extensively in wide estuary basins in flat coastal plains served byrivers with high sediment load. Coastal erosion and deposition form barrier beaches thatcontribute to estuarine wetland development by protecting estuaries from coastal storms. Riverine wetlands may drain on the surface or through groundwater directly to estuarinewetlands, or they may drain back to the river before reaching the estuary.
Estuaries empty into oceans, but because of tidal and coastal currents, points of entryoften are indistinct. Development of barrier beaches, especially on flat coastal plains, greatlymodifies and extends estuarine systems behind the beaches. Riverine material load is a majorsource of barrier-beach deposits in addition to oceanic sources. Development of intracoastalcanal systems for boat traffic has linked many previously separate estuarine areas, creating newcirculation patterns and different wetland configurations in association with estuaries behindbarrier beaches. Mixing rates and amounts of salt water and freshwater and waters with differentsediment loads contribute in barrier beaches often profoundly change estuarine mixing patternsand associated community patterns.

17
Ocean shore deposition and erosion dynamics maintain barrier beaches. Beach materialsupply is critical, as is the integrity of coastal vegetation, once established. Vegetation stabilizesdunes and resists breaching during major storm events. Storm patterns are variable, thus barrierbeach processes are dynamic, and a certain amount of instability in estuarine and coastalcommunities is to be expected. Engineering modifications also have altered material transportfrom watersheds and probably have affected natural beach nourishment rate and estuarine waterquality.
Project-by-project water resource modification has had cumulative impacts, especially onwater quality and sediment erosion, transport, and deposition dynamics. This cumulative effecthas been most evident in large river floodplains, estuaries, and barrier beaches, where physical andchemical changes have resulted in significant biological changes. The vast majority of sedimentssupplying river floodplains, estuaries, and coastal beaches depends on river contributions (Pethic1984). Watershed and river-flow modifications have significantly altered that process. In thepast, each engineered project, taken alone, had what appeared to be negligible off-site effects. The collective impact of water resource engineering in the U.S. and elsewhere has beenimpressive. Impoundment development retained sediment, resulting in down-slope diminishmentof sediment loads, significantly so in floodplains and estuaries of some watersheds. Evaporationsurface has increased, increasing estuarine salinity in some locations. Changes in estuarinecirculation patterns have altered salinity distributions. Channelization has routed sediment loadsthrough estuarine deltas to offshore ocean depths and some estuarine marshes are eroding partlyas a consequence. These physical and chemical changes have been accompanied by extensivebiological change. These large-scale alterations of past ecological processes remain poorlydefined.
Cross-Watershed Processes
Processes other than watershed can influence project effectiveness. Animal migration isimportant, especially for projects managed for migratory birds or projects that could be affectedby migratory bird use. The ecosystem context in those cases is the flyway used by the birds andthe availability of alternative flyway sites in the general vicinity of the project. Similarly, formigratory fish species that complete their life cycles both in watersheds and in oceans, the top-down impact of commercial fishing and other oceanic change interacts with watershed and rivermanagement processes to determine ultimate fishery status.
Human users, like birds and fish, also move among project sites and across watershedboundaries. This may be due to changes in site qualities or a perceived need for somethingdifferent. The dynamic in human use created by substitute sites can result in user impacts on thesite qualities generated as ecological outputs, such as population densities of fish, birds, and otheranimals. The availability of site substitutes also influences the net benefit derived from projectdevelopment. Where numerous high-quality substitute sites are available in the vicinity of aproject, the benefits of a new site are less likely to be utilized than where substitutes are scarce orof poor quality.

18
Airsheds may influence material transfer, especially with respect to various contaminantsfound in automobile, industrial, and other aerial exhausts. Although this form of input to projectsusually plays a minor role, it can be critical in certain situations.
ECONOMIC VALUES OF ECOSYSTEM SERVICES AND INDICATORS OF THEDEMAND FOR ECOSYSTEM SERVICES
Services of Ecosystems
Ecosystems generate multiple categories of valuable services to humans: (1) direct usevalues, (2) indirect use values, (3) option values for future use, (4) nonuse or existence/bequestvalues, and (5) cultural significance to native peoples.
Restoration of ecosystems and their functions will often increase the quantity or quality ofenvironmental services valued by humans. Restoration of water-based ecosystems such as lakes,rivers, wetlands, and estuaries often contribute to one or more of the above services to humans. The tables shown in Chapter III link the restoration measures undertaken by the USACE tospecific human services that fall under one or more of these service categories.
The direct use values resulting from USACE restoration projects include:
(1) Contribution to increasing the quantity of commercially valuable organisms (TableIII-12, finfish, some invertebrates such as shellfish)
(2) Increase in the supply or quality of recreation opportunities such as swimming andvarious types of boating (see Tables III-7 through III-12), recreational fishing(Table III-12), as well as bird viewing and waterfowl hunting (Table III-12)
(3) Increasing the supply of clean water for municipal and industrial (M&I) purposes(Table III-7, III-11), navigation (Table III-7), irrigation (Table III-11), andhydropower (Table III-7)
Second, ecosystem restoration provides indirect use values by performing services thatbecome inputs to production of fish and wildlife that are of direct value further up the food chain. Wetlands, for example, also provide natural filtering, nutrient uptake, and detoxification ofpollutants that would otherwise flow into watercourses and would require expensive human-constructed treatment plants. Those ecosystems may supply valuable services at lower costs. Restoration of ecosystems may reduce costly damages that might arise to houses (Table III-7) orinfrastructure such as highways, water supply canals, and pipes.
Third, restoration of ecosystems may have an option value to people. Some people maywish to visit these areas or view the unique wildlife that live there in the future, even if they do notnow. Thus, they may be willing to pay to maintain these areas so they could visit them in the

19
future. Option values also accrue to decisions involving restoration of endangered specieshabitats. Increasing the probability that a particular threatened and endangered (T&E) speciessurvives into the future provides that option to the future (Table III-12).
Fourth, there are also significant off-site or nonuse values to many members of the publicfrom simply knowing that a particular ecosystem and their service flow exists (existence value) orknowing that future generations will have this ecosystem in a restored condition (bequest values). These values appear to be of public importance for T&E species (see Table III-12) and wetlands(Loomis et al., 1990).
Fifth, ecosystems may also have cultural significance to native peoples. Many naturalareas may be of religious or cultural importance as ceremonial sites (e.g., bathing rituals, fishingsites, collecting sites), or the natural products produced by a wetland may be used in religiousceremonies or for subsistence purposes (e.g., particular plants or animals).
Supply and Demand for Ecosystem Services
Environmental restoration projects can potentially increase the quantity (amount, duration,areal extent) and quality (i.e., improve the timing or reduce variability) of ecosystem servicesdiscussed above. One way to think of environmental restoration is that it augments the supply ofsome ecological services.
But for these services to have the types of economic values described below, there mustbe a demand for these services. The first question to ask is, demanded by whom? A biocentricview would suggest that if plants or animals benefit from an increase in oxygen in the water, thenthis is sufficient. Several of the ecological outputs are measured in units that suggest a biocentricview. Many measures described in the tables (Chapter III), such as biological processes oroutputs related to different dimensions of substrate (Table III-7) or water quality (see Table III-11oxygen, pH, etc.), are first and foremost of biocentric value, since they contribute to a particularecosystem function or functions. Biodiversity and the ecological integrity of an ecosystem areoutputs and services of natural systems (see Table III-12) and therefore have a biocentric value.
Restoration of ecosystems to increase the diversity of plants, fish, and wildlife may make asignificant contribution to biodiversity of an area in at least one of two ways: (1) high direct on-site diversity and (2) being a critical habitat component to support a particular life stage for a widevariety of fish and wildlife at other areas (e.g., downstream).
In addition, some of these ecosystem functions are inputs to other ecosystem functionsthat can eventually be traced to a human use of the environment. Tracing the ecological effect tohumans provides an anthropocentric viewpoint. This view suggests that if something is to havean economic value to society, it must be possible to connect a human demand to the ecologicaleffect. That is, is there a human demand to hunt the additional waterfowl, to view the additionalbirds, to swim in the improved water quality, etc. The linkage can be indirect as well. Forexample, humans may not care if the soil toxicity is reduced such that it is safe for pocket

20
gophers. However, if we consider the food-chain effects, we recognize that pocket gophers maybe a major part of the red-tailed hawk's diet, and people do enjoy viewing the hawks. In this way,there is a human demand for clean soil and pocket gophers, indirectly through the food chain. Insome cases, there is a human demand to know that the natural functions have been restored to anarea such that it will now support native plants, fish, and wildlife even though the person currentlydoes not visit the area. That is, there may be an option demand to visit the restored area in thefuture or simply an existence demand to know the restored area exists as habitat or performsecological functions. Finally, individuals today may have a bequest demand to leave a restoredecological system in this specific area to future generations of residents there.
Nonetheless, it is important for the analyst to look at the demand for the new servicescreated relative to existing supply of those services. Restoration of additional habitat may at somepoint saturate the "market" for the associated human services, and each new project simplyredistributes the same fixed amount of use. The Corps has seen this phenomenon with regard tosome recreation projects in some reservoir-rich regions of the U.S. It should be noted thatrestoration may have the potential to increase the quality of recreation use (e.g., increased catchrates, greater viewing diversity).
The importance of there being a demand for the additional supply of ecological and humanservices created by the restoration project is illustrated in Figure II-4, panels A and B. Panel Aillustrated the case where there is a demand for both the current supply and the augmented supply. This might illustrate the case of wetlands for waterfowl hunting and viewing in a particular area. A restoration project that increases the quality or quantity of wetlands, will be translated into anincrease in the supply of hunting and viewing days. Specifically, a substantial increase in wetlandsmight allow for issuing of more waterfowl hunting permits or allow more viewing blinds to beconstructed to accommodate more bird watchers. This is illustrated by a rightward shift in thesupply curve from Supply-current to Supply-restored. The additional benefits created are equal toarea B in panel A. As will be explained in more detail below, area B is the willingness to pay forthe added trips or visitors. The additional travel costs and management costs of accommodatingthe additional visitors must be subtracted to arrive at net benefits or National EconomicDevelopment (NED) benefits. Panel B illustrates the case where there is already an abundance ofhigh-quality groundwater supply to meet all economic demands and there is no overdrafting of theaquifer. As such, there is no current or direct economic value of increases in groundwaterrecharge from the restoration project. That is, while wetland restoration provides additional bird-viewing opportunities for which there is a demand, the groundwater recharge service has nocurrent or direct economic value today. Benefits with and without the increase in supply are thesame, area A in Figure II-4, panel B. An analogy may help the reader understand the logic of thisconclusion. If you own a stadium that has never sold out and is not expected to do so in theforeseeable future, what is the economic return of adding more seating capacity? There probablyis none. The same logic applies to supplying more of an environmental service for which currentand projected demand is already met.

21

MarginalBenefit$/V.D.
MarginalBenefit$/V.D.
MarginalBenefit$/ACFT
MarginalBenefit$/ACFT
Acre FeetACFTMaximumDemand
Demand
Future demand-Year 2020
Acre Feet
Supply-current
Supply-current
Supply-restored
Supply-restored
Visitor Days per Year
Demand (hunting & viewing)
Supply-restored
Supply-current
PANEL A
PANEL B
PANEL C
VDc VDv
ACFT1 ACFT2
Demandcurrent
AB
A
A
B
22
FIGURE II-4
SUPPLY-DEMAND CURVES REGARDINGENVIRONMENTAL RESTORATION OPPORTUNITIES

23
As shown in panel C, future demand might increase to the point where there will be ademand in the year 2020 for additional output created by the project. In this case, there will bebenefits (area B in panel C), but these benefits must be discounted from the 25-year period beforethey are received. At the current water resource rate of 7.75 percent, one dollar's worth ofbenefits received 25 years from now is worth about twenty-five cents today.
When attempting to determine if human demand for ecosystem services or outputs exists,the planner should consider the following:
(1) Public access to the on-site or off-site resources. For the human use benefits(nonuse benefits are discussed below) to be realized, people must be able to seethe restored area, wildlife that live or migrate in and out of the area, or receiveother off-site effects such as improved water quality. This human use may includeresidents who live adjacent to the area, i.e., homeowners. In addition, publicaccess for visitors who want to come and view, fish, hike, swim, etc., at the site isanother way in which human use might occur. It is possible that some of thehuman use can occur downstream of the restored area, whereby cleaner water isobtained at downstream city water supplies of downstream rivers and lakes. Inaddition, birds that nest in the restored area may be seen flying around the generalarea where people live. In any case, some connection to people in the area isnecessary for use benefits to be realized. Nonuse benefits are discussed below initem 7.
(2) Regional presence of high demand for the targeted resource. This may be a highabsolute level of use or a high use per acre. A wetland may attract 10,000 visitorsa year, but other wetlands of similar size in the state may only have 1,000 visitorsper year. Thus on a per acre basis, there is a high demand for this type ofrecreation in this area relative to other areas. Assembling background informationon use of the study site relative to substitute sites offering similar services will helpdocument whether there is a demand for the additional supply created byenvironmental restoration. It is important to separately account for net new use atthe restored site versus simply a redistribution of use from existing sites to therestored sites. Another common indicator of high demand for a specificrestoration site may be a high incidence of field trips to the area by conservationorganizations.
(3) Periodic shortages of resource. Evidence of demand for the newly restoredresource can be documented if there is past evidence of frequent shortages. Itwould be important to document, for example, an environmental restorationproject that provides additional clean water in areas where a combination ofdrought and polluted water have resulted in water shortages or water userestrictions. Increasing instream flows at times of the year when water flows arelow would reduce the scarcity of instream recreation opportunities. Thepercentage of a site or area capacity that is utilized might be another indicator ofdemand. If capacity is nearly used on most weekends, then one would expectfuture demand to outstrip the available supply.

24
(4) Legal mandates for services including environmental laws and standards. Inmany cases the scarcity and demand for the environmental outputs are documentedby mandates. For example, water quality is below the legal standard, a species islisted by the state as one of special concern, or executive orders exists, such asthose pertaining to "no net loss" of wetlands. In other cases, relating the project'scontribution to larger-scale plans such as the North American WaterfowlManagement Plan and associated Flyway Plans and Joint Ventures will show that aproject contributes to meeting a larger societal need. These are politicalmanifestations of societal demand for these outputs.
(5) Stakeholder willingness to contribute funding. If the environmental servicesprovided by a site are of economic value to members of a community or result insignificant cost savings to a community, the community should be able to expressthat significance by making its cost share a high priority. Of course, it is importantto be aware of local tax limitation laws or requirements of "super majorities" topass tax increases or bond referendums that often mask the fact that there issubstantial (even if not majority) demand for a project. Also, city, county, state,and nonprofit group monetary or in-kind contributions may be taken as anindicator of demand for the project services.
(6) Potential of the restored environment to be used for environmental education. Many areas have large school district demand for nearby accessible natural areas tobe used for environmental education at all levels. Documentation of this may beperformed by contacting the school districts environmental education coordinatoror nearby schoolteachers to gauge their interest in using such an area. However, itis important to ascertain the advantages of the newly restored area as comparedwith any existing areas already used by the school district.
(7) Nonuse or existence values for the specific natural resource at this particularlocation. Planners should note whether the restored site would provide or enhancepopulations of regionally unique plants or animals or natural features not found inthe region. Nonuse values might be demonstrated in newspaper articles about thespecific resource at this site or local television coverage of the resource, etc.
Nonmarket Economic Values
Renewable natural resources in particular and ecosystems in general provide many servicesto human beings that are of direct economic value. Some of these services are priced incompetitive markets, and therefore the price paid for the service reflects the economic value ofthat service. However, many services of ecosystems listed above are not traded in markets. Insome cases, this absence of markets is a social choice. For example, in the U.S. free-rangingwildlife is regarded as a public trust, where the government regulates harvesting. For variouspolitical and administrative reasons, governments usually do not establish competitive markets forwildlife. Absence of markets does not mean absence of economic value. As discussed below,
25
market simulation approaches can be used to estimate the value of wildlife recreation and wetlandrecreation in the absence of markets.
Other ecosystem services listed above have no markets because there is no technicallyfeasible means to charge the recipients for the services they receive. For example, the benefitsfrom knowing a particular species exists and will be available for future generations can beenjoyed without paying. If a person does not make a donation to the government or anenvironmental group, as long as others do so and the ecosystem is protected, the nonpayers canstill benefit from knowing these ecosystems exist (even though they do not have the satisfaction ofknowing they contributed to their survival). For existence and bequest services, the simulatedmarket approach, discussed below, must be relied on to obtain an estimate of the value receivedby nonvisiting households.
NED Measures of the Economic Value of Ecosystem Services
The U.S. Water Resources Council (1983) requires that NED benefits be measured interms of net willingness to pay (WTP). Net WTP is the amount the user (e.g., visitor,homeowner) would pay, over and above their own cost, to obtain some improvement. Theimprovement might be cleaner water, greater diversity of birds, less odor, greater instream flow,etc. The WTP can also reflect a cost savings to society. For example, the cost savings to areservoir owner from less sediment in the water can be the reduced water treatment cost or thereduced cost from less frequent dredging of a reservoir. Flood damages avoided by homeownersis another type of NED benefit that reflects landowner's WTP to avoid losses.
Measuring as many of the NED benefits as practical can contribute to determining theoptimal scale or size of an individual restoration project as well as selecting among differentrestoration projects. However, most restoration projects do not require a complete NED orbenefit-cost analysis. Oftentimes determining which scale of restoration project or whichrestoration project provides desired outputs (e.g., habitat units, waterfowl populations) at areasonable level of costs per unit is sufficient to guide the decision process.
Many of the direct service benefits of ecosystems can often be valued using market prices(net of harvesting costs) such as the dockside price of fish or pelts. In some cases, we mustdisentangle the price of housing near restored ecosystems to arrive at the ecosystem'scontribution. This approach is known as the hedonic property value method. For recreationalhunting or viewing, we can rely on the fact that many visitors must pay a price in travel costs andtravel time. While the amount spent is not a direct measure of the value of viewing or hunting(expenditures are a measure of cost to the visitor, not benefits), the variations in travel costsincurred and associated number of visits taken do allow the analyst to trace out a demand curvefor recreation at the wetland. From this demand curve, the WTP over and above the costs can becalculated. This approach is known as the travel cost method (TCM). Details of this method areprovided in NED manuals developed by the Corps Institute for Water Resources (Vincent,Moser, and Hansen 1986).

26
For indirect service benefits provided by ecosystems, one can value the services by lookingat either the products created or the cost of providing this service using nonnatural means. Forexample, groundwater recharge can be valued if one knows the acre-feet of water delivered to theaquifer by a wetland and a price per acre-foot of groundwater reserve (i.e., value of water in theground before pumping costs are incurred). If, for example, flood protection and water-qualityfiltering are services that would have to be provided in absence of the wetland, then the costsavings of using the wetland instead of structural flood control features (such as dams or watertreatment plants) is an economic benefit of maintaining the wetland. This approach is sometimescalled the replacement cost method. It must be used appropriately, otherwise ludicrously largebenefit estimates can result. For example, a wetland may be trapping and detoxifying heavymetals and preventing them from reaching a watercourse. It might cost $150 million dollars tobuild and operate an equivalent treatment plant. But the damages from the heavy metal enteringthe watercourse in terms of reduced fish and shellfish production and higher cancer rates mightonly be $5 million a year. It would be misleading to say the wetland has a value of $150 millionbecause it would cost this much to build a treatment plant. Given the magnitude of the costs andthe relatively small size of the damages, the treatment plant and the wetland value would be equalto the $5 million loss to society that would result if the wetland were not there.
Option, existence, and bequest values can be valued using a contingent valuation method(CVM) survey that estimates maximum WTP through questioning individuals. These surveys areillustrated in a case study of the San Joaquin Valley wetlands preservation and protection (Loomiset al. 1990). While the WTP question can be asked in numerous ways, one useful approach is toask if individuals would vote in favor of a specific wetland program that would involve specificacreage, etc., at a given price (with the price varying across respondents). By calculating thepercent of people that would pay each price, a demand curve can be statistically estimated andWTP calculated. This WTP reflects all the motivations people have to pay and frequently reflectsoption, existence, and bequest values.
CVM can be criticized on several grounds. First, respondents must be given adequateinformation about service flows from ecosystems so they can rationally estimate their WTP. Amore fundamental question is whether people would actually pay the dollar amounts they state inthe survey. There is some evidence that CVM responses are valid measures of WTP forenvironmental services such as air quality (Brookshire et al. 1982). However, the more unfamiliarone is with an environmental resource, the greater the potential for discrepancy between statedand actual WTP, often a factor of 2:1. While carefully designed CVM surveys can often providefar more precision than order-of-magnitude estimates of nonmarket values, even order-of-magnitude estimates can be useful for many policy decisions. Frequently, there are good costestimates but no estimates of the benefits. Since nearly all the population of an area can enjoy theexistence and bequest values from maintaining ecosystems, even small values per household ($10-$30) produce large aggregate estimates of benefits. Past analyses that ignored these values andrelied solely on commercial and recreation values were misleading and incomplete. It is usuallybetter to have a good approximation of the total value than to have a precise estimate of just apartial measure.

27
SUMMARY
The examination of ecosystem processes from a systems perspective requires careful andextensive consideration of its components, including energy and material flows. (An extensivediscussion of these components and function can be found in the Appendix.) This is especiallyimportant regarding management approaches, because an alternative often will have additionalindirect effects beyond its intended benefit or services. The benefits and services of ecosystemsare of value to humans. A large variety of these services can be measured using market prices,replacement costs, simulated demand curves for recreation, and simulated markets using thecontingent valuation method. While there will frequently be values of ecosystems that may not becaptured in a human-based valuation method, the quantifiable economic values often exceed thesum of financial values and recreation values alone.
Cooperation of ecologists and economist can expand the types of values that can bequantified in future surveys and analyses. The tables in Chapter III have been designed toaccommodate both the important ecological and the socioeconomic aspects of environmentalplanning, namely ecological outputs and their related socioeconomic benefits and services. Itshould be recognized, however, that this in no way suggests all restoration benefits be presentedin monetary form. Although the tables in Chapter III present an extensive accounting ofsocioeconomic benefits, they do not accommodate all the benefit categories that a project canprovide. There are many benefit categories that are not readily characterized by existing orsimulated markets and are therefore portrayed in qualitative form.

28

29
III. ECOSYSTEMS-BASED SERVICES FOR PLAN FORMULATION
The preceding chapters set the initial ecological and socioeconomic foundations for thedevelopment of the tables in this chapter. This chapter will focus on the table contents and howto apply them to environmental restoration planning efforts.
TABLE PURPOSE IN PLANNING PROCESS
This chapter presents a set of tables designed to aid identification of links betweenecological output and human services. Despite much conceptual advancement over the past halfcentury, quantitative understanding of ecosystem processes remains rudimentary. Although muchmore can be learned through further research and model development, water managers must relyon present understanding to make the decisions demanded of them while they encourage researchand development of better decision-making tools. Figure III-1 illustrates how the informationpresented in each table fits into the plan formulation process, starting with the identification ofCorps project alternatives and culminating in project recommendations. The tables provided as aplanning tool in this chapter should be viewed as an intermediate step in the development of moresophisticated planning tools and not as the ultimate management tool.
From the proceeding analysis several criteria were developed for table structure andcontent, with the ultimate intent that the tables fully represent links between managementprocesses, ecological outputs, and human services.
! The tables should reflect the interactive dynamics of ecosystems processes that linkecological outputs with human services.
! The tables should incorporate human actions and needs as integral parts ofecosystem processes that are among the criteria used to assess ecosystem integrity.
! The tables need to include ecosystem inputs that are important determinants ofecological outputs and are influenced by Corps management activity.
! The tables need to include important direct and indirect linkages betweenecological inputs, ecological outputs, and human services, even when numerousecologic interactions occur between management cause and ultimate service effect.

Environmental QualityRecreationCommercial FishingNonuse Benefits
Urban Flood DamageHydropowerInland NavigationDeep Draft NavigationRecreationCommercial Fishing
RecreationCommercial FishingInland NavigationDeep Draft Navigation
Vegetation RemovalVegetation Planting
Hydraulic DredgingRecreation FacilitiesAerationBeach NourishmentFill RegulationTreatment Systems
Recreational FacilitiesRoadsArtificial HabitatHydraulic Dredging
Fill RegulationHydraulic DredgingBeach Nourishment
Water-Flow ManagementHydraulic DredgingTurbines
Dams and DikesHydraulic DredgingErosion Control StructuresFill RegulationWater-Flow Control StructuresCanalsExcavations
Project )
SolutionAlternatives
ProblemIdentification
Proposal
Water and MaterialTransport Process
(Table 2)
Morphologic andTopographic Process
(Table 1)
Substrate Process(Table 3)
Habitat Arrangement(Landscape) Process
(Table 4)
Water QualityProcess
(Table 5)
BiologicalQuality Process
(Table 6)
Study and
Recommendation
USACE ACTIONECOLOGICAL
INPUT/OUTPUT SERVICE/NED
FIGURE III-1RELATIONS BETWEEN ECOLOGICAL OUTPUT CATEGORIES EITHER DIRECTLY1,2
OR INDIRECTLY INFLUENCED BY CORPS MANAGEMENT
1. Flow lines represent information, material and energy connections.2. Each category under ecological input/output is the base of a table summarizing the ecological outputs and services that could be affected by project realization.

31
! The tables need to account for both positive and negative consequences ofmanagement actions on linkages between ecological outputs and human services toproperly assess management effectiveness.
! The tables need to provide a checklist for both intended and unintendedmanagement effects on ecological outputs, including numerous "side effects" thattend to be overlooked or discounted as insignificant in the planning process.
! The tables need to account for complex branching and feedbacks amongecosystem-output responses to management inputs.
! The tables need to signal the possibility of remote, off-site impacts that could havepositive or negative cumulative effects with respect to national economicdevelopment.
Meeting these criteria resulted in the detailed tables found in Tables III-7 through III-12. For introductory purposes, the information contained in the 39 pages of Tables III-7 through III-12 has been collapsed into a simple cross-referenced listing in the form of Tables III-1 throughIII-6.
Tables III-1 through III-6 provide the user with a general assessment of which humanservice categories are associated with a particular ecological impact. These tables can alsoquickly indicate which ecological inputs influence a given human service category.
Tables III-7 through III-12 identify ecological outputs and dependent human services. When ecological outputs are directly linked to human services, those services are immediatelyidentified in the tables, and information is provided about benefit form and whether the service ispositively or negatively affected by the ecological output. Some ecological outputs enhanceservice benefits, while others diminish benefits. When the effect of ecological output on humanservice is indirect, the table reader is directed to another table where the secondary outputs mayhave direct links to services. Although many human services are directly affected by Corpsmanagement, most effects are indirect.
The conception of potential projects starts with the identification of a restoration need,which may be provided through a number of alternative management actions (see Figure III-1). Often, a proposal not only identifies need but also suggests at least some management alternativessuch as building a dike or dam, eliminating existing water control structures, redistributing bottomsediments, adding mechanical oxygenation, planting marsh plants, or harvesting aquatic weeds. Planners are expected to evaluate the need and the various management alternatives to determinewhich is the most cost-effective in providing for the need. Each of the alternative proposalactions indirectly and directly generates environmental changes, which are categorized in the sixtables as Morphology and Topography, Water and Material Transport, Substrate, HabitatArrangement (Landscape Process), Water Quality, and Biological Quality.

32
Mor
phol
ogy
(Tbl
1)
Wat
er &
Mat
eria
l
Subs
trat
e (T
bl 3
)
Hab
itat
Arr
ange
men
t
Wat
er Q
ualit
y (T
bl 5
)
Bio
Pro
cess
/Qua
lity
Aes
thet
ics
Rec
reat
ion
Pro
pert
y V
alue
Flo
od C
ontr
ol
Sedi
men
t C
ontr
ol
Wat
er S
uppl
y
Hyd
roel
ectr
ic
Gro
undw
ater
Rec
harg
e
TABLE III-1ECOLOGICAL OUTCOMES AND SERVICES DIRECTLY AFFECTED BY
WATERSHED, BASIN, AND CHANNEL MORPHOLOGICAL AND TOPOGRAPHIC PROCESS
ECOLOGICAL INPUTS
Ecological Outputs
SURFACE AREA
Total use area !
Aesthetic !
Total area of productivehabitat
!
AREA FLUCTUATION
Concentration anddilution effect
!
Fluctuation of use base ! ! !
Shore protection ! ! !
VOLUME
Storage capacity ! ! !
Total material andenergy content
! !
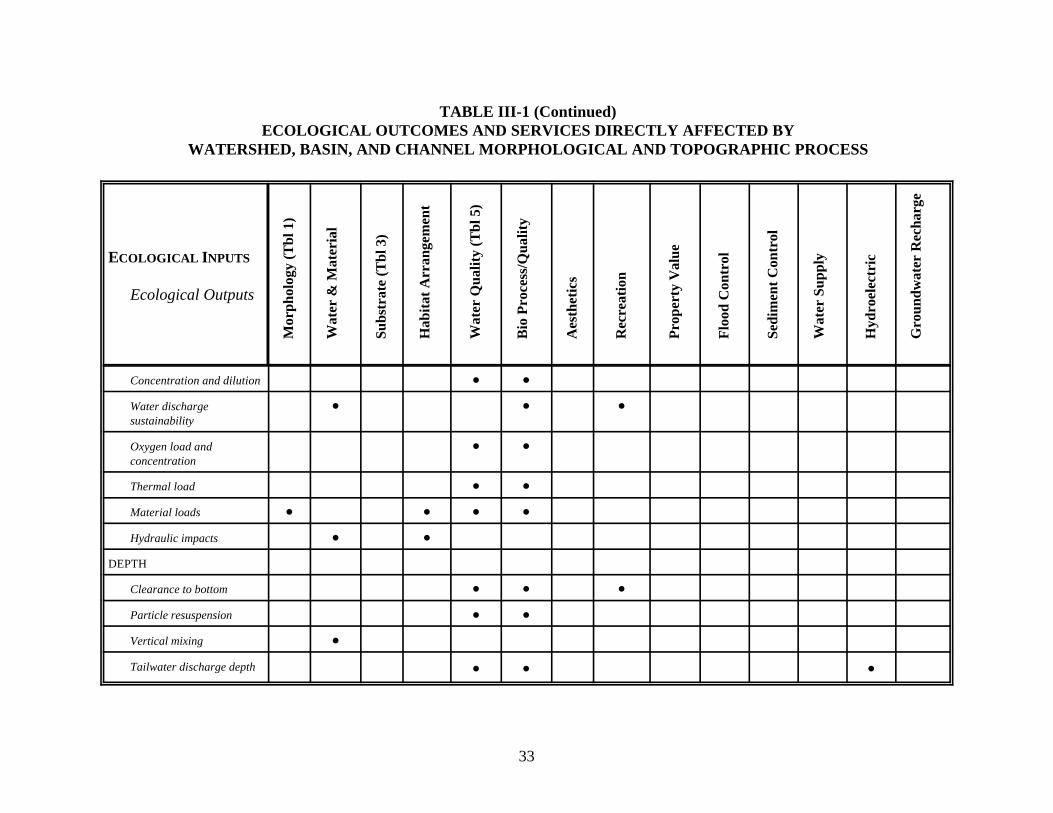
33
Mor
phol
ogy
(Tbl
1)
Wat
er &
Mat
eria
l
Subs
trat
e (T
bl 3
)
Hab
itat
Arr
ange
men
t
Wat
er Q
ualit
y (T
bl 5
)
Bio
Pro
cess
/Qua
lity
Aes
thet
ics
Rec
reat
ion
Pro
pert
y V
alue
Flo
od C
ontr
ol
Sedi
men
t C
ontr
ol
Wat
er S
uppl
y
Hyd
roel
ectr
ic
Gro
undw
ater
Rec
harg
e
TABLE III-1 (Continued)ECOLOGICAL OUTCOMES AND SERVICES DIRECTLY AFFECTED BY
WATERSHED, BASIN, AND CHANNEL MORPHOLOGICAL AND TOPOGRAPHIC PROCESS
ECOLOGICAL INPUTS
Ecological Outputs
Concentration and dilution ! !
Water dischargesustainability
! ! !
Oxygen load andconcentration
! !
Thermal load ! !
Material loads ! ! ! !
Hydraulic impacts ! !
DEPTH
Clearance to bottom ! ! !
Particle resuspension ! !
Vertical mixing !
Tailwater discharge depth ! ! !
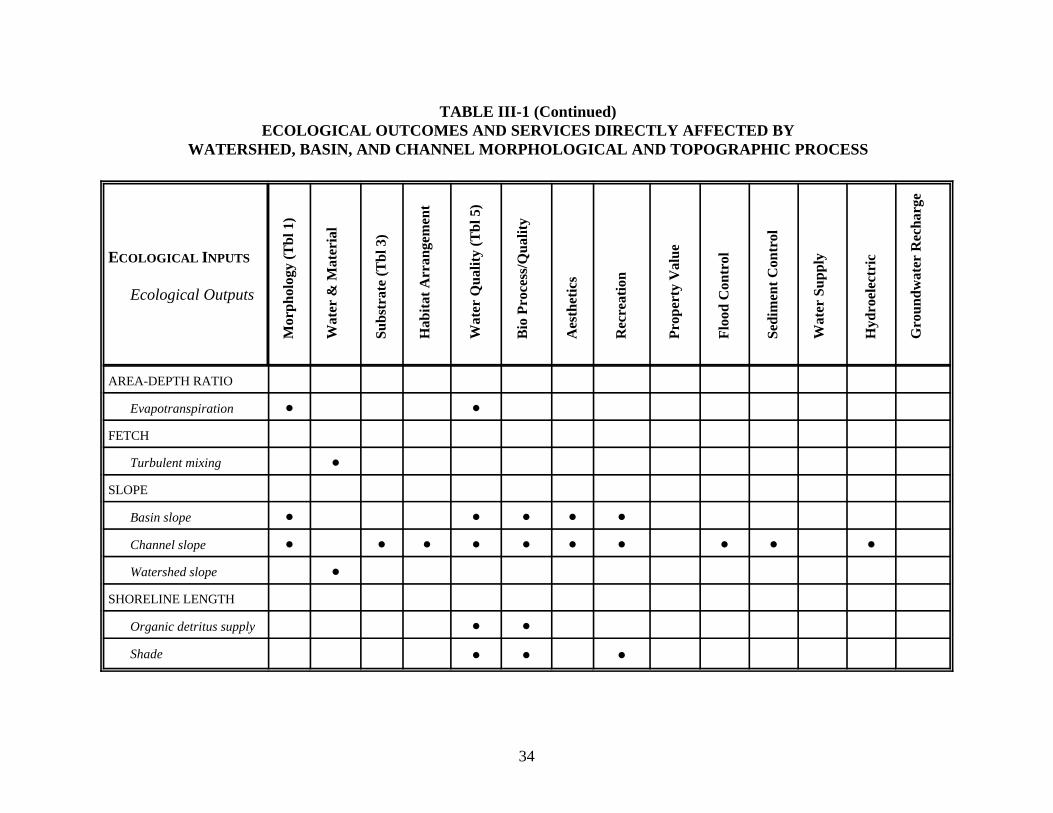
34
Mor
phol
ogy
(Tbl
1)
Wat
er &
Mat
eria
l
Subs
trat
e (T
bl 3
)
Hab
itat
Arr
ange
men
t
Wat
er Q
ualit
y (T
bl 5
)
Bio
Pro
cess
/Qua
lity
Aes
thet
ics
Rec
reat
ion
Pro
pert
y V
alue
Flo
od C
ontr
ol
Sedi
men
t C
ontr
ol
Wat
er S
uppl
y
Hyd
roel
ectr
ic
Gro
undw
ater
Rec
harg
e
TABLE III-1 (Continued)ECOLOGICAL OUTCOMES AND SERVICES DIRECTLY AFFECTED BY
WATERSHED, BASIN, AND CHANNEL MORPHOLOGICAL AND TOPOGRAPHIC PROCESS
ECOLOGICAL INPUTS
Ecological Outputs
AREA-DEPTH RATIO
Evapotranspiration ! !
FETCH
Turbulent mixing !
SLOPE
Basin slope ! ! ! ! !
Channel slope ! ! ! ! ! ! ! ! ! !
Watershed slope !
SHORELINE LENGTH
Organic detritus supply ! !
Shade ! ! !

35
Mor
phol
ogy
(Tbl
1)
Wat
er &
Mat
eria
l
Subs
trat
e (T
bl 3
)
Hab
itat
Arr
ange
men
t
Wat
er Q
ualit
y (T
bl 5
)
Bio
Pro
cess
/Qua
lity
Aes
thet
ics
Rec
reat
ion
Pro
pert
y V
alue
Flo
od C
ontr
ol
Sedi
men
t C
ontr
ol
Wat
er S
uppl
y
Hyd
roel
ectr
ic
Gro
undw
ater
Rec
harg
e
TABLE III-1 (Continued)ECOLOGICAL OUTCOMES AND SERVICES DIRECTLY AFFECTED BY
WATERSHED, BASIN, AND CHANNEL MORPHOLOGICAL AND TOPOGRAPHIC PROCESS
ECOLOGICAL INPUTS
Ecological Outputs
Terrestrial organismwater use
!
Shore erosion ! ! ! !
SHORELINEDEVELOPMENT
Ratio of shoreline lengthto water area
! ! ! ! ! !
CHANNEL FORM
Wetted Perimeter ! ! !
Meander radius, lengthand amplitude
! ! ! ! !
Stream Braidedness ! !
FLOODPLAIN FORM
Floodplain storagecapacity
! ! ! ! !

36
Mor
phol
ogy
(Tbl
1)
Wat
er &
Mat
eria
l
Subs
trat
e (T
bl 3
)
Hab
itat
Arr
ange
men
t
Wat
er Q
ualit
y (T
bl 5
)
Bio
Pro
cess
/Qua
lity
Aes
thet
ics
Rec
reat
ion
Pro
pert
y V
alue
Flo
od C
ontr
ol
Sedi
men
t C
ontr
ol
Wat
er S
uppl
y
Hyd
roel
ectr
ic
Gro
undw
ater
Rec
harg
e
TABLE III-1 (Continued)ECOLOGICAL OUTCOMES AND SERVICES DIRECTLY AFFECTED BY
WATERSHED, BASIN, AND CHANNEL MORPHOLOGICAL AND TOPOGRAPHIC PROCESS
ECOLOGICAL INPUTS
Ecological Outputs
WATERSHED FORM
Impenetrable surface ! ! ! !
Depression storage ! ! ! ! !

37
Mor
phol
ogy
(Tbl
1)
Wat
er &
Mat
eria
l
Subs
trat
e (T
bl 3
)
Hab
itat
Arr
ange
men
t(T
bl 4
)
Wat
er Q
ualit
y(T
bl 5
)
Bio
Pro
cess
/Qua
lity
(Tbl
6)
Flo
od C
ontr
ol
Rec
reat
ion
TABLE III-2ECOLOGICAL OUTCOMES AND SERVICES DIRECTLY AFFECTEDBY WATER AND MATERIAL TRANSPORT PROCESS INCLUDING
USACE IMPACT ON ECOSYSTEM TRANSPORT PROCESS
ECOLOGICAL INPUTS
Ecological Outputs
DISCHARGE
Watershed discharge andload
! ! !
Waterbody discharge andload
! ! ! ! !
Hydraulic retention ! ! !
Channel discharge andload
! ! ! ! !
CURRENT, TURBULENCE &WAVE HEIGHT
Surface turbulence andwave height
! ! ! ! !
Vertical and horizontalmixing
! !
Erosion, transport anddeposition dynamics
! ! ! ! !

38
Mor
phol
ogy
(Tbl
1)
Wat
er &
Mat
eria
l
Subs
trat
e (T
bl 3
)
Hab
itat
Arr
ange
men
t(T
bl 4
)
Wat
er Q
ualit
y (T
bl 5
)
Bio
Pro
cess
/Qua
lity
(Tbl
6)
Aes
thet
ics
Con
stru
ctio
n Su
ppor
t
Rec
reat
ion
TABLE III-3ECOLOGICAL OUTCOMES AND SERVICES DIRECTLY AFFECTED
BY SUBSTRATE INCLUDING THE USACE IMPACTS ON SUBSTRATE
ECOLOGICAL INPUTS
Ecological Outputs
SUBSTRATE PARTICLESTRUCTURE
Substrate particle size ! ! ! !
Particle density ! ! !
Particle shape ! ! !
Particle roughness andabrasiveness
! ! !
Particle aggregation ! ! !
Particle stability ! ! !
Particle compaction ! ! !
SUBSTRATE CHEMISTRY
Organic content ! ! ! ! ! !
Nutrient content ! !
Toxic contaminant content ! !
Solubility ! ! !
SUBSTRATEORIENTATION ANDDEVELOPMENT
Within habitat verticaldevelopment
! ! ! ! ! !
Between habitat verticaldevelopment
! ! ! ! ! !

39
Mor
phol
ogy
(Tbl
1)
Wat
er &
Mat
eria
l
Subs
trat
e (T
bl 3
)
Hab
itat
Arr
ange
men
t(T
bl 4
)
Wat
er Q
ualit
y
Bio
Pro
cess
/Qua
lity
(Tbl
6)
Aes
thet
ics
Atm
osph
eric
hum
idif
icat
ion
Rec
reat
ion
Pro
pert
y V
alue
TABLE III-4ECOLOGICAL OUTCOMES AND SERVICES DIRECTLY AFFECTED
BY HABITAT ARRANGEMENT AND LANDSCAPE PROCESSINCLUDING USACE IMPACTS ON LANDSCAPE
ECOLOGICAL INPUTS
Ecological Outputs
HABITAT PATCHINESS
Within habitat ! !
Regional habitat !
Edge development ! !
HABITATCONNECTIONS
Intra-habitat conn. ! !
Inter-habitat conn. ! !
Air-water Interface ! ! !
HABITAT DIVERSITY
Within-habitat divers. ! !
Between-habitat ! !divers.
Habitat Interspersion !
HUMAN HABITAT
Foot, road & parking ! ! ! ! ! ! ! !
Boat ramps ! ! ! ! !
Docks, marinas,promenades
! ! ! ! ! !
Sanitary facilities ! ! ! !

40
Mor
phol
ogy
(Tbl
1)
Wat
er &
Mat
eria
l
Subs
trat
e (T
bl 3
)
Hab
itat
Arr
ange
men
t(T
bl 4
)
Wat
er Q
ualit
y
Bio
Pro
cess
/Qua
lity
(Tbl
6)
Aes
thet
ics
Atm
osph
eric
hum
idif
icat
ion
Rec
reat
ion
Pro
pert
y V
alue
TABLE III-4 (Continued)ECOLOGICAL OUTCOMES AND SERVICES DIRECTLY AFFECTED
BY HABITAT ARRANGEMENT AND LANDSCAPE PROCESSINCLUDING USACE IMPACTS ON LANDSCAPE
ECOLOGICAL INPUTS
Ecological Outputs
Campgrounds, picnicgrounds, rest stops
! ! ! ! !
Tennis courts, bridlepaths, golf course...
! ! ! !
Recreation regulation ! ! ! ! !

41
Mor
phol
ogy
(Tbl
1)
Wat
er &
Mat
eria
lT
rans
fer
(Tbl
2)
Subs
trat
e (T
bl 3
)
Hab
itat
Arr
ange
men
t(T
bl 4
)
Wat
er Q
ualit
y (T
bl 5
)
Bio
Pro
cess
/Qua
lity
(Tbl
6) Aes
thet
ics
Rec
reat
ion
Tur
bidi
ty
Wat
er C
onta
min
atio
n
Dam
age
to E
quip
men
t
Wat
er S
uppl
y
Eco
syst
em I
nteg
rity
In
dex
Indu
stri
al
The
rmal
Loa
d C
apac
ity
Agr
icul
ture
al B
enef
it
TABLE III-5ECOLOGICAL OUTCOME AND SERVICES DIRECTLY AFFECTED BY
WATER AND SEDIMENT QUALITY INCLUDING USACE IMPACTS ON QUALITY FACTORS
ECOLOGICAL INPUTS
Ecological Outputs
SUSPENDEDPARTICULATE MATTER
Total Suspended solids ! ! ! ! ! ! !
Suspended organicsolids
! ! !
Suspended color ! ! !
Suspended inorganicnutrients
! !
Suspended toxicmaterial
! !
Ratio of inorganic andorganic suspendedsolids
!
Suspended inorganiccomplexes
! !

42
Mor
phol
ogy
(Tbl
1)
Wat
er &
Mat
eria
lT
rans
fer
(Tbl
2)
Subs
trat
e (T
bl 3
)
Hab
itat
Arr
ange
men
t(T
bl 4
)
Wat
er Q
ualit
y (T
bl 5
)
Bio
Pro
cess
/Qua
lity
(Tbl
6) Aes
thet
ics
Rec
reat
ion
Tur
bidi
ty
Wat
er C
onta
min
atio
n
Dam
age
to E
quip
men
t
Wat
er S
uppl
y
Eco
syst
em I
nteg
rity
In
dex
Indu
stri
al
The
rmal
Loa
d C
apac
ity
Agr
icul
ture
al B
enef
it
TABLE III-5 (Continued)ECOLOGICAL OUTCOME AND SERVICES DIRECTLY AFFECTED BY
WATER AND SEDIMENT QUALITY INCLUDING USACE IMPACTS ON QUALITY FACTORS
ECOLOGICAL INPUTS
Ecological Outputs
Suspended organiccomplexes
! !
DISSOLVED MATTER
Dissolved organicmatter
! !
Water color ! ! !
TDS ! ! !
Salinity ! ! ! ! !
Hydrogen ions ! ! !
Oxygen ! ! ! !
Nitrogen gas ! !
Dissolved inorganicnutrients
! !
Ionic ratios ! !

43
Mor
phol
ogy
(Tbl
1)
Wat
er &
Mat
eria
lT
rans
fer
(Tbl
2)
Subs
trat
e (T
bl 3
)
Hab
itat
Arr
ange
men
t(T
bl 4
)
Wat
er Q
ualit
y (T
bl 5
)
Bio
Pro
cess
/Qua
lity
(Tbl
6) Aes
thet
ics
Rec
reat
ion
Tur
bidi
ty
Wat
er C
onta
min
atio
n
Dam
age
to E
quip
men
t
Wat
er S
uppl
y
Eco
syst
em I
nteg
rity
In
dex
Indu
stri
al
The
rmal
Loa
d C
apac
ity
Agr
icul
ture
al B
enef
it
TABLE III-5 (Continued)ECOLOGICAL OUTCOME AND SERVICES DIRECTLY AFFECTED BY
WATER AND SEDIMENT QUALITY INCLUDING USACE IMPACTS ON QUALITY FACTORS
ECOLOGICAL INPUTS
Ecological Outputs
Biogeochemicalelements
! !
Hardness ! ! !
Dissolved toxicmaterials
! ! !
ELECTROMAGNETIC
Light transmission ! ! !
Temperature ! ! ! ! ! !
Reduction-oxidation !

44
Mor
phol
ogy
(Tbl
1)
Wat
er &
Mat
eria
l Tra
nsfe
r (T
bl 2
)
Subs
trat
e (T
bl 3
)
Hab
itat
Arr
ange
men
t (T
bl 4
)
Wat
er Q
ualit
y (T
bl 5
)
Bio
Pro
cess
/Qua
lity
(Tbl
6)
Bui
ldin
g M
ater
ials
Gra
zing
For
age
Aes
thet
ics
Hea
lth
Thr
eats
Com
mer
cial
Har
vest
Rec
reat
iona
l Har
vest
Eco
logi
cal I
ndic
ator
s
End
ange
red
Spec
ies
Nui
sanc
e Sp
ecie
s
Rec
reat
ion
Dep
reda
tion
Pro
pert
y D
amag
e
Wat
chab
le S
peci
es
Spec
ies
Ric
hnes
s/A
bund
ance
Stra
tifi
cati
on
Gen
etic
Inf
orm
atio
n
Bio
tic
Inte
grit
y
Mat
eria
l Ret
enti
on/E
xpor
t
Pro
duct
ion/
Res
pira
tion
Bio
geoc
hem
ical
Cyc
ling
Rat
e
Sola
r E
nerg
y C
aptu
re
Tro
phic
Lev
el E
ffic
ienc
y
Foo
dweb
Com
plex
ity
Alg
al S
uspe
nded
Sol
ids
TABLE III-6ECOLOGICAL OUTPUTS AND SERVICES DIRECTLY AFFECTED BY BIOLOGICAL QUALITIES,
INCLUDING USACE IMPACT ON BIOLOGICAL QUALITIES
ECOLOGICAL INPUTS
Ecological Outputs
POPULATIONPRODUCTION PROCESS
Terrestrial macrophytes ! ! ! !
Decomposerpopulations
!
Pathogen populations !
Aquatic macrophytes ! ! ! ! ! !
Planktonic algae ! ! ! ! !
Fin-fish populations ! ! ! ! ! ! !
Invertebrate populations ! ! ! ! ! ! ! !
Reptile & amphibianpopulations
! ! ! ! ! ! ! !

45
Mor
phol
ogy
(Tbl
1)
Wat
er &
Mat
eria
l Tra
nsfe
r (T
bl 2
)
Subs
trat
e (T
bl 3
)
Hab
itat
Arr
ange
men
t (T
bl 4
)
Wat
er Q
ualit
y (T
bl 5
)
Bio
Pro
cess
/Qua
lity
(Tbl
6)
Bui
ldin
g M
ater
ials
Gra
zing
For
age
Aes
thet
ics
Hea
lth
Thr
eats
Com
mer
cial
Har
vest
Rec
reat
iona
l Har
vest
Eco
logi
cal I
ndic
ator
s
End
ange
red
Spec
ies
Nui
sanc
e Sp
ecie
s
Rec
reat
ion
Dep
reda
tion
Pro
pert
y D
amag
e
Wat
chab
le S
peci
es
Spec
ies
Ric
hnes
s/A
bund
ance
Stra
tifi
cati
on
Gen
etic
Inf
orm
atio
n
Bio
tic
Inte
grit
y
Mat
eria
l Ret
enti
on/E
xpor
t
Pro
duct
ion/
Res
pira
tion
Bio
geoc
hem
ical
Cyc
ling
Rat
e
Sola
r E
nerg
y C
aptu
re
Tro
phic
Lev
el E
ffic
ienc
y
Foo
dweb
Com
plex
ity
Alg
al S
uspe
nded
Sol
ids
TABLE III-6 (Continued)ECOLOGICAL OUTPUTS AND SERVICES DIRECTLY AFFECTED BY BIOLOGICAL QUALITIES,
INCLUDING USACE IMPACT ON BIOLOGICAL QUALITIES
ECOLOGICAL INPUTS
Ecological Outputs
Bird populations ! ! ! ! ! ! !
Mammal populations ! ! ! ! ! ! !
COMMUNITY PROCESS
Biodiversity ! ! !
Biological integrity ! ! ! ! ! ! ! !
Community metabolism ! ! ! !
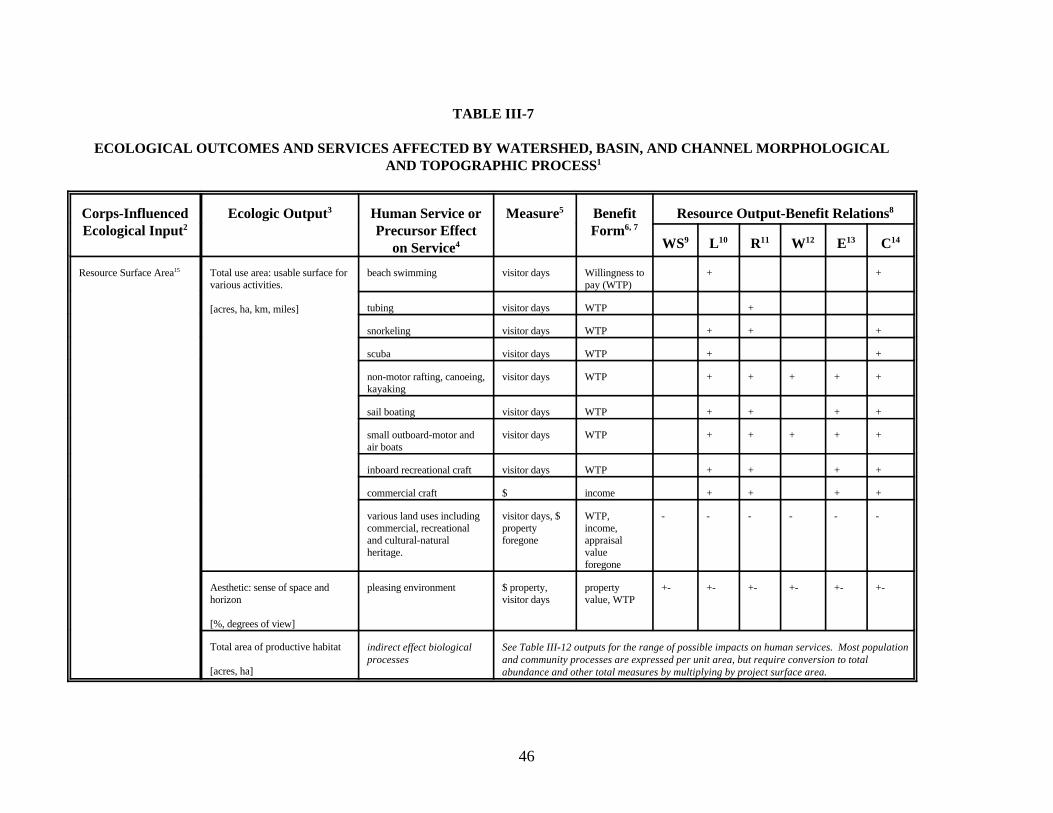
46
TABLE III-7
ECOLOGICAL OUTCOMES AND SERVICES AFFECTED BY WATERSHED, BASIN, AND CHANNEL MORPHOLOGICAL AND TOPOGRAPHIC PROCESS1
Corps-Influenced Ecologic Output Human Service or Measure Benefit Resource Output-Benefit RelationsEcological Input Precursor Effect Form2
3
on Service4
5
6, 7
8
WS L R W E C9 10 11 12 13 14
Resource Surface Area Total use area: usable surface for beach swimming visitor days Willingness to + +15
various activities. pay (WTP)
[acres, ha, km, miles] tubing visitor days WTP +
snorkeling visitor days WTP + + +
scuba visitor days WTP + +
non-motor rafting, canoeing, visitor days WTP + + + + +kayaking
sail boating visitor days WTP + + + +
small outboard-motor and visitor days WTP + + + + +air boats
inboard recreational craft visitor days WTP + + + +
commercial craft $ income + + + +
various land uses including visitor days, $ WTP, - - - - - -commercial, recreational property income,and cultural-natural foregone appraisalheritage. value
foregone
Aesthetic: sense of space and pleasing environment $ property, property +- +- +- +- +- +-horizon visitor days value, WTP
[%, degrees of view]
Total area of productive habitat
[acres, ha]
indirect effect biological See Table III-12 outputs for the range of possible impacts on human services. Most populationprocesses and community processes are expressed per unit area, but require conversion to total
abundance and other total measures by multiplying by project surface area.

47
TABLE III-7 (Continued)
ECOLOGICAL OUTCOMES AND SERVICES AFFECTED BY WATERSHED, BASIN, AND CHANNEL MORPHOLOGICALAND TOPOGRAPHICAL PROCESS1
Corps-Influenced Ecologic Output Human Service or Measure Benefit Resource Output-Benefit RelationsEcological Input Precursor Effect Form2
3
on Service4
5
6, 7
8
WS L R W E C9 10
11 12 13 14
Resource Area Fluctuation Concentration and dilution effect16
[range of acres, ha]
indirect effect via consistency See Table III-12 outputs for details. Surface area fluctuation concentrates and dilutes biological processes,of biological processes altering ecological functions and human services. As consistency decreases benefits usually decrease.
Fluctuation of use base boating See this Table outputs on usable surface area for more detail. Consistency of useable space is anindependent factor determining average utility. Benefits increase with consistency.
swimming See this Table outputs on usable surface area for more detail. Consistency of useable space is anindependent factor determining average utility. Benefits increase with consistency.
aesthetics consistency visitor days, $ WTP, income +- +- +- +- +- +-property
Shore protection property protection developed area damages + + + + +
[shore miles (km, m), acres (ha)]avoided
indirect effect via biological See Table III-12 outputs for detail. Numerous shore-oriented population and community processes areprocesses affected by barrier-beach and other shorezone integrity. As shorezone integrity increases biotic integrity
usually increases, but individual populations may decrease.
indirect effect via water quality See Table III-11 outputs for detail. Numerous chemical and physical attributes are determined by theintegrity of barrier-beach and other shorezone conditions. Output-benefit relations are complex.
Volume Storage capacity flood control flood damage damages + + + +17
[acre-ft, and m ]3avoided
sediment control sediment load damages + + +avoided
water supply upon demand supply WTP, income +consistency
Total material and energy content
[Kg, Kcal]
indirect effect via biological See Table III-12 outputs for detail. Total organismic volumes are determined by concentration and totalprocess habitat volume. Mixed benefit effects as biomass increases, depending on desirability of populations and
their water quality side effects.
indirect effect via water quality See Table III-11 outputs for detail. Total material and energy amounts are determined by concentrationand volume. Total oxygen, for example, determines BOD and COD that can be assimilated; total heatcontent determines cooling water potential. Mixed benefits depending on material desirability.

48
TABLE III-7 (Continued)
ECOLOGICAL OUTCOMES AND SERVICES AFFECTED BY WATERSHED, BASIN, AND CHANNEL MORPHOLOGICALAND TOPOGRAPHICAL PROCESS1
Corps-Influenced Ecologic Output Human Service or Measure Benefit Resource Output-Benefit RelationsEcological Input Precursor Effect Form2
3
on Service4
5
6, 7
8
WS L R W E C9 10
11 12 13 14
Volume (cont.) Concentration and dilution
[kg, Kcal]
indirect effect via biological See Table III-12 outputs for detail. Population concentrations and dependant rate functions are affected byprocess volumetric fluctuations. Output-benefits relations are complex, depending on individual population
composition and side effects (e.g., eutrophication).
indirect effect via water quality See Table III-11 outputs for detail. Virtually all water quality measures are diluted or concentrated byrelative proportions of source-water inflows. Complex output-benefit relations depending on materialcomposition, distribution and amount.
Water discharge sustainability downstream recreation and visitor days, $ WTP, income + + +
[m /sec, ft ]3 3commercial navigation needs. property
indirect effect via instream See Table III-10 and Table III-12 outputs for details. Biological processes in flowing waters dependflows supporting biological fundamentally on water supply rate (discharge). While instream production benefits may increase withprocesses optimum instream flow, regional benefits may decrease.
Oxygen load and concentration
[mg/liter]
indirect and off-site effect via See Table III-12 for output detail. Oxygen is a basic life requirement and rate regulator for virtually alldownstream biological macroorganisms. Production-related benefits usually increase when oxygen is supplied enough to satisfyprocesses most populations.
indirect effect via off-site See Table III-11 for output detail. Oxygen is a primary determinant of reduction-oxidation environmentsdownstream water quality and the form and distribution of many elements and their compounds. It also determines the amount of
BOD and COD that may be assimilated as waste.
Thermal load
[Kcal, BTU]
indirect and off-site effect via See Table III-12 for output details. Heat concentration, temperature, is a basic determinant of life processdownstream biological process rate. Complex output and benefits relationships.
indirect and off-site effect via See Table III-11 for output details. Temperature influences chemical reaction rates and indirectlydownstream water quality determines heat assimilation and industrial cooling capacities.
Material loads
[mg/liter]
indirect and off-site affect via See Table III-12 for output details. A variety of nutrient, toxic and other materials influence biologicaldownstream biological process process rates. Also living organisms are transported downstream with various effects on downstream
communities.
indirect and off-site effect via See Table III-11 for output details. Downstream water quality is fundamentally determined by upstreamdownstream water quality input.
indirect and off-site effect via See Table III-10 for output details. Downstream habitats are basically determined by sediment and nutrientdownstream habitat supply from upstream sources.arrangements

49
TABLE III-7 (Continued)
ECOLOGICAL OUTCOMES AND SERVICES AFFECTED BY WATERSHED, BASIN, AND CHANNEL MORPHOLOGICALAND TOPOGRAPHICAL PROCESS1
Corps-Influenced Ecologic Output Human Service or Measure Benefit Resource Output-Benefit RelationsEcological Input Precursor Effect Form2
3
on Service4
5
6, 7
8
WS L R W E C9 10
11 12 13 14
Volume (cont.) Material loads (cont.)
[mg/liter]
indirect and off-site effect via See other Table III-7 outputs for details. Upstream material load is a basic determinant of channel shapedownstream channel shape and dynamics.
Hydraulic attributes
[m /sec, ft /sec]3 3
indirect and off-site effect via See other Table III-8 outputs for details. Discharge and other water and material transport attributesdownstream morphologic combine with material supply to determine downstream morphologic process.process
indirect and off-site effect via See Table III-10 outputs for detail. Material supply and water and material transport attributes are thedownstream habitat major determinants of habitat arrangement and diversification in downstream environments. arrangements and landscape processes
Depth Clearance to bottom18
[meters, feet, fathoms]
boating See this Table, Surface area, for more detail. Channel depth and flow rates are primary determinants ofnavigation type.
swimming See this Table, surface area, for more detail. Channel depth and flow rates are primary determinants ofswimming use by type.
indirect effect via biological See Table III-12 for output details. Depth is a determinant of population distribution for numerous species.processes
indirect effect via water quality See Table III-11 for output details. Depth of pure water determines light transmission and heat distribution.
Particle resuspension
[mg/liter]
indirect effect via biological See Table III-12 for output details. Depth determines the extent that surface generated mixing influencesprocess sediment stability and resuspension, thus influences biological distributions and nutrition.
indirect effect via water quality See Table III-11 for output details. Because of surface generated mixing, depth to sediments greatlydetermines water quality attributes.
Vertical mixing
[water density variation, tracers]
indirect effect via water and See Table III-8 for output details. Depth affects mixing effectiveness, turbulence and flow velocity, andmaterial transport erosion, transport and deposition.
Tailwater discharge depth
[feet, meters]
indirect and off-site effect via See Table III-12 for output details. Because depth is a major factor determining organism distribution intailwater biological processes lakes, it also contributes to determining biological properties of water released to downstream
environments.

50
TABLE III-7 (Continued)
ECOLOGICAL OUTCOMES AND SERVICES AFFECTED BY WATERSHED, BASIN, AND CHANNEL MORPHOLOGICALAND TOPOGRAPHICAL PROCESS1
Corps-Influenced Ecologic Output Human Service or Measure Benefit Resource Output-Benefit RelationsEcological Input Precursor Effect on Form2
3
Service4
5
6, 7
8
WS L R W E C9 10 11 12 13 14
Depth (cont.) Tailwater discharge depth (cont.) indirect and off-site effect via See Table III-11 for output details. Because depth is a major factor determining mixing rates generated by
[feet, meters]
tailwater water quality surface phenomena, it contributes to determining water quality variation in depth profiles.
hydroelectric Kwatts alternative cost + +savings
Water Area-depth Ratio Evapotranspiration indirect effect via water quality See Table III-11 for output details. Evapotranspiration concentrates materials of all kinds and influences19
salinity and constituents greatly in some areas, and affects temperature.
indirect effect via morphologic See other outputs from Table III-7. Evapotranspiration influences volumes, surface areas and depths. typographic process
Fetch Turbulent mixing indirect effect via water and See Table III-8 for more detail. Wind acting on the fetch is the main mixing force for waters not moved by20
[epilimnetic depth, formulae]material transport gravity.
Slope Lake basin slope boating See this Table, surface area, for more detail. Rates of depth change, slope, are important determinants of21
[%, degrees]boating suitability and safety.
swimming See this Table, surface area, for more detail. Rates of depth change, slope, are important determinants ofswimming suitability and safety.
indirect effect via biological See Table III-12 for more output detail. Distributions and movements of many larger organisms are related toprocess slope, which is an indicator of the proximity of different habitats.
aesthetics of waterbody and visitor days, $ WTP, +- +- +- +- +- +-adjacent shore property income,
appraisals,insurance
indirect effect via water quality See Table III-11 for more details. Locations of intakes and outlets, in part determined by slope, also affect waterquality.
Channel slope indirect effect via biological See Table III-12 for more output detail. Distributions and movements of many stream organisms are related toprocess slope.
boating See this Table, surface area, for more detail. Rates of depth change are important determinants of boatingutility.
swimming See this Table, surface area, for more detail. Rates of depth change are important determinants of swimmingutility.

51
TABLE III-7 (Continued)
ECOLOGICAL OUTCOMES AND SERVICES AFFECTED BY WATERSHED, BASIN, AND CHANNEL MORPHOLOGICALAND TOPOGRAPHICAL PROCESS1
Corps-Influenced Ecologic Output Human Service or Measure Benefit Resource Output-Benefit RelationsEcological Input Precursor Effect Form2
3
on Service4
5
6, 7
8
WS L R W E C9 10
11 12 13 14
Slope (cont.) Channel slope (cont) indirect effect via water quality Slope determines locations of water intakes and outlets, in part determining water quality
hydropower generation (head) Kwatts alternative cost +savings
flood control flood damage damages _ _avoided
indirect effect via water and See this Table, storage capacity and Tables III-9, III-10, III-11 and III=12 for more detail. Erosion andmaterial transport deposition are major dynamics affecting virtually all water-based ecological outputs.
aesthetics of waterbody and visitor days, $ WTP, income, + +adjacent shore property appraisals,
Watershed slope
[%, degree]
indirect effect via water and See Table III-8 for more detail. Watershed slope is a variable determining runoff depth and shear stress onmaterial transport watershed substrates.
Shoreline Length Organic detritus supply22
[km, miles riparian cover]
indirect effect via biological See Table III-12 for detailed output. Many aquatic organisms are influenced by the riparian input ofprocess organic matter used as foods.
indirect effect via water quality See Table III-11 for detailed output. Water quality is influenced by riparian material inputs.
Riparian shade indirect effect via biological See Table III-12 for detailed output. Shade is a cover for many organisms.process
indirect effect via water quality See Table III-11 for detailed output. Shade determines amounts of subsurface light and temperature.
shore recreation visitor days, $ WTP, income, + + + + +property appraisal
Terrestrial organism water use
[km, miles of shore]
indirect effect via biological See Table III-12 for detailed output. Proximity of water to terrestrial environments provides manyprocess organisms with necessary water, food or cover.
Shore erosion indirect effect via biological See Table III-12 for detailed output. Many aquatic and terrestrial riparian organisms are affected byprocess erosion and deposition process.
shoreline property $ property value damage avoided _ _ _ _ _

52
TABLE III-7 (Continued)
ECOLOGICAL OUTCOMES AND SERVICES AFFECTED BY WATERSHED, BASIN, AND CHANNEL MORPHOLOGICALAND TOPOGRAPHICAL PROCESS1
Corps-Influenced Ecologic Output Human Service or Measure Benefit Resource Output-Benefit RelationsEcological Input Precursor Effect Form2
3
on Service4
5
6, 7
8
WS L R W E C9 10
11 12 13 14
Shoreline Length (cont.) Shore erosion (cont.) shore recreation visitor days WTP, protection _ _ _ _ _costs
aesthetics visitor days WTP _ _ _ _ _
Shoreline Irregularity Ratio of shoreline length to water area aesthetics visitor days, $ WTP, income + + + + +23
[miles/acres, km/ha]property
indirect effect via biological See Table III-12 for more detail. Rates and effectiveness of many riparian-organism interactions are related to this ratio.process
indirect effect via water and See Table III-8. Erosion and deposition is much affected by the open water available for wind and gravity driven currentsmaterial transport to operate without energy dissipation.
Channel Form Wetted Perimeter indirect effect via water and See Table III-8 for more detail. Wetted perimeter controls depth, velocity and width interactions as discharge changes.24
[m , acres]2
material transport
indirect effect via biological See Table III-12 and this Table, surface area. Wetted perimeter is a truer measure of benthic surface for life processes thanprocess mapped surface area.
indirect effect via morphologic See this Table under depth, hydraulic retention, and surface area. Increased wetted perimeter increases depth, surface areaprocess and hydraulic retention.
Sinuosity (meander radius, and length) indirect effect via water and See Table III-8 for more detail. Meander radius, length and amplitude controls depth, velocity and width interactions and
[m, ft]material transport the probability of floodplain flooding
aesthetics visitor days, $ WTP, income +- +property
indirect effect via habitat See Table III-10 for more detail. Meander radius predicts variation in flowing habitats, such as riffle and poolarrangement and landscape relationships and ratios. process
indirect effect via morphologic See this Table under depth, hydraulic retention, and surface area. Increased meander radius is associated with increasedprocess depth, surface area, hydraulic retention and floodplain flooding.
boating See this Table under surface area for more detail. Increased meander radius increases the distance travel between twopoints on a river system thus requires more time and costs.
Stream braidedness aesthetics visitor days, $ WTP, income, +-
[channel #]property appraisal
Indirect effect via habitat See Table III-10 for detail. Braiding creates a network of channels and islands which results in habitat patchiness andarrangement and landscape habitat instability.processes
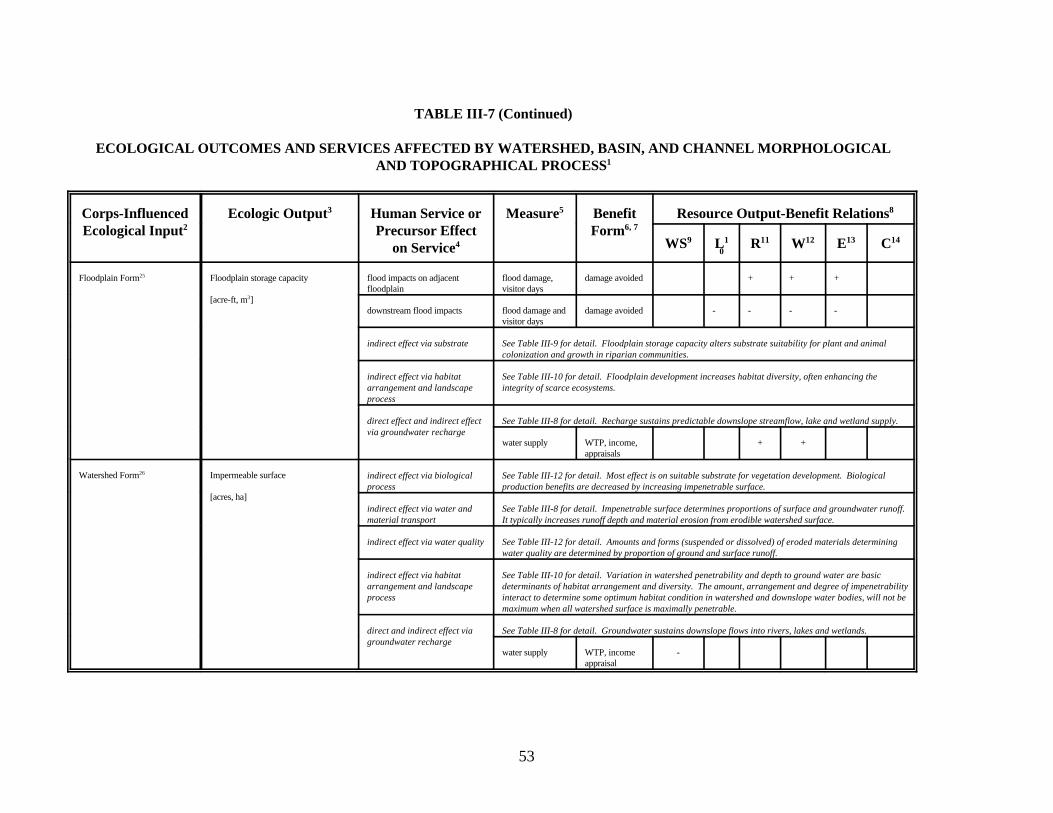
53
TABLE III-7 (Continued)
ECOLOGICAL OUTCOMES AND SERVICES AFFECTED BY WATERSHED, BASIN, AND CHANNEL MORPHOLOGICALAND TOPOGRAPHICAL PROCESS1
Corps-Influenced Ecologic Output Human Service or Measure Benefit Resource Output-Benefit RelationsEcological Input Precursor Effect Form2
3
on Service4
5
6, 7
8
WS L R W E C9 10
11 12 13 14
Floodplain Form Floodplain storage capacity flood impacts on adjacent flood damage, damage avoided + + +25
[acre-ft, m ]3floodplain visitor days
downstream flood impacts flood damage and damage avoided - - - -visitor days
indirect effect via substrate See Table III-9 for detail. Floodplain storage capacity alters substrate suitability for plant and animalcolonization and growth in riparian communities.
indirect effect via habitat See Table III-10 for detail. Floodplain development increases habitat diversity, often enhancing thearrangement and landscape integrity of scarce ecosystems.process
direct effect and indirect effect See Table III-8 for detail. Recharge sustains predictable downslope streamflow, lake and wetland supply. via groundwater recharge
water supply WTP, income, + +appraisals
Watershed Form Impermeable surface26
[acres, ha]
indirect effect via biological See Table III-12 for detail. Most effect is on suitable substrate for vegetation development. Biologicalprocess production benefits are decreased by increasing impenetrable surface.
indirect effect via water and See Table III-8 for detail. Impenetrable surface determines proportions of surface and groundwater runoff. material transport It typically increases runoff depth and material erosion from erodible watershed surface.
indirect effect via water quality See Table III-12 for detail. Amounts and forms (suspended or dissolved) of eroded materials determiningwater quality are determined by proportion of ground and surface runoff.
indirect effect via habitat See Table III-10 for detail. Variation in watershed penetrability and depth to ground water are basicarrangement and landscape determinants of habitat arrangement and diversity. The amount, arrangement and degree of impenetrabilityprocess interact to determine some optimum habitat condition in watershed and downslope water bodies, will not be
maximum when all watershed surface is maximally penetrable.
direct and indirect effect via See Table III-8 for detail. Groundwater sustains downslope flows into rivers, lakes and wetlands.groundwater recharge
water supply WTP, income -appraisal

54
TABLE III-7 (Continued)
ECOLOGICAL OUTCOMES AND SERVICES AFFECTED BY WATERSHED, BASIN, AND CHANNEL MORPHOLOGICALAND TOPOGRAPHICAL PROCESS1
Corps-Influenced Ecologic Output Human Service or Measure Benefit Resource Output-Benefit RelationsEcological Input Precursor Effect Form2
3
on Service4
5
6, 7
8
WS L R W E C9 10
11 12 13 14
Watershed Form (cont.) Depression storage
[acre ft, m ]3
indirect effect via biological See Table III-12 for range of impacts possible. Depression storage determines different watershed soilprocess moisture, temporary ponding, and dependent biological processes.
indirect effect via water & See Table III-8 for detail. Increased depression storage decreases runoff depth and velocity, thus decreasesmaterial transport net watershed erosion.
indirect effect via water quality See Table III-11 for detail. Depression storage increases retention of surface materials and usuallyencourages a greater proportion of dissolved material runoff.
indirect effect via habitat See Table III-10 for detail. Large depressions in watersheds greatly contribute to habitat variation andarrangement and landscape arrangements in the watershed and adjacent water bodies.process
indirect and direct effect via See Table III-8 for detail. Groundwater sustains stable downslope river flows, and elevations in lakes andgroundwater recharge wetlands.
water supply WTP, income, +appraisal
1. Morphologic topographic process is directly affected by Corps activities, usually by creating basins and channels through building barriers, dredging and filling.2. Ecological input variables effecting ecological outputs vary with project. Input variables are either directly or indirectly influenced by Corps management decisions. Project effectiveness is evaluated by examining the collective effects of all Corps
influenced inputs.3. Ecological outputs are physical, chemical and biological responses to natural or human-caused changes in the environment.4. Human services are the social functions performed by the ecological output.5. The more common measures of human services are provided for each category; project services may vary from the most common measures.6. The form of benefit provided by the human service. Only the most prominent forms of benefit are provided.7. Human demand for the service will be unique for each project and needs to uniquely evaluated. Considerations for estimating demand include:
a. Regional presence of high demand of the targeted resources in total or per unit area.b. Periodic shortages of resource availability or access, for example, when visitors are turned away from use areas on weekends or water rationing.c. Legal mandates for services including environmental laws and standards.d. Stakeholder willingness to contribute funding to project development.e. Potential for use in environmental education.f. Specific non-use value for a particular natural resource, which can be found at very few locations, including the project location.
8. Major water resource divisions are identified here. A plus, minus, or both indicates the usual relationship between ecological output and benefit)whether it is positive or negative as ecological output increases. Where no value is provided, theservice for that category is considered minor or non-existent, although specific project conditions may be exceptional.
9. The watershed category includes all projects contributing surface and subsurface (groundwater input) as well as downslope watershed influenced by the project.10. The lake category includes all inland waters occupying basins, either temporary or permanent, with a level surface; they may be natural or artificial, including those formed by dams and dikes, and by dredging. Morphology and water and material
transport characteristics physically determine more specific lake categories for each project.

55
11. The river category includes all flows occupying channels and generated on a slope by gravity, temporary or permanent; they may be natural or artificial, including excavated and otherwise engineered water conveyances. 12. The wetland category includes all areas in which soils are temporarily to permanently flooded inland and coastal sites and often support, or could support, indicator plant growth. These are highly variable in form and include marshes, swamps, and
bogs in various forms. Wetland types are usually defined by their proximity to other water resources, such as estuarine marshes and riverine bottomlands.13. The estuary category includes all water bodies where marine and inland waters converge, are affected by tides, and often, but not necessarily, vary in salt content.14. Oceanic coastal areas occur where undiluted ocean water meets shore, thus lie beyond the obvious effect of inland water runoff.15. Resource surface area usually is managed by damming or otherwise changing water depth.16. Area fluctuation is managed mainly through placement of impoundments and operation of water and sediment control structures such as dams, dikes, and levees, or by mechanical movement of sediment.17. Volume is managed mostly through placement of impoundments, operation of water-control structures and via dredging and filling.18. Depth is managed primarily through placement and operation of impoundments and other water-control structures, and through dredging and filling activities.19. The area-depth ratio is managed by control structure placement and operations and by dredging and filling effects on basin shapes (area-volume-depth relationships).20. Fetch is managed by placement and management of water control structures.21. Slope is managed mostly by the placement of water control structures and their operation, but also through dredging and filling activity.22. Shoreline length is managed water-level and discharge control, beach nourishment, dredging.23. Shoreline irregularity is managed through water-level control, dredging and filling.24. Channel form is managed by control of water and material discharge, river control structure construction and operation, and dredging or other artificial channel development.25. Floodplain form is managed by water-level control, discharge control of water and material, depression filling or excavation and construction and operation of dikes and levees.26. Watershed form is managed mostly by vegetation management and management of the impermeable surface.

56
TABLE III-8
ECOLOGICAL OUTCOMES AND SERVICES AFFECTED BY WATER AND MATERIAL TRANSPORT PROCESSINCLUDING USACE IMPACT ON ECOSYSTEM TRANSPORT PROCESS27
Corps-Influenced Ecological Ecological Output Human Service or Measure Benefit Form Resource Output-Benefit RelationsInput Precursor Effect on2
3
Service4
5 6,7
8
WS L R W E C9 10 11 12 13 14
Discharge Watershed discharge and load28
[m , ft , kg, tonnes]3 3
indirect effect via See Table III-12 for detailed output. Discharge and load haves indirect effects on virtually all biologicalbiological process process via effects of depth, velocity and abrasion by transported material
indirect effect via water See Table III-11 for detailed output. Discharge and load determine water quality.quality
indirect effect via See Table III-9 for details. Watershed discharge determines watershed topography with other factors.substrate
Waterbody discharge and load
[m , ft , kg, tonnes]3 3
indirect and off-site effect See Table III-12 for detailed output. Discharge and load have indirect effects on all biological process viavia biological process effects on water quality, depth, velocity and abrasion by transported material.downstream
indirect effect via See Table III-7 for details. Waterbody discharge determines the depth, surface area, volume and othermorphologic process morphologic processes of the water body and downstream channel discharge.
indirect and off-site effect See Table III-9 for detailed output. Discharge and load have indirect effects on substrate composition,via downstream substrate stability, and consolidation.
indirect and off-site effect See Table III-11 for detailed output. Discharge affects on load determine water quality.via water qualitydownstream
flooding both upstream and area affected, WTP, income, - - - - - -downstream visitor days, appraisal,
property $ insurance
Hydraulic retention
[discharge/volume (days)]
indirect effect via See Table III-12 for detailed output. Major effects are on flushing of water body/inhabitants downstream.biological process
indirect effect via See Table III-9 for detailed output. Hydraulic retention influences sedimentation accumulation rate.substrate
indirect effect via water See Table III-11 for detailed output. Hydraulic retention influences sedimentation rate of particulatequality materials.
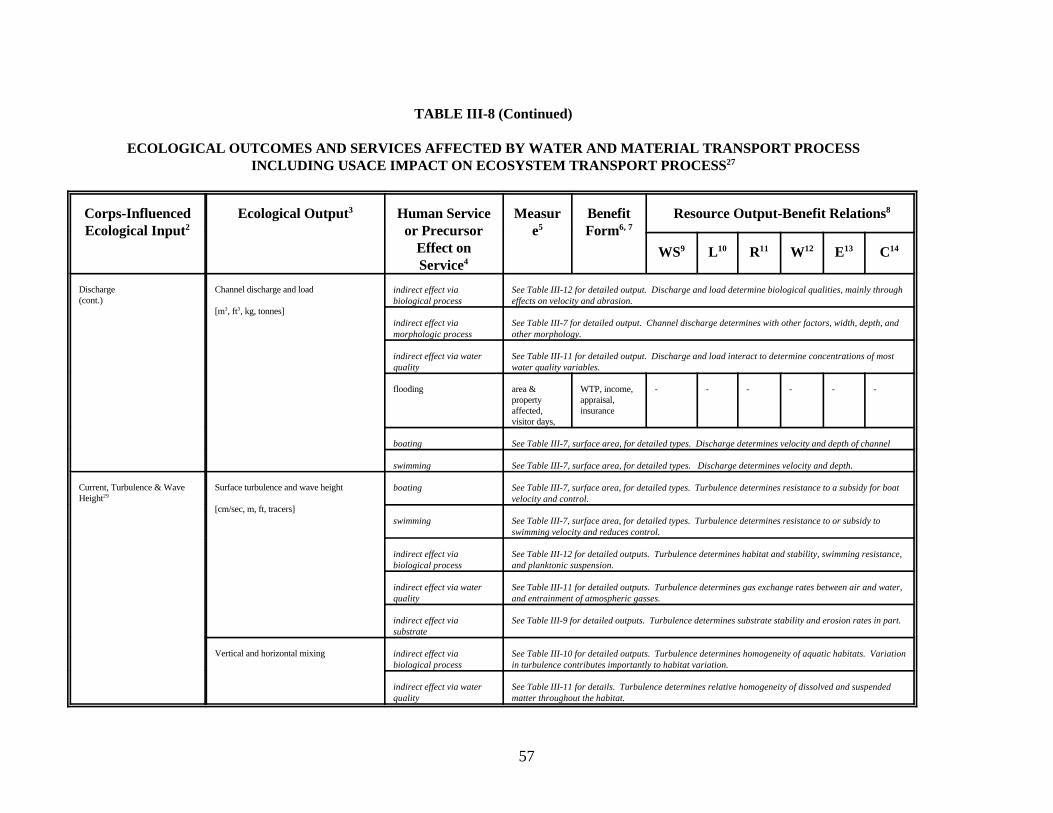
57
TABLE III-8 (Continued)
ECOLOGICAL OUTCOMES AND SERVICES AFFECTED BY WATER AND MATERIAL TRANSPORT PROCESSINCLUDING USACE IMPACT ON ECOSYSTEM TRANSPORT PROCESS27
Corps-Influenced Ecological Output Human Service Measur Benefit Resource Output-Benefit RelationsEcological Input or Precursor e Form2
3
Effect onService4
5 6, 7
8
WS L R W E C9 10 11 12 13 14
Discharge Channel discharge and load(cont.)
[m , ft , kg, tonnes]3 3
indirect effect via See Table III-12 for detailed output. Discharge and load determine biological qualities, mainly throughbiological process effects on velocity and abrasion.
indirect effect via See Table III-7 for detailed output. Channel discharge determines with other factors, width, depth, andmorphologic process other morphology.
indirect effect via water See Table III-11 for detailed output. Discharge and load interact to determine concentrations of mostquality water quality variables.
flooding area & WTP, income, - - - - - -property appraisal,affected, insurancevisitor days,
boating See Table III-7, surface area, for detailed types. Discharge determines velocity and depth of channel
swimming See Table III-7, surface area, for detailed types. Discharge determines velocity and depth.
Current, Turbulence & Wave Surface turbulence and wave heightHeight29
[cm/sec, m, ft, tracers]
boating See Table III-7, surface area, for detailed types. Turbulence determines resistance to a subsidy for boatvelocity and control.
swimming See Table III-7, surface area, for detailed types. Turbulence determines resistance to or subsidy toswimming velocity and reduces control.
indirect effect via See Table III-12 for detailed outputs. Turbulence determines habitat and stability, swimming resistance,biological process and planktonic suspension.
indirect effect via water See Table III-11 for detailed outputs. Turbulence determines gas exchange rates between air and water,quality and entrainment of atmospheric gasses.
indirect effect via See Table III-9 for detailed outputs. Turbulence determines substrate stability and erosion rates in part.substrate
Vertical and horizontal mixing indirect effect via See Table III-10 for detailed outputs. Turbulence determines homogeneity of aquatic habitats. Variationbiological process in turbulence contributes importantly to habitat variation.
indirect effect via water See Table III-11 for details. Turbulence determines relative homogeneity of dissolved and suspendedquality matter throughout the habitat.

58
TABLE III-8 (Continued)
ECOLOGICAL OUTCOMES AND SERVICES AFFECTED BY WATER AND MATERIAL TRANSPORT PROCESSINCLUDING USACE IMPACT ON ECOSYSTEM TRANSPORT PROCESS27
Corps-Influenced Ecological Output Human Service Measur Benefit Resource Output-Benefit RelationsEcological Input or Precursor e Form2
3
Effect onService4
5 6, 7
8
WS L R W E C9 10 11 12 13 14
Current, Turbulence & Wave Height Erosion, transport and deposition dynamics indirect effect via substrate See Table III-9 for details. Erosion and deposition are major determinants of substrate condition depend on transport(cont.) capacity of waterbodies.
[kg/m , mg/l]2
indirect effect via water See Table III-11 for details. Transport capacity determines form (suspended or dissolved) and amounts of materials inquality the water column.
indirect effect via See Table III-7. Degradation and aggradation are major forces shaping basins and channels.morphologic process
indirect effect via biological See Table III-12 for detail. Forces affect ability of organisms to sustain position and to obtain food and cover resources.process
indirect effect via habitat See Table III-10 for detail. Erosion and deposition are major forces shaping the arrangements of habitats withinarrangement and process waterbodies and adjacent riparian and watershed areas.
1. Morphologic topographic process is directly affected by Corps activities, usually by creating basins and channels through building barriers, dredging and filling.2. Ecological input variables effecting ecological outputs vary with project. Input variables are either directly or indirectly influenced by Corps management decisions. Project effectiveness is evaluated by examining the
collective effects of all Corps influenced inputs.3. Ecological outputs are physical, chemical and biological responses to natural or human-caused changes in the environment.4. Human services are the social functions performed by the ecological output.5. The more common measures of human services are provided for each category; project services may vary from the most common measures.6. The form of benefit provided by the human service. Only the most prominent forms of benefit are provided.7. Human demand for the service will be unique for each project and needs to uniquely evaluated. Considerations for estimating demand include:
a. Regional presence of high demand of the targeted resources in total or per unit area.b. Periodic shortages of resource availability or access, for example, when visitors are turned away from use areas on weekends or water rationing.c. Legal mandates for services including environmental laws and standards.d. Stakeholder willingness to contribute funding to project development.e. Potential for use in environmental education.f. Specific non-use value for a particular natural resource, which can be found at very few locations, including the project location.
8. Major water resource divisions are identified here. A plus, minus, or both indicates the usual relationship between ecological output and benefit)whether it is positive or negative as ecological output increases. Where no valueis provided, the service for that category is considered minor or non-existent, although specific project conditions may be exceptional.
9. The watershed category includes all projects contributing surface and subsurface (groundwater input) as well as downslope watershed influenced by the project.10. The lake category includes all inland waters occupying basins, either temporary or permanent, with a level surface; they may be natural or artificial, including those formed by dams and dikes, and by dredging. Morphology and
water and material transport characteristics physically determine more specific lake categories for each project.11. The river category includes all flows occupying channels and generated on a slope by gravity, temporary or permanent; they may be natural or artificial, including excavated and otherwise engineered water conveyances. 12. The wetland category includes all areas in which soils are temporarily to permanently flooded inland and coastal sites and often support, or could support, indicator plant growth. These are highly variable in form and include
marshes, swamps, and bogs in various forms. Wetland types are usually defined by their proximity to other water resources, such as estuarine marshes and riverine bottomlands.13. The estuary category includes all water bodies where marine and inland waters converge, are affected by tides, and often, but not necessarily, vary in salt content.14. Oceanic coastal areas occur where undiluted ocean water meets shore, thus lie beyond the obvious effect of inland water runoff.27. Water and material transport includes all those attributes of discharge, current, and turbulence that determine erosion, load transport, and deposition of materials.28. Discharge is managed by watershed management and operation of water control structures.29. Currents and turbulence are managed primarily through management of discharge, channel form and placement of wing-dams, sediment islands, groins and other barriers.
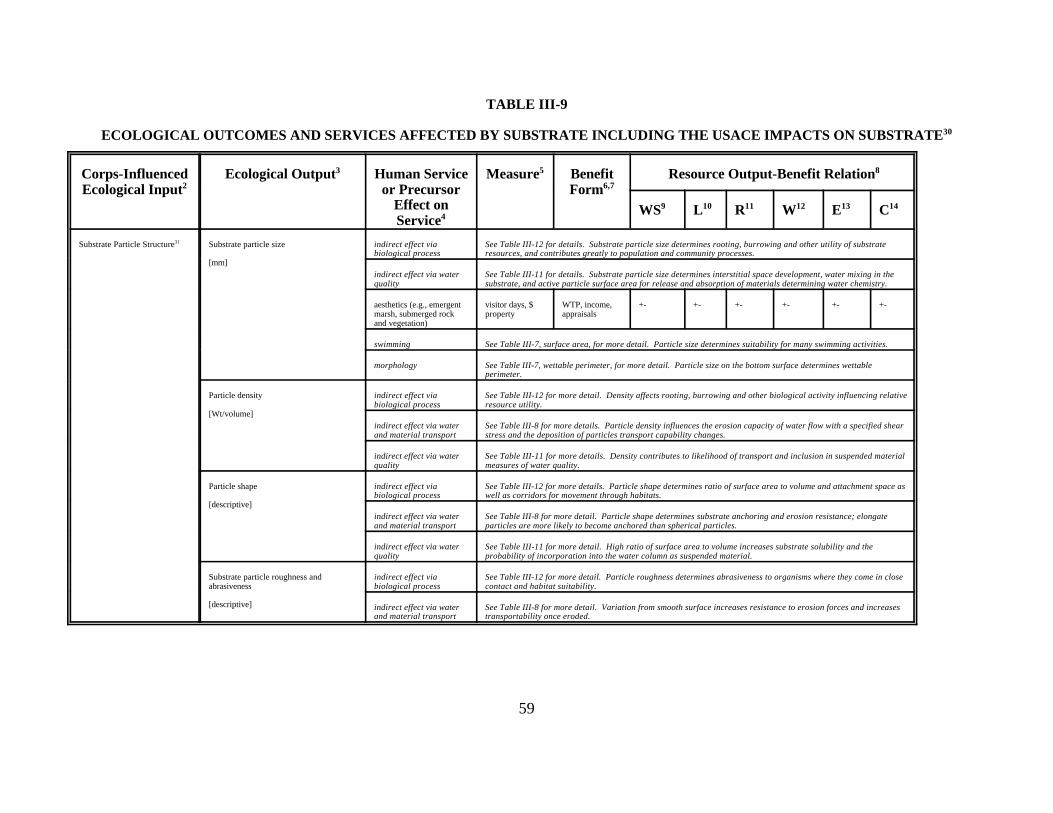
59
TABLE III-9
ECOLOGICAL OUTCOMES AND SERVICES AFFECTED BY SUBSTRATE INCLUDING THE USACE IMPACTS ON SUBSTRATE30
Corps-Influenced Ecological Output Human Service Measure Benefit Resource Output-Benefit RelationEcological Input or Precursor Form2
3
Effect onService4
5
6,7
8
WS L R W E C9 10 11 12 13 14
Substrate Particle Structure Substrate particle size indirect effect via See Table III-12 for details. Substrate particle size determines rooting, burrowing and other utility of substrate31
[mm]biological process resources, and contributes greatly to population and community processes.
indirect effect via water See Table III-11 for details. Substrate particle size determines interstitial space development, water mixing in thequality substrate, and active particle surface area for release and absorption of materials determining water chemistry.
aesthetics (e.g., emergent visitor days, $ WTP, income, +- +- +- +- +- +-marsh, submerged rock property appraisalsand vegetation)
swimming See Table III-7, surface area, for more detail. Particle size determines suitability for many swimming activities.
morphology See Table III-7, wettable perimeter, for more detail. Particle size on the bottom surface determines wettableperimeter.
Particle density indirect effect via See Table III-12 for more detail. Density affects rooting, burrowing and other biological activity influencing relative
[Wt/volume]biological process resource utility.
indirect effect via water See Table III-8 for more details. Particle density influences the erosion capacity of water flow with a specified shearand material transport stress and the deposition of particles transport capability changes.
indirect effect via water See Table III-11 for more details. Density contributes to likelihood of transport and inclusion in suspended materialquality measures of water quality.
Particle shape indirect effect via See Table III-12 for more details. Particle shape determines ratio of surface area to volume and attachment space as
[descriptive]biological process well as corridors for movement through habitats.
indirect effect via water See Table III-8 for more detail. Particle shape determines substrate anchoring and erosion resistance; elongateand material transport particles are more likely to become anchored than spherical particles.
indirect effect via water See Table III-11 for more detail. High ratio of surface area to volume increases substrate solubility and thequality probability of incorporation into the water column as suspended material.
Substrate particle roughness and indirect effect via See Table III-12 for more detail. Particle roughness determines abrasiveness to organisms where they come in closeabrasiveness biological process contact and habitat suitability.
[descriptive] indirect effect via water See Table III-8 for more detail. Variation from smooth surface increases resistance to erosion forces and increasesand material transport transportability once eroded.

60
TABLE III-9 (Continued)
ECOLOGICAL OUTCOMES AND SERVICES AFFECTED BY SUBSTRATE INCLUDING THE USACE IMPACTS ONSUBSTRATE30
Corps-Influenced Ecological Output Human Service Measure Benefit Resource Output-Benefit RelationEcological Input or Precursor Form2
3
Effect onService4
5
6,7
8
WS L R W E C9 10 11 12 13 14
Particle Structure (cont.) Substrate particle roughness andabrasiveness (cont.)
[descriptive]
indirect effect via water See Table III-11 for more detail. Roughness increases surface area for chemical erosion.quality
Substrate particle aggregation
[descriptive]
indirect effect via See Table III-12 for more detail. Aggregation, as formed by clay cohesion and root growth, affects resourcebiological process utility by different populations.
indirect effect via water See Table III-8 for more detail. Aggregation increases mass resistant to erosive displacement.and material transport
indirect effect via water See Table III-11 for more detail. Aggregation affects solubility through surface-volume relationships andquality interstitial extent.
Substrate particle stability
[movement/time]
indirect effect via See Table III-12 for more detail. Substrate stability determines the reliability of substrate as support and coverbiological process for all species.
indirect and direct effect property $, income, WTP + + + + + +via construction support highways,
sewerage, etc
See Table III-8 for detail. Substrate stability determines erosion.
Substrate particle compaction
[weight/volume corrected for particledensity]
indirect effect via See Table III-12 for detail. Substrate compaction affects root growth, burrowing and other biological process.biological process
construction support in property $, income, WTP + +floodplains and watersheds highways,
sewerage, etc
indirect effect via water See Table III-8 for detail. Compaction determines substrate erosion.and material transport
Substrate Chemistry Organic-matter content aesthetics visitor days, $ WTP, income, +- +- +- +- +- +-32
[fraction, mg/Kg]property appraisals
swimming See Table III-7, surface area, for more detail. Organic content affects the substrate suitability for wading etc.

61
TABLE III-9 (Continued)
ECOLOGICAL OUTCOMES AND SERVICES AFFECTED BY SUBSTRATE INCLUDING THE USACE IMPACTS ON SUBSTRATE30
Corps-Influenced Ecological Output Human Service Measure Benefit Resource Output-Benefit RelationEcological Input or Precursor Form2
3
Effect on Service4
5
6,7
8
WS L R W E C9 10 11 12 13 14
Substrate Chemistry Organic-matter content (cont.) indirect effect via See Table III-12 for detail. A base for benthic detritus feeders and food chains.(cont.) biological process
[fraction, mg/Kg]indirect effect via water See Table III-8 for detail. Living and dead roots and branches and other litter add stability to substrates andand material transport erosion resistance.
indirect effect via water See Table III-11 for details. Absorbs many nutrient, toxic and other materials depending on reduction-oxidationquality state. Exerts oxygen demand on water in and above the sediment, thus greatly influencing reduction-oxidation
environment. Also affects carbon dioxide, carbonic acid and hydrogen ion concentration, also influencingreduction-oxidation environment.
Nutrient content indirect effect via See Table III-12 for details. Important for root uptake.
[mg/l, mg/kg]biological process
indirect effect via water See Table III-11 for details. Determines in part the amount of soluble nutrient transferred to interstitial water andquality water column.
Toxic contaminant content indirect effect via See Table III-12 for details. Toxic material uptake and impacts important for benthic organisms.biological process
indirect effect via water See Table III-11 for details. Toxic materials, depending on solubility and transport, are transferred to interstitialquality water and water column.
Material solubility indirect effect via See Table III-12 for details. Solubility is critical for root uptake of nutrients as a consequence of their impact on
[weight loss rate] substrate particles.biological process reduction-oxidation environment. Determined greatly by the amount of carbonate and other soluble material in the
indirect effect via water See Table III-8 for details. Soluble matter is more readily transported.and material transport
indirect effect via water See Table III-11 for details. Substrate solubility is a basic determinant of interstitial water quality and transfer toquality the water quality.
Substrate Orientation and Within-habitat vertical development indirect effect via See Table III-12 for details. Provides physical diversity for food and cover and influences hydraulic energetics toDevelopment biological process trap sediments and associated organics. Major factor for determining ecological pathways and diversity.33
[m, ft]
indirect effect via See Table III-7 for details. Horizontal development of structure influences channel and basin shapes, directly andmorphologic process indirectly through water and material transport.
indirect effect water and See Table III-8 for details. Structural development changes flow patterns and energies.material transport

62
TABLE III-9 (Continued)
ECOLOGICAL OUTCOMES AND SERVICES AFFECTED BY SUBSTRATE INCLUDING THE USACE IMPACTS ONSUBSTRATE30
Corps-Influenced Ecological Output Human Service Measure Benefit Resource Output-Benefit RelationEcological Input or Precursor Form2
3
Effect onService4
5
6,7
8
WS L R W E C9 10 11 12 13 14
Substrate Orientation and Within habitat vertical developmentDevelopment (cont.)(cont.)
[m, ft]
indirect effect via habitat See Table III-10 for details. Structural development changes habitat arrangements.arrangement andlandscape process
indirect effect via water See Table III-11 and this Table above for details. Structural development creates greater absorption surfacequality and sequestering and release of nutrient and toxic materials depending on reduction-oxidation and transport
environments.
aesthetics--as created by visitor days, $ WTP, income, + + + + + +spacial diversification of property appraisalshape and color insubmerged marshes etc.
Between-habitat vertical development indirect effect via See Table III-12 for details. Structural development increases surface amount and diversity of physical nichesbiological process for population resource utility. Vertical development creates movement corridors for many organisms using
both aquatic and terrestrial environments.
morphometric See Table III-7 for details. Structural development alters channel and basin shape and associated dimensions.aetonographic process
indirect effect via water See Table III-8 for details. Structural development alters substrate resistance to erosion and hydraulicand material transport energetics operating on substrates.
indirect effect via water See Table III-11 for details. High surface area: volume ratio provides much absorption surface forquality sequestering various toxic and nutrient materials.
indirect effect via habitat See Table III-10 for more detail. Creates connections between quite different environments resulting in aarrangement and diverse physical space such as in marshes and swamps.landscape process
aesthetics--as affected by visitor days, $ WTP, income, + + + + + +spacial diversification in property appraisalemergent marshes etc.
1. Morphologic topographic process is directly affected by Corps activities, usually by creating basins and channels through building barriers, dredging and filling.2. Ecological input variables effecting ecological outputs vary with project. Input variables are either directly or indirectly influenced by Corps management decisions. Project effectiveness is evaluated by examining the collective effects of all Corps
influenced inputs.3. Ecological outputs are physical, chemical and biological responses to natural or human-caused changes in the environment.

63
4. Human services are the social functions performed by the ecological output.5. The more common measures of human services are provided for each category; project services may vary from the most common measures.6. The form of benefit provided by the human service. Only the most prominent forms of benefit are provided.7. Human demand for the service will be unique for each project and needs to uniquely evaluated. Considerations for estimating demand include:
a. Regional presence of high demand of the targeted resources in total or per unit area.b. Periodic shortages of resource availability or access, for example, when visitors are turned away from use areas on weekends or water rationing.c. Legal mandates for services including environmental laws and standards.d. Stakeholder willingness to contribute funding to project development.e. Potential for use in environmental education.f. Specific non-use value for a particular natural resource, which can be found at very few locations, including the project location.
8. Major water resource divisions are identified here. A plus, minus, or both indicates the usual relationship between ecological output and benefit)whether it is positive or negative as ecological output increases. Where no value is provided, theservice for that category is considered minor or non-existent, although specific project conditions may be exceptional.
9. The watershed category includes all projects contributing surface and subsurface (groundwater input) as well as downslope watershed influenced by the project.10. The lake category includes all inland waters occupying basins, either temporary or permanent, with a level surface; they may be natural or artificial, including those formed by dams and dikes, and by dredging. Morphology and water and material
transport characteristics physically determine more specific lake categories for each project.11. The river category includes all flows occupying channels and generated on a slope by gravity, temporary or permanent; they may be natural or artificial, including excavated and otherwise engineered water conveyances. 12. The wetland category includes all areas in which soils are temporarily to permanently flooded inland and coastal sites and often support, or could support, indicator plant growth. These are highly variable in form and include marshes, swamps, and
bogs in various forms. Wetland types are usually defined by their proximity to other water resources, such as estuarine marshes and riverine bottomlands.13. The estuary category includes all water bodies where marine and inland waters converge, are affected by tides, and often, but not necessarily, vary in salt content.14. Oceanic coastal areas occur where undiluted ocean water meets shore, thus lie beyond the obvious effect of inland water runoff.30. Substrate includes all solid surfaces and their subsurface composition in watersheds and waterbodies.31. Substrate particle structure is managed by dredging, filling, and beach nourishment.32. Substrate chemistry is managed mostly through morphologic process and material transport process, and by dredging, filling and beach nourishment.33. Substrate orientation and development is managed by structural modification through placement of water control structures and artificial habitat, and indirectly through encouragement of ecological succession.

64
TABLE III-10
ECOLOGICAL OUTCOMES AND SERVICES AFFECTED BY HABITAT ARRANGEMENT AND LANDSCAPE PROCESSINCLUDING USACE IMPACTS ON LANDSCAPE34
Corps- Ecological Output Human Services Measure Benefit Resource Output-Benefit RelationsInfluenced or Precursor FormEcological Effect on
Input Service2
3
4
5
6,7
8
WS L R W E C9 10 11 12 13 14
Habitat Patchiness Within-project habitat patchiness35
[landscape ecology formulas]
indirect effect via See Table III-12 for range of possible impacts. Habitat fragmentation within boundaries causes insufficientbiological process habitat element sizes for supporting desired species or fragmentation encourages undesirable species.
aesthetics visitor days, $ WTP, +- +- +- +- +- +-property income,
appraisal
Regional habitat patchiness indirect effect via See Table III-12 for range of possible impacts. Habitat fragmentation may be reduced or increased dependingbiological process on project placement and development with respect to relevant regional habitat distribution. Affects size and
separation of habitat islands in other habitat matrix, including, most obviously, terrestrial islands in waterbodies.
Edge development indirect effect via See Table III-12 for detail. Unique habitat conditions usually develop where two dissimilar habitats abut andbiological process are occupied by unique species which interact with species occupying centers of the two habitats.
aesthetics visitor days, $ WTP, + + + + + +property income,
appraisal
Corridors (Habitat Intra-habitat connections aesthetics visitor days, $ WTP, +- +- +- +- +- +-Connections) property income,36
appraisal
indirect effect via See Table III-12 for details. Critical for species with diverse habitat needs to complete life cycle. Forbiological process example, emergent plants act as travel corridors for emerging aquatic insects.
Inter-habitat connections indirect effect via See Table III-12 for details. Connections among similar habitats or habitats required for different life stagesbiological process affect the viability of many populations. Most obvious examples are connecting channels among open waters
of wetlands, among channels in a braided stream, or among lakes.
aesthetics visitor days, $ WTP, +- +- +- +- +- +-property income,
appraisal
Air-water interface atmospheric humidification relative cooling +- +- +- +- +- +-
[acres, ha]humidity costs, WTP

65
TABLE III-10 (Continued)
ECOLOGICAL OUTCOMES AND SERVICES AFFECTED BY HABITAT ARRANGEMENT AND LANDSCAPE PROCESS INCLUDING USACEIMPACTS ON LANDSCAPE34
Corps-Influenced Ecological Output Human Services or Measure Benefit Resource Output-Benefit RelationsEcological Input Precursor Effect on Service Form2
3
4
5
6,7
8
WS L R W E C9 10 11 12 13 14
Corridors (Habitat Air-water interface (cont.) indirect effect via water and See Table III-8, currents and turbulence. Operation of wind over the surface generates turbulence.Connections) (cont.) material transport
[acres, ha]indirect effect via water See Table III-11, especially oxygen and H+. Air-water interface determines gas exchange, which influences aquality number of water quality parameters.
Habitat Diversity Within-habitat diversity indirect effect via biological See Table III-12 for details. Spacial diversity is a major determinant of the potential species diversity that may37
[landscape ecology formulas]process occur within habitats.
aesthetics visitor days, $ WTP, + + + + + +property income,
appraisal
Between-habitat diversity indirect effect via biological See Table III-12 for details. Regional habitat diversity is a major determinant of the regional species diversityprocess that can occur.
aesthetics visitor days, $ WTP, + + + + + +property income,
appraisal
Habitat interspersion indirect effect via biological See Table III-12 for detail. The interspersion of habitat determines distance that must be crossed for speciesprocess that require more than one habitat to complete life cycle.
Human Habitat (Access, Foot, road, and parking access recreation visitor days WTP + + + + + +facilities and other humandensity) [acres, miles]38
property value $ income, +- +- +- +- +- +-appraisals
aesthetics visitor days WPT +- +- +- +- +- +-
indirect effect via water and See Table III-8 for details. Water diversion, site erosion and other erosion occurs at roads and othermaterial transport structures.
indirect effect via substrate See Table III-9. Roads alter watershed and floodplain substrate attributes.
indirect effect via habitat See this Table, especially habitat connectivity and edge. roads create corridors and barriers between habitats. arrangement roads also create edge and fragment habitats.
indirect effect via See Table III-7, watershed form and impermeability. Roads and other structures increase impermeability.morphologic process

66
TABLE III-10 (Continued)
ECOLOGICAL OUTCOMES AND SERVICES AFFECTED BY HABITAT ARRANGEMENT AND LANDSCAPE PROCESS INCLUDING USACE IMPACTS ON LANDSCAPE34
Corps-Influenced Ecological Output Human Services or Measure Benefit Resource Output-Benefit RelationsEcological Input Precursor Effect on Form2
3
Service4
5
6,7
8
WS L R W E C9 10 11 12 13 14
Human Habitat (Access, Foot, road, and parking access (cont.)facilities and other humandensity) (cont.) [acres, miles]
indirect effect via water See Table III-11. Road use adds exhaust, tire-rubber and other contaminants to air and water.quality
indirect effect via biological See Table III-12. Roads result in disturbances with direct impacts on mortality, growth and natality for localquality life forms.
Boat ramps recreation visitor days WTP + + + + +
[numbers, lanes, feet] property value $ income, +- +- +- +- +-appraisals
aesthetics visitor days WTP +- +- +- +- +-
indirect effect via water and See Table III-8. Ramps can decrease or increase erosion, depending on construction.material transport
indirect effect via substrate See Table III-9. Ramps locally alter substrates.
Docks, marinas, promenades recreation use visitor days WTP + + + + +
[number, slips] property value $ income, + + + + +appraisal
aesthetics visitor days, WTP, +- +- +- +- +-property $ income,
appraisals
indirect effect via water and See Table III-8. Docks and marinas and promenades alter shore currents and erosion process.material transport
indirect effect via substrate See Table III-9. Docks and marinas alter substrate form and orientation
indirect effect via habitat See Table III-10. Docks and marinas alter habitat arrangements, especially related to light and currents.arrangement and landscapeprocess
Sanitary facilities (toilets, showers, recreation visitor days WTP + + + + +drinking water, fish cleaning stations,garbage receptacles)
[number of units] aesthetics visitor days WTP

67
TABLE III-10 (Continued)
ECOLOGICAL OUTCOMES AND SERVICES AFFECTED BY HABITAT ARRANGEMENT AND LANDSCAPE PROCESSINCLUDING USACE IMPACTS ON LANDSCAPE34
Corps- Ecological Output Human Services Measure Benefit Resource Output-Benefit RelationsInfluenced or Precursor FormEcological Effect on Service
Input2
3
4
5
6,7
8
WS L R W E C9 10 11 12 13 14
Human Habitat (Access, Sanitary facilities (toilets, showers,facilities and other human drinking water, fish cleaning stations,density) (cont.) garbage receptacles) (cont.)
[number of units]
indirect effect via water See Table III-11. Many water quality factors are affected by the adequacy and function of sanitary facilities.quality
indirect effect via biological See Table III-12, especially nuisance and watchable wildlife. One animal's garbage is another animal's freequality lunch.
Campgrounds, picnic grounds, rest stops recreation visitor days WTP + + + + + +
[number of units] indirect effect via water and See Table III-8. Erosion usually increased in the construction process but may be reduced ultimately.material transport
indirect effect via substrate See Table III-9. Floodplain and watershed substrates altered.
indirect effect via habitat See this Table. Habitat connectivity, edge and fragmentation are affected.arrangement and landscapeprocess
indirect effect via biological See Table III-12. Plant community modification, nuisance and watchable wildlife interactions altered.quality
Tennis courts, bridle paths, golf courses, recreation use visitor days WTP +- + + + + +sports fields
property value $ income, +- +- +- +- +- +-appraisals
indirect effect via substrate See Table III-9. Modified amount of permeable surface.
indirect effect via habitat See Table III-10. Modifies habitat connection, fragmentation, and edge.arrangement and ecologicalprocess

68
TABLE III-10 (Continued)
ECOLOGICAL OUTCOMES AND SERVICES AFFECTED BY HABITAT ARRANGEMENT AND LANDSCAPE PROCESSINCLUDING USACE IMPACTS ON LANDSCAPE34
Corps- Ecological Output Human Services Measure Benefit Resource Output-Benefit RelationsInfluenced or Precursor FormEcological Effect on Service
Input2
3
4
5
6,7
8
WS L R W E C9 10 11 12 13 14
Human Habitat (Access, Recreation regulation recreation visitor days WTP +- +- +- +- +- +-facilities and other humandensity) (cont.) [visitor days] property value $ income, +- + + + + +
appraisals
indirect effect via substrate See Table III-9. People trample things, increase compaction and modify permeability.
indirect effect via water See Table III-11. Water quality is affected by intensity of water use by swimmers, boaters and others.quality
indirect effect via biological See Table III-12. Biological attributes are altered by direct affects on organism abundance and numerousquality indirect affects.
1. Morphologic topographic process is directly affected by Corps activities, usually by creating basins and channels through building barriers, dredging and filling.2. Ecological input variables effecting ecological outputs vary with project. Input variables are either directly or indirectly influenced by Corps management decisions. Project effectiveness is evaluated by examining the collective effects of all Corps
influenced inputs.3. Ecological outputs are physical, chemical and biological responses to natural or human-caused changes in the environment.4. Human services are the social functions performed by the ecological output.5. The more common measures of human services are provided for each category; project services may vary from the most common measures.6 The form of benefit provided by the human service. Only the most prominent forms of benefit are provided.7. Human demand for the service will be unique for each project and needs to uniquely evaluated. Considerations for estimating demand include:
a. Regional presence of high demand of the targeted resources in total or per unit area.b. Periodic shortages of resource availability or access, for example, when visitors are turned away from use areas on weekends or water rationing.c. Legal mandates for services including environmental laws and standards.d. Stakeholder willingness to contribute funding to project development.e. Potential for use in environmental education.f. Specific non-use value for a particular natural resource, which can be found at very few locations, including the project location.
8. Major water resource divisions are identified here. A plus, minus, or both indicates the usual relationship between ecological output and benefit)whether it is positive or negative as ecological output increases. Where no value is provided, theservice for that category is considered minor or non-existent, although specific project conditions may be exceptional.
9. The watershed category includes all projects contributing surface and subsurface (groundwater input) as well as downslope watershed influenced by the project.10. The lake category includes all inland waters occupying basins, either temporary or permanent, with a level surface; they may be natural or artificial, including those formed by dams and dikes, and by dredging. Morphology and water and material
transport characteristics physically determine more specific lake categories for each project.11. The river category includes all flows occupying channels and generated on a slope by gravity, temporary or permanent; they may be natural or artificial, including excavated and otherwise engineered water conveyances. 12. The wetland category includes all areas in which soils are temporarily to permanently flooded inland and coastal sites and often support, or could support, indicator plant growth. These are highly variable in form and include marshes, swamps, and
bogs in various forms. Wetland types are usually defined by their proximity to other water resources, such as estuarine marshes and riverine bottomlands.13. The estuary category includes all water bodies where marine and inland waters converge, are affected by tides, and often, but not necessarily, vary in salt content.14. Oceanic coastal areas occur where undiluted ocean water meets shore, thus lie beyond the obvious effect of inland water runoff.34. Habitat arrangement and landscape process is the relative location and dimensions of habitat types in a defined geographical space and the movements of materials and energy among habitats.35. Habitat patchiness is managed primarily through original placement of water management structures and their subsequent operation and the control of water depth above and below ground.

69
36. Habitat connections (corridors) are managed through project location and control of depths, slopes and sedimentation process through dredging, dredge material deposition, and water control structures.37. Habitat diversity is managed mostly through project location; and control of depth, slope and distributions of sediment, and introduction and planting and removal of appropriate species.38. Human habitat is managed by developing structures that facilitate or discourage human use including roads, trails, ramps, docks, sanitary facilities, campgrounds and fenced off or otherwise closed areas.

70
TABLE III-11
ECOLOGICAL OUTCOME AND SERVICE AFFECTED BY WATER AND SEDIMENT QUALITY INCLUDING USACE IMPACTS ON QUALITY FACTORS39
Corps-Influenced Ecological Output Human Services Benefit Resource Output-Benefit RelationEcological Input Form2
34 Measure5
6,7
8
WS L R W E C9 10 11 12 13 14
Suspended Particulate Matter Total suspended solids40
[mg/l, sighting, touch]
indirect effect via biological See Table III-12 for more detail. It acts diversely to influence food suitability, other habitat suitabilityprocess and human use. Also, when settled in high quantity, suffocates eggs and sensitive benthic organisms.
turbidity turbidity units standard-- + + + + +index forsuspend-edsolids
indirect effect via light See this Table, light transmission. Suspended solids reflect light and decrease penetration.transmission
general drinking and food mg/liter standards, - - -processing contaminant-- treatmentgrittiness, possibly toxic costs
abrasion causes machinery and mg/liter standards, - - - - -transport system damage treatment
costs
recreational boating visitor days WTP - - - - -
swimming visitor days WTP - - - - -
aesthetics visitor days, & WTP, - - - - -property income,
appraisal
Organic suspended solids indirect effect via biological See Table III-12 for detail. Organic matter in suspension is used by numerous suspension feedingprocess organisms such as most zooplankton and many benthic invertebrates. Also acts as a substrate for
microorganisms, some of which are important food resources for many organisms, while others are diseaseorganisms.
domestic water contaminant mg/liter standards, - - -treatmentcosts
taste standards, - - -treatmentcosts

71
TABLE III-11 (Continued)
ECOLOGICAL OUTCOME AND SERVICE AFFECTED BY WATER AND SEDIMENT QUALITY INCLUDING USACE IMPACTSON QUALITY FACTORS39
Corps-Influenced Ecological Output Human Services Measure Benefit Resource Output-Benefit RelationEcological Input or Precursor Form2
3
Effect on Service4
5
6, 7
8
WS L R W E C9 10 11 12 13 14
Suspended Particulate Matter Organic suspended solids (cont.) domestic water contaminant odor standards, - - -(cont.) (cont) treatment costs
indirect effect via Biological See Oxygen in this Table. Consumption and decay exerts an oxygen demand that contributes to oxygenOxygen Demand (BOD) depletion.
Suspended color
[color units]
indirect effect via light See light transmission in this Table. Color in suspended matter absorbs light and decreases transmissiontransmission depth.
domestic water use color standard, - - - -treatment costs
indirect effect via suspended See total suspended solids in this Table.solids
aesthetics appearance, WTP - - - -visitor days
Suspended inorganic nutrients
[mg/l]
indirect effect via biological See Table III-12, primary producers, for details. Influences the availability of nutrients for photosynthesisprocess and may be available for uptake in this form. Especially important nutrients are phosphorus, nitrogen and
iron.
indirect effect via dissolved See dissolved nutrients this Table. A reservoir for potentially dissolved nutrients.nutrient source.
Suspended toxic material indirect effect via biological See Table III-12 for details. Consumed toxic compounds have important biological consequences.process
domestic and livestock water mg/liter of toxic treatment costs, - - - -use material standards
Ratio of inorganic and organicsuspended solids
[ratio]
indirect effect via biological See Table III-12 for detail. Dilution of food quality for suspension feeding organisms, such as mostprocess zooplankton and many bottom organisms like clams and oysters.

72
TABLE III-11 (Continued)
ECOLOGICAL OUTCOME AND SERVICE AFFECTED BY WATER AND SEDIMENT QUALITY INCLUDING USACE IMPACTSON QUALITY FACTORS39
Corps-Influenced Ecological Output Human Services Measure Benefit Resource Output-Benefit RelationEcological Input or Precursor Form2
3
Effect on Service4
5
6, 7
8
WS L R W E C9 10 11 12 13 14
Suspended Particulate Matter Suspended inorganic complexes(cont.)
[mg/l]
indirect effect via biological See Table III-12, and nutrients and toxins in this Table for detail. Affects the availability of nutrients andprocess toxins for uptake in soluble form. Complexes of precipitates and absorbed dissolved nutrients, toxic metals,
and other materials occur in suspension and in sediment with variable availability for uptake by livingorganisms, often depending on the reduction-oxidation environment. May be important in sequesteringmaterials that would otherwise go into solution.
indirect effect via dissolved See dissolved nutrients this Table for more detail.nutrient
indirect effect via dissolved See dissolved toxins in this Table for more detail.toxin
Suspended organic complexes indirect effect via biological See Table III-12, and nutrients and toxins in this Table for detail. Organic complexes, often with inorganicprocess elements, affect nutrient and toxin availability.
indirect effect via nutrient See dissolved nutrients in this Table for more detail.availability
indirect effect via toxin See dissolved toxins in this Table for more detailavailability
Dissolved Matter Dissolved organic matter41
indirect effect via biological See Table III-12 for more details. Dissolved organics form aggregates with bacteria that may be consumedprocess by suspension feeders. Some protists appear to absorb them directly. Certain dissolved organics are
required nutrients for certain algae.
indirect effect via Biological See this Table for oxygen. Dissolved organics decay and exert oxygen demand.Oxygen Demand (BOD)
Water color
[color units]
indirect effect via light See light transmission in this Table. Dissolved organic pigments absorb light, often staining the water tea ortransmission coffee color in bogs and black-water streams.
aesthetics--reaction to water visitor days, $ WTP, income - - - -color is often negative property
domestic water supply color units standard, - - -treatment cost,health cost

73
TABLE III-11 (Continued)
ECOLOGICAL OUTCOME AND SERVICE AFFECTED BY WATER AND SEDIMENT QUALITY INCLUDING USACE IMPACTSON QUALITY FACTORS39
Corps-Influenced Ecological Output Human Services Measure Benefit Resource Output-Benefit RelationEcological Input or Precursor Form2
3
Effect on Service4
5
6, 7
8
WS L R W E C9 10 11 12 13 14
Dissolved Matter (cont.) Total dissolved solids (TDS) equipment maintenance mg/liter standards, - - - - -
[mg/liter] maintenance(corrosion) treatment &
cost
domestic supply mg/liter standard, - - -treatment &health cost
agricultural crop supply mg/liter standard, - - -treatment cost,lost income
Salinity
[ppt]
indirect effect via biological See Table III-12 for detail. It determines habitat suitability based on species osmoregulatory requirementsprocess including humans, pets and livestock use.
equipment corrosion costs-- ppt standard +- +- +-metal corrosion rates and treatment &reduced decay rates of wood maintenance
cost
agricultural water-decreases ppt standard, - - -crop growth or lethal income lost
domestic and livestock water ppt standard, - - -treatment cost
swimming and related ppt WTP - - - +- +-recreation shower costs,
Hydrogen ions (acidity)
[pH]
indirect effect via biological See Table III-12 for more detail. Acidity is a major variable determining habitat suitability, especially inprocess freshwater habitats.
equipment maintenance equipment costs - - -(corrosion) maintenance

74
TABLE III-11 (Continued)
ECOLOGICAL OUTCOME AND SERVICE AFFECTED BY WATER AND SEDIMENT QUALITY INCLUDING USACE IMPACTSON QUALITY FACTORS39
Corps-Influenced Ecological Output Human Services Measure Benefit Resource Output-Benefit RelationEcological Input or Precursor Form2
3
Effect on Service4
5
6, 7
8
WS L R W E C9 10 11 12 13 14
Dissolved Matter (cont.) Hydrogen ions (acidity) (cont.)
[pH]
indirect effect via reduction- See in this Table. This is an important variable determining the reduction-oxidation environmentoxidation
Oxygen
[mg/l]
indirect effect via biological See Table III-12 for more detail. All consumer organisms and many decomposers require oxygen forprocess metabolism. It is an important metabolic rate regulator at low concentrations and a major determinant of
habitat suitability where it varies from saturation. to oxygen deficits.
reduction-oxidation See reduction-oxidation, this Table. It is an important determinant of the oxidation-reduction environment.
equipment maintenance replacement and maintenance - - - - -(corrosion and cavitation cleaning rates costeffects)
ecosystem integrity index mg/liter saves + + + + + +investigationcosts
Nitrogen gas
[mg/l]
indirect effect via biological See Table III-12 for more detail. As fish and other organisms move to surface from a supersaturatedprocess environment the bubbles expand. Nitrogen gas can become a nutrient source for certain noxious bluegreen
bacteria.
industrial cavitation effects replacement and maintenance - - - - -cleaning rates cost
Dissolved inorganic nutrients indirect effect via biological As nutrient availability increases total production increases but often causes undesirable side effects becauseprocess of excessive organic loading by primary producers (eutrophication); excessive to the extent that oxygen
demand from plant decay is offset by oxygenation of habitats from the atmosphere and downward mixing.
agriculture benefits from high crop production income, food + + +nutrient concentration prices

75
TABLE III-11 (Continued)
ECOLOGICAL OUTCOME AND SERVICE AFFECTED BY WATER AND SEDIMENT QUALITY INCLUDING USACE IMPACTS ONQUALITY FACTORS39
Corps-Influenced Ecological Output Human Services or Measure Benefit Resource Output-Benefit RelationEcological Input Precursor Effect on Form2
3
Service4
5
6, 7
8
WS L R W E C9 10 11 12 13 14
Dissolved Matter (cont.) Ionic ratios biological process See Table III-12 for details. Ionic ratios are important determinants of plant habitat suitability and alsoaffect consumers. Contributes to determining noxious algae. Important reason why many marine speciescannot survive in certain inland environments of similar salinity.
livestock water suitability in livestock income, food - - -part determined by proportion production pricesof sulfates in salts
Biogeochemical elements precipitates of iron, calcium cleaning effect, standards, cost - - - - -and other compounds for maintenanceindustrial and domestic uses
indirect effect via nutrient See this Table, nutrients. Helps determine nutrient availability.
indirect effect via toxic See this Table, toxins. Helps determine toxin availability.material
Hardness domestic and industrial water- cleaning effect, standard, - - - - -decreases surfactant action and maintenance cost creates scale
binds and precipitates toxic reduced cost savings + + + + +materials treatment need
Dissolved toxic materials indirect effect via biological See Table III-12 for detail. Differential toxicity causes many changes in ecological pathways.process
domestic and livestock water mg/l standards, - - - - - -treatment cost,lost income
possible ecosystems integrity index investigation - - - - - -measures, e.g., mercury cost savings
Electromagnetic Process Light transmission42
[watts, lumens]
indirect effect via biological See Table III-12 for detail. Light transmission is a basic determinant of primary production process andprocess food web interactions, as well as a measure of water quality.
indirect effect via temperature See temperature, this Table. Light is primary source of heat and temperature distribution, although mixingdepth, residence time and turbulence are more important.

76
TABLE III-11 (Continued)
ECOLOGICAL OUTCOME AND SERVICE AFFECTED BY WATER AND SEDIMENT QUALITY INCLUDING USACE IMPACTSON QUALITY FACTORS39
Corps-Influenced Ecological Output Human Services Measure Benefit Resource Output-Benefit RelationEcological Input or Precursor Form2
3
Effect on Service4
5
6, 7
8
WS L R W E C9 10 11 12 13 14
Electromagnetic Process (cont.) Light transmission (cont.) aesthetics visitor days, WTP, income + + + + +
[watts, lumens]property $
Temperature
[C , F ]0 0
indirect effect via biological See Table III-12 for detail. Temperature is a basic determinant of metabolic rates, production rates andprocess foodweb pathways.
thermal load capacity for BTU, ice income, - - - - -wasting heat accumulation electric cost
industrial cooling capacity BTU income, - - - - -electric cost
swimming See Table III-7 for detailed activities. Effects visitor days; nearby property values.
boating/navigation See Table III-7 for detailed activities. Ice impedes boat use.
indirect effect via water and See Table III-8 for detailed activities. Temperature is a variable determining density and viscosity, which, inmaterial transport turn, influence material transport capacity.
Reduction-oxidation
[redox potential, volts]
indirect effect via nutrients See this Table nutrients.Reduction-oxidation determines the solubility of many nutrient and toxic elements,and affects the absorption of dissolved matter to suspended or sedimented matter.
indirect effect via toxins See this Table, toxic materials. Reduction-oxidation determines solubility and ability of organic substratesto sequester toxins.
indirect effect via See this Table, biogeochemistry. Reduction-oxidation determines solubility and forms of many compoundsbiogeochemistry important in nutrient cycles and spirals, such as nitrogen, phosphorus, iron and sulfur.
1. Morphologic topographic process is directly affected by Corps activities, usually by creating basins and channels through building barriers, dredging and filling.2. Ecological input variables effecting ecological outputs vary with project. Input variables are either directly or indirectly influenced by Corps management decisions. Project effectiveness is evaluated by examining the collective effects of all Corps
influenced inputs.3. Ecological outputs are physical, chemical and biological responses to natural or human-caused changes in the environment.4. Human services are the social functions performed by the ecological output.5. The more common measures of human services are provided for each category; project services may vary from the most common measures.6. The form of benefit provided by the human service. Only the most prominent forms of benefit are provided.

77
7. Human demand for the service will be unique for each project and needs to uniquely evaluated. Considerations for estimating demand include:a. Regional presence of high demand of the targeted resources in total or per unit area.b. Periodic shortages of resource availability or access, for example, when visitors are turned away from use areas on weekends or water rationing.c. Legal mandates for services including environmental laws and standards.d. Stakeholder willingness to contribute funding to project development.e. Potential for use in environmental education.f. Specific non-use value for a particular natural resource, which can be found at very few locations, including the project location.
8. Major water resource divisions are identified here. A plus, minus, or both indicates the usual relationship between ecological output and benefit)whether it is positive or negative as ecological output increases. Where no value is provided, theservice for that category is considered minor or non-existent, although specific project conditions may be exceptional.
9. The watershed category includes all projects contributing surface and subsurface (groundwater input) as well as downslope watershed influenced by the project.10. The lake category includes all inland waters occupying basins, either temporary or permanent, with a level surface; they may be natural or artificial, including those formed by dams and dikes, and by dredging. Morphology and water and material
transport characteristics physically determine more specific lake categories for each project.11. The river category includes all flows occupying channels and generated on a slope by gravity, temporary or permanent; they may be natural or artificial, including excavated and otherwise engineered water conveyances. 12. The wetland category includes all areas in which soils are temporarily to permanently flooded inland and coastal sites and often support, or could support, indicator plant growth. These are highly variable in form and include marshes, swamps, and
bogs in various forms. Wetland types are usually defined by their proximity to other water resources, such as estuarine marshes and riverine bottomlands.13. The estuary category includes all water bodies where marine and inland waters converge, are affected by tides, and often, but not necessarily, vary in salt content.14. Oceanic coastal areas occur where undiluted ocean water meets shore, thus lie beyond the obvious effect of inland water runoff.39. Water quality includes suspended and dissolved matter in the water column and in sediment interstices, typically in small enough form to be easily sampled in 1 to 10 liter water samplers. It also includes electromagnetic properties associated with
light, heat, and reduction-oxidation voltages.40. Suspended particulate matter is managed mostly indirectly through watershed and water-control management, but also through dredging operations.41. Dissolved matter is managed mostly indirectly by watershed management, dredging activity, and water-structure control of amounts of water from different sources and evaporation surfaces, but also through fertilization, liming, aeration and other
direct chemical or physical means.42. Electromagnetic processes; light, heat and redox potential; are managed mostly indirectly via morphologic and material transport process, dredging activity, riparian vegetation management and water mixing process.

78
TABLE III-12
ECOLOGICAL OUTPUTS AND SERVICES AFFECTED BY BIOLOGICAL QUALITIES, INCLUDING USACE IMPACT ON BIOLOGICAL QUALITIES43
Corps-Influenced Ecological Output Human Services or Measures Benefit Resource Output-Benefit RelationEcological Input Precursor Effect on Form2
3
Service4
5
6,7
8
WS L R W E C9 10 11 12 13 14
Population Production Process Terrestrial macrophytes building material, paper $ income + + +44
[Board ft, cords, animal units, bales, diversityand arrangement of form, landscape formulae,area covered, Kg/ha]
grazing forage, hay $ income + + +
aesthetic visitor days, $ W-T-P, income, + + +appraisals
indirect effect via habitat See Table III-10 for more detail. Terrestrial habitat arrangement with aquatic habitats.arrangement and landscape Important influences on population abundances and distributions.process
indirect effect via morphologic See Table III-7. Forest and range modify the waterbed, flood plain and channel form.process
indirect effect via water quality See Table III-11. The biomass and growth of waterbed vegetation team and exports nutrients, toxic containments and othermaterial.
Decomposer populations indirect effect via water quality See Table III-11 for more detail, especially about nutrients and oxygen. Decomposers play an indispensable role in
[#/ml]recycling, and also exert biological oxygen demand.
commercial harvest $ income +- +- +- +- +-
recreational harvest and other visitor days W-T-P + + + + +use
ecological indicators index index cost savings + + + + +
Pathogen populations health presence/ absence standards, - - - - - -
[#/ml]treatment costs
commercial harvest $ income - - - - -
recreational harvest and other visitor days W-T-P - - - - -use
ecological indicators index index cost savings + + + + +
Aquatic macrophytes Fishing visitor days WTP +- +- +- +- +-[kg/ha, kg/ha/yr, relative #, area covered,landscape formulae] commercial harvest $ income +- +- +- +- +-
recreational harvest and other visitor days W-T-P +- +- +- +- +-use

79
TABLE III-12 (Continued)
ECOLOGICAL OUTPUTS AND SERVICES AFFECTED BY BIOLOGICAL QUALITIES, INCLUDING USACE IMPACT ON BIOLOGICAL QUALITIES43
Corps-Influenced Ecological Output Human Services Measures Benefit Resource Output-Benefit RelationEcological Input or Precursor Form2
3
Effect onService4
5
6,7
8
WS L R W E C9 10 11 12
13 14
Population Production Process Aquatic macrophytes (cont.) ecological indicators index index cost savings + + + + +(cont.)
[kg/ha, kg/ha/yr, relative #, area covered,landscape formulae]
endangered species ESA (law non-use values + + + + +and income lost
nuisance species visitor days, $ income lost, W- - - - - -T-P
swimming, boating, etc. visitor days, $ income lost, - - - - -W-T-P
indirect effect via See Table III-7. As plants grow they alter basin morphology, such as the amount of open water in habitat.morphologic process
indirect effect via substrate See Table III-9. Aquatic plants act as substrate for many organisms and alter other substrate as they grow.
indirect effect via habitat See Table III-10. Colonization by aquatic macrophytes greatly alter the arrangement of habitats and indirectlyarrangement and landscape affects many species.process
indirect effect via water See Table III-11. Vegetation growth both team and mobilize nutrient, contaminants and other nature.quality
Planktonic algae Fishing visitor days WTP +- +- +- +- +-[kg/ha, kg/ha/yr, relative #]
commercial harvest $ income +- +- +- +- +-
recreational harvest and other visitor days W-T-P +- +- +- +- +-use
ecological indicators index index cost savings + + + + +
nuisance species visitor days income lost, W- - - - - -T-P
swimming, boating, etc. visitor days income lost, - - +- - -W-T-p
algal suspended solids numbers standards, - - - - - -treatment cost
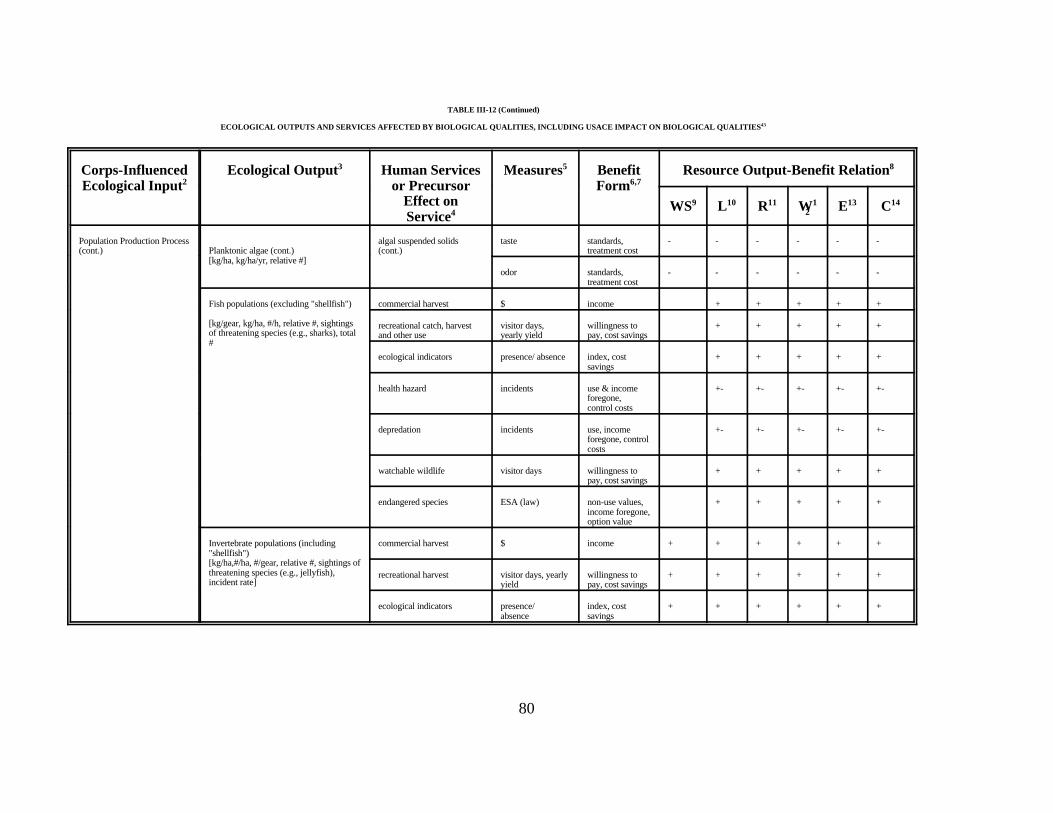
80
TABLE III-12 (Continued)
ECOLOGICAL OUTPUTS AND SERVICES AFFECTED BY BIOLOGICAL QUALITIES, INCLUDING USACE IMPACT ON BIOLOGICAL QUALITIES43
Corps-Influenced Ecological Output Human Services Measures Benefit Resource Output-Benefit RelationEcological Input or Precursor Form2
3
Effect onService4
5
6,7
8
WS L R W E C9 10 11 12
13 14
Population Production Process algal suspended solids taste standards, - - - - - -(cont.) Planktonic algae (cont.) (cont.) treatment cost
[kg/ha, kg/ha/yr, relative #]odor standards, - - - - - -
treatment cost
Fish populations (excluding "shellfish") commercial harvest $ income + + + + +
[kg/gear, kg/ha, #/h, relative #, sightingsof threatening species (e.g., sharks), total#
recreational catch, harvest visitor days, willingness to + + + + +and other use yearly yield pay, cost savings
ecological indicators presence/ absence index, cost + + + + +savings
health hazard incidents use & income +- +- +- +- +-foregone, control costs
depredation incidents use, income +- +- +- +- +-foregone, controlcosts
watchable wildlife visitor days willingness to + + + + +pay, cost savings
endangered species ESA (law) non-use values, + + + + +income foregone,option value
Invertebrate populations (including commercial harvest $ income + + + + + +"shellfish")[kg/ha,#/ha, #/gear, relative #, sightings ofthreatening species (e.g., jellyfish),incident rate]
recreational harvest visitor days, yearly willingness to + + + + + +yield pay, cost savings
ecological indicators presence/ index, cost + + + + + +absence savings

81
TABLE III-12 (Continued)
ECOLOGICAL OUTPUTS AND SERVICES AFFECTED BY BIOLOGICAL QUALITIES, INCLUDING USACE IMPACT ON BIOLOGICAL QUALITIES43
Corps-Influenced Ecological Output Human Services Measures Benefit Resource Output-Benefit RelationEcological Input or Precursor Form2
3
Effect onService4
5
6,7
8
WS L R W E C9 10 11 12
13 14
Population Production Process Invertebrate populations (including health hazards incidents use, income +- +- +- +- +- +-(cont.) "shellfish") (cont.) foregone
[kg/ha,#/ha, #/gear, relative #, sightings ofthreatening species (e.g., jellyfish),incident rate]
property damage incidents replacement, +- +- +- +- +- +-maintenance,insurance costs
nuisance discomfort level use, income +- +- +- +- +- +-foregone
endangered species ESA (law), use, income + + + + + +presence-absence foregone, option
value
watchable wildlife visitor days willingness to + + + + + +pay
Reptile & amphibian populations commercial harvest $ income + + + + + +
[#/ha, relative #] recreational harvest visitor days willingness to + + + + +pay, cost savings +
depredation incidents replacement & +- +- +- +- +- +-protection cost
nuisance/health incidents use, income & +- +- +- +- +- +-property valueforegone
endangered species (ESA) law, non-use values , + + + + + +presence-absence income &
property valueforegone
ecological indicator presence/ index, cost + + + + + +absence savings
watchable species visitor days willingness to + + + + + +pay

82
TABLE III-12 (Continued)
ECOLOGICAL OUTPUTS AND SERVICES AFFECTED BY BIOLOGICAL QUALITIES, INCLUDING USACE IMPACT ON BIOLOGICAL QUALITIES43
Corps-Influenced Ecological Output Human Services or Measures Benefit Resource Output-Benefit RelationEcological Input Precursor Effect on Form2
3
Service4
5
6,7
8
WS L R W E C9 10 11 12 13 14
Population Production Process Bird populations waterfowl hunting visitor days willingness to + + + + + +(cont.) pay
[relative #, #/ha, use-days]upland bird hunting visitor days willingness to + + + + + +
pay
watchable water birds visitor days willingness to + + + + + +pay
watchable riparian & upland visitor days willingness to + + + + + +birds pay
endangered species ESA (law) non-use values , + + + + + +presence/ income &absence property value
foregone
ecological indicators presence/absence index, cost + + + + + +savings
nuisance/health incident rates use, income +- +- +- +- +- +-foregone, controlcosts
depredation incident rates use, income +- +- +- +- +- +-foregone, controlcosts
Mammal populations recreational harvest visitor days willingness to + + + + + +
[#/ha, relative #]pay
furs $ income + + + + + +
watchable species visitor days willingness to + + + + + +pay
endangered species ESA (law), non-use values + + + + + +presence-absence foregone use,
income, optionvalues
depredation incident rate foregone use, +- +- +- +- +- +-income, propertyvalue

83
TABLE III-12 (Continued)
ECOLOGICAL OUTPUTS AND SERVICES AFFECTED BY BIOLOGICAL QUALITIES, INCLUDING USACE IMPACT ON BIOLOGICAL QUALITIES43
Corps-Influenced Ecological Output Human Services Measures Benefit Resource Output-Benefit RelationEcological Input or Precursor Form2
3
Effect onService4
5
6,7
8
WS L R W E C9 10 11 12
13 14
Population Production Process Mammal populations (cont.) health/nuisance incident rate foregone use, +- +- +- +- +- +-(cont.) income, property
[#/ha, relative #] value
Community Process Biodiversity species richness index option values, + + + + + +45
[species #, species/ha, formulae, research, saveswt/species formulas, # of strata, investigation costcover/stratum, DNA]
education,
species abundance evenness index option values, + + + + + +education,research, savesinvestigation cost
biological stratification index option values, + + + + + +education,research, savesinvestigation cost
genetic information index option values, + + + + + +education,research, savesinvestigation cost
Biological Integrity material retention index option values, + + + + + +
[formulae, kg, tonnes, relative #, grams research, savescarbon, Kcal, range of concentrations or investigation costloads, range of kg/m /year, kg/m /yr, flux,2 2
efficiency, interaction counts]
education,
ecosystem indicator species index option values, + + + + + +education,research, savesinvestigation cost

84
TABLE III-12 (Continued)
ECOLOGICAL OUTPUTS AND SERVICES AFFECTED BY BIOLOGICAL QUALITIES, INCLUDING USACE IMPACT ON BIOLOGICAL QUALITIES43
Corps-Influenced Ecological Output Human Services Measures Benefit Resource Output-Benefit RelationEcological Input or Precursor Form2
3
Effect onService4
5
6,7
8
WS L R W E C9 10 11 12
13 14
Community Process (cont.) Biological Integrity (cont.) production/respiration (P/R) index option values, +- +- +- +- +- +
[formulae, kg, tonnes, relative #, grams research, savescarbon, Kcal, range of concentrations or investigation costloads, range of kg/m /year, kg/m /yr, flux,2 2
efficiency, interaction counts]
education,
material export stability index option values, +- +- +- +- +- +-education,research, savesinvestigation cost
production stability index option values, +- +- +- +- +- +-education,research, savesinvestigation cost
production level index option values, +- +- +- +- +- +-education,research, savesinvestigation cost
biogeochemical cycling rate index option values, +- +- +- +- +- +-education,research, savesinvestigation cost
efficiency of solar energy index option values, +- +- +- +- +- +-capture education,
research, savesinvestigation cost

85
TABLE III-12 (Continued)
ECOLOGICAL OUTPUTS AND SERVICES AFFECTED BY BIOLOGICAL QUALITIES, INCLUDING USACE IMPACT ON BIOLOGICAL QUALITIES43
Corps-Influenced Ecological Output Human Services or Measures Benefit Resource Output-Benefit RelationEcological Input Precursor Effect on Form2
3
Service4
5
6,7
8
WS L R W E C9 10 11 12 13 14
Community Process (cont.) education,Biological Integrity (cont.) trophic level efficiency index option values, +- +- +- +- +- +-
[formulae, kg, tonnes, relative #, grams research, savescarbon, Kcal, range of concentrations or investigation costloads, range of kg/m /year, kg/m /yr, flux,2 2
efficiency, interaction counts] foodweb complexity/support index option values, +- +- +- +- +- +-education,research, savesinvestigation cost
Indirect effects on water See Table III-11. Oxygen, pH, nutrients, toxins, and other water quality measures are indicators ofquality biological integrity.
Community metabolism
[mg/liter, pH]
indirect effect via substrate See Table III-9. Many aspects of substrate structure are affected by organism behavior, death, and decay.
indirect effect via water See Table III-11, suspended and dissolved organic matter. The relative amounts depend on effectiveness ofquality community respiration.
See Table III-11, suspended and dissolved nutrients. Community respiration substantially determinesnutrient distribution.
See Table III-11, oxygen. Community respiration generates and consumes oxygen.
See Table III-11, hydrogen ions. Respiration alters the carbonic acid content via its affect on carbon dioxideand pH.
1. Morphologic topographic process is directly affected by Corps activities, usually by creating basins and channels through building barriers, dredging and filling.2. Ecological input variables effecting ecological outputs vary with project. Input variables are either directly or indirectly influenced by Corps management decisions. Project effectiveness is evaluated by examining the collective effects of all Corps
influenced inputs.3. Ecological outputs are physical, chemical and biological responses to natural or human-caused changes in the environment.4. Human services are the social functions performed by the ecological output.5. The more common measures of human services are provided for each category; project services may vary from the most common measures.6. The form of benefit provided by the human service. Only the most prominent forms of benefit are provided.7. Human demand for the service will be unique for each project and needs to uniquely evaluated. Considerations for estimating demand include:
a. Regional presence of high demand of the targeted resources in total or per unit area.b. Periodic shortages of resource availability or access, for example, when visitors are turned away from use areas on weekends or water rationing.c. Legal mandates for services including environmental laws and standards.d. Stakeholder willingness to contribute funding to project development.e. Potential for use in environmental education.f. Specific non-use value for a particular natural resource, which can be found at very few locations, including the project location.
8. Major water resource divisions are identified here. A plus, minus, or both indicates the usual relationship between ecological output and benefit)whether it is positive or negative as ecological output increases.9. The watershed category includes all projects contributing surface and subsurface (groundwater input) as well as downslope watershed influenced by the project.10. The lake category includes all inland waters occupying basins, either temporary or permanent, with a level surface; they may be natural or artificial, including those formed by dams and dikes, and by dredging. Morphology and water and material
transport characteristics physically determine more specific lake categories for each project.11. The river category includes all flows occupying channels and generated on a slope by gravity, temporary or permanent; they may be natural or artificial, including excavated and otherwise engineered water conveyances.

86
12. The wetland category includes all areas in which soils are temporarily to permanently flooded inland and coastal sites and often support, or could support, indicator plant growth. These are highly variable in form and include marshes, swamps, andbogs in various forms. Wetland types are usually defined by their proximity to other water resources, such as estuarine marshes and riverine bottomlands.
13. The estuary category includes all water bodies where marine and inland waters converge, are affected by tides, and often, but not necessarily, vary in salt content.14. Oceanic coastal areas occur where undiluted ocean water meets shore, thus lie beyond the obvious effect of inland water runoff.43. Biological qualities include all manifestations of biological process.44. Population production process is managed mostly indirectly through management of physical habitat and less often through introduction (including planting), removal (including forest and range use), and stocking of living organisms.45. Community production process is managed mostly through alteration of the physical ecosystem and less often through introduction and removal of organisms.

87
Many project solutions require changing water surface area, volume, and depth. These changes act asecosystem inputs, which induce sequences of ecological outputs, one output acting as an input forgenerating the next output. Increased water surface area, for example, directly increases the use area forboating and swimming while indirectly decreasing the use area for various land uses. But the larger impactmay be the indirect effect on wildlife-based recreation via changes in the total area of productive habitatprovided as surface area changes. Thus morphological change, in Table III-7, affects biological quality, inTable III-12, and the table reader is directed to Table III-12 to find the direct effects of biologicalprocesses on recreational use. The link between morphology and biological quality is illustrated in FigureIII-1.
The chain of important effects continues, however, because of ecological successional processes,creating a feedback from biological quality to morphology and topography (Figure III-1). When thedepths of a newly constructed wetland area are first shaped according to project design specifications,different types of plants are expected to take root depending on the depth. The shape of the basin in timeis expected to support an ecosystem with patches of herbaceous marsh, open water, and woody swamp asplants colonize (or are planted) and grow. The growth modifies ecosystem morphology, which, in turn,changes site suitability for a succession of new species and life stages.
As shown in Figure III-1, many feedbacks occur in real ecosystems and in the suite of tables. Theextent feedback occurs depends on project dimensions in space and time and the rate of change inducedper unit area. Many projects designed to restore environmental qualities that provide desired humanservices can take decades, even centuries, to have their ultimate effect.
It is possible in using Tables III-7 through III-12 to go on in an endless cycle of feedback loops. Inreal ecosystems, and in ecosystem process models, material and energy pathways eventually decay to apoint of no service-significant effect. An important weakness of this tabular approach is the lack ofquantification that signals significance level. Planners using the tables must use their judgment and theinputs of disciplinary specialists to decide when they have looped through enough indirect effects.
Tables III-1 through III-12 are intended to be a general planning guide toward more specificidentification of intended and unintended project outcomes. The main intent of Tables III-1 through III-12is to help planners pose the right questions for interdisciplinary examination in site-specific study. Inputand output links identified in Tables III-1 through III-12 as possible project issues will rarely be sufficientwithout further organized study at the project level. As shown in Figure III-1, once detailed studies arecompleted, recommendations are made to decision makers.
ORGANIZATION AND SUMMARY OF TABLES
Tables III-7 through III-12 are the central feature of this report, where the linkage between ecologicaland socioeconomic impacts is actually formed. The logic and philosophy of the tables are discussedthroughout this report and appendix. The following sections describe first the constituency of the tables,their structure, and general contextual information concerning the entries in the individual tables. This isfollowed by a discussion of the important role of feedback and indirect effects that overlay the series oftables. Critical terms are defined in the Glossary, and footnotes are found at the end of each table thatexpand on terms and ideas presented.

88
Table Structure and Sequence
Information in the set of six tables (Tables III-7 through III-12) is arranged from left to right with thefirst column on the left identifying the ecological input category. This ecological input is altered by naturalor managed events to generate ecological outputs and associated measurements listed in the secondcolumn. The third column lists the types of human services or ecological precursors (which leads toanother table) affected by ecological outputs. The fourth and fifth columns list the benefit measure andform, respectively, for each entry. Services and benefits may be positive or negative as ecological outputsincrease. Many ecological outputs generate a mix of positive and negative impacts, and there are manyexceptions to the general case shown in the final six columns of the tables. These last six columns arereserved for the type of relationship between ecological output and service, positive or negative, for eachof the major water resource categories (WaterShed, Lake, River, Wetland, Estuary, Coastal).
Morphology, Table III-7
The hierarchial nature of the impacts of Corps projects on the ecosystem (e.g., direct morphologicalchanges and resultant indirect effects) as illustrated in Figure III-1 are reflected in the sequencing of TablesIII-7 through III-12. The table for morphological and topographic process begins the sequence of tablesbecause Corps activities modify foremost the morphology of watersheds, basins, and channels, causing achain of subsequent ecological outputs. The Corps shapes topographic features by excavating (mostlydredging) and by building structures designed to contain, redirect, and exclude water flow. Such structuresinclude dams, dikes, wing dams, levees, revetments, breakwaters, groins, canals, pipes, penstocks,diversion dams, locks, etc. Structures usually are designed to exclude, divert, or contain water or sedimentto meet project objectives. In the process, Corps projects develop depths, slopes, volumes, surface areas,and shoreline lengths and configurations, which collectively impart a water resource with much of itsecological character. By way of its affect on watershed, basin, and channel morphology, the Corpsindirectly influences ecological outputs and related services in the remaining five table categories.
Water and Material Transport, Table III-8
Water and material transport, slope and depth work interactively to generate erosive discharges andmaterial transport capacity, once water is supplied by precipitation and runoff. Erosion, transport, anddeposition reshape channel and basin morphology and influence substrate, habitat arrangement, and waterquality. Morphology and water and material transport interact to influence biological quality. Biologicalpopulations respond diversely to depth, current, erosion, sediment suspension, and sediment deposition.
Substrate,Table III-9, and Habitat Arrangement, Table III-10
Substrate form and stability are defined by the types and productivities of colonizing plants, animals,and decomposer organisms that are present. Habitat arrangement, including habitat diversity, isfundamentally determined by spatial variation in water depth, current, and substrate condition. To the

89
extent that depths and current patterns can be engineered, the Corps has potential control over habitatpatterns both locally and regionally.
Water Quality, Table III-11, and Biological Quality, Table III-12
Managed habitat patterns also indirectly influence water quality, which diversely impacts biologicalcolonization of habitats. A Corps project that targets water quality and biological habitats might call forvery specific engineering action such as mechanical aeration of a project site, site fertilization, or treeplanting in riparian zones. These types of management activities have very specific impacts on selectedaspects of an ecosystem, usually more so than the general activities included in the earlier tables in theseries.
Indirect Effects and Feedback
Although the Corps may directly affect ecological outputs in any of the six categories, many of theeffects are indirect. Whenever indirect effects occur, the table reader is guided to another table where theeffects are direct. Most Corps actions, for example, directly influence physical environment and indirectlyinfluence the water quality and biological properties of ecosystems. Because Corps activities usually impactfundamental habitat qualities, they usually have widespread impacts on water and biological quality. Bothsynergistic and antagonistic interactions can result, creating unexpected outcomes. Many biologicalimpacts of Corps activities do not fully manifest for years, or even decades, following management actions. Yet these ultimate impacts may have the greatest ultimate effect on services provided by ecologicalfunctions.
Feedback occurs commonly throughout this system of table categories. In fact, feedback is such acommon feature of ecosystem function that the number of feedbacks is a useful indicator of ecosystemcomplexity. An example of how feedback could occur is as follows. Photosynthesis and decompositionare elemental functions affecting dissolved oxygen, pH, reduction-oxidation, and the availability ofnutrients and toxic materials feeding back to affect subsequent biological processes. For example, organicproduction is a major determinant of light transmission through air and water. In water, both biomass anddissolved organic byproducts produce color, which absorbs light and decreases light transmission and, inturn, feeds back to affect future organic production.
One of the disadvantages of a qualitative approach to system process, as used in Tables III-7 to III-12, is the difficulty in deciding how far to follow feedback effects. As in the real world, it is possible forreaders to find themselves in a never-ending cycle of feedbacks. The readers must use their own judgmentand expert input to decide how far they should take feedback pathways through the tables.

90
APPLICATION ISSUES FOR PLANNING
Basic Steps
The first requirement of a planner using the tables and other information in this report is to organize alist of ways in which management-action alternatives are likely to impact the ecological outputs and humanservices. This list of impacts should be grouped according to the six major table categories of ecologicalinputs for determining ecological outputs and services. Tables III-1 through III-6 provide an overview ofthe interrelationships in the more detailed tables (III-7 through III-12). Thus, Tables III-1 through III-6are a good starting point to make sure that certain ecological effects are not overlooked. Reviewing thecategories in the first column of each table will help in this listing process, but typically a project will havesome relatively fine management ideas that have been created by local agencies, interest groups, the Corps,or other federal resource agencies familiar with the site.
Once management inputs are identified, the ecological outputs for each input can be reviewed. If theecological outputs directly affect the form of service or benefit, they will be identified in the same row ofthe table. The likelihood of a positive or negative relationship of the effect for each of the major waterresource categories also is identified in the same row. In many cases the relationship will be indirect, andthe table user will be directed to see another table or a section within a table. When another table isidentified, the user should expect the indirect effects to be complex and diverse, often influencing mostecological inputs and outputs in the table. Because morphology is so generally influential, any projectchange in morphology will have diverse and numerous indirect effects.
More specific management will have a much more narrowed effect. If for example, management isdirected at surface agitation in order to oxygenate water, the user can search out those specific impacts,such as surface turbulence and water mixing in Table III-7 (Water and Material Transport) and oxygen inTable III-11 (Water Quality), to track through impacts on ecological outputs and services. Alternatively, amanagement approach may focus directly on aquatic plant enhancement or removal, and the table userwould enter Table III-12 (Biological Quality).
Refining List of Service Categories for Analysis
The tables can be used as a checklist to identify nearly all of the potential human services andassociated benefits associated with different restoration actions. The use of this checklist approach helpsto ensure that interconnections and unfamiliar or unusual effects will not be overlooked. However,oftentimes there will be several dozen human services with many measures of benefits, such as visitor days,acre-feet of water, specific fish and wildlife species, etc. As shown in Figure III-2, the planners can thinkof this as a list of candidate services that may be chosen for in-depth evaluation across restorationalternatives or scales of restoration efforts. Only a subset of these candidate variables may be measured,depending on their economic and political importance as well as available data, models, budget, time, andrelevance to various stakeholders (including those providing the cost-share money).
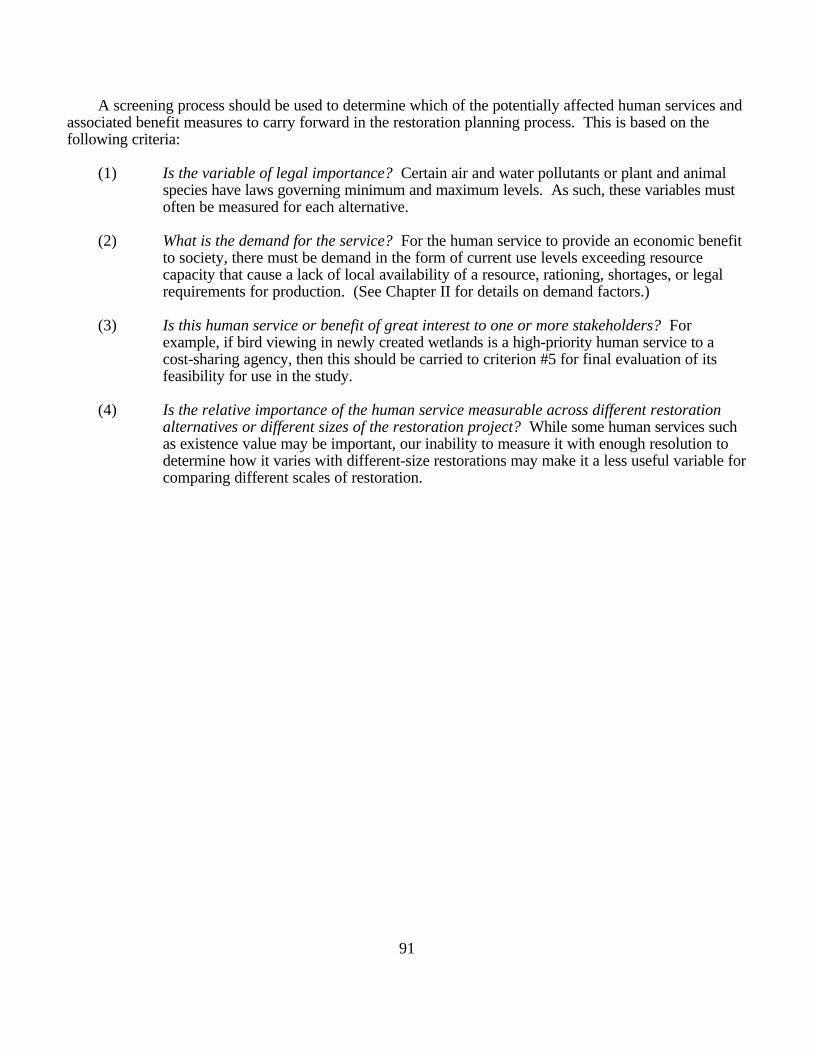
91
A screening process should be used to determine which of the potentially affected human services andassociated benefit measures to carry forward in the restoration planning process. This is based on thefollowing criteria:
(1) Is the variable of legal importance? Certain air and water pollutants or plant and animalspecies have laws governing minimum and maximum levels. As such, these variables mustoften be measured for each alternative.
(2) What is the demand for the service? For the human service to provide an economic benefitto society, there must be demand in the form of current use levels exceeding resourcecapacity that cause a lack of local availability of a resource, rationing, shortages, or legalrequirements for production. (See Chapter II for details on demand factors.)
(3) Is this human service or benefit of great interest to one or more stakeholders? Forexample, if bird viewing in newly created wetlands is a high-priority human service to acost-sharing agency, then this should be carried to criterion #5 for final evaluation of itsfeasibility for use in the study.
(4) Is the relative importance of the human service measurable across different restorationalternatives or different sizes of the restoration project? While some human services suchas existence value may be important, our inability to measure it with enough resolution todetermine how it varies with different-size restorations may make it a less useful variable forcomparing different scales of restoration.

92
RESULTS OF APPLYING
TABLES III-7 THROUGH III-12 TO RESTORATION PROJECT
CANDIDATE LIST OF HUMAN SERVICE (HS) AND BENEFIT FORM (BF)
(HS &BF ) (HS &BF ), (HS &BF ), (HS &BF ), (HS &BF ), (HS &BF ), ... (HS &BF )1 1 2 2 3 3 4 4 5 5 6 6 n n
Screening Criteria
1. Is there a legal requirement to evaluate this human service? YES NO?(If YES, carry forward to final list, otherwise, go to #2)
2. Is there a demand for added amounts of this human service? YES NO?(If YES, carry forward to #4, if NO go to #3)
3. Is this human service critical to one of the stakeholders? YES NO?(If YES, carry forward to #5, if NO drop out)
4. Can meaningful differences in the level of human services be measuredacross different restoration alternatives or scale of the project? YES NO?
(If YES, go to #5, if NO drop out)
5. Are data available to measure this human service/benefit or is theresufficient time or budget to collect such data? YES NO?
(If NO, then variable drops out, if YES, carry forward to final list)
Example Final List: (HS &BF ) (HS &BF ) (HS &BF )2 2 5 5 6 6
44444444444444444444444444444444444444444444
FIGURE III-2
CRITERIA FOR SELECTION OF CANDIDATE SERVICESFOR VALUATION OF RESTORATION EFFORTS
(5) Are data available to measure this human service and benefit, or is there sufficiently timeor money available to collect such data? If data or resources are unavailable to determinebenefits, the service should not be further examined.
If planners use the criteria shown in Figure III-2, only a subset of the potentially affected humanservices may get carried forward for detailed analysis as a result of the screening process. But the tables

93
do provide a systematic way to identify the candidate list of human services associated with environmentalrestoration without overlooking ones that a particular planner may not have encountered because of thetype of ecosystem under study. There could be a situation where human services meet criteria #1 through#5, but may be overlooked if the tables are not evaluated first. In the example in Figure III-2, it might be(HS &BF ), (HS &BF ), and (HS &BF ) that meet all of the criteria. However, without the initial Tables2 2 5 5 6 6
III-7 through III-12, one of these important human services might have been overlooked.
Illustrative Application of Linkage Tables
In the following example, selected input-output-service combinations are traced to illustrate the seriesof decisions that could be made in determining an appropriate set of human service categories deservingfurther analysis for ecosystem project planning and justification. This hypothetical example walks thereader through the decision points, via Tables III-7 through III-12, that could bring the planning team froma proposed environmental management action to a set of selected benefit categories pertinent to furtheranalysis. In a straightforward sense, the illustrative example shows the reader how an operational linkagebetween ecosystem impacts and human services could be made. Additionally, this illustrative exercisedemonstrates that the tables provide an opportunity for thinking through the environmental impacts. Thatis, the tables organize information to facilitate decisions that could be made by the environmental planningteam. Although attempts have been made to present realistic planning situation decisions, the readershould take careful note that the illustrative example is purely hypothetical.
The next section describes the planning context that would be served by this linkage approach toenvironmental planning. Following a brief description of the physical and developmental contexts of thehypothetical restoration site, a discussion of the possible path through Tables III-7 through III-12 and theselection of candidate ecosystem outputs and human services are provided. After the candidate list isproduced, the steps for applying the human demand screening criteria in Figure III-2 are followed andreasons for further analysis (yes or no) are summarized.
Planning Setting
The linkage tables and associated methodology described in this chapter are most applicable for thereconnaissance and early feasibility planning stages involving environmental impact. For restorationprojects, the initial idea at a given site typically is brought to the attention of the Corps by a local interest. In some cases, the project is developed under a regional planning effort (e.g., watershed plan). For thisexample, the restoration project was part of a long-term consideration by the Corps in close cooperationwith the state in which it was located.
Once the proposed restoration activity is on the table, the restoration planning team wouldcooperatively work through the tables. Two keys to successful application of the tables for restorationplanning are 1) an interdisciplinary team working through the tables and 2) team members withsophisticated knowledge of the subject ecosystem. The tables were designed to guide the expertise of the

94
planning team, to facilitate more effective communication between disciplines, and to promote a morerobust examination of restoration impacts and benefits. A typical planning team would consist of abiologist/environmental scientist, economist, planner, and engineer. These team members should have aworking knowledge of the subject ecosystem and would, in most cases, include the Corps study managerand selected technical staff. Some situations may call for technical staff from prominent resource agenciesaffected by the project to join the planning team (e.g., if the site is near a USFWS wildlife refuge, it may beadvantageous to have the expertise of the refuge manager as part of the team working through the tables).
Hypothetical Site and Project Description
The illustrative example is a restoration project for a small tidal lake that is part of a riverine system. The lake and the river are tributaries to an estuary that were greatly modified as the watershed wasurbanized. The lake was modified by the installation of tidal gates, by sedimentation, by contamination ofsediments by urban runoff, and by changes in its connection to the river and migratory aquatic speciesassociated with the estuary. The lake level fluctuates with the surge and ebb of the estuary tide. Aproposal to improve habitat in the lake, primarily for migratory species in the estuary, was theredistribution of sediment by hydraulic dredging to support a network of marsh and tidal-flow channels. Thus, the focus for this illustrative example is on the impacts of dredging for restoration purposes.
Candidate Ecosystem Outputs and Human Services
Based on the proposed management action, hydraulic dredging, Figure III-1 indicates that every tablein the series except for biological quality (Table III-12) would be directly influenced. The six tables can beaccessed in any order, although starting with Table III-7 is recommended because it is affected by mostCorps management actions and because changes in morphology and topography usually cause additionalecological and other changes in aquatic ecosystems.
The direct and indirect impacts of hypothetical dredging activities are listed in Tables III-13 and III-14, respectively. First, the example covers all of the direct impacts (Table III-13) and proceeds througheach of the elements in the tables accordingly. Then, each of the indirect impacts are traced through theappropriate tables (summarized in Table III-14). All candidate human service entries are provided for eachecological output that is deemed appropriate. This constitutes the candidate services inventory as shown inthe left-hand section of Tables III-13 and III-14. The entire set of candidate human services are furtherscrutinized through the demand screening procedure shown on the right-hand section of the tables. Adescription of the demand screening procedure that summarizes the candidate services inventory followsthis section.
Entering Table III-7, we encounter resource surface area first (note all table entries are shown inboldface text). It is a major variable among ecological inputs altered by the proposed

95
TABLE III-13
ILLUSTRATIVE EXAMPLE: DIRECT ECOSYSTEM IMPACTS AND CANDIDATE HUMAN SERVICES
CANDIDATE SERVICES INVENTORY SERVICE DEMAND ANALYSIS
Table Reference Dredging-Influenced Dredging-Influenced Candidate Human Service Screening Criteria CarryEcosystem Input Ecosystem Output Forward
1 2 3 4 5
Watershed, Basin, andChannel and TopographicalProcess (Table III-7)
dredging will increase water total use area increases beach swimming N Y -- N -- Nresource surface area
tubing N Y -- N -- N
snorkeling N Y -- N -- N
scuba N Y -- N -- N
non-motor rafting, canoeing, N Y -- Y Y Ykayaking
sail boating N Y -- N -- N
small outboard-motor and air N Y -- Y Y Yboats
inboard recreational craft N Y -- N -- N
commercial craft N Y -- N -- N
various land uses including N Y -- N -- Ncommercial, recreational andcultural-natural heritage
aesthetic sense of space and pleasing environment N Y -- Y Y Yhorizon
resource surface area fluctuation of use base boating N Y -- Y Y Yfluctuation should decreasewith increased volumedredged
swimming N Y -- N -- N
aesthetics consistency N Y -- Y Y Y
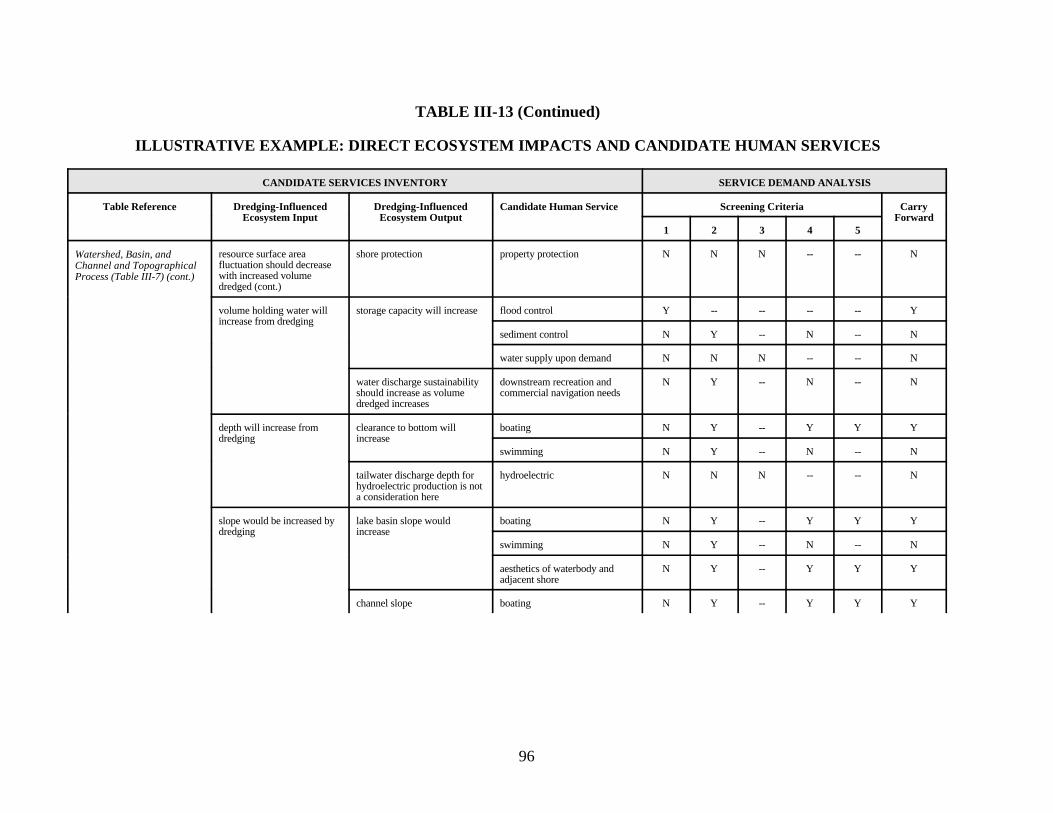
96
TABLE III-13 (Continued)
ILLUSTRATIVE EXAMPLE: DIRECT ECOSYSTEM IMPACTS AND CANDIDATE HUMAN SERVICES
CANDIDATE SERVICES INVENTORY SERVICE DEMAND ANALYSIS
Table Reference Dredging-Influenced Dredging-Influenced Candidate Human Service Screening Criteria CarryEcosystem Input Ecosystem Output Forward
1 2 3 4 5
Watershed, Basin, andChannel and TopographicalProcess (Table III-7) (cont.)
resource surface area shore protection property protection N N N -- -- Nfluctuation should decreasewith increased volumedredged (cont.)
volume holding water will storage capacity will increase flood control Y -- -- -- -- Yincrease from dredging
sediment control N Y -- N -- N
water supply upon demand N N N -- -- N
water discharge sustainability downstream recreation and N Y -- N -- Nshould increase as volume commercial navigation needsdredged increases
depth will increase from clearance to bottom will boating N Y -- Y Y Ydredging increase
swimming N Y -- N -- N
tailwater discharge depth for hydroelectric N N N -- -- Nhydroelectric production is nota consideration here
slope would be increased by lake basin slope would boating N Y -- Y Y Ydredging increase
swimming N Y -- N -- N
aesthetics of waterbody and N Y -- Y Y Yadjacent shore
channel slope boating N Y -- Y Y Y

97
TABLE III-13 (Continued)
ILLUSTRATIVE EXAMPLE: DIRECT ECOSYSTEM IMPACTS AND CANDIDATE HUMAN SERVICES
CANDIDATE SERVICES INVENTORY SERVICE DEMAND ANALYSIS
Table Reference Dredging-Influenced Dredging-Influenced Candidate Human Service Screening Criteria CarryEcosystem Input Ecosystem Output Forward
1 2 3 4 5
Watershed, Basin, andChannel and TopographicalProcess (Table III-7) (cont.)
slope would be increased by channel slope (cont.) swimming N Y -- N -- Ndredging (cont.)
hydropower generation (head) N N N -- -- N
flood control Y -- -- -- -- Y
aesthetics of waterbody and N Y -- Y Y Yadjacent shore
shoreline length is likely to riparian shade may increase shore recreation N Y -- N -- Nbe increased by dredging depending on proximity todesigned to create wetlands trees
shoreline erosion often shoreline property N N N -- -- Nincreases as shoreline lengthincreases but should becontrolled by wetlandprotection
shore recreation N Y -- N -- N
aesthetics N Y -- Y Y Y
shoreline irregularity should the ratio of shoreline length to aesthetics N Y -- Y Y Ybe increased by dredging in a water area should increasepattern suitable for wetlandcreation
channel form is changed by the sinuosity of tidal creeks in aesthetics N Y -- Y Y Ydredging the wetland could be increased
over time boating N Y -- Y Y Y
floodplain form is altered by floodplain storage capacity for flood impacts on adjacent Y -- -- -- -- Ydredging water and sediment should floodplain
increase at the sitedownstream flood impacts Y -- -- -- -- Y

98
TABLE III-13 (Continued)
ILLUSTRATIVE EXAMPLE: DIRECT ECOSYSTEM IMPACTS AND CANDIDATE HUMAN SERVICES
CANDIDATE SERVICES INVENTORY SERVICE DEMAND ANALYSIS
Table Reference Dredging-Influenced Dredging-Influenced Candidate Human Service Screening Criteria CarryEcosystem Input Ecosystem Output Forward
1 2 3 4 5
Watershed, Basin, andChannel and TopographicalProcess (Table III-7) (cont.)
floodplain form is altered by floodplain storage capacity for direct effect and indirect effect N N N -- -- Ndredging (cont.) water and sediment should via groundwater recharge
increase at the site (cont.) -- -- -- -- -- N
watershed form should not be not applicable not applicable -- -- -- -- -- Nmeasurably affected by thisproject
Water and MaterialTransport Process (Table III-8)
dredging directly affects not applicable not applicable -- -- -- -- -- Nwatershed and materialtransport only temporarily
Substrate (Table III-9) substrate particle structure is substrate particle size could be aesthetics (e.g., emergent marsh, N Y -- Y Y Yaltered by dredging altered by dredging depending submerged rock and vegetation)
on specific conditions at thesite
substrate particle stability may direct effect via construction N N N -- -- Nbe altered by dredging--usually supportstability decreases
substrate particle compaction construction support in N N N -- -- Nusually decreases floodplains and watersheds
substrate chemistry organic matter content would not applicable -- -- -- -- -- N not be expected to change
nutrient content would not be not applicable -- -- -- -- -- Nexpected to change

99
TABLE III-13 (Continued)
ILLUSTRATIVE EXAMPLE: DIRECT ECOSYSTEM IMPACTS AND CANDIDATE HUMAN SERVICES
CANDIDATE SERVICES INVENTORY SERVICE DEMAND ANALYSIS
Table Reference Dredging-Influenced Dredging-Influenced Candidate Human Service Screening Criteria CarryEcosystem Input Ecosystem Output Forward
1 2 3 4 5
Substrate (Table III-9) (cont.) substrate orientation and within-habitat vertical aesthetics--as created by spatial N Y -- Y Y Ydevelopment development such as a mix of diversification of shape and
steep-sided and gradual slopes, color in submerged marshes etc.are likely to result fromplanned wetland developmentduring dredging
between-habitat vertical aesthetics-as affected by spatial N Y -- Y Y Ydevelopment is likely to result diversification in emergentfrom placement of dredge marshes etc.material above and below thewater line
Landscape Process (TableIII-10)
habitat patchiness within habitat patchiness is aesthetics N Y -- Y Y Ylikely to be increased byproper contouring of thewetlands bottom habitat duringdredging
habitat edge development aesthetics N Y -- Y Y Yshould be increased duringwetland development
habitat connections and intrahabitat connections that aesthetics N Y -- Y Y Ycorridors link similar habitats are likely
to be fostered by dredging tocreate wetlands
interhabitat connections aesthetics N Y -- Y Y Ybetween different habitat typeswill be increased as habitatedge development increases

100
TABLE III-13 (Continued)
ILLUSTRATIVE EXAMPLE: DIRECT ECOSYSTEM IMPACTS AND CANDIDATE HUMAN SERVICES
CANDIDATE SERVICES INVENTORY SERVICE DEMAND ANALYSIS
Table Reference Dredging-Influenced Dredging-Influenced Candidate Human Service Screening Criteria CarryEcosystem Input Ecosystem Output Forward
1 2 3 4 5
Landscape Process (TableIII-10) (cont.)
habitat connections and air-water interface will not be not applicable -- -- -- -- -- Ncorridors (cont.) impacted significantly
habitat diversity can be within habitat diversity may be aesthetics N Y -- Y Y Yreduced or increased by affected by spatial varietydredging patterns created while dredging
between habitat diversity such aesthetics N Y -- Y Y Yas the mix of water, shortvegetation and tall vegetation,can be encouraged by dredgingdesigned to develop wetlands
human habitat is not part of not applicable not applicable -- -- -- -- -- Nthe design of the proposeddredging activity
Water and Sediment Quality(Table III-11)
all direct impacts will only be not applicable not applicable -- -- -- -- -- Ntemporary during actualdredging activity

101
TABLE III-14
ILLUSTRATIVE EXAMPLE: INDIRECT ECOSYSTEM IMPACTS AND CANDIDATE HUMAN SERVICES
CANDIDATE SERVICES INVENTORY SERVICE DEMAND ANALYSIS
Dredging- Direct Ecological Table Reference Factors Indirectly Dredging-Influenced Candidate HumanInfluenced Outputs with Affected by Ecological Output Service
Ecosystem Input Indirect Effects Dredging
Screening Criteria CarryForward
1 2 3 4 5
Resource Surface total area of population forest and range not applicable -- -- -- -- -- NArea productive habitat is production processes populations will not be
increased by usually are increased affected by dredgingdredging when more habitat
Biological Qualities(Table III-12)
area is increased pathogen populations not applicable -- -- -- -- -- Nusually are notaffected by dredging
aquatic macrophyte fishing N Y -- Y Y Yextent is determinedby area of suitablehabitat
commercial harvest N Y -- N -- N
recreational harvest N Y -- Y Y Yand other use
ecological indicators N Y -- N -- N
endangered species Y -- -- -- -- Y
nuisance species N Y -- N -- N
swimming, boating, N Y -- Y Y Yetc.
planktonic algae will fishing N Y -- Y Y Yincrease in proportionto the areal increase inhabitat
commercial harvest N Y -- N -- N
recreational harvest N Y -- Y Y Yand other use
ecological indicators N Y -- Y Y Y

102
TABLE III-14 (Continued)
ILLUSTRATIVE EXAMPLE: INDIRECT ECOSYSTEM IMPACTS AND CANDIDATE HUMAN SERVICES
CANDIDATE SERVICES INVENTORY SERVICE DEMAND ANALYSIS
Dredging- Direct Ecological Table Reference Factors Indirectly Dredging-Influenced Candidate HumanInfluenced Outputs with Affected by Ecological Output Service
Ecosystem Input Indirect Effects Dredging
Screening Criteria CarryForward
1 2 3 4 5
Resource Surface total area of population planktonic algae will nuisance species N Y -- Y Y YArea (cont.) productive habitat is production processes increase in proportion
increased by usually are increased to the areal increase indredging (cont.) when more habitat habitat (cont.)
Biological Qualities(Table III-12) (cont.)
area is increased(cont.)
swimming, boating, N Y -- Y Y Yetc.
suspended solids N N N -- -- N
fish populations will commercial harvest N Y -- N -- Nincrease in proportionto areal increase ofhabitat
recreational catch, N Y -- Y Y Yharvest and other use
ecological indicators N Y -- N -- N
health hazard Y -- -- -- -- Y
depredation N N N -- -- N
watchable wildlife N Y -- Y Y Y
endangered species Y -- -- -- -- Y
invertebrate commercial harvest N Y -- N -- Npopulations willincrease in proportionto areal increase ofhabitat
recreational harvest N Y -- Y Y Y
ecological indicators N Y -- N -- N
health hazards Y -- -- -- -- Y
property damage N N N -- -- --
nuisance N Y -- N -- N
endangered species Y -- -- -- -- Y

103
TABLE III-14 (Continued)
ILLUSTRATIVE EXAMPLE: INDIRECT ECOSYSTEM IMPACTS AND CANDIDATE HUMAN SERVICES
CANDIDATE SERVICES INVENTORY SERVICE DEMAND ANALYSIS
Dredging- Direct Ecological Table Reference Factors Indirectly Dredging-Influenced Candidate HumanInfluenced Outputs with Affected by Ecological Output Service
Ecosystem Input Indirect Effects Dredging
Screening Criteria CarryForward
1 2 3 4 5
Resource Surface total area of population invertebrate watchable species N Y -- Y Y YArea (cont.) productive habitat is production processes populations will
increased by usually are increased increase in proportiondredging (cont.) when more habitat to areal increase of
Biological Qualities(Table III-12) (cont.)
area is increased habitat (cont.)(cont.)
certain reptiles and commercial harvest N Y -- N -- Namphibians shouldincrease while othersmay decrease slightly
recreational harvest N Y -- Y Y Y
depredation N N N -- -- N
nuisance/health Y -- -- -- -- Y
endangered species Y -- -- -- -- Y
ecological indicator N Y -- N -- N
watchable species N Y -- Y Y Y
certain bird waterfowl hunting N Y -- Y Y Ypopulations shouldincrease as dredgedarea increases
upland bird hunting N Y -- N -- N
watchable water birds N Y -- Y Y Y
watchable riparian & N Y -- N -- Nupland birds
endangered species Y -- -- -- -- Y
ecological indicators N Y -- N -- N
nuisance/health Y -- -- -- -- Y
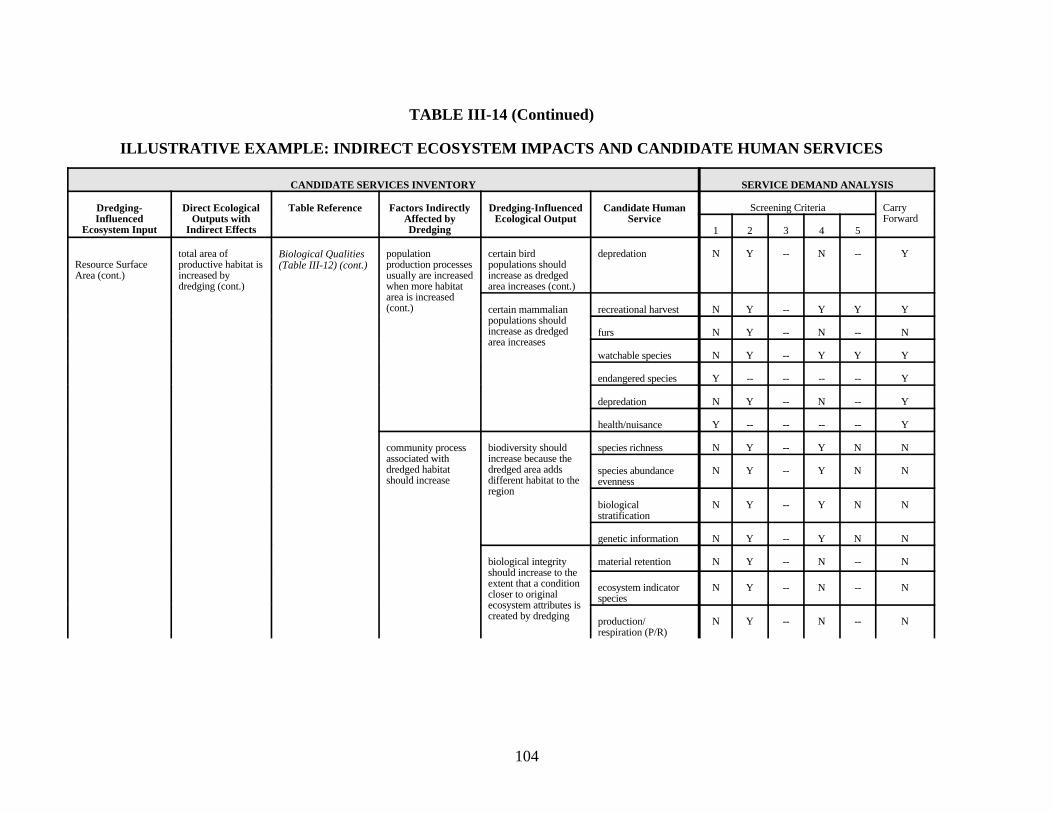
104
TABLE III-14 (Continued)
ILLUSTRATIVE EXAMPLE: INDIRECT ECOSYSTEM IMPACTS AND CANDIDATE HUMAN SERVICES
CANDIDATE SERVICES INVENTORY SERVICE DEMAND ANALYSIS
Dredging- Direct Ecological Table Reference Factors Indirectly Dredging-Influenced Candidate HumanInfluenced Outputs with Affected by Ecological Output Service
Ecosystem Input Indirect Effects Dredging
Screening Criteria CarryForward
1 2 3 4 5
Resource Surface productive habitat is production processes populations shouldArea (cont.) increased by usually are increased increase as dredged
total area of population certain bird depredation N Y -- N -- Y
dredging (cont.) when more habitat area increases (cont.)
Biological Qualities(Table III-12) (cont.)
area is increased(cont.) certain mammalian recreational harvest N Y -- Y Y Y
populations shouldincrease as dredgedarea increases
furs N Y -- N -- N
watchable species N Y -- Y Y Y
endangered species Y -- -- -- -- Y
depredation N Y -- N -- Y
health/nuisance Y -- -- -- -- Y
community process biodiversity should species richness N Y -- Y N Nassociated with increase because thedredged habitat dredged area addsshould increase different habitat to the
region
species abundance N Y -- Y N Nevenness
biological N Y -- Y N Nstratification
genetic information N Y -- Y N N
biological integrity material retention N Y -- N -- Nshould increase to theextent that a conditioncloser to originalecosystem attributes iscreated by dredging
ecosystem indicator N Y -- N -- Nspecies
production/ N Y -- N -- Nrespiration (P/R)

105
TABLE III-14 (Continued)
ILLUSTRATIVE EXAMPLE: INDIRECT ECOSYSTEM IMPACTS AND CANDIDATE HUMAN SERVICES
CANDIDATE SERVICES INVENTORY SERVICE DEMAND ANALYSIS
Dredging- Direct Ecological Table Reference Factors Indirectly Dredging-Influenced Candidate HumanInfluenced Outputs with Affected by Ecological Output Service
Ecosystem Input Indirect Effects Dredging
Screening Criteria CarryForward
1 2 3 4 5
Resource Surface total area of community process biological integrity material export N Y -- N -- NArea (cont.) productive habitat is associated with should increase to the stability
increased by dredged habitat extent that a conditiondredging (cont.) should increase closer to original
Biological Qualities(Table III-12) (cont.)
(cont.) ecosystem attributes iscreated by dredging(cont.)
production stability N Y -- N -- N
production level N Y -- N -- N
biogeochemical N Y -- N -- Ncycling rate
efficiency of solar N Y -- N -- Nenergy capture
trophic level N Y -- N -- Nefficiency
foodweb complexity/ N Y -- N -- Nsupport
Resource Area concentration and population populations are not applicable -- -- -- -- -- --Fluctuation dilution effect production process affected only
Biological Qualities(Table III-12)
temporarily in thecategory
shore protection population most population and *(see outputs and * * * * * *should increase as production process community process is candidate servicefluctuation increases and community affected by shore analysis for
process will be protection at this site productive habitataffected entry)

106
TABLE III-14 (Continued)
ILLUSTRATIVE EXAMPLE: INDIRECT ECOSYSTEM IMPACTS AND CANDIDATE HUMAN SERVICES
CANDIDATE SERVICES INVENTORY SERVICE DEMAND ANALYSIS
Dredging- Direct Ecological Table Reference Factors Indirectly Dredging-Influenced Candidate HumanInfluenced Outputs with Affected by Ecological Output Service
Ecosystem Input Indirect Effects Dredging
Screening Criteria CarryForward
1 2 3 4 5
Resource Area shore protection suspended total suspended solids turbidity N Y -- N -- NFluctuation (cont.) should increase as particulate matter should decrease with
fluctuation increases should decrease as decreased shore(cont.) shore protection erosion
Water and SedimentQuality (Table III-11)
increases
general drinking and N N N -- -- Nfood processingcontaminant --grittiness, possiblytoxic
abrasion causes N N N -- -- Nmachinery andtransport systemdamage
recreational boating N Y -- Y Y Y
swimming N Y -- N -- N
aesthetics N Y -- Y Y Y
organic suspended domestic water N N N -- -- Nsolids contaminant
suspended color will domestic water use N N N -- -- Nchange to a morenatural color aesthetics N Y -- Y Y Y
suspended toxic domestic and N N N -- -- Nmaterials should livestock waterdecrease following contaminantdredging
dissolved matter water color may be aesthetics N Y -- Y Y Ymay increase affected slightly as shoreerosion decreases domestic water supply N N N -- -- N

107
TABLE III-14 (Continued)
ILLUSTRATIVE EXAMPLE: INDIRECT ECOSYSTEM IMPACTS AND CANDIDATE HUMAN SERVICES
CANDIDATE SERVICES INVENTORY SERVICE DEMAND ANALYSIS
Dredging- Direct Ecological Table Reference Factors Indirectly Dredging-Influenced Candidate HumanInfluenced Outputs with Affected by Ecological Output Service
Ecosystem Input Indirect Effects Dredging
Screening Criteria CarryForward
1 2 3 4 5
Volume total material and population all population and *(see outputs and * * * * * *energy content will production processes community processes candidate serviceincrease as dredged and community present in the newly analysis forvolume increases processes will be dredged habitat will productive habitat
Biological Qualities(Table III-12)
slightly effected expand in proportion entry)downstream from to the additionalthe site volume dredged
concentration and biological quality living and non-living not applicable -- -- -- -- -- --dilution effects will will be supported in materialbe minor and proportion to concentrations willtemporary increased loads temporarily decrease
water quality factors living and non-living not applicable -- -- -- -- -- --will be temporarily materialand slightly effected concentrations willby volumetric temporarily decreaseexpansion
water discharge population a small flow not applicable -- -- -- -- -- --sustainability will production processes augmentation willbe increased a slight and community result in anamount processes will be insignificant positive
slightly effected effect on the esturarinedownstream from ecosystemthe site

108
TABLE III-14 (Continued)
ILLUSTRATIVE EXAMPLE: INDIRECT ECOSYSTEM IMPACTS AND CANDIDATE HUMAN SERVICES
CANDIDATE SERVICES INVENTORY SERVICE DEMAND ANALYSIS
Dredging- Direct Ecological Table Reference Factors Indirectly Dredging-Influenced Candidate HumanInfluenced Outputs with Affected by Ecological Output Service
Ecosystem Input Indirect Effects Dredging
Screening Criteria CarryForward
1 2 3 4 5
Volume (cont.) oxygen load, biological quality most chemical and *(see outputs and * * * * * *thermal load, and will be supported in biological process candidate servicematerial load, will proportion to supported by loads analysis forincrease in increased loads will increase in productive habitatproportion to proportion entry)increased aquaticvolume at the site
Biological Qualities(Table III-12) (cont.)
water quality will be most chemical and *(see outputs and * * * * * *supported in biological process candidate serviceproportion to supported by loads analysis forincreased loads will increase in productive habitat
proportion entry)
Depth depth variables will not applicable not applicable not applicable not applicable -- -- -- -- -- --be little affected atthe site or areirrelevant
Water area-depth evapotranspiration not applicable not applicable not applicable not applicable -- -- -- -- -- --ratio will not be affected
by dredging at thishumid site
Fetch although slightly not applicable not applicable not applicable not applicable -- -- -- -- -- --affected, turbulentmixing would beinsignificant
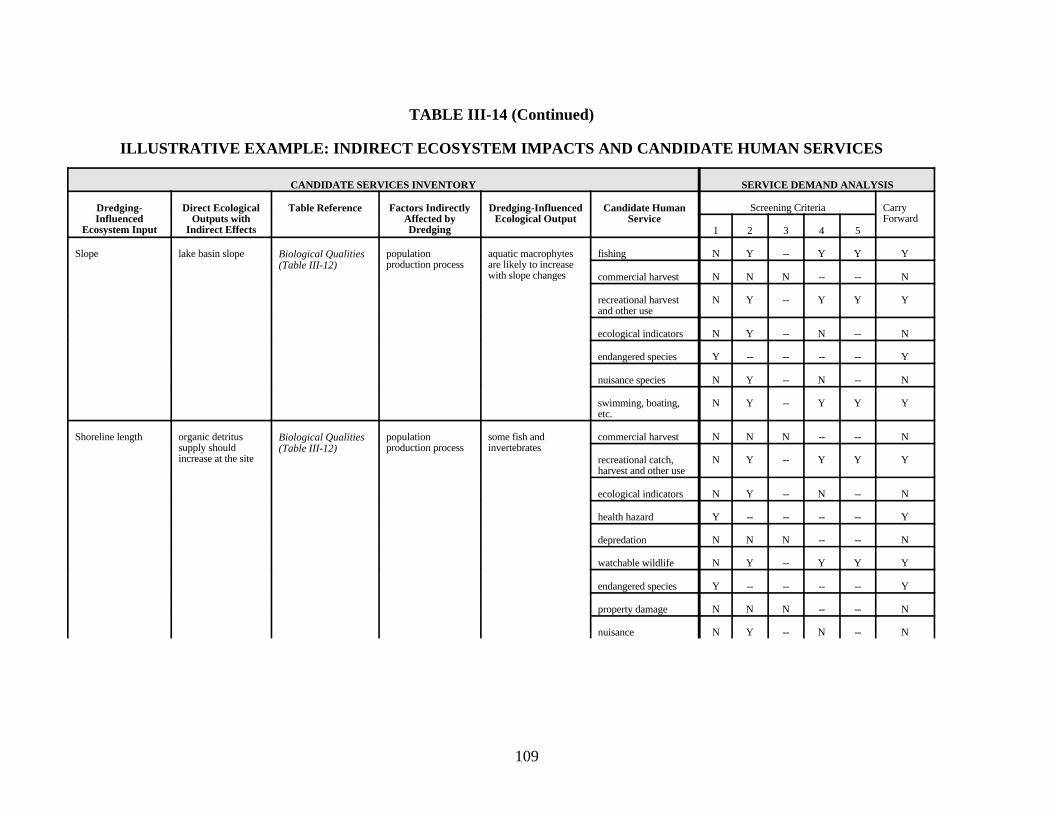
109
TABLE III-14 (Continued)
ILLUSTRATIVE EXAMPLE: INDIRECT ECOSYSTEM IMPACTS AND CANDIDATE HUMAN SERVICES
CANDIDATE SERVICES INVENTORY SERVICE DEMAND ANALYSIS
Dredging- Direct Ecological Table Reference Factors Indirectly Dredging-Influenced Candidate HumanInfluenced Outputs with Affected by Ecological Output Service
Ecosystem Input Indirect Effects Dredging
Screening Criteria CarryForward
1 2 3 4 5
Slope lake basin slope population aquatic macrophytes fishing N Y -- Y Y YBiological Qualities(Table III-12) production process are likely to increase
with slope changes commercial harvest N N N -- -- N
recreational harvest N Y -- Y Y Yand other use
ecological indicators N Y -- N -- N
endangered species Y -- -- -- -- Y
nuisance species N Y -- N -- N
swimming, boating, N Y -- Y Y Yetc.
Shoreline length organic detritus population some fish and commercial harvest N N N -- -- Nsupply should production process invertebrates increase at the site
Biological Qualities(Table III-12)
recreational catch, N Y -- Y Y Yharvest and other use
ecological indicators N Y -- N -- N
health hazard Y -- -- -- -- Y
depredation N N N -- -- N
watchable wildlife N Y -- Y Y Y
endangered species Y -- -- -- -- Y
property damage N N N -- -- N
nuisance N Y -- N -- N

110
TABLE III-14 (Continued)
ILLUSTRATIVE EXAMPLE: INDIRECT ECOSYSTEM IMPACTS AND CANDIDATE HUMAN SERVICES
CANDIDATE SERVICES INVENTORY SERVICE DEMAND ANALYSIS
Dredging- Direct Ecological Table Reference Factors Indirectly Dredging-Influenced Candidate HumanInfluenced Outputs with Affected by Ecological Output Service
Ecosystem Input Indirect Effects Dredging
Screening Criteria CarryForward
1 2 3 4 5
Shoreline length organic detritus suspended organic suspended not applicable -- -- -- -- -- --(cont.) supply should particulate matter solids should increase,
increase at the site but would be(cont.) insignificant
Water and SedimentQuality (Table III-11)
riparian shade not applicable at this site, riparian not applicable not applicable -- -- -- -- -- --shade is a minorissue
terrestrial organism population numerous reptiles and commercial harvest N N N -- -- Nwater use production process amphibians, birds
Biological Qualities(Table III-12)
should be favored bydredging design
recreational harvest N Y -- Y Y Y
depredation N N N -- -- N
nuisance/health Y -- -- -- -- Y
endangered species Y -- -- -- -- Y
ecological indicator N Y -- N -- N
watchable species N Y -- Y Y Y
waterfowl hunting N Y -- Y Y Y
upland bird hunting N Y -- N -- N
watchable water birds N Y -- Y Y Y
watchable riparian & N Y -- Y Y Yupland birds
shore erosion population net erosion effects not applicable -- -- -- -- -- --production process should be minimal at
this site

111
TABLE III-14 (Continued)
ILLUSTRATIVE EXAMPLE: INDIRECT ECOSYSTEM IMPACTS AND CANDIDATE HUMAN SERVICES
CANDIDATE SERVICES INVENTORY SERVICE DEMAND ANALYSIS
Dredging- Direct Ecological Table Reference Factors Indirectly Dredging-Influenced Candidate HumanInfluenced Outputs with Affected by Ecological Output Service
Ecosystem Input Indirect Effects Dredging
Screening Criteria CarryForward
1 2 3 4 5
Shoreline irregularity ratio of shoreline population numerous aquatic and *(see outputs and * * * * * *length to water area production process terrestrial organisms candidate service
Biological Qualities(Table III-12) (cont.)
and community are affected analysis forprocess productive habitat
entry)
Water and SedimentQuality (Table III-11)
pattern of contours suspended particulate not applicable -- -- -- -- -- --dredged will impact matter will be altered--water and sediment very slightly decreasedquality depending on pattern
dredged
floodplain storage substrate particle substrate particle size aesthetics N Y -- Y Y Ycapacity structure
Substrate (Table III-9)
substrate compaction construction support N N N -- -- Nin floodplains andwatershed

112
management actions. Varying the resource surface area would increase total use area for a variety ofpossible recreational uses such as beach swimming and tubing. Aesthetic human services are also ofconcern. The expanse of open water, marsh, and forest, and its juxtaposition with the urban environmentare likely to affect aesthetic sensibility. Productive habitat area is another variable linked to surface area;however, support of biological processes is only indirectly linked to human services. Indirect humanservices are addressed below after all direct effects are reviewed.
The remaining direct impacts are summarized in Table III-13. Many of the impacts are deferred toanalysis under indirect impacts. All of the potential direct impact entries from Table III-8, which describewater and material transport, were deemed insignificant and therefore were not applicable for furtheranalysis. The significant direct impacts from dredging on water and sediment quality (Table III-11) wouldbe only temporary, occurring during the actual dredging activity, and were therefore excluded from furtheranalysis.
After the analysis of the direct impacts, the restoration team could retrace the tables and followthrough the indirect impacts. The indirect impacts and candidate services are shown in Table III-14. Because of the complex interrelationships between elements of the ecosystem, examination of indirectimpacts can be an intense undertaking. It is up to the planning team to decide the appropriate number ofiterations that should be followed in examining the indirect impacts. For the illustrative example, the firstgeneration of indirect impacts originating from Table III-7 is shown.
The first reference to a relevant indirect effect from Table III-7 is found under resource surface areaand the entry called total area of productive output. The precursor effect that is referenced directs theplanning team to Table III-12, which describes potential impacts on biological processes. At Table III-12, the first ecological input category considered is population production processes. Following throughto the ecological output column reveals forest and range populations. For the illustrative case ofdredging activities, this output category would not be affected, and therefore no further analysis on thatfamily of impacts is needed. Similarly, pathogen populations are typically not impacted by dredgingactivities and therefore would not be applicable for further analysis. Decomposer populations mayindirectly impact water quality. The project team would follow through on water quality impacts, butfor the case of the illustrative example, only the first generation of indirect impacts is being described. Thenext category of direct ecological outputs to consider is aquatic macrophytes, which would probably beenhanced by the dredging activity. Several associated human service impacts could be influenced,including recreation and commercial fishing. The remaining indirect impacts are summarized in TableIII-14.
Screening Criteria for Further Analysis
The results of the inventory identified several candidate human service categories, some of whichsurface multiple times (e.g., aesthetics). Given restoration priorities, study project budgets, and availabletime/data, it may not be practical or feasible to quantify and/or monetize all of these human services. Todetermine which candidate services might be carried forward for further analysis during plan formulation,the planning team would apply the criteria in Figure III-2. The illustrative example is continued with theanalysis of demand for services that is summarized in the right side of Tables III-13 and III-14. Each of thefive criteria is considered and assigned a yes or no response according to the conditions of the illustrativeexample.
Looking at the first entry in Table III-13, the candidate human service is beach swimming. Theservice demand analysis first addresses the issue of whether it is a legal requirement for beach swimming to

113
be evaluated. The answer is no, there is not a legal reason to evaluate beach swimming. The next criterionasks if there is demand for added amounts of this service, which in this case there is, given the closeproximity to an urban area where beach swimming would be used by families. Answering yes to thesecond criterion, then moves us to the fourth, which asks if meaningful differences in human service can bemeasured given the proposed restoration alternatives. The answer here is no because the dredging willprovide better conditions for wildlife but will not improve the quality of the water to point that wouldsupport beach swimming. Therefore, the beach swimming human service would not be carried forwardfor further analysis.
Each candidate human service listed in Tables III-13 and III-14 is evaluated in similar manner. Insituations where judgments on a certain criterion are not needed, a double dash is provided. There are afew cases in Table III-14 where the candidate service inventory revealed the same set of candidate humanservices as an earlier output. In this case, reference is made to the earlier entry and asterisks are shown inthe service demand analysis columns. The trends for each criterion are described below, and then theremaining set of human service categories suggested for further analysis are summarized.
Legal. A review of human service and benefit measures in Tables III-14 and III-15 suggests that veryfew legally require analysis. Of all the candidate human service categories, only endangered species,flood control, and health hazards require legal consideration. Endangered species require analysisaccording to federal law. According to state laws, any modifications to the watershed, includingrestoration activities, need to be evaluated in terms of impacts on flood potential. Lastly, the county healthdepartment pays particular attention to water resource activities especially along the lines of increasedhealth threats. Each of these is automatically carried forward. Although water resource activities may notbe significantly impacted by the proposed project, an assessment stating the magnitude of impacts (small orlarge) is required.
Demand. Most of the candidate services offered by the dredging activities are demanded, especiallythe recreation, aesthetic, and wildlife-type services. Thus, most of the responses to the second criterion areyes. Demand for biodiversity and ecological integrity in the county is evidenced by articles about naturalarea restoration in the local newspaper as well as volunteer efforts to clean up nearby streams to improvehabitat for fish and wildlife. Volunteers, a local fundraiser, and contribution by local businesses to providemoney and materials needed are being organized for another nearby area. This documents the demand forbiological integrity and diversity, since native species are being restored in these areas. There is a demandfor freshwater fishing sites close to urban areas. The fish and game agency is attempting to hold "take akid fishing days" to encourage children and teenagers to fish. Existing areas for freshwater fishing areoften quite crowded on weekends, decreasing the quality of the fishing experience. While there arecurrently adequate opportunities for bird viewing, this is a rapidly growing segment of outdoor recreation,and this location may soon run out of sites to see wading and shore birds.
A few of the candidate services are not in demand at this particular site, such as water supply(residential, commercial, agricultural) and hydroelectric power. Another service that is not in demand isproperty protection, because the site is zoned for no development and therefore has no residential orcommercial properties threatened. Another potential service that is provided by improved substrateconditions is for construction. However, it is not applicable because limited construction and use of heavyequipment are planned around the site.
Importance of Stakeholders. This demand criterion provides an opportunity to accommodate humanservices that might be critical to a particular stakeholder while not displaying a firm case for added demand

114
(second criterion). Most of the entries in the third criterion are left blank because an affirmative responseto the second criterion moves the demand analysis to the fourth criterion. The remaining human servicecategories evaluated under this criterion were assigned no because they were not of particular importanceto any stakeholder. For example, water supply was assigned no to this criterion because it is not an issue. When a human service category is assigned no under this criterion, it is no longer considered for furtheranalysis.
Determination of Meaningful Differences Across Alternatives. While there are many humanservice categories that will be impacted by the proposed dredging, the magnitude of impact in many casescannot be meaningfully measured. Although there is demand for many of the active water-based recreationactivities, such as swimming and tubing in this region, presently there is none, and the proposed dredgingactivities will not improve the resource enough to allow for significantly more water-contact recreation. Therefore, many of the candidate human service categories are assigned a no at this step. Some boatingactivities and recreational fishing will be improved by the project; however, commercial fishing will notbe impacted significantly. All categories of aesthetics and watchable wildlife will be enhanced. Anyhuman service categories assigned a no for this criterion would not be further analyzed.
Data Availability. Of the candidate human service categories that made it to this final criterion, thefinal issue of data availability must be addressed. The importance of aesthetics, fishing, boating, andhunting could be assessed through a brief survey of potential users of the site. However, the most likelysource of valuation data will be through the existing literature.For example, willingness to pay (WTP) for additional visitor days of fishing and higher catch rates can beobtained from the 1990 National Survey of Fishing, Hunting, and Wildlife Recreation. For bird viewing,the Corps will, in cooperation with the Audubon Society and Ducks Unlimited, conduct on-site surveys ofcurrent bird-viewing areas and ask visitors about their interest in using the newly restored area and theirWTP per day. Biodiversity will be retained in index form, but nonuse values will not be monetized becauseneither the money nor the time is available to perform a contingent valuation survey.
In summary, many potential human services could be impacted by the proposed dredging activity. Inthis case, about fifteen pages of candidate human service categories were distilled to a handful of criticalhuman service categories that could be realistically pursued. For legal reasons, impacts on endangeredspecies, health hazards, and flood control must be assessed. The values of fishing, hunting, boating,wildlife watching, and aesthetics could form a substantial argument for project justification. This wouldgive the restoration planning team some insights and direction for further valuation analysis. As theplanning activities unfold, other factors may be discovered that would cause the restoration team to revisitthe tables.
Final Thoughts on Application
As planners move through the entries in the tables, they will encounter a list of direct and indirecteffects that may possibly result from proposed management actions. In the process, they will encounterfeedbacks representing complex systems interactions. The complexity will grow with the time and spacedimensions included in the project. The intent in this table complexity is to encourage planners to analyzeseveral steps further than they might if they simply looked at a list of direct linkages between ecologicaloutputs and human services. At what point should table readers break the feedback cycle? There is nopat answer of course, but at some point ecologically informed readers will no longer be able to identifymeaningful change.

115
This method of identifying meaningful links between ecological outputs and human services will haveserved its purpose well if it encourages deeper questioning of management alternatives than wouldotherwise have occurred. For complex environmental restoration projects or any other project involvingenvironmental impacts, this method will be served best by an interdisciplinary team of engineers, ecologists,economists, and other special disciplines. This method should become increasingly useful as it is used formore and more projects and users become more familiar with its strengths and weaknesses. It will beenhanced further if it is modified to add meaningful dimension and to delete trivia. The results of certainprojects at least should be rigorously monitored to identify which ecological links to human servicesactually materialized and why, as advocated in principles of adaptive management (Walters 1986).
CLOSING DISCUSSION
The goal of this research effort was to provide a hierarchical list that Corps planners could use tosupport the examination of economic and ecological impacts associated with proposed environmentalrestoration projects. Tables III-7 through III-12 support that goal. If utilized by the Corps planningcommunity, these tables will make an immediate impact on environmental plan formulation by offering amore comprehensive profile of ecological and economic impact categories. The tables provide more than180 entries of ecosystem effects and human service linkages associated with typical Corps environmentalrestoration projects. This listing alone provides a useful starting point for a Corps planner charged withproject formulation and evaluation.
Although the linkage tables are important products of this research, an equally important contributionto the field of environmental evaluation is the process that produced them. Freeing an ecologist andeconomist from their disciplinary constraints proved profitable. Attempts at ecological-economic linkagetypically produce models that require data that may never exist. The research team was able to keep apractical perspective and produce tables as readily available tools that can almost immediately supportplanning efforts. While the tables deserve further testing and review, the tools therein are readily availablein most instances.
Users of the tables will find them complex and somewhat cumbersome to handle. The complexities ofenvironmental systems made this inevitable. Although the tables are logical in their present form, thegeneral structure of the tables begs for formatting in hypertext. This computer technology (which is verycommon to WINDOWS computer users) allows for information retrieval at specified locations in thedocument. Thus, the user, instead of going to an entry in the table and then directed to go elsewhere,would have all these data available in a “point and click” fashion without having to go through severalpages of tables. Information found in the footnotes and Glossary could also be nested in hypertext fashion.
The information that has been compiled as a result of this research effort should not be viewed as thefinal compilation for use by field planners. Instead, the information needs to be treated as part of a "livingdocument," one that can incorporate new information as it is developed. As techniques improve and newoutputs and services are identified, the tables will evolve. One possible addition in the short term could bethe inclusion of the ecological model inventory that is being conducted under the Objectives and Outputswork unit in EEIRP by Waterways Experiment Station. These models could be listed in a column in thetables alongside the appropriate ecological output entry. (These could even be more accessible to the userin hypertext format.) This continued refinement and enhancement should involve review from fieldpersonnel in both the Corps and other agencies involved in environmental planning and evaluation. Interagency support during this process is vital, because it provides the needed validation and improvementof the results from these tables.

116
117
GLOSSARY
Allochthony (allochthonous) transport of material or energy from its site of formation to the site ofconcern.
Basin slope see Slope.
Biodiversity the amount of differentiation away from a state of biological monotony. Maximum diversityoccurs when each element encountered is different from all other elements, and the least diversity occurswhen all elements are identical. Diversity may be expressed in terms of species (and other taxonomicdivisions), habitat, genes, structures, and ecosystems.
Biogeochemistry study of chemical transformations and pathways through biotic and abiotic process inecosystems.
Biological biotic integrity wholeness or completeness of biological elements and functions needed tosustain system processes indefinitely. System size ranges from individual tissues in organisms to the largestof ecosystems--the biosphere. Biosystems with high integrity have all of those elements necessary toperform all functions indefinitely. Sometimes used synonymously with "health" as in ecosystem health.
Braided stream a stream that separates into numerous channels, which often are unstable and shiftlocations.
Capacity the maximum load that can be transported by a current or stream.
Channel a naturally eroded or artificially constructed course for running water, wider and deeper than thestreamflow except during flood.
Channel slope see Slope.
Color pigment in water that absorbs light, usually associated with organic compounds. It is responsiblefor coffee- or tea-colored staining of water in many aquatic habitats, most notably bogs.
Community an aggregation of different species populations in the same space and time frame. It is thecollective-living part of an ecosystem.
Consumers organisms (usually animals) that ingest (eat) foods and secrete enzymes to internal surfaceswhere foods are dissolved and assimilated. They usually develop large body sizes to hold the internal high-surface area needed for digestion and assimilation.
Corridor (habitat connection) connections linking similar habitat patches.
Current the movement of water within a lake or stream along discrete lines of travel.
Decomposers organisms that secrete enzymes to external surfaces where food substrates are digested(dissolved) and then assimilated. They usually have very high ratios of body surface area and volume, andmany are very small (however, the largest organisms on earth are decomposers--soil fungi).
Deposition amount of suspended and dissolved material deposited by physical and chemical processes.

118
Depression storage water or material storage capacity in watershed depressions, including depressionsalready partially filled with water, such as impoundments.
Depth the distance from top to bottom of a water body or an aquifer, often expressed as a mean, or thedepth from the surface to some specified point, such as a water discharge level.
Discharge is the flow rate of water through a cross-sectional area of stream channel, penstock, weir,canal, or other structure.
Dissolved matter in water that will never settle out in its present chemical form and is usually defined asthat matter that passes a 0.45 micron filter.
Ecological (trophic-level) efficiency the energy captured at one trophic level divided by the energycaptured at the next lowest trophic level.
Ecological indicator a physical, chemical or biological index to the integrity of ecological functions in acommunity or ecosystem, such as presence of a unique species, variation of oxygen from atmosphericsaturation, or water level dynamics.
Ecosystem an organized interaction of physical, chemical, and biological processes into predictablemanifestations and arrangements of energy and matter in diverse biological forms (see Evans 1956).
Ecosystem health see Biological integrity.
Ecosystem inputs environmental variables, including human causes, that affect ecosystem processes andusually result in altered ecological outputs from those ecosystems. Plant nutrients are basic ecologicalinputs for most ecosystems.
Ecosystem outputs physical, chemical, and biological responses to natural or human-caused changes inecosystem processes. Outputs usually become inputs for other processes. Input of plant nutrients, forexample, generates plant-growth output, which becomes input for herbivore growth, and so on.
Edge development extent of interface that develops between adjoining habitats. Irregular edges are moredeveloped than regular edges.
Electromagnetic process pertains to radiation and electrons.
Epilimnion the wind-mixed surface stratum of a lake, which is superimposed over a hypolimnion. Vertically well-mixed waters do not form strata (do not stratify).
Erosion amount of substrate material displaced by physical or chemical processes.
Evapotranspiration total water lost through surface evaporation and plant transpiration.
Fetch is the longest distance over which wind operates to mix a water body.
Floodplain the valley bottom adjacent to water bodies, created in part by flood sediments (alluvium) andsubject to further flooding.
Floodplain storage capacity maximum amount of water and/or material that can be stored in afloodplain.

119
Flow velocity is the net rate of current or streamflow in one direction.
Form physical appearance of a channel, watershed, or basin.
Habitat the unique combination of physical, chemical, and biological properties that support a specificassemblage of organisms.
Habitat arrangement alignment and interspersion of different habitats in physical space.
Habitat connections see Corridor.
Hardness equivalent to the amount of calcium and magnesium concentration, which is most responsiblefor reducing soap suds in wash water, and interacts with nutrients and contaminants to modify theirbiological impacts.
Heterotrophy nutrition is derived by decomposers and consumers from organic matter originallyproduced through photosynthesis or chemosynthesis.
Human services the anthropocentric functions performed by ecological outputs.
Hydraulic retention a measure of the volume displacement rate of water from a lake basin through itspoint of discharge.
Impenetrable surface that surface in a watershed that sheds all water at the surface, and no waterinfiltrates to subsurface flows or storage.
Interspersion extent to which all habitats within a specified area come in contact with each other.
Landscape ecology branch of ecology that treats ecosystem interactions at a geographical scale. Load amount of material or energy (thermal load) carried in a lake or river.
Loading rate at which a water body takes on materials, usually expressed per unit area (e.g.,Kg/hectare/year).
Macrophytes large vascular plants and algae in contrast with microscopic algae.
Matrix (habitat) the dominating habitat in a region.
Meander length of a full meander cycle, usually expressed as a mean.
Meander radius deviation of a stream meander from a straight-line path, usually expressed as a mean.
Morphologic processes those processes that shape watershed and floodplain, lake basin and river channeltopography.
Nutrients the elements required for life. Phosphorus, nitrogen, iron, and carbon are among those mostlikely to be in short supply and limit growth in aquatic ecosystems.
Patchiness extent to which habitats of the same kind becomes dispersed into isolated "islands" or patches.
P/B the ratio of production and biomass, usually on an annual basis.

120
pH logarithmic expression of hydrogen ion concentration in which the concentration is highest when thepH is lowest (acid) and the pH of pure water is 7.0.
Population an assemblage of genetically similar organisms, which are geographically distributed so thatmembers have potential for reproductive, genetic, or other interaction.
Primary producers organisms that generate organic matter from inorganic matter through photosynthesis(the vast majority of production) or through chemosynthesis.
Production amount of matter or potential energy generated over some specified time period (productivityis production rate), including that biological matter (biomass) or potential energy that died and wasdecomposed or consumed. Population production is the biomass produced by a population. Communityproduction is the biomass produced by a community.
Reduction-oxidation a measure of the net electrical state in a solution. It contributes importantly tochemical reaction rates and chemical compound solubility in water.
Riparian stream-side habitat usually regulated by floodplain groundwater.
Salinity total concentration of dissolved, ionized inorganic matter in water.
Shear stress the forces exerted on a channel or lake bottom by flow.
Shellfish crustacean or molluscan species differentiated from true vertebrate fishes.
Shoreline irregularity the degree to which terrestrial and aquatic environments are interspersed at theedge of a water body.
Shoreline length the length of the interface between terrestrial and aquatic habitats.
Slope "rise over the run." Basin slope is the mean slope of a watershed (or simply watershed slope) basinor lake basin. Channel slope is the longitudinal gradient along a stream channel.
Storage capacity the volumetric capacity of a basin for water sediment or other storage.
Substrate material underlying the surface environment: usually soil, sediment, wood, plants, or rock.
Substrate development a process of substrate change mostly through ecological succession.
Substrate orientation vertical to horizontal aspect of substrate surfaces.
Surface area the geographical amount of watershed, water body, or other ecosystem measure at itssurface.
Suspended solids the material suspended in the water, usually defined as larger than can pass through a0.45 micron filter.
Tailwater river discharge from a dam.
Thermal load see Load.

121
Total dissolved solids (TDS) total amount of dissolved matter contained in a volume of water andincludes all inorganic ions composing salinity and all other dissolved matter.
Transport the carriage of materials in solution, suspension, and floatation.
Transport capacity the maximum load that can be carried by a given water body under prevailingconditions
Turbulence chaotic flow, moving in all directions and effectively mixing water and materials.
Volume the water or other habitat volume held in a basin or channel.
Watershed the total surface area overlying substrate, acting as a catchment for, and potential delivery of,water to a water body via surface and subsurface flows.
Wave height diameter of wave circulation, indicated by the distance between the trough and the crest of awave cycle.
Wetted perimeter actual bottom surface that comes in contact with water along a flow cross-section.

122
REFERENCES
Adamus, P. R., L. T. Stockwell, E. J. Clairain, Jr., M. E. Morrow, L. P. Rozas, and R. D. Smith. 1991. Wetland evaluation technique (WET) Volume I: Literature review and evaluation rationale. Technical Report WRP-DE-Z. U.S. Army Corps of Engineers. National Technical InformationService. Springfield, VA.
Adamus, P. R., E. J. Clairain, Jr., R. D. Smith, and R. E. Young. 1987. Wetland evaluation technique(WET): Volume II: Methodology. Operational Draft Technical Report 4-87. U.S. Army Corps ofEngineers. Waterways Experiment Station. Vicksburg, MS.
Atlas, R. M. and R. Bartha. 1987. Microbial ecology: Fundamentals and applications. Menlo Park, CA: Benjamin/Cummings Publishing.
Barbier, E. 1994. Valuing Environmental Functions: Tropical Wetlands. Land Economics 70(2): 155-73.
Barel, C. D. N., W. Ligtvoet, T. Goldschmidt, F. Witte, and T. C. Goudswaard. 1991. The haplocrominecichlids in Lake Victoria: An assessment of biological and fishery interests. In M. H. A.Keensleyside, ed., Cichlid fishes behaviour, ecology, and evolution. New York, NY: Chapman andHall.
Barlocher, F. and B. Kindrick. 1975. Assimilation efficiency of Gammarus pseudolimnaeus (Amphipoda)feeding on fungal mycelium or autumn-shed leaves. Oikos 26: 55-59.
Bovee, K. D. 1986. Development and evaluation of habitat suitability criteria for use in instream flowincremental methodology. U.S. Fish Wildlife Service Biological Report 86(7): 235.
Brookshire, D., M. Thayer, W. Schulze, and R. d'Arge. 1982. Valuing public goods: A comparison ofsurvey and hedonic approaches. American Economic Review 72(1): 165-76.
Brylinski, M. 1980. Estimating the productivity of lakes and reservoirs. In E. D. Le Cren and R. H.Lowe-McConnel, eds. The functioning of freshwater ecosystems. New York, NY: CambridgeUniversity Press.
Carpenter, S. R. 1988. Transmission of variance through lake foodwebs. In S. R. Carpenter, ed. Complex interactions in lake communities. New York, NY: Springer.
Carpenter, S. R. and J. F. Kitchell. 1987. The temporal scale of variation in lake productivity. AmericanNaturalist. 129: 417-33.
Carpenter, S. R. and J. F. Kitchell. 1992. Trophic cascade and biomanipulation: interface of research andmanagement--a reply to comment by DeMelo et al. Limnology and Oceanography. 37: 208-13.
Chapman, C. R. 1973. The impact on estuaries and marshes of modifying tributary runoff. In R. H.Chabreck, ed. Coastal marsh and estuary management. Baton Rouge, LA: Louisiana StateUniversity.
Chapra, K. H. and S. C. Reckhow. 1983. Engineering approaches for lake management Volume 1: Dataanalysis and empirical modeling. Boston, MA: Butterworth.

123
Cole, G. A. 1994. Textbook of limnology. 4th ed. St. Louis, MO: C.V. Mosby.
Cole, R. A., T. J. Ward, and S. B. Bolin. 1990. Estimating the intermittent runoff concentration andloading of allochthonous organic matter for New Mexico reservoirs. Lake and ReservoirManagement. 6: 187-96.
Cole, R. A., F. A. Ward, T. J. Ward, and R. M. Wilson. 1990. Development of an interdisciplinary modelfor water and fishery management. Water Resources Bulletin. 26(4): 597-609.
Cole, R. A., T. J. Ward, F. A. Ward, R. A. Deitner, R. W. Rodden, S. M. Bolton, and K. A. Green-Hammond. 1995. RIOFISH: a statewide comprehensive management system model for New Mexicosportfisheries. Technical Completion Report 291. New Mexico Water Resources Research Institute. New Mexico State University. Las Cruces. (Math appendix).
DeMelo, R., R. France, and D. J. McQueen. 1992. Biomanipulation: hit or myth? Limnology andOceanography. 37: 192-207.
Dubinsky, Z. and T. Berman. 1981. Light utilization by phytoplankton in Lake Kinneret (Israel). Limnology and Oceanography. 26: 620-60.
Evans, F. C. 1956. Ecosystems as the basic unit in ecology. Science. 123: 1127-28.
Feather, T. D. and D. T. Capan. 1995. Compilation and review of completed restoration and mitigationstudies in developing and evaluation framework for environmental resources. IWR Report 95-R-4. U.S.Army Corps of Engineers. National Technical Information Service. Springfield, VA.
Feather, T. D., C. S. Russell, K. W. Harrington, and D. T. Capan. 1995. Review of monetary andnonmonetary valuation of environmental investments. IWR Report 95-R-2. U.S. Army Corps ofEngineers. National Technical Information Service. Springfield, VA.
Forman, R. T. T. and M. Godron. 1986. Landscape ecology. New York, NY: Wiley.
Grant, W. E. 1986. Systems analysis and simulation in wildlife and fisheries sciences. New York, NY: Wiley.
Gosselink, J. G., L. C. Lee, and Ta. A. Muir. 1990. Ecological processes and cumulativeimpacts:illustrated by bottomland hardwood wetland ecosystems. Chelsea, MI: Lewis Publishers.
Harris, L. D. 1984. The fragmented forest. In Island biogeography: Theory and the preservation of bioticdiversity. Chicago, IL: University of Chicago Press.
Holling, C. S. 1973. Resilience and stability of ecological systems. Annual Review of Ecology andSystematics. 4: 1-24.
Jones, C. G. and J. H. Lawton (eds.), 1995. Linking species and ecosystems. New York, NY: Chapmanand Hall.
Jones, W. W. 1986. The role of biomanipulation in fisheries management. Lake and ReservoirsManagement. 2: 48-53.

124
Jorgensen, S., ed. 1983. Application of ecological modeling in environmental management. New York,NY: Elsevier.
Karr, J. R. 1991. Biological Integrity: A long-neglected aspect of water resource management. EcologicalApplications. 1: 66-84.
King, A. W. 1993. Considerations of scale and hierarchy, In S. Woodly, J. Kay, and G. Francis, eds. Ecological integrity and the management of ecosystems. New York, NY: St Lucie Press.
Kitchell, J. F., J. F. Koonce, R. V. O'Neill, and H. H. Shugart, Jr. 1978. Model of fish biomass dynamics. Transactions of the American Fishieries Society. 108: 786-98.
Kozlovsky, D. G. 1968. A critical evaluation of the trophic-level concept. I. Ecological efficiencies. Ecology. 49: 48-60.
Lindeman, R. L. 1942. The trophic-dynamic aspect of ecology. Ecology. 23: 399-417.
Loomis, J., T. Wegge, M. Hanemann, and B. Kanninen. 1990. The economic value of water to wildlifeand fisheries in the San Joaquin Valley: Results of a simulated voter referendum. Transactions of55th North American Wildlife and Natural Resources Conference. Washington, DC: WildlifeManagement Institute.
MacArthur, R. H. and E. O. Wilson. 1967. The theory of island biogeography. Princeton, NJ: PrincetonUniversity Press.
Mann, K. H. 1988. Production and use of detritus in various freshwater, esturine, and coastal marineecosystems. Limnology and Oceanography. 33: 910-30.
McDiffert, W. F. 1970. The transformation of energy by a stream detritivore Pternarcys scotti(Plecoptera). Ecology. 51: 975-88.
McIntire, C. D. and J. A. Cole. 1978. A hierarchical model of lotic ecosystems. Ecological Monographs. 48: 167-90.
McQueen, D. J., J. R. Post, and E. L. Mills. 1986. Trophic relationships in freshwater pelagic ecosystems. Canadian Journal of Fishery and Aquatic Sciences. 43: 1571-81.
McQueen, D. J. 1990. Manipulating lake community structure: Where do we go from here? FreshwaterBiology. 23: 613-20.
Meffe, G. K. and C. R. Carroll. 1994. Principles of conservation biology. Sunderland, MA: SinauerAssociates.
Minshall, G. W. Autotrophy in stream ecosystems. Bioscience. 28: 767-71.
Mitchell, R. and R. Carson. 1989. Using surveys to value public goods: The contingent valuationmethod. Washington, DC: Resources for the Future.
Mitsch, W. J. and J. G. Gosselink. 1986. Wetlands. New York, NY: Van Nostrand Reinhold.

125
Morgan, J. P. 1973. Impact of subsidence and erosion on Louisiana coastal marshes and estuaries. In R.H. Chabreck, ed. Coastal marsh and estuary management. Baton Rouge, LA: Louisiana StateUniversity.
Morgan, N. C., T. Backiel, G. Bretschko, A. Duncan, A. Hillbricht, Ilkowska, Z. Kajak, J.F. Kitchell, P.Larsson, C. Levenque, A. Nauwerck, F. Schiemer, and J.E. Tharpe. 1980. Secondary production. InE. D. Le Cren and R. H. Lowe-McConnell, eds. The functioning of freshwater ecosystems. NewYork, NY: Cambridge University Press.
Oglesby, R. T. 1977. Relationship of fish yield to lake phytoplankton standing crop, production, andmorphoedaphic factors. Journal of Fishery Research Board of Canada. 34: 2271-79.
Naveh, Z. and A. S. Lieberman. 1990. Landscape ecology: Theory and application. New York, NY: Springer-Verlag.
Noss, R. F. and A. Y. Cooperrider. 1994. Saving nature's legacy: Protecting and restoring biodiversity. Washington, DC: Island Press.
Odum, E. P. 1971. Fundamentals of ecology, second edition. Philadelphia, PA: Saunders.
Odum, H. T. 1957. Trophic structure and productivity of Silver Springs, Florida. EcologicalMonographs. 27: 55-112.
Odum, H. T. 1983. Systems ecology: An introduction. New York, NY: Wiley.
O'Neill, R. V., D. L. De Angelis, J. B. Waide, and T. F. H. Allen. 1986. A hierarchial concept ofecosystems. Princeton, NJ: Princeton Univeristy Press.
Paine, R. T. 1966. Foodweb complexity and species diversity. American Naturalist. 100: 65-75.
Peters, H. R. 1983. The ecological implications of body size. New York, NY: Cambridge UniversityPress.
Pethic, J. 1984. An introduction to coastal geomorphology. Baltimore, MD: Edward Arnold.
Primack, R. B. 1993. Essentials of conservation biology. Sutherland, MS: Sinauer Associates, Inc.
Regier, H. A. 1993. The notion of natural and cultural integrity. In S. Woodley, J. Kay, and G. Francis,eds. Ecological integrity and the management of ecosystems. New York, NY: St. Lucie Press.
Regier, H. A. and W. L. Hartman. 1973. Lake Erie's fish community: 150 years of cultural stress. Science. 180: 1248-55.
Ricklefs, R. E. 1979. Ecology, second edition. New York, NY: Chiron Press.
Russell, C. S., V. Klein, and J. Homan. 1992. First steps in the development of a method for evaluatingenvironmental restoration projects. IWR Report 92-12-9. U.S. Army Corps of Engineers. NationalTechnical Information Service. Springfield, VA.
Ryder, R. A. 1990. Ecosystem health, a human perception: Definition, detection and the dichotomouskey. Journal of Great Lakes Research. 16: 619-24.

126
Schroeder, R. L., L. D. O'Neil, and T. M. Pullen. 1993. A wildlife community habitat evaluation modelfor bottomland hardwood forests in the southeastern U. S. U.S. Army Corps of Engineers. Waterways Experiment Station. Vicksburg, MS.
Shaeffer, D, J. E. Herricks, and H. Kerster. 1988. Ecosystem health: I. Measuring ecosystem health. Environmental Management. 12: 445-55.
Shamberger, N., A. H. Farmer, and J. W. Terrell. 1982. Habitat suitability index models: Introduction. FWS/OBS-82. U. S. Fish and Wildlife Service. USDI. Washington, DC.
Simberloff, D. S. and E. O. Wilson. 1969. Experimental zoogeography of islands. The colonization ofempty islands. Ecology. 50: 278-95.
Starfield, A. M. and A. L. Bleloch. 1986. Building models for conservation and wildlife management. New York, NY: MacMillan Publishing Company.
Teale, J. M. 1962. Energy flow in the salt-marsh ecosystem of Georgia. Ecology. 43: 614-24.
Turner, M. G. and R. H. Gardner, eds. 1991. Quantitative methods in landscape ecology. New York,NY: Springer-verlag.
U.S. Fish and Wildlife Service. 1980. Habitat evaluation procedure (HEP). ESM102. EcologicalServices. U.S. Fish and Wildlife Service. USDI. Washington, DC.
U.S. Fish and Wildlife Service. 1981. Standards for the development of habitat suitability index models. ESM103. Ecological Services. U.S. Fish and Wildlife Service. USDI. Washington DC.
U.S. Fish and Wildlife Service. 1986. North American waterfowl management plan: A strategy forcooperation. USDI. Washington, DC.
U.S. Water Resources Council. 1983. Economic and environmental principles for water and related landresources implementation studies. Washington, DC: U.S. Government Printing Office.
Vannote, R. L., G. W. Minshall, K. W. Cummins, J. R. Sedell, and C. E. Cushing. 1989. The rivercontinuum concept. Canadian Journal of Fishieries and Aquatic Sciences. 37: 130-37.
Vincent, M., D. Moser, and W. Hansen. 1986. National economic development procedures manual: Recreation use and benefit estimation techniques. IWR Report 86-R-4. Institute for WaterResources.
Walker, B. H. 1992. Biodiversity and ecological redundance. Conservation Biology. 6: 18-23.
Ward, J. V. and J. A. Stanford. 1979. Ecological factors controlling stream zoobenthos with emphasis onthermal modification of regulated streams. In J. V. Ward and J. A. Stanford, eds. The ecology ofregulated streams. New York, NY: Plenum Press.
Webster, J. R., E. F. Benfield, and J. Cairns, Jr. 1979. Model predictions of effects of impoundment onparticulate organic matter transport in a river system. In J. V. Ward and J. A. Stanford, eds. Theecology of regulated streams. New York, NY: Plenum Press.
Wetzel, R. G. 1983. Limnology. New York, NY: Saunders College Publishing.

127
Whittaker, R. H. 1975. Communities and ecosystems, second edition. New York, NY: MacmillanPublishing Company.
Wilson, E. O. 1992. The diversity of life. Cambridge, MA: Belknap Press.

128
APPENDIX
ECOSYSTEM PROCESSESUNDERLYING ECOLOGICAL OUTPUTS

129

130
UNDERLYING ECOLOGICAL OUTPUTS
This report has, to this point, presented basic information regarding the development and use ofinterdisciplinary tables for environmental restoration planning efforts. This appendix provides an in-depthexamination of the ecological processes that affect ecosystems. It is intended to enhance understanding ofthe interactions that occur in the ecological outputs included in Tables III-7 through III-12.
ECOSYSTEM ENERGETICS AND MATERIAL FLOW
Energy Transformation and Biological Production
An extensive theoretical basis for gauging ecosystem integrity has developed over the last half-centurystarting with Lindeman's (1942) seminal work on energy and material flow through ecosystems. It isfounded in the conceptual understanding of energy and material resource partitioning among diversepopulations. An ultimate aim is understanding how energy is captured and directed through ecologicalprocesses into diverse biological outputs, such as production and biomass of individual speciespopulations. The principles of ecosystem energetics and material transformation can help clarifyconnections among resource management decisions, physical-chemical inputs, ecological outputs, andbenefit outcomes. Discussion of this theory illustrates why certain physical, chemical, and biologicalproperties are among the more inclusive indices of ecological conditions indicating ecosystem integrity. Some basic discussions are presented in Odum (1971, 1983), Whittaker (1975), and Ricklefs (1979). More advanced discussions are presented by O'Neill et al. (1986) and King (1993).
Within ecosystems, material inputs are derived from watershed, airshed, and migratory processes(Figure A-1). Energy is transformed from solar and geochemical sources primarily by photosynthesis(chemosynthesis is relatively rare in most systems). Consumer and decomposers derive their energyheterotrophically from the assimilation of food materials initially created by photosynthesis orchemosynthesis in the first trophic level. This energy transformation is the basis of so called energypyramids in which energy content is greatest in solar and geochemical sources and diminishes withtransformation in each successive trophic level (Figure A-1).
Trophic Levels
Energy transmission through ecosystems is substantially less than 100 percent efficient in preservingbiological production at each transformation level in the food web. The number

FIGURE A-1ENERGY AND MATERIAL FLOW PATHWAYS BY WHICH KINETIC AND POTENTIAL ENERGY ORIGINATES AND IS1
TRANSPORTED, TRANSFORMED, AND PARTITIONED AMONG LIFE FORMS BEFORE IT LEAVES THE ECOSYSTEM2
1. Symbols are as in Figure II-1. N=nutrient, L=light, T=temperature, F=flushing rate, SS=suspended solids, O=oxygen, b=bottom substrate, S=salinity, and Sp=species. All variables are exemplaryonly.
2. Resource partitioning occurs among trophic levels and within trophic levels, depending on factors that regulate efficiencies at each trophic level and at each guild and species within each trophiclevel.

132
of energy transformations preceding the one occurring as an organism eats, places that feeding action in aspecific trophic level. Thus an omnivore eating plants falls in the second trophic level (herbivore level) atthat instant, but falls into the third level when it eats an herbivore. Many species participate in more thanone trophic level, depending on adaptational range, life stage, time of year, and opportunity. An accuratedetermination of the annual mean trophic-level position for an omnivore can be an intermediate value, suchas 2.3. The sum of all energy transformations within a trophic level is used to determine the trophic-levelefficiency.
As energy cascades though trophic levels, a portion is sequestered in biochemical energy withpotential for kinetic expression. The energy is captured with carbon-based compounds in which carbon,hydrogen, and oxygen form the bulk of the biomass formed. Carbon is the most common measure used torepresent ecosystem material flow. In the process, however, many other required and nonrequiredelements are sequestered, including scarce nutrients and toxic materials. For special applications, materialflow is measured with a limiting nutrient or a toxic element. Examples of research defining this process inaquatic environments include Lindeman (1942), Odum (1957), and Teale (1962).
The biomass developed from radiant and chemical energy provides potential for sequesteringvarious materials in a harmless and beneficial state or mobilizing them into pathways leading to harmfulimpacts. The capacity for material storage extends beyond life processes to physical uptake by leaf litter,humus, and derivative clays. Understanding of mechanisms that determine storage and release is useful formanaging the concentration of both desirable and undesirable materials. Whereas much storage istemporary and a part of ecosystem processes, permanent storage is a sink for materials.
A common measure of a consumer trophic-level efficiency is its net production divided by the netproduction of the supporting trophic level (e.g., herbivore production/primary production). Past ecologicaltheory proposed that consumer trophic-level efficiency averaged about 10 percent as energy passedthrough successive consumer levels from primary producers (i.e., herbivores, carnivores, and topcarnivores). Many studies over the decades indicate that this trophic-level efficiency varies widely amongecosystems and possibly among trophic levels. It most usually varies between 5 and 15 percent. Some ofthis variation undoubtedly is due to sampling error. Some is likely, however, because of differentialenvironmental resistances to energy flow through consumer communities. Because food webs eventuallyrun out of the energy needed to sustain an identifiable trophic level, food-chain length varies amongenvironments with different energy inputs and environmental resistances to energy flow. Kozlovsky (1968)thoroughly discusses ecological efficiencies and problems encountered in attempts to identify trends. Trophic-level efficiency is one measure of the ecological efficiency with which natural communitiestransform solar energy into community production of consumer trophic levels.

133
Trophic-Process Indicators of Environmental Stress
The consequences of variation in outputs regarding trophic efficiency can be profound forpredicting the production and abundance of many functionally similar groups (guilds) or predictingindividual species populations, especially in the carnivore trophic levels (Table A-1). The degree ofvariation developed within trophic levels as average trophic-level efficiency changes is magnified withincreasing trophic level. Whereas herbivores, using 1,000 g C/M /year of primary production, evidence a2
3x variation among the examples of 5 percent and 15 percent efficiency in Table A-1, third-level carnivoresevidence about 25x variation. Uppermost levels are more sensitive indicators of changes in trophic-leveldynamics as a consequence of environmental change. Therefore top carnivores make sensitive indicatorsof loss in ecosystem integrity, especially if species richness is judged to be an important ecological output. Their welfare depends on underlying efficiency of trophic interactions within the ecosystem as well as theinteraction with other species. Top carnivores are frequently among the first species to disappear as anecosystem loses integrity under stress. Simple models of single-species response to habitat change aremore likely to go awry for carnivores than for species lower in the food web because of the numerousfood-web factors involved in addition to habitat attributes.
TABLE A-1HYPOTHETICAL LEVELS OF PRODUCTION (g C/M /year) IN EACH TROPHIC2
LEVEL, ASSUMING DIFFERENT CONSUMER TROPHIC-LEVEL EFFICIENCIES ANDPHOTOSYNTHETIC EFFICIENCIES
Trophic-Level Efficiencies
Trophic Level 0.5% 5% 10% 15% 15% Variable %1
Primary producer 1,000 1,000 1,000 1,000 10 1,000
Herbivore 5 50 100 150 1.5 100
1 Carnivore 0.25 5 10 22.5 0.23 5o
2 Carnivore 0.02 0.25 1 3.38 0.03 0.75o
3 Carnivore 0.00 0.02 0.1 0.51 0.00 0.08o
1. Herbivore efficiency is 10%.1E Carnivore efficiency is 5%.2E Carnivore efficiency is 15%.3E Carnivore efficiency is 10%.

134
Mean size of consumer species also increases with increased trophic level because of the advantagesize lends in most predator-prey interactions. Humans, of course, are relatively large omnivores with asignificant portion of their consumption in carnivore categories. They tend to choose large prey, andperhaps not coincidentally, they tend to value large consumer organisms more highly than small ones. Asomewhat simplistic popular emphasis on protecting large endangered consumer species is apparent in thefacetious assignment by some to a new taxonomic category, "charismatic megafauna." The average size ofspecies targeted for consideration in judging habitat suitability is larger than the average consumer. Theirposition in the food web, at least at certain life stages, also is higher than the average trophic position. Thisimplies that for many targeted species, habitat models using physical-chemical measures often are lessreliable than they may be for the smaller organisms, which in general occupy lower positions in the foodweb. There are, of course, numerous exceptions to the general rule.
Dramatically stressed ecosystems provide the best evidence that food-chain length varies with stressand that consumer efficiency varies significantly from 10 percent, depending on rate-regulation processes. Low consumer efficiencies are commonly encountered in aquatic environments that experience low oxygenconcentrations. Only anaerobic decomposers can function significantly in situations such as deoxygenatedhypolimnia or poorly mixed rivers and bays receiving organic wastes with high biological oxygen demand. In such circumstances consumer efficiencies approach zero as long as oxygen remains too low forconsumers to function. To exemplify such extremes in Table A-1, where consumer efficiency was droppedto 0.5 percent, virtually all carnivore production ceased. Other examples of stressful environments includethose with harmful toxicity levels, extremely hot environments, and extremely saline environments.
What may be stressful for one trophic level may not be stressful for another. Toxic materials areoften specific for consumers and primary producers, for example. Even though primary producers cannotfunction in prolonged darkness, many consumers do well, and consumer efficiency is much less limited byprolonged darkness than by anoxia. Hot springs can have high primary production and low consumertrophic-level efficiency because of different primary producer and consumer tolerances to hightemperature. The mixed reactions of ecosystem component species and guilds to stress complicate energypathway predictions and exemplify a limitation inherent in simple indices.
Grazing and Detritus-Based Foodwebs
In most sampled environments, the efficiency of primary production is less than that of consumertrophic levels. High seasonal or annual primary production values are about 2 percent of the total visiblesolar energy reaching an aquatic community (e.g., Brylinski 1980). These high-efficiency conditionstypically occur in habitats with continuous and plentiful nutrient supply, low concentrations of inorganicsuspended matter, low light-extinction rates (other than caused by primary producers, low inorganicsuspended solids, warm (25E-30E C) temperatures, low flushing rates, absence of toxic materials, and,especially in shallow streams and shore zones, stable bottom substrates. A physiological maximumphotosynthetic efficiency may approach 10 percent or more for short periods in natural environments(Dubinsky and Berman 1981). Primary production efficiency is critical because it establishes the basis forconsumer production. When, as in Table A-1, the efficiency of primary production is low, even a highconsumer efficiency may not be enough to sustain food-chain length. There are many examples of positiverelationships between primary production and consumer production (Morgan et al. 1980; Oglesby 1977).
In situ primary production is not, however, the only source of organic matter available forconsumers in most ecosystems. Two major consumer food-chain divisions are recognized: (1) the grazingchain based on herbivorous consumption of living and recently dead primary producers and (2) the detritus

135
chain based on partially decomposed, dead primary producers. One of the major advances inunderstanding ecological energetics and processes was recognition of the role of allochthonous (fromoutside sources) detrital organic matter and decomposition in supporting consumer production andabundance. As shown in Figure A-1, watersheds are a source of allochthonous organic matter, both fromnearby riparian sources and from diffuse watershed sources (Cole et al. 1990; Webster et al. 1979; Vannoteet al. 1989). This allochthonous load contributes to the total pool of potential energy available toheterotrophic organisms, including specialized consumers.
Stress Factors Limiting Ecological Efficiency
Detritivores face a limiting condition not shared with herbivores: nitrogen and other nutrients arerapidly leached from dead organic matter. This makes detritus, before it is colonized by decomposers, richin calories but nutritionally poor and inefficiently transformed into detritivore tissue. Colonization ofdetritus by bacteria and fungi increases detritivore efficiency because decomposers add nitrogen from thewater to the detritus via their own protein content. Thus decomposers serve a dual role with respect toconsumer populations, first as competitors for organic resources and second as nutritional sources thatgreatly augment the importance of detritivore food chains in many ecosystems (McDiffert 1970; Minshall1980, Teale 1962; Mann 1988; Wetzel 1983). Although detritivore efficiency may approach that ofherbivores, a significant part of the energy must go to maintenance of bacterial and fungal production.
The diversity and form of organic matter is important in determining efficiency. Large, woody, andacidic organic matter is more resistant to decomposition than small, nonwoody, and pH-neutral organicmatter. Therefore, basic ecological outcomes of potential interest for predicting production amounts,levels, and species composition are related to the amount of acidic, woody material, usually fromallochthonous sources. Ecosystems rich in such allochthonous organic matter and poor in calcariousalkaline compounds usually form acidic black-water rivers, swamps, or bogs as refractory dissolvedorganic matter accumulates (Wetzel 198; Cole 1994).
A relationship exists between the protein content in food and the efficiency with which trophiclevels assimilate the food. Consumer assimilation efficiencies tend to be lowest for detritus not yetcolonized by decomposers, higher for colonized detritus, higher still for fresh plant and algae, high foranimal foods with extensive organic exoskeleton development, and highest of all for animal foods withoutsuch exoskeleton development. Generally speaking, top carnivores have the highest assimilationefficiencies, which decrease as trophic levels approach the primary producer level. However, metabolicmaintenance costs also tend to increase with increased trophic level, partly because predators tend to bemore active than prey (Kozlovsky 1968).
A maximum possible consumer trophic-level efficiency (measured in terms of net production) canbe estimated from knowledge of consumption, assimilation, and respiration efficiency. In ecosystemswhere consumers manage to eat all food efficiently with none left over for decomposers, the trophic-levelefficiency is A(1-R), where A is fraction of consumed food assimilated and R is the fractional amount ofthe assimilated food that goes to respiration. For top carnivores with efficiencies of 80 percent forassimilation and 60 percent for respiration, the maximum trophic-level efficiency is about 32 percent. Themaximum appears to be similar but perhaps different for other trophic levels because assimilationefficiencies may change more with trophic level than will respiration efficiencies. Of course where detrituschains are important in ecosystems, the maximum consumer efficiency is likely to be lower becausedecomposers get a maintenance fraction. The relationship between decomposers and consumers remainsan area of active ecological research in pursuit of improved understanding of trophic interactions.

136
A variety of factors act to reduce or constrain development of the theoretical maximum consumerefficiency in ecosystems by:
(1) Diverting more energy into respiratory maintenance
(2) Diverting potential energy resources into storage (e.g., bottom sediments)
(3) Exporting potential energy before it can be consumed or decomposed (e.g., estuary flushingto offshore waters)
Among those constraining factors several stand out, including temperature, flushing rates, inorganicsediments, oxygen concentration, substrate stability, light transmission, and nutritional quality. These aresymbolized as augmentation variables (in circles in Figure A-1), which drive energy transformation. Theyalso contribute to determining resource partitioning among species.
A major factor is water availability. In terrestrial ecosystems, availability of water usually is the keyfactor determining productivity and community composition. In those transitional environments betweenfully aquatic and fully terrestrial states, water-level fluctuation predominates among factors determiningcommunity composition and productivity.
Temperature affects most ecological rates of importance, including photosynthesis, consumptionrate, assimilation rate, and respiration rate. Endothermy (internal body heat regulation) is less energyefficient than ectothermy (externally regulated body heat). Endotherms are less externally regulated byenvironmental temperature but are not independent of it. Ecosystems dominated by endotherms may beless efficient overall in generating biomass and diversity because they are less energy efficient than systemsdominated by ectotherms. However, a disproportionate number of high-profile species are endotherms.
Flushing rates are determined by the relative discharge and volume relations of a water body. Smallstreams have very high flushing rates of organic matter compared with most larger water bodies. Flushingrate is affected by substrate structure and morphology that decreases velocity in the reach wheresedimentation occurs. The ratio of low-velocity pools and high-velocity riffles is an index to thisphenomenon. Flushing rates are remarkably high in many coastal environments where important retentionmechanisms for organic matter are sessile filter- feeders such as barnacles and mussels. Tidal periodicitygreatly modifies net flushing and makes the definition of ecosystem boundaries more difficult than whereflushing rates are low.
Inorganic sediments are important either in suspended or deposited form. Large quantities ofsuspended or deposited sediment dilutes the concentration of organic matter and decreases consumptionefficiencies for numerous organisms. As sediment increases, it reduces oxygen and other material transportinto sediments, reduces light transmission, and increases abrasion wherever currents occur.
Oxygen in at least some minimal quantity is required for efficient metabolism by all consumers,some being much more tolerant of oxygen depression than others. Whereas oxygen rarely limits consumerproduction and diversity in terrestrial environments, it is scarcer in aquatic environments and often isreduced enough to be the most critical limiting factor in aquatic systems where insufficient reaeration bymixing occurs to compensate for high biological and chemical oxygen demand. Oxygen and other gassupersaturation can be intolerable as well (e.g., salmonid gas narcosis below deep-injection penstocks). Water depth creates pressure, which limits distribution of vascular plants and other organisms. Velocityand turbulence displace organisms, resist movement and relocation, and, with suspended solids, abradetissue.

137
Other habitat factors have less diverse impacts. Substrate stability and penetrability are importantfor providing dependable support to many primary producers and consumers. Light transmission isimportant not only for photosynthetic production but for the control of rates of sight-based consumption. The appropriate proportion of nutrient in the appropriate form is important for determining caloricconsumption efficiency for all trophic levels.
Other factors may be locally important. Toxic materials are among the more critical. Becausetoxins rarely have equal impact on all community members, they create pathway shifts and differentefficiency changes among the trophic levels.
The morphology, or topography, of watersheds, lake basins, and stream channels indirectlyinfluences the intensity and distribution of regulatory factors. Slope, or gradient, interacting with gravitydetermines rates of water movement, turbulence, and erosivity. Watershed, lake basin, and chemicalshapes determine how much water values will be contained at what surface area and depth (above andbelow ground level). Morphological variables influence temperature, oxygen, light, velocity, turbulence,concentrations of toxic and nutrient materials, substrate penetrability and stability, and most other factorsregulating the trophic-level efficiency and resource partitioning among species.
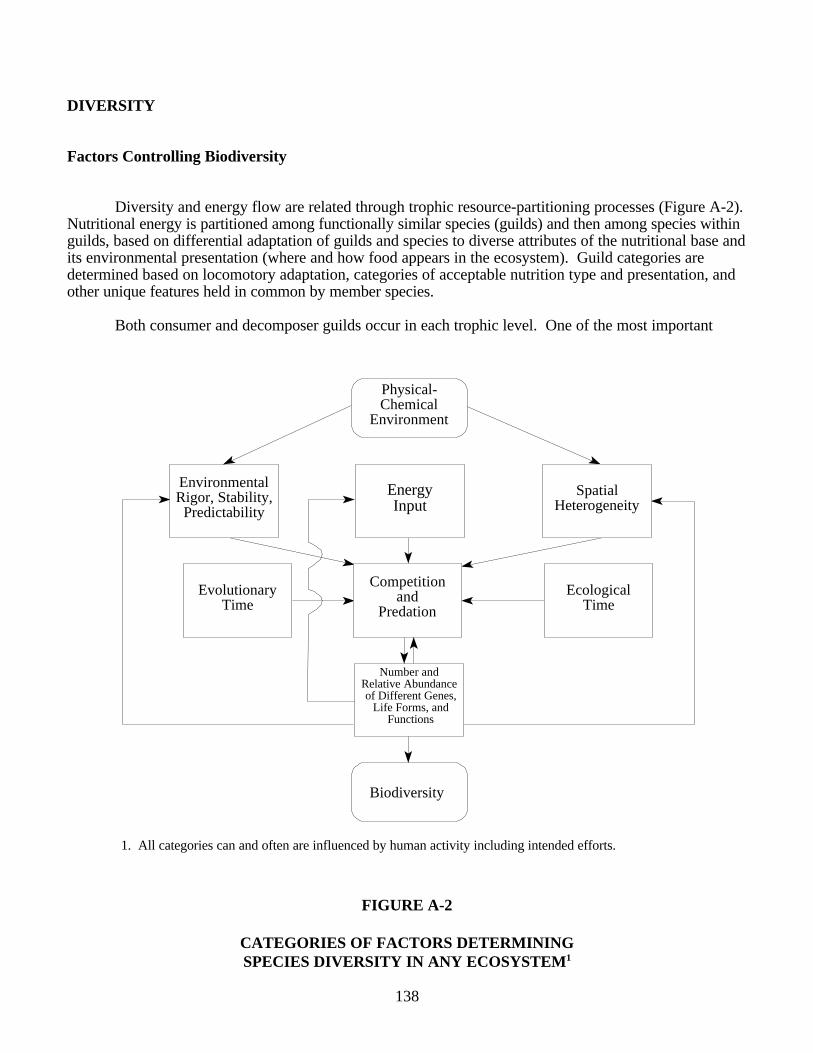
EnvironmentalRigor, Stability,
Predictability
EnergyInput
SpatialHeterogeneity
EvolutionaryTime
Competitionand
Predation
EcologicalTime
Number andRelative Abundance of Different Genes,
Life Forms, and Functions
Biodiversity
Physical-Chemical
Environment
1. All categories can and often are influenced by human activity including intended efforts.
138
FIGURE A-2
CATEGORIES OF FACTORS DETERMININGSPECIES DIVERSITY IN ANY ECOSYSTEM1
DIVERSITY
Factors Controlling Biodiversity
Diversity and energy flow are related through trophic resource-partitioning processes (Figure A-2). Nutritional energy is partitioned among functionally similar species (guilds) and then among species withinguilds, based on differential adaptation of guilds and species to diverse attributes of the nutritional base andits environmental presentation (where and how food appears in the ecosystem). Guild categories aredetermined based on locomotory adaptation, categories of acceptable nutrition type and presentation, andother unique features held in common by member species.
Both consumer and decomposer guilds occur in each trophic level. One of the most important

139
partitions in energy pathways occurs between consumers and decomposers because decomposers are rarelytargeted as species of direct interest to humans, even though they are ecologically indispensable. Althoughdecomposers frequently are treated as a single guild, they are sometimes split into bacteria and fungi orinto obligate anaerobes, facultative anaerobes-aerobes, and obligate aerobes, based on their tolerance tooxygen and related conditions (Atlas and Bartha 1987).
Diversity is determined by many interacting variables, which are categorically represented in FigureII-4. Initially all environmental attributes stem from the physical-chemical environment from whichbiological process derives. This physical-chemical environment supplies raw energy, spatial variation(spatial heterogeneity), and environmental variation that supports and constrains biological diversification. The primary biological force acting to determine biodiversity is competition among life forms for limitingresources and predation on life forms in lower trophic levels. The biological engine for change is geneticmutation and recombination. Evolutionary process requires time. Newly formed ecosystems with uniqueattributes require evolutionary time to diversify. Some general references about biodiversity and relatedconcepts include Paine (1966), Poulson and Culver (1969), Wilson (1992), Walker (1992), Jones andLawton (1995), and Noss and Cooperrider (1994).
Many new environments, however, are similar to existing ecosystems, which can serve as a sourcefor colonizing forms. Depending on intervening conditions between similar habitats and the adaptation ofpotentially colonizing forms, ecological time is required for the colonization process to take place. Disturbed environments are denied the ecological time required for colonization, often despite closeproximity of similar ecosystems. Thus frequently disturbed environments usually are less diverse than moreconstant and otherwise similar ecosystems.
The process by which disturbed environments become recolonized and ecosystems evolve changedfunctions is linked with the concept of succession, especially in terrestrial ecology. As plants colonizesites, to form marsh or swamps, for example, the community undergoes biotic and abiotic transition. Species composition, structural dimension, and biodiversity change and generate abiotic changes insediments, soils, water amounts, shade, nutrient availability, currents and other factors that determinehabitat suitability. As succession proceeds, many feedback interactions occur to inhibit some populationswhile others flourish. Many animal and plant species are most abundant at one stage of succession,indicating that the success of some species depends on all critical stages of succession being availablewithin the range of individual organisms. Terrestrial succession adjacent to water ultimately results infilling those aquatic systems with low hydraulic energies and water exchange rates, such as many wetlands.
The extent that diversity occurs within ecosystems depends on energy flow rate. Where energyflow rates are very low, regardless of habitat optimality otherwise, only so much diversification of tissue ispossible because of limited nutrition. Cave communities provide a good example of such nutrition-limitedsystems, typified by low diversity and community production dependent on small quantities ofallochthonous organics (Paulson and Culver 1969). Food-chain length and diversity within each trophiclevel is reduced as source energy diminishes. This energetics limitation also may contribute to observeddecrease of species richness as one moves from equatorial environments to polar environments. Otherfactors, however, are locally more important than source energy availability in determining diversity withinecosystems.
The spatial heterogeneity determines distance and connectivity between ecosystems. Landscapefeatures play an important role in determining ultimate diversity and form of the inhabiting community of anew site. New ecosystems, such as created with water impoundment, initially have low diversity, whichincreases with impoundment age as invading species successfully colonize the new site (MacArthur andWilson 1967; Simberloff and Wilson 1969). The species invasion rate and subsequent diversificationdepends on the suitability of intermediate environments consisting of emigration routes from similar

140
ecosystems. Intervening environments can be effective barriers to species colonization of new sites, butmost environments are penetrable, given enough time. Depending on management foresight, connectingcorridors and barriers can be created to encourage a specified diversity. Many floodplain systems areperturbed by floods, for example, and their diversity depends on flood severity, connections to similarsystems, and the time that has passed since the last flood event.
The principles of emigration, invasion, colonization, habitat patchiness. and local extinction arereasonably well developed in island biogeography (MacArthur and Wilson 1967), landscape ecology(Forman and Godron 1986; Harris 1984; Naveh and Lieberman 1990), and evolutionary ecology (Meffeand Carroll 1994; Primack 1993), although they have yet to be extensively applied. Where similarecosystems are densely represented in the landscape and are interconnected by similar habitat conditions, anew site can be rapidly colonized by most species. Where density and connectedness are extremely low,however, complete colonization by all potential community members may never occur. The size and linearextent of a new site also are important, because increased dimension is more likely to intercept emigrantsfrom other ecosystems. Of course, humans have substantial ability to influence colonization anddiversification process through accidental and intended introduction.
Colonization rate and organism size are correlated because small organisms are wind transported orotherwise transported more readily than large organisms. Top carnivores tend to arrive last on the scene. Because of predator-prey interactions, major changes in communities can occur when carnivores arrive,especially for old and highly isolated locations. This was most dramatically demonstrated in Lake Victoria,Africa, when Nile perch were introduced to a million-year-old lake community and eliminated much of theendemic diversity because this predator had not evolved with the prey species (Barel et al. 1991).
Spatial heterogeneity operates both among and within ecosystems. Those ecosystems composed ofdiverse habitats are likely to carry more species than ecosystems composed of one habitat type. Differenthabitat types support different guilds because of the different locomotion and nutritional possibilitiesprovided by each habitat. Some habitats are physically more diverse than others (marsh verses mudflat)and may be expected to support a greater diversity of adaptations as a consequence.
Organism size, activity, and position among trophic levels, all of which are correlated, also arecorrelated with the size and spatial diversity of the targeted ecosystem. Whereas small organismsfrequently complete their life cycle within one habitat type, larger organisms frequently require severalhabitat types to complete their life cycles. Most evident usually are differences between nursery habitatsand those habitats routinely used by foraging adults. The juxtaposition, interspersion, and connectednessof such habitats are critical for determining ecosystem optimality for many of the largest organisms in theecosystem. These large species typically are carnivorous at some point in their lives and frequently areamong species targeted in environmental protection, mitigation, and enhancement programs. Mostsportfish and waterfowl are examples. The newly emerging principles of landscape ecology are especiallyapplicable to projects designed to increase species abundance with diverse habitat needs (Harris 1984).
Environmental rigor, stability, and predictability also regulate diversity, which tends to decrease asphysical-chemical factors vary from the conditions under which life evolved. Thus life functions are mostdiverse where and when temperatures remain about 25E to 30E C. For consumers, diversity decreases asoxygen varies from saturated concentration and goes to zero as oxygen concentration approaches zero foran extended time. Diversity decreases as environmental abrasiveness and friction increases, as in systemswith rapidly moving suspended or deposited sediment. Coastal beaches and sandy rivers are goodexamples. Perpetually dark systems are likely to be less diverse than illuminated systems. These rigorousenvironments require exceptionally long evolutionary time to diversify to the same extent as less rigorousenvironments.

141
A certain amount of environmental instability may enhance diversification process. Daily changesin light intensity enable diverse sight adaptations to persist in the same ecological space. Diversity isreduced, however, when instability results in extended periods of rigor, such as frozen winter conditions. Predictable but instable seasonal temperature change has fostered a diversity of insect species, each ofwhich functions most actively at different times of the year. Insect diversity usually decreases whenimpoundments create relatively uniform downstream temperatures (Ward and Stanford 1979; Vannote etal. 1989). However, the instability of salinity in estuarine environments has long been recognized as anespecially difficult condition for diversification, which is usually lower than in either freshwater or marineenvironments.
The predictability of environmental variation also is critical in determining adaptationaleffectiveness. Instability can be predictable, as is daily and seasonal change in illumination intensity. Instability also may be unpredictable, such as catastrophic geologic, climatic, or anthropogenic events. Streamflow variation provides a good example. While streamflow varies with somewhat predictableseasonal patterns in most stream channels, and many organisms are adapted to such pattern, catastrophicfloods are far less predictable and more destructive because their infrequency precludes adaptation. Management that re-creates the somewhat predictable flow variation and floodplain flooding that favoredunique adaptation will preserve that diversity, just as management to reduce extreme flood damage alsocan protect diversity. On the other hand, management that both eliminates seasonal variation and increasesthe likelihood of extreme flooding is likely to reduce ecosystem integrity and diversity.
The process of diversification itself fosters further diversification within habitats, but can reducetotal diversity across habitats. As a new site becomes colonized by marsh and swamp plants, for example,the new physical structure developed by the community stabilizes and reduces hydraulic energies andenvironmental abrasiveness. Suspended solids settle and are held in place by the plants. The newcommunity provides numerous physical-biological niches for which diverse species are adapted, whichotherwise would not exist without preliminary diversification. The new community also entraps greaterimported organic matter, thus increasing the organic base for consumer production and diversification.
Diversity, Ecological Efficiency, Stability, and Ecosystem Integrity
As predators and competitors continue to colonize a new site, some less adaptive species go extinctlocally while diversity overall usually increases and ecological efficiency increases. Sometimes, however,invasion by a particularly influential or keystone species can reduce diversity and ecological efficiency. This happened when Nile perch, a large predator, was introduced into Lake Victoria (Barel et al. 1991). Depending on how long unique species have been isolated from new sources of predation and competition,as in many isolated aquatic habitats, processes that normally cause diversification can both locally andglobally decrease diversity. It is no accident that many recent extinctions occurred on land islands or theiraquatic equivalents as humans "colonized" them and overly exploited their resources. Zoogeographicstudy indicates this has been a common process in the evolution of ecosystem diversity. Humans areamong a number of colonizing forms capable of reducing diversity and ecological efficiency, but withexceptional effectiveness.
All species are not equal in determining how diversity contributes to ecological efficiency, however. Keystone species can occur at any level and have disproportionate influence within the community (Paine1966). Species with disproportionate influence are more likely to occur in communities with lowerdiversity or are recent invaders such as the Nile perch in Lake Victoria (Barel et al. 1991) or the sealamprey in the upper Great Lakes (Regier and Hartman 1973). Diversification tends to diminish theinfluence of any one species and builds functional redundancy into the system. That redundancy tends to

142
sustain stability in ecological processes such as total community production and other ecological outputs,but at a cost in production or other output associated with one or a few of the species.
Species in simpler communities have, to some extent, compensated for the lack of speciesredundancy by becoming more resilient in the face of ecosystem fluctuation and sustained change. Thesebroadly adapted species have high reproductive potential when trophic opportunities arise. Therefore, simple communities may be nearly as stable and efficient as complex communities when the tolerances ofany one of the few species present are not exceeded. Because of their relative abundance and renewalrates, many of the wild species most valued as food and sport are resilient species that do not compete wellin more diverse communities. Thus, management conflicts can exist between those who wish to maximizediversity and those who wish to maximize more immediate user benefits.
Biodiversity and ecosystem integrity are not simply and consistently related. Biodiversity variesfrom low to high in wilderness ecosystems, depending on the factors limiting diversification in thosesystems. Thus, from a management standpoint, ecosystem integrity is meaningful with respect to potentialbiodiversity that could exist, given ecosystem limiting conditions and their manageability. Part of thecomplexity derives from the hierarchial nature of ecosystems. Low local biodiversity often promoteshigher biosphere biodiversity because many unique forms cannot withstand competition in more diversecommunities. Numerous islands and isolated water bodies have lost endemic species as new speciesinvaded with the help of humans. Even though local biodiversity can increase as a consequence of newspecies invasions, the total number of species in all of the earth's ecosystems decreases as a consequence.
There is some evidence that biodiversity has fluctuated as new, competitively superior speciesinvaded established communities. Humans are, of course, keystone among competitive species. Theconcept of ecosystem integrity depends on the extent to which human behavior is accepted as part ofnatural ecosystem processes. The extent to which human behavior that reduces biodiversity is accepted inpart depends on the extent society justifies human welfare at the expense of future option values associatedwith lost biodiversity. A practical definition of ecosystem integrity accommodates the best of humanculture while protecting important future options (see Regier 1993).
BIOMASS AND CASCADE THEORY
Top-Down and Bottom-Up Ecological Forces
The downward force (top-down) of consumption and the upward (bottom-up) force of habitatattributes combine to determine the species biomass and numbers in ecosystems. This recent area ofecology, cascade theory, is the basis of a form of aquatic ecosystem management referred to asbiomanipulation (Carpenter 1988; Carpenter and Kitchell 1992; DeMelo et al. 1992; Jones 1986). Becausepeople seem to value present biological abundance more than biological renewal rate (production,sustainability), quantification of production and biomass relations and the effects of consumption on thoserelationships are desirable for developing more predictive ecosystem management understanding.
Trophic cascade relationships between bottom-up habitat drivers and top-down consumptiondrivers are illustrated in Figure A-3. Bottom-up drivers of ecosystem processes can be viewed loosely ashabitat determinants (including engineered habitat conditions) of ecosystem functions. In Figure A-3, theconditions driving habitat quality originate in the watershed and in basin and channel morphology andwater transport properties. Top-down drivers are mostly caused by predators, including humans. Organisms do not have to actually eat prey to act as a top-down force. They can interfere withreproduction, growth, or other processes. In addition, certain species, including humans, can greatlymodify habitats from various positions in food webs (e.g., bald cypress, grass carp, beaver, alligators).
Bottom-up forces typically influence lower trophic levels more strongly than top-down forces. Water management manipulates ecological forces that drive material flow rates among ecosystems, mostobviously out of watersheds and upper-watershed aquatic habitats into lower-watershed aquatic

143
ecosystems and oceanic systems. This relationship between watershed and aquatic ecosystems profoundlyinfluences ecosystem attributes, especially once watershed process

144

145
is integrated with solar energy influx and morphological conditions of channels and basins containingaquatic habitats. They collectively determine most of the physical-chemical concentration and intensitiesthat regulate the efficiency with which physical-chemical energy is biologically "captured" byphotosynthesis and transmitted through food webs to all species present. Although those physical-chemical attributes go far in determining production and biomass among populations, top-down effectsoften are substantial, especially in the upper trophic levels. The real top-down impact of humans in aquaticsystems is most dramatically evidenced by the closure of numerous fisheries in recent decades.
Any complete predictive understanding of ecosystem management must start with initial conditionsin the watershed, the channels and basins, the aquatic-based biotic communities, and proximal ecosystems. Such predictive understanding also must know the bottom-up and top-down ecological controls and howthey respond to management. The initial diversity, biomass, and size structure of organisms need to bedocumented, both within the developed habitat and in surrounding ecosystem sources for colonizingspecies. In addition to controls within ecosystems, rates of emigration, invasion, and successfulcolonization from other ecosystem sources need to be accounted for.
The extent to which primary production is realized from initial biomass is determined by habitatquality, habitat quantity, and the grazing pressure of herbivores. Some important habitat factorssymbolized in Figure A-3 represent a large array of possible factors depending on the ecosystem chosen forproject consideration. Autochthonous primary production is augmented by allochthonous organic matterfrom terrestrial primary production (and other trophic levels in much smaller quantities). Habitat qualityand quantity also influence the relationship that exists between biomass and production, the P/B ratio. Animportant determinant of P/B ratio is organism size, both within and among species, because size is anindex for maximum growth rate possible when nutrition is nonlimiting. Small organisms typically growfaster than larger organisms when all nutritional requirements are filled (Peters 1983). See Peters (1983)for a thorough integration of the ecological importance of organism size.
Maximum population growth rate, however, is constrained by various habitat variables as they varyfrom optimum conditions. Extreme but tolerable low temperature, for example, profoundly limitsectothermic growth (fish, invertebrates, reptiles, and amphibians) and partially limits endothermic growth(birds, mammals). Depending on the system and species, any to all of the habitat factors described canconstrain population growth through their effect on P/B ratio.
Management Implications of Cascade Theory
Ultimately, the biomass, numbers, form of diversity, and size of organisms greatly determine howhumans relate to the community supported by ecosystem processes. This relationship is both ecological,through consumption and habitat modification, and psychological, as determined by perception of, andattitudes toward, community properties. The psychological process determines the extent that humansperceive benefit from the ecosystem and its management. Of course, the more humans can anticipate theirneeds from the community, their unplanned and planned impacts on the community, and the effects ofother forces operating in the ecosystem, the more they can shape ecosystems to meet collective needs,including perceived need for long-term sustainability of diverse ecological outputs.
Those applied ecologists who emphasize the bottom-up management process have much to learnabout ecosystem regulation, but may have more information available to them than those emphasizing top-down biomanipulation. Even though top-down management has existed as long as fish and gameprotection (millennia), the effects of top-down management on lower trophic levels have been scientificallydocumented only in the past few decades. Fish population manipulation has been shown to influence the

146
biomass of both macrophytes and phytoplankton. Both theory and empirical results show that reduction offirst-level carnivores allows herbivore abundance to increase and depress phytoplankton abundance--thusclarifying water and possibly reducing treatment costs by chemical or mechanical means.
Fisheries regulation usually disproportionately influences carnivores and indirectly may influencewater-quality factors through ecologically transmitted effects. The extent of effect is variable and notentirely predictable. Generally, however, where water quality focuses on primary production dynamics, theties between habitat regulation and primary production are clearer and more reliable than the tie betweenprimary producers and upper trophic-level dynamics.
Recent ecological research in cascade ecology, if nothing else, demonstrates the complexity withwhich human actions can be transmitted through ecosystems to trophic levels and constituent species (e.g.,see Carpenter et al. 1988). Although the impacts of both bottom-up and top-down influences diminishwith the number of intermediary ecological interactions, the impact on human values may bedisproportionate to ecosystem impacts. This is especially true of species in top carnivore levels, such aslake trout in the Laurentian Great Lakes or bald eagles in the continental United States. For lake trout,canal development modified habitat enough to allow entry of an effective predator, the sea lamprey, whichinteracted with commercial fishing to depress the lake trout population. For the bald eagle, bottom-uppesticide impacts interacted with top-down shooting. A list of endangered and threatened species revealsmany that have reached their status because of the combined effects of bottom-up habitat change and top-down reduction.
IMPORTANCE OF ECOSYSTEM SIZE
Cumulative Management Effects
How big is an ecosystem? And how does the typical Corps project fit into that context? Practicalmanagement demands that limits be defined on project dimensions. At some point, project influence mustdiminish to inconsequential impacts. Yet history indicates that what appeared to be inconsequential off-project impacts have had important cumulative impacts, especially in wetlands, floodplains, estuaries, andbarrier beaches. There is now a need to mitigate and recover from past cumulative effects throughenvironmental restoration projects. The concept of ecosystem size is central to the concept of cumulativeeffect generated by material transport process in and out of project domains. As that concept becomesmore generally recognized, the scale of the typical environmental restoration project is likely to increase.
The bounding of ecosystems for policy analysis is determined by human perspective and need morethan by inherent ecological properties. Management outcomes usually identify the relevant ecologicalinteractions to be incorporated into ecosystem perspective. Ecosystems are hierarchial assemblages ofsmaller systems within larger systems (O'Neill et al. 1986; King 1993). The dimensions of ecosystemsrange from subpopulation to global scale, depending on planning needs. Past management planning usuallyfocused on certain subsystem outputs, such as specific vertebrate population abundance, and the intensityof management impacts radiated unevenly from those targeted systems inward to embedded subsystemsand outward to enveloping supersystems.
An evolving perspective toward a more holistic concept of ecosystem integrity has increased thedimensions of relevant ecosystem processes and output (Regier 1993). For agencies concerned about totalimpact, useful criteria for bounding ecosystems must be defined as much by non-targeted ancillary outputs(side effects) as by the targeted outputs. These ancillary outputs may either augment or detract from the

147
benefit intended from management. These side effects often take the form of off-site impacts beyondproject boundaries.
An example of social problems that emerge when management outcomes are overlycompartmentalized is the degradation of aquatic resources caused by overly erosive watershed practices,such as those intended to maximize agricultural production in the short run. Another less obvious exampleis the degradation of estuarine and coast resources as a consequence of engineering in the watershedssupplying nourishing sediment (Chapman 1973; Morgan 1973). The sum result of overly erosivewatersheds and widespread development of sediment trapping impoundments is significant regionaldiminishment in the long-term benefit derived from reservoir construction.
Generally, as ecosystem size increases for targeted management outcomes and collateralnontargeted side effects, the intensity of interaction with other external ecosystems decreases. Forexample, when a lake alone is considered an ecosystem, many unexplained changes come about as aconsequence of watershed processes. But when the lake and the watershed are integrated into a singleecosystem perspective, many of the previously mysterious processes become apparent and far fewer remainunexplained. When atmospheric or migratory processes are included within the ecosystem perspective,interactions with other external ecosystems may diminish to negligible levels.
Important Export Dynamics and Ecosystem Size
A truer measure of the extent that ecosystem size reduces interactions are measures of materialimport and export dynamics. Small systems with large ratios of material export to material retention maybe equaled by very large systems with low ratios of material export to material retention.
Ecosystem dimensions typically are defined around those ecological factors that either constrain toomuch or too little the targeted ecological-output development. It is critical to assure that the identifiedecological outputs are appropriate for intended management outcomes. When intermediate outputs arechosen as indices for the outputs of true concern, there is always a risk of index error. For example,habitat for a particular species may be the identified output, but "building it" may not automatically mean"they will come" if ecological factors elsewhere that constrain the population's ecosystem act to limitpopulation use of the habitat. For example, building winter habitat for waterfowl that are limited bynesting habitat availability will do little to increase total bird abundance. Similarly, improving migrationroutes for migratory fishes may do little to increase abundance where marine fisheries go unregulated orspawning gravel remains embedded by sediments from overly erosive watersheds. Although the targetedcorridor habitat may be effectively developed, the ultimate purpose remains unrealized and project valuequestioned.
Any index developed for predictive purposes must incorporate all of the relevant control factors forthe expected project outcome. When they do not, either the outputs should be reconsidered or betterindices sought. Meanwhile, decisions need to be made with the best information available, realizing thereis always room for improvement.
Ecosystem dimensions also are defined to account for inputs and outputs that could alterinterpretation of observed outputs. The most obvious example relates to estimates of habitat use as ameasure of management outcome. Development of new habitat may result in high targeted population userates mostly because populations are diverted from other habitats. Although a project habitat appears toproduce 100,000-population use days, for example, the total use of all existing habitat may increase by only10,000-population use days. To account for such possible misrepresentation of habitat "value," ecosystem

148
perspective used in planning should include all alternative (substitute) habitats that may be used by thetargeted populations.
ROLE OF MODELS
Numerous models have been developed to predict ecological outputs. These models may be usefulplanning tools depending on their applicability to specific project attributes. At the very least, models mayhelp planners identify the critical input information needed to determine ecological output amount andform. Such models have been reviewed elsewhere in Corps reports, and the intent here is to show howsome of the more commonly used models relate to the systems discussion developed here. Russell et al.(1992) identified several categories of ecological models that form a basis for model categories used here:population status, population dynamics, natural community process, natural ecosystems process, andnatural-cultural ecosystems process.
Population Status Models
Population status models have enjoyed the most attention in past Corps planning, probably becausethey focus on habitat regulation of population performance, usually measured in terms of relative numbers,biomass, fecundity, productivity, or habitat use time. They are designed typically to estimate the optimumhabitat configuration for maximum population performance. Many of the models have been developed aspart of the habitat evaluation process (HEP) developed by the U.S. Fish and Wildlife Service in response torequests for environmental impact information and mitigation of environmental damage generated byfederal projects (USFWS 1980, 1981; Shamberger et al. 1982; Bovee 1986). The main elements of HEPare habitat suitability indices (HSI) for high-profile species. These models are usually based on probabilityof population occurrence in habitats of various status. Certain fish, birds, and mammals have been mostaddressed with such models. Also, instream-flow analysis is based on the concept.
HEP models have dominated wildlife models for the past twenty-five years because they offer theadvantages of simplicity, objective focus, and sponsorship by the lead wildlife agency in Federalgovernment. They have, however, many limitations, some of which are no longer a function of thecomputing limitations and understanding of ecological processes that existed 25 years ago. Their biggestinherent limitation is single-species focus in an era when more holistic measures of ecosystem output aremore desirable. Targeting more than one species for a project outcome requires an optimization processamong the species management variables, a process that is unproven and risky but has potential withfurther research.
HEP was initiated in 1970, when most wildlife management revolved around some single high-profile species--the era of deer and black bass management. More recently, holistic natural communitymanagement outcomes have been superimposed on single-species management, such as management forgreater species diversity and greater self-sustaining population regulation. Multiple species use andconcerns have reoriented many management agencies to this community perspective, while their modelingapproaches remained focused mostly on single-population issues. Some attempts to modify HEP and HSIto fit more of a community perspective have resulted in development of WET and certain other moreholistic models (Adamus et al. 1987, 1991). Yet the modeling process for the most part remainsexperimental and unverified.

149
Population and Community Dynamics Models
Other specialized population models have been developed for different purposes and often undernonfederal control. Abundance models generate estimates of numbers, biomass, or population growth andproductivity. A good example is the biomass estimation model of Kitchell et al. (1978). Other modelsfocus on population viability and often blend habitat-based model structures with population dynamics. These have specific use for endangered species analysis and only limited generalized process has emergedfrom them.
Certain population biomass models are based on biological energetics (e.g., Kitchell et al. 1978). At a larger community level, a number of energetics or material-flow models have been developed. Theseare ecosystems models that track material and energy pathways from sources to sinks through production,biomass, and guilds or populations that constitute communities (e.g., Jorgensen et al. 1983; Odum 1983;Starfield and Blelock 1986; Chapra and Reckhow 1983). Some models are quite elaborate and includematerial recycling processes. Some models were first developed during the International BiologicalProgram conducted in the 1970s and have since been refined and applied to a diversity of ecosystemconditions (e.g., McIntire and Colby 1978). An important element in such models is estimation of trophic-level and resource-partitioning efficiencies, as illustrated in Figure A-1. With further development, theymay be used to evaluate management impact on ecosystem-wide processes and various holistic measures ofbiological integrity.
Most early versions were bottom-up models, which assumed that regulation of efficiency wasentirely from habitat-based sources such as suspended sediment, nutrient, water color, flushing rates, andsubstrate stability. More recently, the top-down effect of predation has been modeled. So far, however,the top-down process has not been well integrated with the bottom-up process in comprehensive modelsdespite the basic information to do so (Carpenter and Kitchell 1992). Effective management models, evenif focused on the bottom-up process, much as the Corps is focused, cannot ignore interactions withagencies that manage the top-down process. In isolated instances, such as in grass carp introduction tocontrol aquatic plants, the Corps may directly participate in top-down management.
Ecosystem Process Models
A number of models have been designed to analyze for the effects of ecological processes onecosystem level outputs, such as sequestering of materials in ecosystem biomass and sediments (Mitsch andGosselink 1986; Gosselink et al. 1990). Much work needs to be done, however, to interface managementmodels with ecological process models in a way that Corps activities or other management activities can besuperimposed to assess the impacts in terms of ecological output and their attendant human services andbenefits.
Although there is great potential for developing comprehensive management models relevant toproject activity of the Corps, there has been little concerted effort to do so. Few models have attempted tointegrate natural and human-caused processes into management models with an ecosystems structureincorporated in the models and with both economic and ecological consequences. An example of such amodel is a comprehensive management model developed for New Mexico sport fisheries (Cole et al. 1990,1995). It is a practical applications model that incorporates a statewide perspective with watershedinteractions, angler impacts on fisheries, and angler economic benefits derived from the fisheries. Althoughlimited in management perspective, the approach taken in the New Mexico model can be extended to manyother uses and over a larger geographical area.

150
A new area of model development is under way that addresses ecological processes at thelandscape level. These models address the movement of materials, organisms. and energy amonglandscape elements and build on material transport models created to analyze atmospheric processes, watermovement, and sediment and contaminants transport (Turner and Gardner 1991). The most useful modelsin the future will integrate landscape process, material transport, ecological energetics, habitat qualities,community production, population dynamics, human use and benefits, and management impact. Eventhough the elements are present, integration and development will require time and money and will beconstrained by computer capacities and reliable information. Development of geographical informationsystems software in recent years has facilitated landscape process modeling.