linearity investigation from a vibratory fatigue bench
TRANSCRIPT

Mechanics & Industry 20, 101 (2019)© AFM, EDP Sciences 2019https://doi.org/10.1051/meca/2018044
Mechanics&IndustryAvailable online at:
www.mechanics-industry.org
REGULAR ARTICLE
Linearity investigation from a vibratory fatigue benchChristophe Gautrelet1,*, Leila Khalij1, Aymeric Appert1, and Roger Serra2
1 Normandie Université, LMN/INSA Rouen Normandie, France2 INSA Centre Val de Loire, UT, UO, Laboratoire de Mécanique G. Lamé, France
* e-mail: c
Received: 15 May 2018 / Accepted: 24 November 2018
Abstract. High-cycle fatigue behaviour of structures can be obtained through vibratory tests using frequencyresponse functions or transmissibilities. To this end, this study deals with the qualification of the vibratoryfatigue bench developed at the Laboratory of Mechanic of Normandy. This bench uses an electrodynamic shakerwhich can reach excitation frequencies that are higher than conventional fatiguemachines. To carry out relevanttests, the capacities of the test bench must be well known. Correlations between excitation and response wereinvestigated to determine the allowable setpoints to maintain linearity between the input and output signals tovalidate our system. The difficulties related to the experiments were presented and discussed.
Keywords: Vibratory fatigue test/ instrumentation/ vibratory bench capability/ linearity of the system
1 Introduction
Inmany industrial designs (automotive, aviation, etc.), it isnecessary to predict fatigue strength and correctly improvereliability to ensure structures are safe. Traditionally,material fatigue tests are performed on servo-hydraulicmachines whose cycle frequencies can range from few hertzto 1 kHz [1,2] on the most recent models. Thus, tests usinghigh-cycle fatigue to reach the endurance limit are costlyin both time and material. Other equipments have beendeveloped in order to create a greater number of cycles ina short time and to study the dynamic response of thestructures, such as electrodynamic exciters, vibrophores,etc. Stanzl–Tschegg have described these different testmethods in reference [3]. In 2004, George et al. gave a briefhistorical overview of these test benches [4]. The accelera-tion of vibratory fatigue tests with electrodynamic shakershas become more and more common in recent years [5,6].These controlled closed-loop vibratory fatigue systems [7,8]can be used at relatively high frequencies (>1 kHz) andtherefore reduce the duration of the tests. The advantage ofthese benches is the possibility of exciting the structureclose to the resonance without playing on the fatigueproperties of the materials, unlike the vibrophores.The amplification due to the resonance allows to increasethe strain levels (and consequently the stress levels) even ifthe input excitation level is relatively low, which impliesa reduction in energy cost. More recently, different
experimental studies of vibratory fatigue damage withcomplex excitations have been developed in the literature(for example, we can quote the Ref. [9]) to better predictfatigue behaviour close to the actual service life. We canfind in the literature a certain number of recent studiesoriented towards vibratory fatigue. Some of themwere concerned with structure design under randomexcitations [10–13] and multiaxial fatigue [14–17].Others had established SN curves [18–20] or yet damagedetection [21–26].
The Laboratory of Mechanic of Normandy (LMN) hasset up a vibratory fatigue bench [6,19] consisting of anelectrodynamic shaker and a closed-loop control systemthat allows precise control. In order to set up complex tests(random, multiaxial, etc.) in the future, it is essential toknow the behaviour of the bench according to the structurestudied and the accessible excitation levels. The goal of thiswork was therefore to study the capability of the test benchfrom a linearity investigation between the excitation(amplitude of the imposed acceleration) and the responseof the specimen (amplitude of the measured acceleration atthe beam end and the related strain measured by a gauge)while highlighting the difficulties by carrying out such atest. The insufficiency of deterministic tests to representthe actual loads supported by a structure has been knownfor a long time [27], but this excitation type has allowed thequalification of our testing means. The experimentallinearity of this bench should also lead to lighten thespecimen instrumentation. Indeed, the added masses ofthe accelerometer at the beam end and the strain gaugebonding tend to disturb the measure structure response
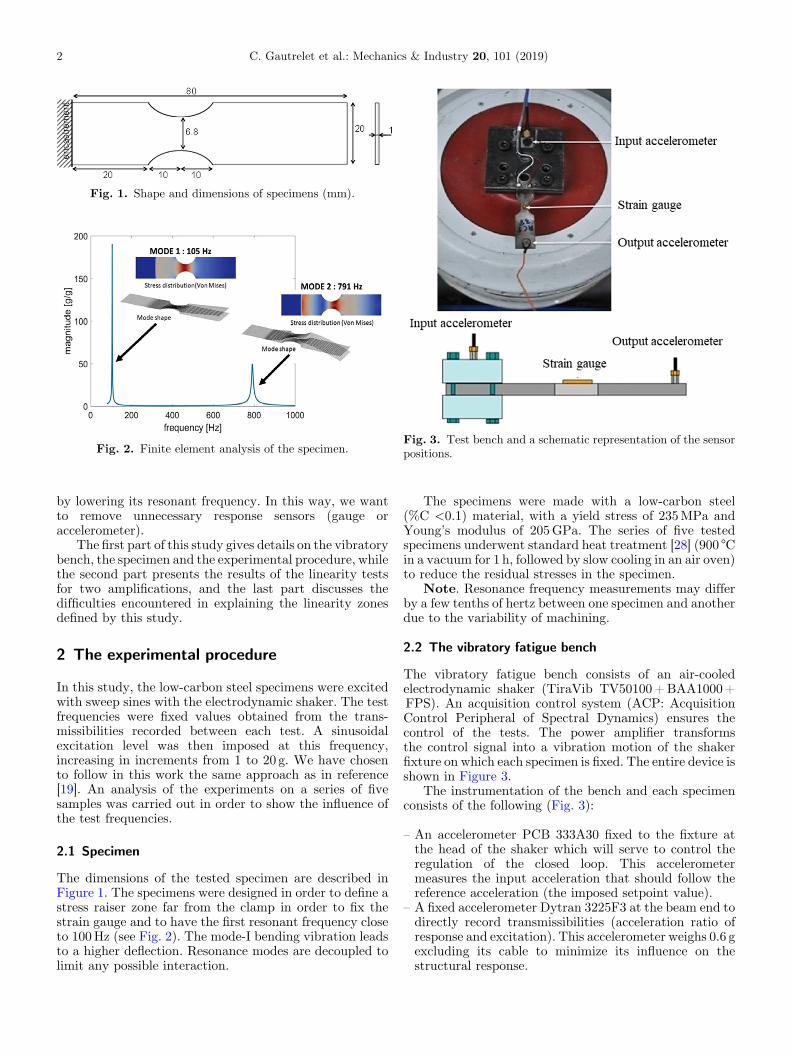
Fig. 1. Shape and dimensions of specimens (mm).
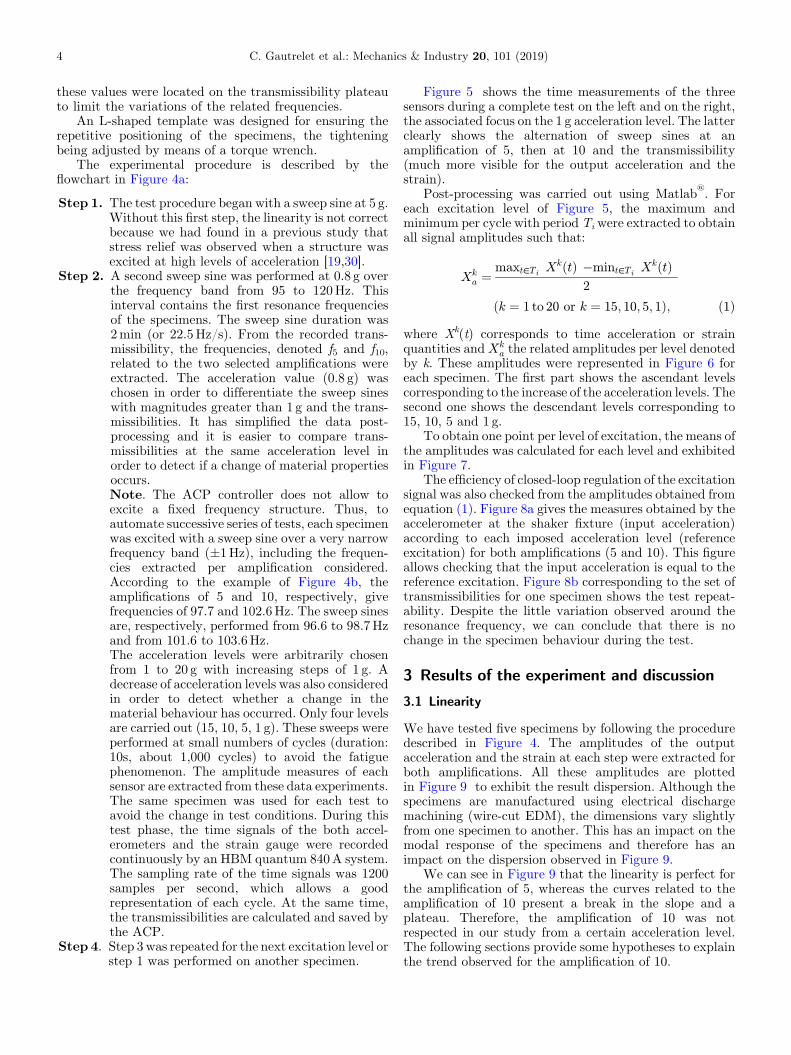
Fig. 2. Finite element analysis of the specimen.Fig. 3. Test bench and a schematic representation of the sensorpositions.
2 C. Gautrelet et al.: Mechanics & Industry 20, 101 (2019)
by lowering its resonant frequency. In this way, we wantto remove unnecessary response sensors (gauge oraccelerometer).
The first part of this study gives details on the vibratorybench, the specimen and the experimental procedure, whilethe second part presents the results of the linearity testsfor two amplifications, and the last part discusses thedifficulties encountered in explaining the linearity zonesdefined by this study.
2 The experimental procedure
In this study, the low-carbon steel specimens were excitedwith sweep sines with the electrodynamic shaker. The testfrequencies were fixed values obtained from the trans-missibilities recorded between each test. A sinusoidalexcitation level was then imposed at this frequency,increasing in increments from 1 to 20 g. We have chosento follow in this work the same approach as in reference[19]. An analysis of the experiments on a series of fivesamples was carried out in order to show the influence ofthe test frequencies.
2.1 Specimen
The dimensions of the tested specimen are described inFigure 1. The specimens were designed in order to define astress raiser zone far from the clamp in order to fix thestrain gauge and to have the first resonant frequency closeto 100Hz (see Fig. 2). The mode-I bending vibration leadsto a higher deflection. Resonance modes are decoupled tolimit any possible interaction.
The specimens were made with a low-carbon steel(%C <0.1) material, with a yield stress of 235MPa andYoung’s modulus of 205GPa. The series of five testedspecimens underwent standard heat treatment [28] (900 °Cin a vacuum for 1 h, followed by slow cooling in an air oven)to reduce the residual stresses in the specimen.
Note. Resonance frequency measurements may differby a few tenths of hertz between one specimen and anotherdue to the variability of machining.
2.2 The vibratory fatigue bench
The vibratory fatigue bench consists of an air-cooledelectrodynamic shaker (TiraVib TV50100+BAA1000+FPS). An acquisition control system (ACP: AcquisitionControl Peripheral of Spectral Dynamics) ensures thecontrol of the tests. The power amplifier transformsthe control signal into a vibration motion of the shakerfixture on which each specimen is fixed. The entire device isshown in Figure 3.
The instrumentation of the bench and each specimenconsists of the following (Fig. 3):
–
An accelerometer PCB 333A30 fixed to the fixture atthe head of the shaker which will serve to control theregulation of the closed loop. This accelerometermeasures the input acceleration that should follow thereference acceleration (the imposed setpoint value).–
A fixed accelerometer Dytran 3225F3 at the beam end todirectly record transmissibilities (acceleration ratio ofresponse and excitation). This accelerometer weighs 0.6 gexcluding its cable to minimize its influence on thestructural response.
C. Gautrelet et al.: Mechanics & Industry 20, 101 (2019) 3
–
A strain gauge HBM 1LY15-1.5/350 fixed to the usefularea of the specimen. The size of the grid is 1.5 by 1.2mmin order to get more accurate measurements.To determine the maximum acceleration supported bythe shaker, it was necessary to know the moving mass ofthe system (Tab. 1). Thus, the maximum acceleration is26.2 g knowing that the shaker achieves its maximum forceat 650N.
Table 1. Masses (in kg) moved by the shaker.
Vibratory system Clamping device Specimen Total
1.3 1 0.18 2.48
Fig. 4. (a) Flowchart of the experimental procedure and (b)
2.3 Experimental procedure and data processing
When a structure is excited at a frequency close to itsresonance, a response amplification can be observed,which allows an amplification of the strain measurementon the specimen useful area. In this case, a phase shift isobserved between the input and output signals. To studythe linearity between the acceleration (input) and thespecimen response (output) at different levels of amplifi-cation, we have considered two amplification levels:the first one at 5 g/g and the second at 10 g/g. Theseamplification values were arbitrarily chosen before theresonance peak to keep the phase between the input andthe output at less than 20° [29]. As shown in Figure 4b,
example of a transmissibility obtained for 0.8 g excitation.
4 C. Gautrelet et al.: Mechanics & Industry 20, 101 (2019)
these values were located on the transmissibility plateauto limit the variations of the related frequencies.
An L-shaped template was designed for ensuring therepetitive positioning of the specimens, the tighteningbeing adjusted by means of a torque wrench.
The experimental procedure is described by theflowchart in Figure 4a:
Step 1. The test procedure began with a sweep sine at 5 g.Without this first step, the linearity is not correctbecause we had found in a previous study thatstress relief was observed when a structure wasexcited at high levels of acceleration [19,30].
Step 2. A second sweep sine was performed at 0.8 g overthe frequency band from 95 to 120Hz. Thisinterval contains the first resonance frequenciesof the specimens. The sweep sine duration was2min (or 22.5Hz/s). From the recorded trans-missibility, the frequencies, denoted f5 and f10,related to the two selected amplifications wereextracted. The acceleration value (0.8 g) waschosen in order to differentiate the sweep sineswith magnitudes greater than 1 g and the trans-missibilities. It has simplified the data post-processing and it is easier to compare trans-missibilities at the same acceleration level inorder to detect if a change of material propertiesoccurs.Note. The ACP controller does not allow toexcite a fixed frequency structure. Thus, toautomate successive series of tests, each specimenwas excited with a sweep sine over a very narrowfrequency band (±1Hz), including the frequen-cies extracted per amplification considered.According to the example of Figure 4b, theamplifications of 5 and 10, respectively, givefrequencies of 97.7 and 102.6Hz. The sweep sinesare, respectively, performed from 96.6 to 98.7Hzand from 101.6 to 103.6Hz.The acceleration levels were arbitrarily chosenfrom 1 to 20 g with increasing steps of 1 g. Adecrease of acceleration levels was also consideredin order to detect whether a change in thematerial behaviour has occurred. Only four levelsare carried out (15, 10, 5, 1 g). These sweeps wereperformed at small numbers of cycles (duration:10s, about 1,000 cycles) to avoid the fatiguephenomenon. The amplitude measures of eachsensor are extracted from these data experiments.The same specimen was used for each test toavoid the change in test conditions. During thistest phase, the time signals of the both accel-erometers and the strain gauge were recordedcontinuously by an HBM quantum 840A system.The sampling rate of the time signals was 1200samples per second, which allows a goodrepresentation of each cycle. At the same time,the transmissibilities are calculated and saved bythe ACP.
Step 4. Step 3 was repeated for the next excitation level orstep 1 was performed on another specimen.
Figure 5 shows the time measurements of the threesensors during a complete test on the left and on the right,the associated focus on the 1 g acceleration level. The latterclearly shows the alternation of sweep sines at anamplification of 5, then at 10 and the transmissibility(much more visible for the output acceleration and thestrain).
Post-processing was carried out using Matlab®
. Foreach excitation level of Figure 5, the maximum andminimum per cycle with period Ti were extracted to obtainall signal amplitudes such that:
Xka ¼
maxt∈TiXkðtÞ� ��mint∈Ti
XkðtÞ� �
2
ðk ¼ 1 to 20 or k ¼ 15; 10; 5; 1Þ; ð1Þwhere Xk(t) corresponds to time acceleration or strainquantities andXk
a the related amplitudes per level denotedby k. These amplitudes were represented in Figure 6 foreach specimen. The first part shows the ascendant levelscorresponding to the increase of the acceleration levels. Thesecond one shows the descendant levels corresponding to15, 10, 5 and 1 g.
To obtain one point per level of excitation, the means ofthe amplitudes was calculated for each level and exhibitedin Figure 7.
The efficiency of closed-loop regulation of the excitationsignal was also checked from the amplitudes obtained fromequation (1). Figure 8a gives the measures obtained by theaccelerometer at the shaker fixture (input acceleration)according to each imposed acceleration level (referenceexcitation) for both amplifications (5 and 10). This figureallows checking that the input acceleration is equal to thereference excitation. Figure 8b corresponding to the set oftransmissibilities for one specimen shows the test repeat-ability. Despite the little variation observed around theresonance frequency, we can conclude that there is nochange in the specimen behaviour during the test.
3 Results of the experiment and discussion
3.1 Linearity
We have tested five specimens by following the proceduredescribed in Figure 4. The amplitudes of the outputacceleration and the strain at each step were extracted forboth amplifications. All these amplitudes are plottedin Figure 9 to exhibit the result dispersion. Although thespecimens are manufactured using electrical dischargemachining (wire-cut EDM), the dimensions vary slightlyfrom one specimen to another. This has an impact on themodal response of the specimens and therefore has animpact on the dispersion observed in Figure 9.
We can see in Figure 9 that the linearity is perfect forthe amplification of 5, whereas the curves related to theamplification of 10 present a break in the slope and aplateau. Therefore, the amplification of 10 was notrespected in our study from a certain acceleration level.The following sections provide some hypotheses to explainthe trend observed for the amplification of 10.

Fig. 5. Example of time signals for a complete test (on left), and a zoom on the 1 g level (on right) of the input acceleration (a), outputacceleration (b) and strain (c).
C. Gautrelet et al.: Mechanics & Industry 20, 101 (2019) 5
3.1.1 Irreversible strain
Intuitively, the first hypothesis deals with the irreversiblestrain of the specimen. We had performed monotonictensile tests at the maximum velocity of the usedhydraulic machine in order to approach the strain rateobtained from the vibratory bench. The results presentedin reference [19] have shown that the stresses reachedalways remained below the yield stress of the consideredmaterial. We have anticipated this hypothesis with thedescendant stages 15, 10, 5 and 1 g presented inFigure 4a. Figure 10 shows that the descendant stagesare superimposed on the related ascendant stages. We canthen conclude that the specimen does not undergo any
irreversible structural strain. In addition, Figure 8b doesnot show a variation of the resonant frequency anddamping, knowing that a stiffness loss has a non-negligibleeffect on the modal parameters [21–26].
3.1.2 Influence of the assembly
The vibration of the output accelerometer cable isinevitably accentuated during the tests because of thehigh excitation levels. The vibration cable generatesdispersions in the response and has a non-negligibleeffect on the strain amplitude measures. We have thencarried out tests with the glued cable to verify itssignificance.

Fig. 6. Amplitudes of the input acceleration (a), output acceleration (b) and strain (c).
6 C. Gautrelet et al.: Mechanics & Industry 20, 101 (2019)
This test configuration cannot be adopted for thefatigue experiment as the cable increases the arearigidity, which may delay the failure. Figure 11 showsthat the noise induced by the cable vibration islimited by the bonding and Figure 12 shows through,by another test, that the break in the slope is stillpresent. It can be then concluded that the cablevibration is not responsible for the behaviour observedin Figure 9.
Another way has led us to investigate the effect ofshaker misalignment. We therefore equipped the benchwith a 3D accelerometer (X1,Y,Z) and a 1D accelerometer(X2). Figure 13a presents a schematic view of the shakerhead and the accelerometer locations. A sweep sine wasused as excitation on the frequency band from 95 to 120Hz.The measurements presented in Figure 13b show that theimbalance is negligible. Indeed, X1 and X2 are of the samevalues, Y and Z are almost zero, so no misalignment ofthe shaker head is observed.
According to the literature, the break in slope isexplained as follows:
–
Too large deflection due to high level of excitation leadingto geometrical nonlinearity [31];–
Damping of the complete system due to inertial forcesand microscopic damages [32];–
Frictions in the clamp [33], which can result in anopening of the shaker fixture for high levels ofexcitation or micro-slips of the specimen in the fixture[34,35].3.2 Delimitation of usable domains and simplificationof instrumentation
In order to guarantee the validity domains of a fatigue test,we chose to work only on the linear response domains.These domains were extracted from Figure 9a andFigure 9b and represented in Figure 14 in consideringthe following:
–
A linear regression passing through the origin of theaxes;–
The straight lines are defined to obtain a slope coefficientclose, respectively, to 5 or 10 for the amplifications 5or 10;–
A linear regression coefficient R2 close to 1; – To have the largest linearity domain possible.
Fig. 7. Means calculated from Figure 6 of the input acceleration (a), output acceleration (b) and strain (c).
Fig. 8. (a) Control verification and (b) set of transmissibilities (in magnitude and phase).
C. Gautrelet et al.: Mechanics & Industry 20, 101 (2019) 7
The results are collected and shown in Table 2. Thecurve does not show a break in slope for the amplification5, the (0–20 g) excitation domain is then usable. Forthe amplification 10, the domain is reduced to (0–15 g)due to the presence of the break in the slope. It can
be deduced that the increase in amplification (leadingto work on a frequency close to the resonant frequency)will have the consequence of reducing the linearitydomain. Thanks to this study, we can considersimplifying the instrumentation so as not to disturb

Fig. 9. Amplitude measures of the (a) beam response and (b) strain versus input accelerations.
Fig. 10. Evolution of the input excitation level with the beam response. Example for one specimen.
Fig. 11. Comparison between (a) not bonded and (b) bonded wire.
8 C. Gautrelet et al.: Mechanics & Industry 20, 101 (2019)

Fig. 12. Evolution of (a) output acceleration and (b) strain with the bonded wire for one specimen.
Fig. 13. (a) Schematic representation of the shaker head. (b) Acceleration measures with three levels of excitation (1, 10 and 20 g).
Fig. 14. Representation of extracted linear domains for bothamplifications.
Table 2. Characteristics of the extracted linear domains.
Amplification 5 10
Slope coefficient (g/g) 5.31 9.82R2 0.997 0.995Linear domains (g) 0–20 0–15
C. Gautrelet et al.: Mechanics & Industry 20, 101 (2019) 9
the response of the structure by considering the followingcases:
–
The strain gauge fixed to the stress concentration raiserzone will tend to disturb the propagation of cracks due tothe rigidity of the bonded area;–
The accelerometer adds mass to the structure andchanges its response, but it is necessary for accessing tothe transmissibilities.
Fig. 15. Correlation between the specimen responses for amplifications (a) 5 and (b) 10.
Table 3. Linearity parameters extracted from Figure 15.
Amplification 5 10
Slope coefficient (mm/m/g) 9.55 9.49R2 0.984 0.971
10 C. Gautrelet et al.: Mechanics & Industry 20, 101 (2019)
The correlation between the accelerometer at thespecimen end and the strain measurements is presented inFigure 15. We have only considered the experimental dataincluded in the linear domains previously obtained(Fig. 14). The linear regression lines associated with bothamplifications were plotted from these data.
The values are resumed in Table 3. The slopecoefficients for both amplifications are close, which showsthat the test frequency has no effect on the strainmeasurement. Therefore, we can consider removing thestrain gauge in future tests, especially since the strainmeasurements obtained show a greater dispersion com-pared to the accelerometer measurements (Fig. 9).
4 Conclusions
In this study, we have carried out experimental tests todelimit the linearity domains of the system. These domainswill be used for fatigue high-cycle vibratory tests using thebench. Thanks to this study, we have highlighted somedifficulties of implementation, as a consequence of the testsystem choice.
It was possible to define linear response domainsaccording to the excitation amplitude. The choice ofamplification will be then a compromise between
–
the levels of input acceleration and strain measures. Theamplification of 5 corresponds to a test frequency lowerthan an amplification of 10 but the latter makes itpossible to reach higher levels of strain;–
the phase difference between the input and outputmeasurements. Effectively, the amplification of 5 willallow a negligible phase shift compared to the amplifica-tion of 10. In addition, the amplification of 5 doesnot show a break in its slope and presents very littledispersion.
Acknowledgements. This study was conducted within theframework of the project MADNESS, which has been fundedwith the support from the European Union with the EuropeanRegional Development Fund (ERDF) and from the RegionalCouncil of Normandie.
References
[1] U. Krupp, Fatigue crack propagation in metals and alloys:microstructural aspects and modelling concepts, John Wiley& Sons, Inc., New York, 2007
[2] J.M. Morgan, W.W. Milligan, A 1 kHz servohydraulicfatigue testing system, in: W.O. Soboyejo, T.S. Srivatsan(Eds.), Proceedings of the Conference on High Cycle Fatigueof Structural Materials, TMS, Warrendale, PA, 1997,pp. 305–312
[3] S. Stanzl-Tschegg, Very high cycle fatigue measuringtechniques, Int. J. Fatigue 60 (2014) 2–17
[4] T.J. George, J. Seidt, M.-H. Herman Shen, T. Nicholas,C. Cross, Development of a novel vibration-based fatiguetesting methodology, Int. J. Fatigue 26 (2004) 477–486
[5] A. Angeli, B. Cornelis, M. Troncossi, Synthesis of sine-on-random vibration profiles for accelerated life tests based onfatigue damage spectrum equivalence, Mech. Syst. SignalProcess. 103 (2018) 340–351
[6] A. Appert, C. Gautrelet, L. Khalij, R. Troian, Developmentof a test bench for vibratory fatigue experiments of acantilever beam with an electrodynamic shaker, MATECWeb Conf. 165 (2018) 10007
[7] W.M. To, D.J. Ewins, A closed-loop model for single/multi-shaker modal testing, Mech. Syst. Signal Process. 5 (1991)305–316
[8] H.M. Gomes, D. dos Santos Gaspareto, F. de Souza Ferreira,C.A.K. Thomas, A simple closed-loop active control ofelectrodynamic shakers by acceleration power spectraldensity for environmental vibration tests, Exp. Mech. 48(2008) 683–692

C. Gautrelet et al.: Mechanics & Industry 20, 101 (2019) 11
[9] M. Bennebach, H. Rognon, O. Bardou, Fatigue of structuresin mechanical vibratory environment: from mission profilingto fatigue life prediction, Procedia Eng. 66 (2013) 508–521
[10] H. Hu, Y. Li, F. Zhao, Y. Miao, P. Xue, Q. Deng, Fatiguebehavior of aluminium-stiffened plate subjected to randomvibration loading, Trans. Nonferrous Metals Soc. China 24(2014) 1331–1336
[11] M. Paulus, A. Dasgupta, E. Habtour, Life estimation modelof a cantilevered beam subjected to complex randomvibration, Fatigue Fract. Eng. Mater. Struct. 35 (2012)1058–1070
[12] M. Mrsnik, J. Slavic, M. Boltezar, Frequency-domainmethods for a vibration fatigue-life estimation: applicationto real data, Int. J. Fatigue 47 (2013) 8–17
[13] M. Cesnik, J. Slavic, M. Boltezar, Assessment of the fatigueparameters from random vibration testing: application to arivet joint,Strojnivski vestnikJ.Mech.Eng.62(2016)471–482
[14] M. Mrsnik, J. Slavic, M. Boltezar, Multiaxial vibrationfatigue � a theorical and experimental comparison, Mech.Syst. Signal Process. 76/77 (2016) 409–423
[15] H. Rognon, T. Da Silva Botelhoa, I. Tawfiq, M. Bennebach,Fatigue sous environnement vibratoire: conception d’uneéprouvette pour des essais accélérés en fatigue afin de validerune méthode de dimensionnement pour des structuresréelles, Congrès Français de Mécanique, 2013
[16] D. Zanellati, D. Benasciutti, R. Tovo, Vibration fatigue testsby tri-axis shaker: design of an innovative system foruncoupled bending/torsion loading, Procedia Struct. Integr.8 (2018) 92–101
[17] D. Zanellati, D. Benasciutti, R. Tovo, An innovative systemfor uncoupled bending/torsion tests by tri-axis shaker:numerical simulations and experimental results, MATECWeb Conf. 165 (2018) 16006
[18] G. Allegri, X. Zhang, On the inverse power laws foraccelerated random fatigue testing, Int. J. Fatigue 30(2008) 67–977
[19] L. Khalij, C. Gautrelet, A. Guillet, Fatigue curves of a low-carbon steel obtained from vibrations experiments with anelectrodynamic shaker, Mater. Des. 86 (2015) 640–648
[20] G. Murugan, K. Raghukandan, U.T.S. Pillai, B.C. Pai,K. Mahadevan, High cyclic fatigue characteristics of gravitycast AZ91 magnesium alloy subjected to transverse load,Mater. Des. 30 (2009) 2636–2641
[21] O.S. Salawu, Detection of structural damage through changesin frequency: a review, Eng. Struct. 19 (1997) 718–723
[22] S.M.McGuire,M.E. Fine, D. Achenbach, Crack detection byresonant frequency measurements, Metall. Mater. Trans. A26 (1995) 1123–1127
[23] P. Lorenzino, A. Navarro, The variation of resonancefrequency in fatigue tests as a tool for in-situ identificationof crack initiation and propagation, and for the determina-tion of cracked areas, Int. J. Fatigue 70 (2015) 374–382
[24] M. Colakoglu, K.L. Jerina, Material damping in 6061-T6511aluminium to assess fatigue damage, Fatigue Fract. Eng.Mater. Struct. 26 (2003) 79–84
[25] F. Curà, A.E. Gallinatti, Fatigue damage identificationby means of modal parameters, Procedia Eng. 10 (2011)1697–1702
[26] W. Xu, X. Yang, B. Zhong, Y. He, C. Tao, Failure criterionof titanium alloy irregular sheet specimens for vibration-based bending fatigue testing, Eng. Fracture Mech. 195(2018) 44–56
[27] C. Perruchet, P. Vimont, Résistance à la fatigue desmatériaux en contraintes aléatoires, 1973
[28] Les traitements thermiques des aciers. Tba1050, Techniquesde l’Ingénieur, 2004
[29] M. Cesnik, J. Slavic, M. Boltezar, Uninterrupted andaccelerated vibrational fatigue testing with simultaneousmonitoring of the natural frequency and damping, J. SoundVib. 331 (2012) 5370–5382
[30] C.A. Walker, A.J. Waddell, D.J. Johnston, An investigationof the underlying processes, University of Strathclyde,Glasgow, SCT UK, 1994
[31] V.A. Jairazbhoya, P. Petukhovb, J. Quc, Large deflection ofthin plates in cylindrical bending: non-unique solutions, Int.J. Solids Struct. 45 (2008) 3203–3218
[32] E. Habtour, D.P. Cole, J.C. Riddick, V. Weiss, M. Robeson,R. Sridharan, A. Dasgupta, Detection of fatigue damageprecursor using a nonlinear vibration approach, Struct.Control Health Monitor. 23 (2016) 1442–1463
[33] M. Claeys, Réponses vibratoires non linéaires dans uncontexte industriel: essais et simulations, PhD thesis, EcoleCentrale de Lyon, 2016
[34] L. Pesaresi, J. Armand, C.W. Schwingschackl, L. DSalles,C. Wong, An advanced underplaunder damper modelingapproach based on amicroslip contact model, in: ISROMAC,2017
[35] H. Wentzel, M. Olsson, Mechanism of dissipation infrictional joints � influence of sharp contact edges andplastic deformation, Wear 265 (2008) 1814–1819
Cite this article as: C. Gautrelet, L. Khalij, A. Appert, R. Serra, Linearity investigation from a vibratory fatigue bench,Mechanics & Industry 20, 101 (2019)