linde interim report. january to september 2009. q3 · sales 6,629 7,157 –7.4 operating profit...
TRANSCRIPT

Q3Linde Interim Report. January to September 2009.

in € million
January to
September
2009 2008
Change
in percent
Share
Closing price € 74.08 75.48 – 1.9
Year high € 76.45 97.90 – 21.9
Year low € 48.80 71.01 – 31.3
Market capitalisation 12,493 12,718 – 1.8
Adjusted earnings per share1 € 3.38 4.14 – 18.4
Earnings per share € 2.47 3.29 – 24.9
Number of shares outstanding (in 000s) 168,642 168,489 0.1
Sales 8,313 9,392 – 11.5
Operating profit 1,741 1,910 – 8.8
EBIT before amortisation of fair value adjustments and non-recurring items 1,079 1,288 – 16.2
Non-recurring items – 59 – 100.0
Earnings after taxes on income 456 593 – 23.1
Number of employees 2 48,312 51,908 – 6.9
Gases Division
Sales 6,629 7,157 – 7.4
Operating profit 1,763 1,819 – 3.1
Engineering Division
Sales 1,677 2,063 – 18.7
Operating profit 145 183 – 20.8
1 Adjusted for the effects of the purchase price allocation and non-recurring items.
2 At 30 September 2009/31 December 2008.
Linde Financial Highlights

January to September 2009:
The Linde Group continues the positive
trend of the second quarter and
achieves further increases in profitability
3 Third quarter: significant improvement in Group operating profit1
compared with the previous quarter
3 At 30 September: operating margin increases to 20.9 percent
(2008: 20.3 percent) despite restructuring costs
3 9.5 percent rise in operating cash flow to EUR 1.424 bn
3 Group sales down 11.5 percent to EUR 8.313 bn
3 Group operating profit1 down 8.8 percent to EUR 1.741 bn
(down 4.7 percent after adjusting for restructuring costs)
3 Outlook for 2009 unchanged: better business trends expected than in
the first half of the year; however, 2008 record level no longer attainable
1 Operating profit: EBITDA before non-recurring items, including share of net income from associates and joint ventures.
Linde Interim Report. January to September 2009.
01Linde Interim Report 2009
JANuARy TO SEpTEmBER 2009

General economic environment
The decline in the global economy, which began in the fourth quarter of 2008 as a result of the financial and
economic crisis, continued to slow in the course of 2009. In the third quarter, clear signs of recovery were to
be seen, particularly in the emerging nations, and especially in China and in Southern and Eastern Asia. In
the more mature economies such as the US and Western Europe, the economic situation continued to stabi-
lise at a low level.
Future economic development is, however, beset with uncertainty. Some economic indicators may point to a
relatively speedy recovery, partly as a result of increases in inventory levels in all industry sectors. Whether the
signs of recovery will be sustainable, however, remains to be seen. It should be noted, after all, that the global
economy is being strongly supported by government-backed aid programmes and targeted monetary policy.
In comparison with the first six months of the year, economic forecasts for the full year 2009 have changed
only marginally. Based on its most recent estimates, Global Insight expects global gross domestic product (GDP)
for the current year to fall by 2.8 percent, compared with the fall of 2.9 percent predicted in summer 2009. In
the eurozone, a decline in economic output of 4.6 percent is now being forecast, compared to the decline of
4.5 percent predicted in the H1 report. Global Insight continues to assume that there will be a relatively signif-
icant fall in output of 2.9 percent in the US for the year 2009, compared with the predicted fall of 3.1 percent
in the H1 report.
The forecast for the year 2010 has barely changed from that made as the half-yearly report went to press.
Global GDP is still forecast to grow in the coming year at a rate of 1.8 percent (H1 report: 1.6 percent). Whereas
prospects for the eurozone have recently improved slightly and the current forecast is for a very small increase
in GDP of 0.1 percent, compared with the predicted fall in GDP of 0.3 percent in the H1 report, the forecast for
the US of slight growth of 1.4 percent was almost the same as the rise of 1.5 percent predicted in the H1 report.
The emerging nations, in particular China and India, will be the main contributors to the expected global eco-
nomic recovery in the course of the next year.
Group
The technology group The Linde Group continued the positive trend of the second quarter in a market envi-
ronment which remained difficult, achieving further increases in profitability in the months July to September
in comparison with the previous quarter. In the third quarter, Group operating profit rose by 12.5 percent com-
pared to the second quarter, while the operating margin increased significantly by 210 basis points to 22.5
percent (2nd quarter: 20.4 percent). The operating margin also continued to improve if a comparison is made
between the figures for the first nine months of 2009 and the first nine months of 2008. The Group operat-
ing margin for the period to 30 September 2009 was 20.9 percent, compared with 20.3 percent for the period
to 30 September 2008. Adjusted for one-off restructuring costs of EUR 80 m, the operating margin in the first
nine months of the current financial year was 21.9 percent. Of this significant improvement in operating mar-
gin of 160 basis points, 60 basis points is due to lower natural gas prices in 2009 than in 2008. The increase in
the operating margin was therefore mainly due to the positive impact of the rigorous accelerated implementa-
tion of the HPO programme.
HPO (High Performance Organisation), the Group’s integrated concept for process optimisation and increased
productivity, is being combined in certain areas and regions with capacity adjustments. These measures, which
are designed to achieve sustainable improvements in efficiency, have resulted in one-off restructuring costs of
EUR 80 m, which have been fully recognised by Linde in the nine months to 30 September. Due to the fact that
the programme is managed centrally, these measures are included in Corporate Activities. The related costs are
therefore disclosed in the reconciliation column of the segment report. On the basis of HPO, Linde is seeking to
achieve total gross cost savings of between EUR 650 m and EUR 800 m in the financial years from 2009 to 2012
and to continue to improve its competitiveness irrespective of the economic situation.
Against the background of the global economic crisis, Group sales fell by 11.5 percent in the first nine
months of 2009 to EUR 8.313 bn, compared with the record figure achieved in the first nine months of 2008 of
Group Interim Management Report
02 Linde Interim Report 2009
JANuARy TO SEpTEmBER 2009 – Group Interim management Report
EUR 9.392 bn. Group operating profit for the nine months to 30 September 2009 was EUR 1.741 bn, 8.8 percent
below the prior-year figure of EUR 1.910 bn. Adjusted for restructuring costs, the fall in Group operating profit
was only 4.7 percent.
The net financial expense improved further from EUR 274 m to EUR 247 m. Here, the Group was also able to
benefit from low interest rates in the financial markets.
Earnings before taxes on income were EUR 611 m, a decline of EUR 185 m or 23.2 percent when compared
with the prior-year figure of EUR 796 m. After adjusting for restructuring costs of EUR 80 m and the gains on
disposal of businesses of EUR 59 m achieved in the first nine months of 2008, this decline was only EUR 46 m
or 6.2 percent.
Group earnings after tax at 30 September 2009 were EUR 456 m (2008: EUR 593 m). After taking minority
interests into account, earnings attributable to Linde AG shareholders were EUR 417 m (2008: EUR 552 m), giving
earnings per share of EUR 2.47 (2008: EUR 3.29). After adjusting for the effect of the purchase price allocation
in the course of the BOC acquisition and the profits on disposal achieved in the prior year, earnings per share in
the first nine months of 2009 stood at EUR 3.38, compared with EUR 4.14 in the first nine months of 2009. The
restructuring costs recognised in the first nine months of 2009 have not been adjusted for in this calculation.
Gases Division
In the Gases Division, the recovery trend indicated in the second quarter of 2009 continued into the third
quarter. Sales and operating profit again rose when compared to the period April to June. Operating profit for
the third quarter was EUR 625 m, exactly the same as the figure for the prior-year period. However, when the
figures for the whole reporting period January to September are compared, the trend is still downward. Sales
in the Gases Division for the nine months to 30 September 2009 were EUR 6.629 bn, 7.4 percent lower than
the figure for the prior-year period of EUR 7.157 bn. On a comparable basis, i.e. after adjusting for exchange
rate effects and also taking into account changes in the price of natural gas and changes to Group structure,
the fall in sales was 6.4 percent. Despite a noticeable increase in volumes since the low point at the beginning
of 2009, customer demand is still below the level achieved in the prior-year period, reflecting the general eco-
nomic environment. Although price trends continued to be positive in the third quarter, they were not yet able
to offset fully the impact of these volume trends.
Sales arising from the Group’s participation in joint ventures, which are not included in Group sales in
accordance with accounting standards, were EUR 227 m in the nine months to 30 September 2009, as against
EUR 515 m for the prior-year period. When making this comparison, it should, however, be noted that, since
October 2008, sales relating to our Australian subsidiary Auscom Holdings Pty (Elgas) have no longer been
accounted for as those of a joint venture but have been fully consolidated.
The operating profit of the Gases Division demonstrates that the measures we have taken to achieve sus-
tainable improvements in processes and increases in productivity are having a growing impact. The figure for
the first nine months of 2009 of EUR 1.763 bn was only 3.1 percent under the comparable prior-year figure of
EUR 1.819 bn, despite the much weaker economic environment. In other words, we have achieved an improve-
ment in the operating margin in our Gases Division of 120 basis points, from 25.4 percent in 2008 to 26.6 per-
cent in 2009. Synergies arising from the BOC acquisition and the accelerated implementation of our HPO pro-
gramme have both contributed towards this positive trend.
After the severe macroeconomic distortions at the beginning of the year, the market environment in our
gases business became increasingly stable in the course of the third quarter. Clear signs of a recovery were to
be seen mainly in the growth markets of the emerging nations: i.e. in regions where we had achieved good mar-
ket positions early on. The trends in the individual regions and product areas were as follows:
In the Western Europe operating segment, sales trends in the third quarter continued to be adversely
affected, as in the first half of 2009, by the substantial weakening of the British pound. As a result of this signif-
icant exchange rate movement, sales for the nine months to September 2009 were EUR 2.801 bn, 10.5 percent
below the figure for the prior-year period of EUR 3.131 bn. On a comparable basis, the decline in sales would
have been a mere 5.4 percent. Operating profit, which was also affected by exchange rate movements, fell by
03Linde Interim Report 2009
JANuARy TO SEpTEmBER 2009 – Group Interim management Report
8.4 percent to EUR 782 m (2008: EUR 854 m). The operating margin in Western Europe was 27.9 percent, exceed-
ing the high figure of 27.3 percent achieved in the prior-year period. This indicates that we have had positive
results from our HPO activities.
The market environment in Western Europe in the third quarter saw a further period of stabilisation, although
there were no signs as yet of a widespread market recovery. If there are to be significant volume increases, the
economic recovery will need to be much stronger.
During the reporting period, take-or-pay clauses in the supply contracts for our on-site business, rental
income for tanks and cylinder gases, and our pricing policy all had a positive impact on our business trends.
In addition, the Healthcare or medical gases business continued to prove robust, in its seamless progression
towards structural growth.
In the Americas operating segment, Linde saw a decline in sales in the nine months to 30 September 2009
of 10.1 percent to EUR 1.485 bn (2008: EUR 1.652 bn). On a comparable basis, sales were 8.3 percent lower
than in the prior-year period. Operating profit fell from EUR 320 m to EUR 316 m, a much smaller drop of only
1.3 percent. The operating margin improved significantly as a result, by 190 basis points to 21.3 percent (2008:
19.4 percent). This substantial increase was mainly due to the impact of natural gas prices in our hydrogen busi-
ness in the region. The positive trend in the margin was also the result of the steps taken to reduce costs and
increase productivity, measures which were already being adopted by the end of 2008 in our US business.
In North America, the economic environment continued to stabilise in the course of the year, with the first
signs of recovery appearing in some industry sectors. We were still able to rely on robust demand from end con-
sumers in the food industry, the energy sector and in healthcare business. In this region too, momentum was
generated by positive price trends.
In South America, volume reductions in the on-site and liquefied gases businesses were offset by volume
increases in the cylinder gas and Healthcare businesses. In this region too, both our pricing policy and the mea-
sures we took to increase productivity and optimise costs had a stabilising effect.
In the Asia & Eastern Europe operating segment, sales in the nine months to 30 September 2009 were
EUR 1.343 bn, 8.0 percent below the figure for the prior-year period of EUR 1.459 bn. On a comparable basis,
the fall in sales was 6.4 percent. However, operating profit of EUR 415 m was almost as high as the figure for
the nine months to 30 September 2008 of EUR 417 m. The operating margin rose as a result by 230 basis points
in the reporting period to 30.9 percent (2008: 28.6 percent). The factors which contributed to this significant
increase in profitability were the cost savings arising from the accelerated implementation of our HPO pro-
gramme and the positive developments in our joint venture activities in China.
Just as in the second quarter, very clear signs of an economic recovery continued to be evident as the year
progressed in the Asia & Eastern Europe operating segment. As a market leader in this region, we benefit to a
considerable extent from increasing demand in the newly-industrialised countries. This can be seen, for exam-
ple, in the improved capacity utilisation of our on-site plants. We have also continued to promote growth in this
segment through selective expansion of our range in the Healthcare product area.
The most rapid recovery in industrial demand is evident among our major customers in China, especially in
the steel sector. In India too, as well as in the other markets of Southern and Eastern Asia, the demand situa-
tion is improving gradually. Recently in these regions, there have also been signs of a very clear rise in poten-
tial investment in new projects. Likewise, this is an indication of the return of confidence in future economic
development.
In Eastern Europe, the signs of an economic recovery are not yet as pronounced. In comparison with the
emerging nations of Asia and South America, our customers are increasing their production rates and therefore
their demand for gases at a fairly slow pace. However, here too we can observe that our capacity utilisation has
continued to improve since the low point in the first quarter. Moreover, on the basis of our leading market posi-
tion and underpinned by the accelerated implementation of our HPO measures, we were also able to maintain
our profitability at a high level in this region, despite general restraint in demand.
In the South Pacific & Africa operating segment, Linde achieved an increase in sales of 8.6 percent to
EUR 1.052 bn for the nine months to 30 September 2009 (2008: EUR 969 m). The consolidation for the first time
of the Australian LPG business Elgas more than offset adverse movements in the exchange rate of the Australian
dollar. On a comparable basis, sales in the reporting period declined by 6.1 percent. Operating profit increased
04 Linde Interim Report 2009
JANuARy TO SEpTEmBER 2009 – Group Interim management Report

by 9.6 percent to EUR 250 m (2008: EUR 228 m), a faster rate of increase than that of sales. The operating mar-
gin rose accordingly from 23.5 percent to 23.8 percent.
The South Pacific region continued to prove robust in the third quarter. We were able to compensate to a sig-
nificant extent for volume reductions in the on-site, liquefied gases and cylinder gas product areas as a result
of positive trends in our rental business, the Healthcare product area and on the pricing side, as well as our cost
initiatives under the HPO programme.
In Africa, the first slight signs of a market recovery were visible in the third quarter, even if volumes were
still far below those in the prior-year period.
In the individual product areas of the Gases Division, business trends were also affected by the challenging
global economic conditions in the first nine months of the year. The trend in the third quarter was positive, com-
pared to the first half-year. On a comparable basis, i.e. after adjusting for exchange rate effects, changes in the
price of natural gas and changes to Group structure, sales in the liquefied gases business in the nine months
to 30 September 2009 fell by 8.7 percent to EUR 1.636 bn (2008: EUR 1.791 bn), while sales in the cylinder gas
business fell by 9.1 percent to EUR 2.713 bn (2008: EUR 2.984 bn). In our tonnage business, we were able to
partially offset the volume reductions thanks to the special form of our long-term supply contracts (take-or-pay
clauses) and new production start-ups. Sales in the reporting period in this product area of EUR 1.513 bn were
4.2 percent below the figure for the prior-year period of EUR 1.579 bn. As expected, the Healthcare product
area steered relatively clear of the weak economic environment, achieving an increase in sales of 5.6 percent
to EUR 767 m (2008: EUR 726 m).
Gases Division
January to September 2009
January to September 2008
in € millionSales Operating
profitmargin
in percentSales Operating
profitmargin
in percent
Western Europe 2,801 782 27.9 3,131 854 27.3
Americas 1,485 316 21.3 1,652 320 19.4
Asia & Eastern Europe 1,343 415 30.9 1,459 417 28.6
South Pacific & Africa 1,052 250 23.8 969 228 23.5
Consolidation – 52 – – – 54 – –
Gases Division 6,629 1,763 26.6 7,157 1,819 25.4
Gases Division
3rd Quarter 2009 3rd Quarter 2008
in € millionSales Operating
profitmargin
in percentSales Operating
profitmargin
in percent
Western Europe 952 276 29.0 1,048 279 26.6
Americas 492 106 21.5 570 114 20.0
Asia & Eastern Europe 466 149 32.0 514 148 28.8
South Pacific & Africa 386 94 24.4 337 84 24.9
Consolidation – 17 – – – 21 – –
Gases Division 2,279 625 27.4 2,448 625 25.5
05Linde Interim Report 2009
JANuARy TO SEpTEmBER 2009 – Group Interim management Report

Engineering Division
In the Engineering Division, Linde achieved sales of EUR 1.677 bn in the nine months to 30 September 2009,
although it was unable to reach the very high level of sales achieved in the nine months to 30 September
2008 of EUR 2.063 bn. This decline is mainly due to the different project structure and state of completion of
projects in the two periods. Operating profit of EUR 145 m was also below the comparable figure for the prior-
year period of EUR 183 m. The operating margin was 8.6 percent, significantly exceeding our target margin of
8 percent which is well above the industry average.
The market environment for the global construction of large-scale plants continues to be characterised by a
marked reluctance by customers to award new projects. Against this background, order intake of EUR 1.514 bn
was, as expected, unable to reach the level achieved in the first nine months of 2008 of EUR 2.295 bn.
The major 1.075 bn US dollar contract from Abu Dhabi for the construction of an olefin plant on the Ruwais
site we were awarded at the end of June by the contract consortium Borouge (a joint venture between the Abu
Dhabi National Oil Corporation and Borealis) is clearly reflected in the analysis of order intake by segment and
region. The greatest proportion of the order intake (64 percent) relates to the olefin plant segment. The air sep-
aration plant segment and the hydrogen and synthesis gas plant segment both contributed 10 percent of order
intake, followed by natural gas plants at 9 percent.
58 percent of the order intake relates to the Middle East region. Europe follows with 17 percent and Asia/
Pacific with 10 percent of orders.
The order backlog at 30 September 2009 was EUR 3.911 bn, which is still a very high level (31 December
2008: EUR 4.436 bn). Most of the current order backlog relates to the air separation plant segment and the olefin
plant segment. As in the first six months of the year, the geographical focus remains the Middle East, where
we are currently executing several major projects. These include the new olefin plant in Ruwais, the Enhanced
Gas Recovery plant in Abu Dhabi which we will operate together with our joint venture partner ADNOC, and the
Gas-to-Liquid project we are executing for our customer Shell in Qatar.
Engineering Division
in € million3rd Quarter
2009 2008
January to September
2009 2008
Sales 564 652 1,677 2,063
Order intake 215 738 1,514 2,295
Order backlog at 30.09./31.12. – – 3,911 4,436
Operating profit 55 57 145 183
Margin in % 9.8 8.7 8.6 8.9
06 Linde Interim Report 2009
JANuARy TO SEpTEmBER 2009 – Group Interim management Report

Engineering Division – Order intake by region
in € million
January to September
2009 in percent 2008 in percent
Europe 260 17.2 732 31.8
North America 88 5.8 190 8.3
South America 105 6.9 68 3.0
Asia/Pacific 145 9.6 598 26.1
Middle East 876 57.9 605 26.4
Africa 40 2.6 102 4.4
Total 1,514 100.0 2,295 100.0
Engineering Division – Order intake by region
in € million3rd Quarter
2009 in percent 2008 in percent
Europe 91 42.3 324 43.9
North America 20 9.3 54 7.3
South America 3 1.4 12 1.6
Asia/Pacific 43 20.0 286 38.8
Middle East 21 9.8 34 4.6
Africa 37 17.2 28 3.8
Total 215 100.0 738 100.0
Engineering Division – Order intake by plant type
in € million
January to September
2009 in percent 2008 in percent
Olefin plants 964 63.7 338 14.7
Natural gas plants 129 8.5 140 6.1
Hydrogen and synthesis gas plants 153 10.1 312 13.6
Air separation plants 145 9.6 1,320 57.5
Other 123 8.1 185 8.1
Total 1,514 100.0 2,295 100.0
Engineering Division – Order intake by plant type
in € million3rd Quarter
2009 in percent 2008 in percent
Olefin plants 23 10.7 114 15.4
Natural gas plants 44 20.5 43 5.8
Hydrogen and synthesis gas plants 71 33.0 128 17.3
Air separation plants 33 15.3 392 53.2
Other 44 20.5 61 8.3
Total 215 100.0 738 100.0
07Linde Interim Report 2009
JANuARy TO SEpTEmBER 2009 – Group Interim management Report

Finance
Cash flow from operating activities in the reporting period rose by 9.5 percent to EUR 1.424 bn (2008:
EUR 1.301 bn). This significant increase is due to both the optimisation of our cost structure and improvements
in our working capital management.
The net cash outflow from investing activities in the nine months to 30 September 2009 was EUR 715 m
(2008: net cash outflow of EUR 716 m). Cash outflows for investments in tangible and intangible assets in
the reporting period, including plants held under leases in accordance with IFRIC 4, were EUR 766 m (2008:
EUR 891 m). Most of these outflows related to new projects in the Gases Division. Cash outflows for investments
in consolidated companies of EUR 60 m relate principally to the acquisition of our subsidiary SIGAS in Saudi Ara-
bia. When comparing the figures with those of the prior-year period, it is necessary to take into account the pro-
ceeds on disposal of non-current assets held for sale of EUR 104 m included in the 2008 figures. These relate
to the purchase price payments for the subsidiary sold in Colombia and the remaining parts of the BOC Edwards
components business – BOC Edwards Pharmaceutical Systems. Net cash inflow (free cash flow before financ-
ing activities) rose significantly in the nine months to 30 September 2009 by 21.2 percent to EUR 709 m (2008:
EUR 585 m). After deducting other financing activities, the net debt repayment was EUR 145 m (2008: net debt
increase of EUR 118 m).
Total assets have increased since the balance sheet date, 31 December 2008, by 1.4 percent or EUR 335 m
to EUR 24.159 bn. Non-current assets rose by EUR 471 m. This increase is mainly the result of investments made
in the reporting period and exchange rate movements. Net financial debt (financial debt less cash and cash
equivalents and securities) which stands at EUR 6.443 bn on 30 September 2009 is now virtually the same as
the figure for net financial debt at 31 December 2008 of EUR 6.423 bn. Exchange rate effects and the valuation
of designated hedging relationships (fair value hedges) have increased net debt by EUR 111 m. Excluding these
effects, net financial debt would have been below the figure for 31 December 2008.
The Linde Group is financed on a long-term basis, as can be seen from the maturity profile of the financial
debt. Of the financial debt of EUR 7.300 bn (31.12.2008: EUR 7.445 bn), EUR 749 m (31.12.2008: EUR 1.290 bn)
is disclosed as current and EUR 6.551 bn (31.12.2008: EUR 6.155 bn) as long-term financial debt. Around 90 per-
cent of the financial debt is repayable after the year 2010. Financial debt repayable within one year is matched
by liquid funds of EUR 840 m and a EUR 2 bn syndicated credit facility available until 2011. This credit facility
will be succeeded by a new two-year EUR 1.6 bn revolving credit line or forward start facility, which will be
available until 2013.
Equity rose by EUR 527 m from EUR 8.249 bn to EUR 8.776 bn. This increase was due primarily to exchange
rate effects and to earnings after tax of EUR 456 m. Movements in actuarial gains and losses on pension provi-
sions and the dividend payment had a negative impact on equity. At 36 percent, the equity ratio was slightly
higher than the figure at 31 December 2008 of 35 percent.
Employees
The number of employees in The Linde Group worldwide at 30 September 2009 was 48,312 (31 Decem-
ber 2008: 51,908). Of this number, 37,933 were employed in the Gases Division and 5,775 in the Engineering
Division. The majority of the 4,604 staff in the Corporate/Other Activities segment are employed by Gist, our
logistics service provider.
08 Linde Interim Report 2009
JANuARy TO SEpTEmBER 2009 – Group Interim management Report

Group – Employees by division
30.09.2009 31.12.2008
Gases Division 37,933 41,109
Engineering Division 5,775 5,951
Corporate/Other Activities 4,604 4,848
Group 48,312 51,908
Gases Division – Employees by operating segment
30.09.2009 31.12.2008
Western Europe 12,927 13,616
Americas 7,261 7,881
Asia & Eastern Europe 11,058 11,735
South Pacific & Africa 6,687 7,877
Total 37,933 41,109
Outlook
Group
The forecasts of the business cycle analysts were generally confirmed by global economic trends in the third
quarter. In the more mature markets of Western Europe and the US, demand and industrial production contin-
ued to stabilise at a relatively low level. Signs are emerging of the very beginning of a slow recovery. In the
newly-industrialised countries, on the other hand, there are much clearer signs of growth, boosted by tar-
geted government aid. Below the line, the leading economic research institutes are nevertheless forecasting
a decline in global gross domestic product (GDP) of around 3 percent for the full year 2009.
Against this background, we continue to assume that we will not be able to achieve the same level of sales
and earnings in the 2009 financial year as in the record year 2008. On the basis of our figures in the nine months
to 30 September 2009 and given the fact that the economic revival is gaining momentum, we continue to expect
our business performance in the second half of 2009 to be better than in the first half of the year.
We will continue to seek to limit as far as possible the decline in Group earnings. Our global orientation, our
relatively stable business model and the extensive measures we have taken to achieve sustainable improve-
ments in processes and to increase efficiency are a good basis for this. We will continue the rigorous implemen-
tation of our integrated HPO programme with undiminished intensity. We continue to expect that the resulting
steady improvement in our productivity will lead to a total reduction in gross costs of between EUR 650 m and
EUR 800 m in the financial years 2009 to 2012.
Gases Division
The improving business performance of our Gases Division in the course of the year is proof that, even in a
difficult market environment, we can reap the benefits of our broad customer structure and our global pres-
ence. The continuing uncertainty in the market environment has therefore not caused us to change our orig-
inal target for the gases business in any way. We want to grow at a more rapid pace than the market and to
continue to increase our productivity.
09Linde Interim Report 2009
JANuARy TO SEpTEmBER 2009 – Group Interim management Report
In the liquefied gases and cylinder gas businesses, due to our good market positions, we assume that the
economic recovery, though it may vary in intensity depending on the region, will result in a corresponding
increase in demand.
In the on-site business, the capacity utilisation of our plants for the full year 2009 will be lower than in the
prior year, despite the fact that production rates are beginning to ramp up again slowly. At the same time, we
will still be able to fall back on a full project pipeline, which will continue to contribute significantly to sales and
earnings in the last quarter of 2009 and will do so to an even greater extent from the 2010 financial year. More-
over, the supply contracts in our on-site business are long-term contracts and are designed to limit the nega-
tive effects of any volume reductions.
In the Healthcare segment, our medical gases business, we are expecting further growth even in the cur-
rent financial year.
Against this background and given the positive trends in the third quarter, we are expecting a better busi-
ness performance in the Gases Division for the second half of 2009 than in the first six months of the year. This
positive trend will, however, not suffice to ensure that sales and earnings for the full year 2009 will reach the
levels achieved in 2008.
Engineering Division
The order backlog for our Engineering Division remains at a very high level at around EUR 3.9 bn, continuing
to provide the basis for a relatively stable business performance in the coming one to two years. However,
the impact of the economic crisis on global large-scale plant construction can be seen from the much lower
level of order intake and the current reluctance of customers to award new projects. Against this background
and given the variation in project structure and the state of completion of projects from year to year, we con-
tinue to assume that we will not be able to achieve the same high level of sales revenue in the Engineering
Division in the 2009 financial year as in 2008. Nevertheless, the target for our operating margin remains at
8 percent.
Irrespective of the continuing economic imponderables, we are in a promising position, given our interna-
tional orientation and high reputation in the four operating segments: olefin plants, natural gas plants, air sep-
aration plants, hydrogen and synthesis gas plants. We are particularly well-placed for investment in new, sus-
tainable energy infrastructure projects and for the creation of additional capacity in the Middle East and in the
emerging nations.
Risk Report
Uncertainty about future global economic trends continues. The decline in demand to be seen around the
world compared to the 2008 financial year as a result of the economic crisis represents a risk for us. In addi-
tion to the drop in sales volumes, the potential loss of new business and an increase in the risk of bad debts
in our operating business due to the increasing inability of our customers to make payments (counterparty
risk) also represents a risk to the Group. The high level of volatility in the financial markets continues to make
it more difficult to arrive at an accurate assessment of the future net assets, financial position and results of
operations of The Linde Group.
With the exception of the drop in sales volumes which has occurred, the risk situation for The Linde Group
has not changed since the 2008 annual report.
10 Linde Interim Report 2009
JANuARy TO SEpTEmBER 2009 – Group Interim management Report
Group income statement
in € million3rd Quarter
2009 2008
January to September
2009 2008
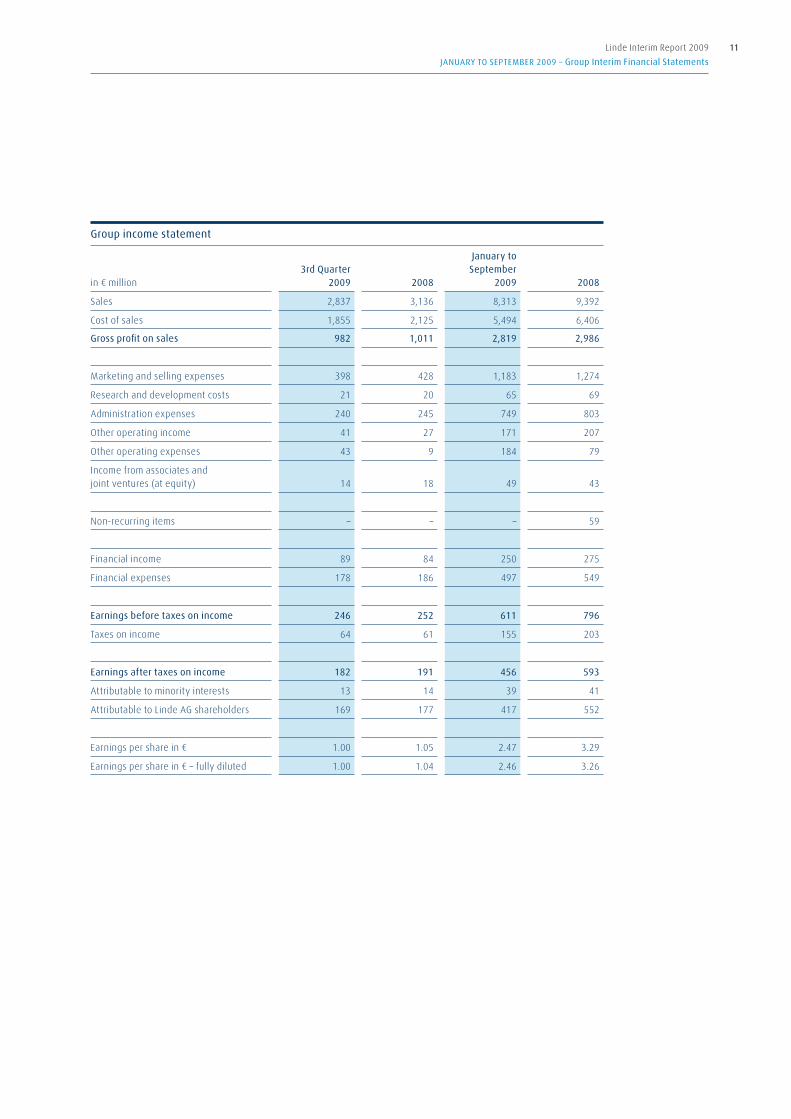
Sales 2,837 3,136 8,313 9,392
Cost of sales 1,855 2,125 5,494 6,406
Gross profit on sales 982 1,011 2,819 2,986
Marketing and selling expenses 398 428 1,183 1,274
Research and development costs 21 20 65 69
Administration expenses 240 245 749 803
Other operating income 41 27 171 207
Other operating expenses 43 9 184 79
Income from associates and joint ventures (at equity) 14 18 49 43
Non-recurring items – – – 59
Financial income 89 84 250 275
Financial expenses 178 186 497 549
Earnings before taxes on income 246 252 611 796
Taxes on income 64 61 155 203
Earnings after taxes on income 182 191 456 593
Attributable to minority interests 13 14 39 41
Attributable to Linde AG shareholders 169 177 417 552
Earnings per share in € 1.00 1.05 2.47 3.29
Earnings per share in € – fully diluted 1.00 1.04 2.46 3.26
11Linde Interim Report 2009
JANuARy TO SEpTEmBER 2009 – Group Interim Financial Statements

Group balance sheet
in € million 30.09.2009 31.12.2008
Assets
Goodwill 7,183 6,893
Other intangible assets 3,269 3,177
Tangible assets 7,343 7,162
Investments in associates and joint ventures (at equity) 540 535
Other financial assets 372 388
Receivables from financial services 621 671
Trade receivables – –
Other receivables and other assets 414 444
Deferred tax assets 226 227
Non-current assets 19,968 19,497
Inventories 1,004 986
Receivables from financial services 78 75
Trade receivables 1,670 1,641
Other receivables and other assets 474 539
Income tax receivables 106 64
Securities 17 20
Cash and cash equivalents 840 1,002
Non-current assets held for sale and disposal groups 2 –
Current assets 4,191 4,327
Total assets 24,159 23,824
12 Linde Interim Report 2009
JANuARy TO SEpTEmBER 2009 – Group Interim Financial Statements

Group balance sheet
in € million 30.09.2009 31.12.2008
Equity and liabilities
Capital subscribed 432 431
Capital reserve 5,091 5,074
Revenue reserves 4,134 4,209
Cumulative changes in equity not recognised through the income statement – 1,305 – 1,842
Total equity excluding minority interests 8,352 7,872
Minority interests 424 377
Total equity 8,776 8,249
Provisions for pensions and similar obligations 1,020 842
Other non-current provisions 409 400
Deferred tax liabilities 1,860 1,889
Financial debt 6,551 6,155
Liabilities from financial services 20 23
Trade payables 4 3
Other non-current liabilities 153 147
Liabilities from income taxes 104 95
Non-current liabilities 10,121 9,554
Other current provisions 1,416 1,482
Financial debt 749 1,290
Liabilities from financial services 10 11
Trade payables 2,094 2,120
Other current liabilities 893 1,029
Liabilities from income taxes 100 89
Current liabilities 5,262 6,021
Total equity and liabilities 24,159 23,824
13Linde Interim Report 2009
JANuARy TO SEpTEmBER 2009 – Group Interim Financial Statements

Group cash flow statement
in € million
January to September
2009 2008
Earnings before taxes on income 611 796
Adjustments to earnings before taxes (on income) to calculate cash flow from operating activities
Amortisation of intangible assets/depreciation of tangible assets 883 899
Write-down of financial assets 4 –
Profit/loss on disposal of non-current assets – 13 – 98
Net interest 207 286
Finance income arising from finance leases in accordance with IFRIC 4/IAS 17 36 39
Income from associates and joint ventures (at equity) – 49 – 48
Distributions/dividends received from operating associates and joint ventures 41 20
Income taxes paid – 236 – 195
Changes in assets and liabilities, adjusted for the effects of changes in Group structure
Change in inventories 23 7
Change in trade accounts receivable 26 – 93
Change in provisions – 76 80
Change in trade payables – 24 – 155
Change in other assets and liabilities – 9 – 237
Cash flow from operating activities 1,424 1,301
Payments for tangible and intangible assets and plants held under leases in accordance with IFRIC 4/IAS 17 – 766 – 891
Payments for investments in consolidated companies – 60 –
Payments for investments in financial assets – 21 – 74
Payments for investments in current financial assets – 88 – 36
Proceeds on disposal of tangible and intangible assets and amortisation of receivables from financial services in accordance with IFRIC 4/IAS 17 110 115
Proceeds on disposal of consolidated companies – 26
Proceeds on disposal of non-current assets held for sale and disposal groups – 104
Proceeds on disposal of financial assets 19 1
Proceeds on disposal of current financial assets 91 39
Cash flow from investing activities – 715 – 716
14 Linde Interim Report 2009
JANuARy TO SEpTEmBER 2009 – Group Interim Financial Statements
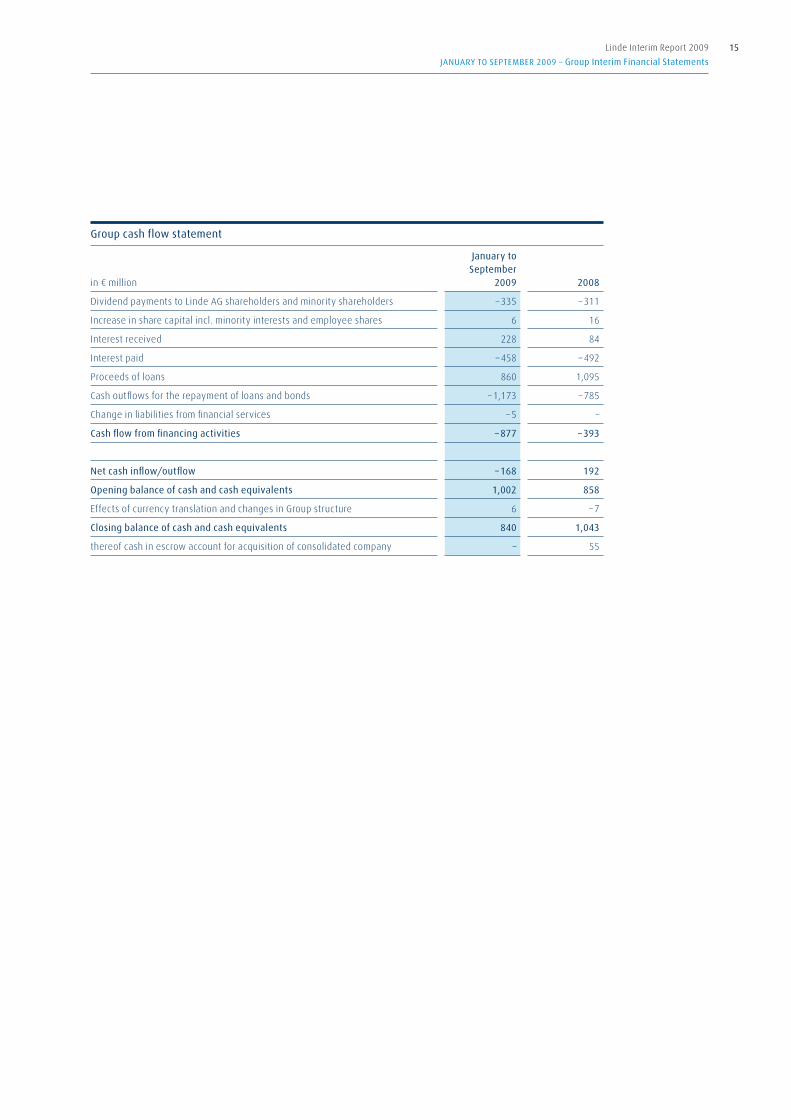
Group cash flow statement
in € million
January to September
2009 2008
Dividend payments to Linde AG shareholders and minority shareholders – 335 – 311
Increase in share capital incl. minority interests and employee shares 6 16
Interest received 228 84
Interest paid – 458 – 492
Proceeds of loans 860 1,095
Cash outflows for the repayment of loans and bonds – 1,173 – 785
Change in liabilities from financial services – 5 –
Cash flow from financing activities – 877 – 393
Net cash inflow/outflow – 168 192
Opening balance of cash and cash equivalents 1,002 858
Effects of currency translation and changes in Group structure 6 – 7
Closing balance of cash and cash equivalents 840 1,043
thereof cash in escrow account for acquisition of consolidated company – 55
15Linde Interim Report 2009
JANuARy TO SEpTEmBER 2009 – Group Interim Financial Statements

Statement of recognised income and expense
in € million
1 January to 30 September
2009
1 January to 30 September
2008
Gain/loss on remeasurement of securities – 1
Gain/loss on remeasurement at fair value of derivative financial instruments 56 – 107
Currency translation differences 488 – 209
Change in actuarial gains/losses on pension provisions – 150 – 314
Change in effect of the limit on a defined benefit asset (asset ceiling under IAS 19.58) – 12 12
Gains and losses recognised directly in equity 382 – 617
Earnings after taxes on income 456 593
Total gains and losses recognised 838 – 24
of which attributable to
Linde AG shareholders 792 – 57
Other shareholders 46 33
16 Linde Interim Report 2009
JANuARy TO SEpTEmBER 2009 – Group Interim Financial Statements

17Linde Interim Report 2009
JANuARy TO SEpTEmBER 2009 – Group Interim Financial Statements
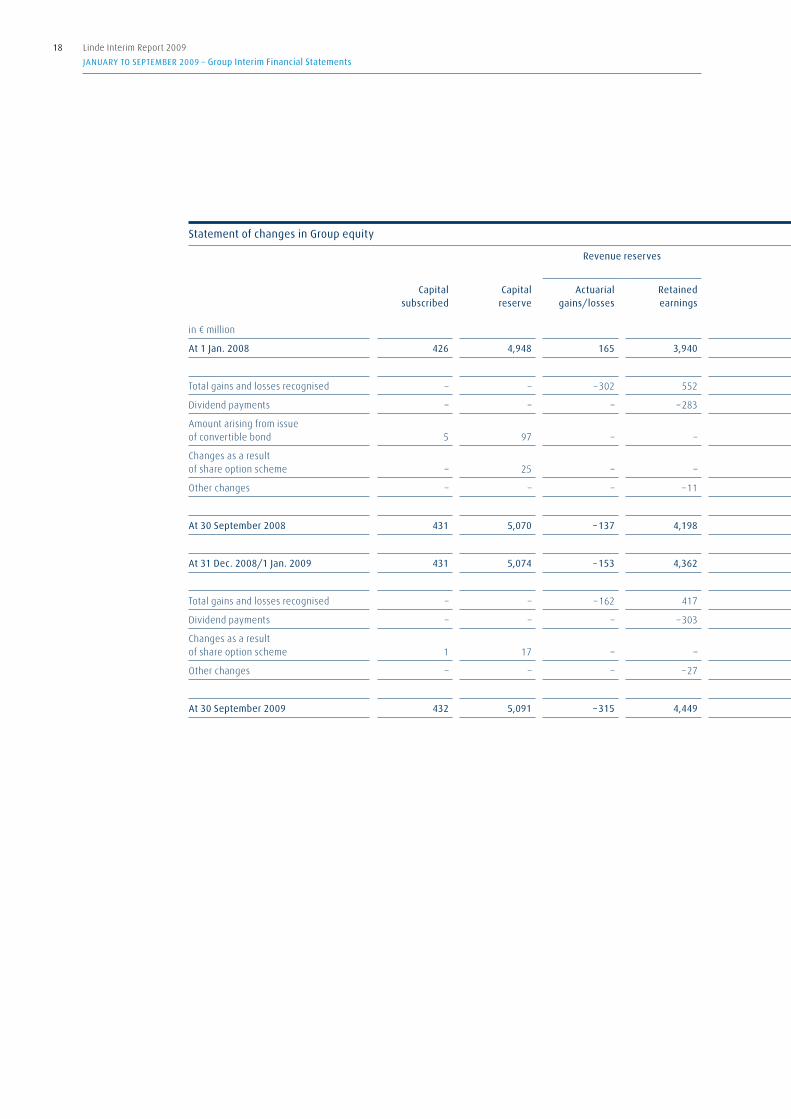
Statement of changes in Group equity
Revenue reserves Cumulative changes in equity not recognised through the income statement
in € million
Capital subscribed
Capital reserve
Actuarial gains/losses
Retained earnings
Currency translation differences
Remeasurement of securities at fair value
Derivative financial
instruments
Total equity excluding
minority interests
minority interests
Total equity
At 1 Jan. 2008 426 4,948 165 3,940 – 905 – 187 8,761 449 9,210
Total gains and losses recognised – – – 302 552 – 201 1 – 107 – 57 33 – 24
Dividend payments – – – – 283 – – – – 283 – 28 – 311
Amount arising from issue of convertible bond 5 97 – – – – – 102 – 102
Changes as a result of share option scheme – 25 – – – – – 25 – 25
Other changes – – – – 11 – – – – 11 – 52 – 63
At 30 September 2008 431 5,070 – 137 4,198 – 1,106 1 80 8,537 402 8,939
At 31 Dec. 2008/1 Jan. 2009 431 5,074 – 153 4,362 – 1,983 5 136 7,872 377 8,249
Total gains and losses recognised – – – 162 417 481 – 56 792 46 838
Dividend payments – – – – 303 – – – – 303 – 32 – 335
Changes as a result of share option scheme 1 17 – – – – – 18 – 18
Other changes – – – – 27 – – – – 27 33 6
At 30 September 2009 432 5,091 – 315 4,449 – 1,502 5 192 8,352 424 8,776
18 Linde Interim Report 2009
JANuARy TO SEpTEmBER 2009 – Group Interim Financial Statements

Statement of changes in Group equity
Revenue reserves Cumulative changes in equity not recognised through the income statement
in € million
Capital subscribed
Capital reserve
Actuarial gains/losses
Retained earnings
Currency translation differences
Remeasurement of securities at fair value
Derivative financial
instruments
Total equity excluding
minority interests
minority interests
Total equity
At 1 Jan. 2008 426 4,948 165 3,940 – 905 – 187 8,761 449 9,210
Total gains and losses recognised – – – 302 552 – 201 1 – 107 – 57 33 – 24
Dividend payments – – – – 283 – – – – 283 – 28 – 311
Amount arising from issue of convertible bond 5 97 – – – – – 102 – 102
Changes as a result of share option scheme – 25 – – – – – 25 – 25
Other changes – – – – 11 – – – – 11 – 52 – 63
At 30 September 2008 431 5,070 – 137 4,198 – 1,106 1 80 8,537 402 8,939
At 31 Dec. 2008/1 Jan. 2009 431 5,074 – 153 4,362 – 1,983 5 136 7,872 377 8,249
Total gains and losses recognised – – – 162 417 481 – 56 792 46 838
Dividend payments – – – – 303 – – – – 303 – 32 – 335
Changes as a result of share option scheme 1 17 – – – – – 18 – 18
Other changes – – – – 27 – – – – 27 33 6
At 30 September 2009 432 5,091 – 315 4,449 – 1,502 5 192 8,352 424 8,776
19Linde Interim Report 2009
JANuARy TO SEpTEmBER 2009 – Group Interim Financial Statements

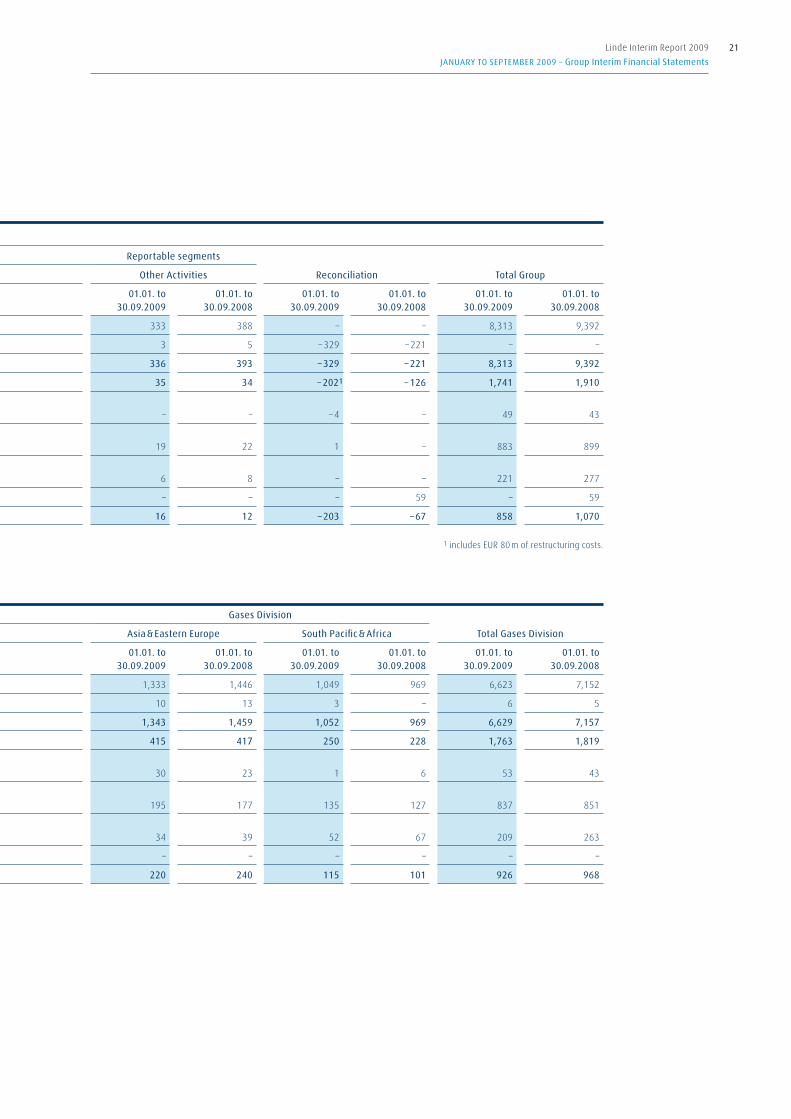
Segment information
Reportable segments Reportable segments
in € million
Total Gases Division Engineering Division Other Activities Reconciliation Total Group
01.01. to 30.09.2009
01.01. to 30.09.2008
01.01. to 30.09.2009
01.01. to 30.09.2008
01.01. to 30.09.2009
01.01. to 30.09.2008
01.01. to 30.09.2009
01.01. to 30.09.2008
01.01. to 30.09.2009
01.01. to 30.09.2008
Sales to third parties 6,623 7,152 1,357 1,852 333 388 – – 8,313 9,392
Sales to other segments 6 5 320 211 3 5 – 329 – 221 – –
Segment sales 6,629 7,157 1,677 2,063 336 393 – 329 – 221 8,313 9,392
Operating profit (before non-recurring items) 1,763 1,819 145 183 35 34 – 2021 – 126 1,741 1,910
of which share of profit/loss from associates/joint ventures (at equity) 53 43 – – – – – 4 – 49 43
Amortisation of intangible assets and depreciation of tangible assets 837 851 26 26 19 22 1 – 883 899
of which amortisation of fair value adjustments identified in the course of purchase price allocation 209 263 6 6 6 8 – – 221 277
Non-recurring items – – – – – – – 59 – 59
EBIT (earnings before interest and tax) 926 968 119 157 16 12 – 203 – 67 858 1,070
1 includes EUR 80 m of restructuring costs.
Gases Division Gases Division
Western Europe Americas Asia & Eastern Europe South pacific & Africa Total Gases Division
in € million01.01. to
30.09.200901.01. to
30.09.200801.01. to
30.09.200901.01. to
30.09.200801.01. to
30.09.200901.01. to
30.09.200801.01. to
30.09.200901.01. to
30.09.200801.01. to
30.09.200901.01. to
30.09.2008
Sales to third parties 2,789 3,113 1,452 1,624 1,333 1,446 1,049 969 6,623 7,152
Sales to other segments 12 18 33 28 10 13 3 – 6 5
Segment sales 2,801 3,131 1,485 1,652 1,343 1,459 1,052 969 6,629 7,157
Operating profit (before non-recurring items) 782 854 316 320 415 417 250 228 1,763 1,819
of which share of profit/loss from associates/joint ventures – – 22 14 30 23 1 6 53 43
Amortisation of intangible assets and depreciation of tangible assets 294 326 213 221 195 177 135 127 837 851
of which amortisation of fair value adjustments identified in the course of purchase price allocation 43 63 80 94 34 39 52 67 209 263
Non-recurring items – – – – – – – – – –
EBIT (earnings before interest and tax) 488 528 103 99 220 240 115 101 926 968
20 Linde Interim Report 2009
JANuARy TO SEpTEmBER 2009 – Group Interim Financial Statements
Segment information
Reportable segments Reportable segments
in € million
Total Gases Division Engineering Division Other Activities Reconciliation Total Group
01.01. to 30.09.2009
01.01. to 30.09.2008
01.01. to 30.09.2009
01.01. to 30.09.2008
01.01. to 30.09.2009
01.01. to 30.09.2008
01.01. to 30.09.2009
01.01. to 30.09.2008
01.01. to 30.09.2009
01.01. to 30.09.2008
Sales to third parties 6,623 7,152 1,357 1,852 333 388 – – 8,313 9,392
Sales to other segments 6 5 320 211 3 5 – 329 – 221 – –
Segment sales 6,629 7,157 1,677 2,063 336 393 – 329 – 221 8,313 9,392
Operating profit (before non-recurring items) 1,763 1,819 145 183 35 34 – 2021 – 126 1,741 1,910
of which share of profit/loss from associates/joint ventures (at equity) 53 43 – – – – – 4 – 49 43
Amortisation of intangible assets and depreciation of tangible assets 837 851 26 26 19 22 1 – 883 899
of which amortisation of fair value adjustments identified in the course of purchase price allocation 209 263 6 6 6 8 – – 221 277
Non-recurring items – – – – – – – 59 – 59
EBIT (earnings before interest and tax) 926 968 119 157 16 12 – 203 – 67 858 1,070
1 includes EUR 80 m of restructuring costs.
Gases Division Gases Division
Western Europe Americas Asia & Eastern Europe South pacific & Africa Total Gases Division
in € million01.01. to
30.09.200901.01. to
30.09.200801.01. to
30.09.200901.01. to
30.09.200801.01. to
30.09.200901.01. to
30.09.200801.01. to
30.09.200901.01. to
30.09.200801.01. to
30.09.200901.01. to
30.09.2008
Sales to third parties 2,789 3,113 1,452 1,624 1,333 1,446 1,049 969 6,623 7,152
Sales to other segments 12 18 33 28 10 13 3 – 6 5
Segment sales 2,801 3,131 1,485 1,652 1,343 1,459 1,052 969 6,629 7,157
Operating profit (before non-recurring items) 782 854 316 320 415 417 250 228 1,763 1,819
of which share of profit/loss from associates/joint ventures – – 22 14 30 23 1 6 53 43
Amortisation of intangible assets and depreciation of tangible assets 294 326 213 221 195 177 135 127 837 851
of which amortisation of fair value adjustments identified in the course of purchase price allocation 43 63 80 94 34 39 52 67 209 263
Non-recurring items – – – – – – – – – –
EBIT (earnings before interest and tax) 488 528 103 99 220 240 115 101 926 968
21Linde Interim Report 2009
JANuARy TO SEpTEmBER 2009 – Group Interim Financial Statements

[1] General accounting policies
The condensed Group interim financial statements of Linde AG for the nine months ended 30 September
2009 have been drawn up in accordance with International Financial Reporting Standards (IFRS) applicable to
interim financial reporting, as adopted by the European Union.
A review of the financial statements included in the condensed Group interim financial statements has been
performed by KPMG AG Wirtschaftsprüfungsgesellschaft.
We have used the same accounting policies in the condensed Group interim financial statements as those
used to prepare the Group financial statements for the year ended 31 December 2008 and have also applied
IAS 34 Interim Financial Reporting. Since 31 December 2008, actuarial gains and losses relating to pension pro-
visions have been allocated directly to revenue reserves. This ensures that in future periods these amounts will
not be transferred to profit or loss. Since 1 January 2009, IAS 1 (Revised) Presentation of Financial Statements
has been applied. This has resulted in the separate disclosure of the statement of changes in Group equity as a
primary financial statement. During the reporting period, the following revisions or amendments to standards
have been applied for the first time: the revised IFRS 3 Business Combinations, the amendments to IAS 27 Con-
solidated and Separate Financial Statements, the amendments to IAS 39 Financial Instruments: Recognition and
Measurement: Eligible Hedged Items, the amendments to IAS 39 Reclassification of Financial Assets: Effective
Date and Transition and IFRIC 15 Agreements for the Construction of Real Estate. None of these changes had an
impact on the net assets, financial position or results of operations of The Linde Group.
In addition to the changes mentioned above, the following new or revised standards and interpretations
have been issued by the IASB and IFRIC. These have not been applied in the condensed Group interim financial
statements for the nine months ended 30 September 2009, as they are either not yet mandatory or have not
yet been adopted by the European Commission:
3 Amendments to IFRS 7 Improving Disclosures about Financial Instruments
3 Improvements to International Financial Reporting Standards (2009)
3 Amendments to IFRIC 9 and IAS 39 Embedded Derivatives
3 IFRIC 17 Distributions of Non-Cash Assets to Owners
3 IFRIC 18 Transfer of Assets from Customers
The impact of the standards and interpretations which have not been applied on the presentation of the net
assets, financial position and results of operations of The Linde Group is not expected to be significant overall.
[2] Changes in Group structure
The condensed Group interim financial statements comprise Linde AG and all the companies over which Linde
AG exercises direct or indirect control by virtue of its power to govern their financial and operating policies.
Additional Comments
22
JANuARy TO SEpTEmBER 2009 – Additional Comments
Linde Interim Report 2009

The companies included in the condensed Group interim financial statements of The Linde Group comprise
the following:
Changes in the base of consolidation
As at31.12.2008
Additions Disposals As at30.09.2009
Consolidated subsidiaries 527 9 27 509
of which within Germany 25 3 2 26
of which outside Germany 502 6 25 483
Other investments 95 10 19 86
of which within Germany 3 4 4 3
of which outside Germany 92 6 15 83
Companies accounted for using the equity method 59 – 1 58
of which within Germany – – – –
of which outside Germany 59 – 1 58
[3] Acquisitions
Saudi Industrial Gas Co. Ltd, Al-Khobar, Saudi-Arabia
On 13 May 2008, The Linde Group acquired 51 percent of the shares in the Saudi Arabian industrial gases
company SIGAS (Saudi Industrial Gas Co. Ltd). The transaction was completed on 17 January 2009 following
receipt of approval from the relevant Saudi Arabian regulatory authorities. The family-owned company SIGAS
is the second largest industrial gases company in Saudi Arabia. The company was allocated to the Asia & East-
ern Europe operating segment.
provisional differences arising on the SIGAS acquisition
in € million SIGAS
purchase cost in accordance with IFRS 3 68
Share of net assets at book value 16
provisional difference before purchase price allocation under IFRS 3 52
Customer relationships 32
Brand name –
Other intangible assets –
Air separation plants 3
Land and buildings 2
Other tangible assets 3
Investments in associates –
Other assets and other liabilities –
Deferred taxes – 5
Minority interests – 17
provisional goodwill at 17 January 2009 34
23
JANuARy TO SEpTEmBER 2009 – Additional Comments
Linde Interim Report 2009

Impact of acquisition of SIGAS on net assets – Opening balance at 17 January 2009
in € million Book value Adjustment Fair value
Non-current assets 8 40 48
Inventories 12 – 12
Cash and cash equivalents 9 – 9
Non-current assets held for sale and disposal groups 2 – 2
Other current assets 11 – 11
Equity 16 18 34
Minority interests 16 17 33
Provisions for pensions and similar obligations – – –
Other non-current liabilities – – –
Current liabilities 10 5 15
Liabilities directly related to non-current assets held for sale and disposal groups – – –
Impact of acquisition on results of operations of The Linde Group from the date of acquisition
in € million SIGAS
Sales 35
Cost of sales 18
Gross profit on sales 17
Other income and other expenses – 8
Operating earnings (EBIT) 9
Financial result –
Earnings before taxes on income (EBT) 9
Taxes on income –1
Earnings after taxes on income 8
Attributable to minority interests 4
Attributable to Linde AG shareholders 4
[4] Foreign currency translation
The financial statements of companies outside the European Currency Union are translated in accordance with
the functional currency concept. For all our companies, we translate items in the balance sheet using the spot
rate and items in the income statement using the average rate.
24
JANuARy TO SEpTEmBER 2009 – Additional Comments
Linde Interim Report 2009

The main exchange rates used are as follows:
Exchange rate € 1 = ISO code mid-rate on balance sheet date Annual average rate January to September
30.09.2009 31.12.2008 2009 2008
Argentina ARS 5.62450 4.82870 5.065720 4.728560
Australia AUD 1.66000 1.97710 1.823470 1.669440
Brazil BRL 2.61650 3.23570 2.838180 2.564500
Canada CAD 1.57480 1.70250 1.594080 1.550290
China CNY 9.99240 9.54640 9.340160 10.633730
Czech Republic CZK 25.21500 26.85400 26.603680 24.823840
Hungary HUF 270.52000 265.66000 283.391390 247.745910
Malaysia MYR 5.07190 4.82750 4.868830 4.958870
Norway NOK 8.49270 9.72610 8.847280 7.991220
Poland PLN 4.22490 4.14830 4.376080 3.427830
South Africa ZAR 10.81720 13.27610 11.859860 11.727220
South Korea KRW 1,724.44000 1,765.67000 1,788.353330 1,541.385180
Sweden SEK 10.21850 10.93280 10.708570 9.410560
Switzerland CHF 1.50920 1.49340 1.510440 1.607580
Turkey TRY 2.17230 2.15490 2.148510 1.868550
UK GBP 0.90970 0.95570 0.886710 0.781680
USA USD 1.46390 1.39800 1.367110 1.522310
[5] Non-recurring items
In 2008, the remaining parts of the BOC Edwards components business – BOC Edwards Pharmaceutical
Systems – were sold.
In addition, the sale of the subsidiary Cryogas S.A., Colombia, to Indura S.A., Chile, at an enterprise value of
EUR 90 m was completed in the prior-year period. As a result of these two transactions, a profit arose on decon-
solidation of EUR 59 m.
[6] Non-current assets held for sale and discontinued operations
Non-current assets held for sale and related liabilities in the reporting period comprise assets arising from the
acquisition of SIGAS (see Note [3]). The principal asset is a piece of land.
25
JANuARy TO SEpTEmBER 2009 – Additional Comments
Linde Interim Report 2009

[7] pension obligations
The actuarial valuation of pension obligations is based on the projected unit credit method set out in IAS 19
Employee Benefits. This method takes into account not only vested future benefits and known pensions at the
balance sheet date, but also expected future increases in salaries and pensions. The calculation of the provi-
sion is determined using actuarial reports. Actuarial gains and losses are recognised immediately in equity.
Since the 2008 Group financial statements, actuarial gains and losses relating to pension provisions have been
allocated directly to revenue reserves. This ensures that in future periods these amounts will not be trans-
ferred to profit or loss. The prior-year figures have been adjusted in the balance sheet and in the statement
of changes in Group equity to ensure consistent disclosure.
In the quarterly financial reports, a competent estimate of the pension obligation is made, based on trends
in actuarial assumptions and taking into account any exceptional effects in the current quarter.
At 30 September 2009, there were changes in the assumptions on which the pension obligations were based
and in the measurement at fair value of the plan assets, which led to a decrease in equity of EUR 162 m (after
deferred tax) compared to the figure at 31 December 2008.
[8] Financial debt
In the second and third quarters, Linde Finance B. V. issued bonds/private placements totalling around
EUR 250 m with maturity periods of three to five years. All these issues formed part of the Debt Issuance
Programme and are guaranteed by Linde AG.
Over the same period of time, bonds denominated in EUR, GBP and JPY with a total volume of around
EUR 450 m were redeemed on schedule.
[9] Earnings per share
in € million
January toSeptember
2009 2008
Earnings after taxes on income attributable to Linde AG shareholders 417 552
Plus: increase in profit due to dilutive effect of convertible bond – 1
Profit after adjusting for dilutive effects 417 553
Shares in 000s
Weighted average number of shares outstanding 168,530 167,587
Dilution as a result of share option scheme 972 1,325
Effect of dilutive convertible bond – 716
Weighted average number of shares outstanding – fully diluted 169,502 169,628
Earnings per share in € 2.47 3.29
Earnings per share in € – fully diluted 2.46 3.26
26
JANuARy TO SEpTEmBER 2009 – Additional Comments
Linde Interim Report 2009
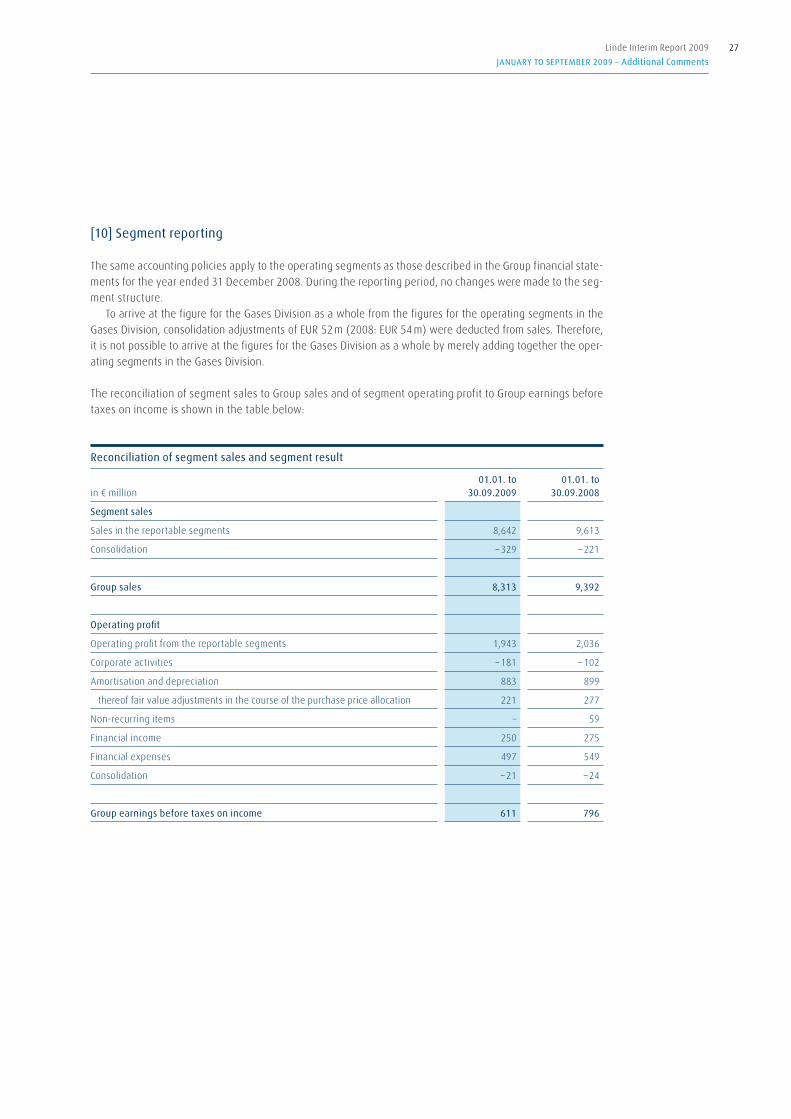
[10] Segment reporting
The same accounting policies apply to the operating segments as those described in the Group financial state-
ments for the year ended 31 December 2008. During the reporting period, no changes were made to the seg-
ment structure.
To arrive at the figure for the Gases Division as a whole from the figures for the operating segments in the
Gases Division, consolidation adjustments of EUR 52 m (2008: EUR 54 m) were deducted from sales. Therefore,
it is not possible to arrive at the figures for the Gases Division as a whole by merely adding together the oper-
ating segments in the Gases Division.
The reconciliation of segment sales to Group sales and of segment operating profit to Group earnings before
taxes on income is shown in the table below:
Reconciliation of segment sales and segment result
in € million01.01. to
30.09.200901.01. to
30.09.2008
Segment sales
Sales in the reportable segments 8,642 9,613
Consolidation – 329 – 221
Group sales 8,313 9,392
Operating profit
Operating profit from the reportable segments 1,943 2,036
Corporate activities – 181 – 102
Amortisation and depreciation 883 899
thereof fair value adjustments in the course of the purchase price allocation 221 277
Non-recurring items – 59
Financial income 250 275
Financial expenses 497 549
Consolidation – 21 – 24
Group earnings before taxes on income 611 796
27
JANuARy TO SEpTEmBER 2009 – Additional Comments
Linde Interim Report 2009
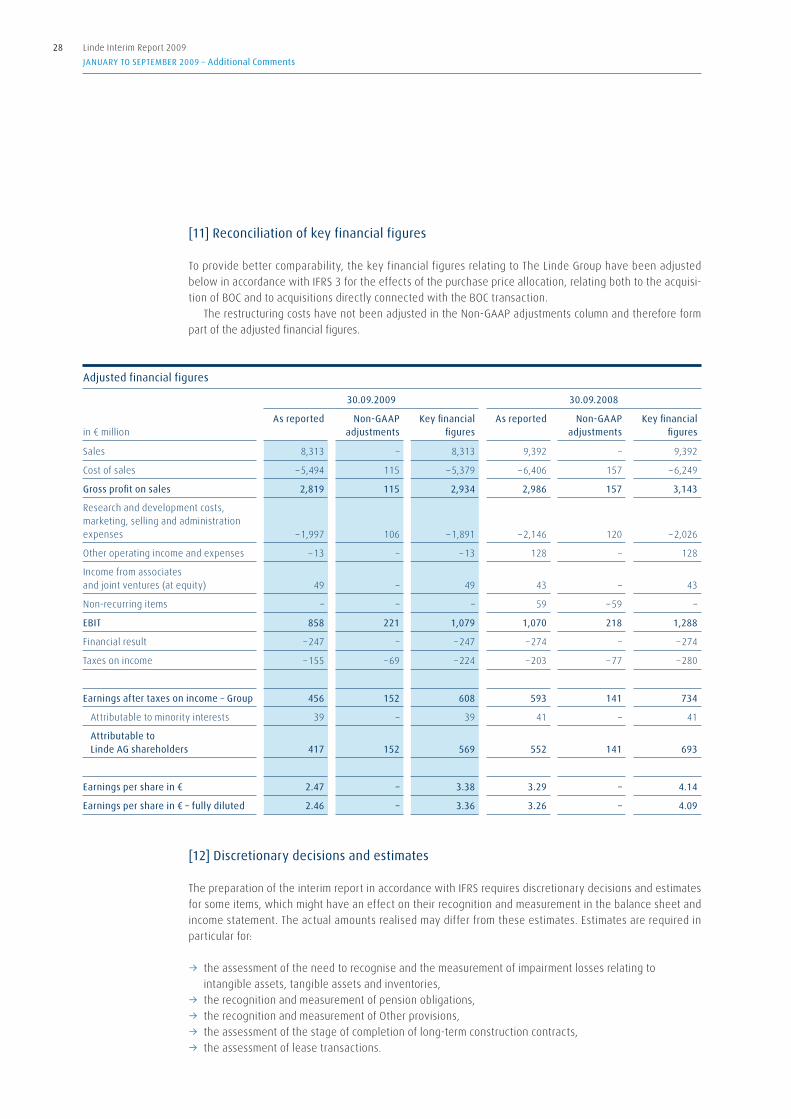
[11] Reconciliation of key financial figures
To provide better comparability, the key financial figures relating to The Linde Group have been adjusted
below in accordance with IFRS 3 for the effects of the purchase price allocation, relating both to the acquisi-
tion of BOC and to acquisitions directly connected with the BOC transaction.
The restructuring costs have not been adjusted in the Non-GAAP adjustments column and therefore form
part of the adjusted financial figures.
[12] Discretionary decisions and estimates
The preparation of the interim report in accordance with IFRS requires discretionary decisions and estimates
for some items, which might have an effect on their recognition and measurement in the balance sheet and
income statement. The actual amounts realised may differ from these estimates. Estimates are required in
particular for:
3 the assessment of the need to recognise and the measurement of impairment losses relating to
intangible assets, tangible assets and inventories,
3 the recognition and measurement of pension obligations,
3 the recognition and measurement of Other provisions,
3 the assessment of the stage of completion of long-term construction contracts,
3 the assessment of lease transactions.
Adjusted financial figures
30.09.2009 30.09.2008
in € millionAs reported Non-GAAp
adjustmentsKey financial
figuresAs reported Non-GAAp
adjustmentsKey financial
figures
Sales 8,313 – 8,313 9,392 – 9,392
Cost of sales – 5,494 115 – 5,379 – 6,406 157 – 6,249
Gross profit on sales 2,819 115 2,934 2,986 157 3,143
Research and development costs, marketing, selling and administration expenses – 1,997 106 – 1,891 – 2,146 120 – 2,026
Other operating income and expenses – 13 – – 13 128 – 128
Income from associates and joint ventures (at equity) 49 – 49 43 – 43
Non-recurring items – – – 59 – 59 –
EBIT 858 221 1,079 1,070 218 1,288
Financial result – 247 – – 247 – 274 – – 274
Taxes on income – 155 – 69 – 224 – 203 – 77 – 280
Earnings after taxes on income – Group 456 152 608 593 141 734
Attributable to minority interests 39 – 39 41 – 41
Attributable to Linde AG shareholders 417 152 569 552 141 693
Earnings per share in € 2.47 – 3.38 3.29 – 4.14
Earnings per share in € – fully diluted 2.46 – 3.36 3.26 – 4.09
28
JANuARy TO SEpTEmBER 2009 – Additional Comments
Linde Interim Report 2009
Any change in the key factors which are applied in the impairment review of goodwill may possibly result in
higher or lower impairment losses or no impairment losses at all being recognised.
The obligation arising from defined benefit commitments is determined on the basis of actuarial assump-
tions. Any change in the assumptions would have no effect on earnings, as actuarial gains and losses are rec-
ognised directly in equity.
The recognition and measurement of Other provisions are based on the assessment of the probability of an
outflow of resources to settle the obligation, and on past experience and circumstances known at the balance
sheet date. The actual amount utilised may therefore differ from the figure set aside in the balance sheet under
Other provisions.
The assessment of the stage of completion of long-term construction contracts is based on the percentage
of completion method, subject to certain conditions being met. The stage of completion of the contract is deter-
mined on the basis of the proportion that contract costs incurred for work performed to date bear to the esti-
mated total contract costs.
Discretionary decisions for lease transactions are required to be made, for example, in assessing whether a
transfer of substantially all the risks and rewards incident to ownership of an asset has taken place.
[13] Significant events after the balance sheet date
On 27 October 2009, the Linde Group announced that it will build a state-of-the-art air separation unit (ASU)
at Tata Steel Ltd’s plant in Jamshedpur, India, which will produce 2,550 tons per day (tpd). Tata Steel is one
of the world’s leading steelmakers. Once it has been commissioned in early 2012, this will be the largest air
separation plant in India and one of Linde’s largest in Asia. The investment in the new ASU is approximately
EUR 85 m, bringing Linde’s total investment in India over the last three years to around EUR 285 m.
The Linde Group has signed a long-term contract relating to this project with Tata Steel Ltd for the supply
of more than 4,000 tpd of gaseous oxygen, nitrogen and argon. The new ASU will meet the rising demand for
gases created by the current expansion of Tata’s steelworks in Jamshedpur in north-eastern India, increasing its
steelmaking capacity to 10 million tons per annum. Under the agreement, Linde will also acquire and operate
three existing ASUs, previously operated by Tata Steel itself to supply gases to the steelworks in Jamshedpur. In
addition to meeting Tata Steel’s air gases requirements, the new plant will also produce liquid products to meet
the growth in merchant markets throughout India.
Apart from the event referred to above, there have been no significant events for The Linde Group between
the end of the reporting period on 30 September 2009 and the publication deadline for these condensed Group
interim financial statements.
Munich, 29 October 2009
Professor Dr Wolfgang Reitzle Georg Denoke
Chief Executive Officer Member of the Executive Board
of Linde AG of Linde AG
Dr Aldo Belloni J. Kent Masters
Member of the Executive Board Member of the Executive Board
of Linde AG of Linde AG
29
JANuARy TO SEpTEmBER 2009 – Additional Comments
Linde Interim Report 2009

To Linde AG, munich
We have reviewed the condensed interim consolidated financial statements of Linde AG, Munich – compris-
ing the balance sheet, income statement, cash flow statement, statement of recognised income and expense,
statement of changes in Group equity and selected explanatory notes – together with the interim Group man-
agement report of Linde AG, Munich, for the period from 1 January to 30 September 2009 that are part of the
quarterly financial report according to § 37x (3) of the German Securities Trading Act (WpHG). The preparation
of the condensed interim consolidated financial statements in accordance with those IFRS applicable to interim
financial reporting as adopted by the European Union, and of the interim Group management report, in accor-
dance with the requirements of the WpHG applicable to interim Group management reports, is the responsi-
bility of the company’s management. Our responsibility is to issue a report on these condensed interim con-
solidated financial statements and on the interim Group management report based on our review.
We conducted our review of the condensed interim consolidated financial statements and the interim Group
management report in accordance with German generally accepted standards for the review of financial state-
ments promulgated by the Institut der Wirtschaftsprüfer e. V. (IDW) and in supplementary compliance with the
International Standard on Review Engagements 2410 (ISRE 2410). Those standards require that we plan and
conduct the review so that we can preclude through critical evaluation, with a certain level of assurance, that
the condensed interim consolidated financial statements have not been prepared, in material aspects, in accor-
dance with the IFRS applicable to interim financial reporting as adopted by the European Union, and that the
interim Group management report has not been prepared, in material aspects, in accordance with the require-
ments of the WpHG applicable to interim Group management reports. A review is limited primarily to inquiries
of company employees and analytical assessments and therefore does not provide the assurance attainable in a
financial statement audit. Since, in accordance with our engagement, we have not performed a financial state-
ment audit, we cannot issue an auditors’ report.
Based on our review, no matters have come to our attention that cause us to believe that the condensed
interim consolidated financial statements have not been prepared, in all material respects, in accordance with
the IFRS applicable to interim financial accounting, as adopted by the European Union, or that the interim Group
management report has not been prepared, in material respects, in accordance with the requirements of the
WpHG applicable to interim Group management reports.
Munich, 29 October 2009
KPMG AG
Wirtschaftsprüfungsgesellschaft
Harald v. Heynitz Günter Nunnenkamp
Wirtschaftsprüfer Wirtschaftsprüfer
German Public Auditor German Public Auditor
Review Report
30 Linde Interim Report 2009
JANuARy TO SEpTEmBER 2009 – Review Report

To the best of our knowledge and belief, and in accordance with the applicable accounting principles for
interim reporting, the condensed interim consolidated financial statements give a true and fair view of the
assets, liabilities, financial position and profit or loss of the Group, and the interim Group management report
includes a fair review of the development and performance of the business and the position of the Group,
together with a description of the principal opportunities and risks associated with the expected develop-
ment of the Group in the remaining part of the financial year.
Munich, 29 October 2009
Professor Dr Wolfgang Reitzle Georg Denoke
Chief Executive Officer Member of the Executive Board
of Linde AG of Linde AG
Dr Aldo Belloni J. Kent Masters
Member of the Executive Board Member of the Executive Board
of Linde AG of Linde AG
Responsibility Statement
31Linde Interim Report 2009
JANuARy TO SEpTEmBER 2009 – Responsibility Statement
Imprint Financial Calendar
published by
Linde AG
Klosterhofstrasse 1
80331 Munich
Germany
Design
Peter Schmidt Group, Hamburg
Text
Linde AG
production and typesetting
Brand Implementation GmbH, Hamburg
printed by
Offsetdruck Raff, Riederich
Contact Details
Linde AG
Klosterhofstrasse 1
80331 Munich
Germany
Phone +49.89.35757-01
Fax +49.89.35757-1075
www.linde.com
Communications
Phone +49.89.35757-1321
Fax +49.89.35757-1398
E-mail [email protected]
Investor Relations
Phone +49.89.35757-1321
Fax +49.89.35757-1398
E-mail [email protected]
This report is available in both German and English
and can be downloaded from our website at
www.linde.com.
Additional copies of the report and further
information about Linde can be obtained from
us free of charge.
Autumn press Conference
2 November 2009
Linde AG, Carl von Linde Haus, Munich
Interim Report
January to September 2009
2 November 2009
Annual General meeting 2010
4 May 2010, 10 a. m.
International Congress Centre Munich
32 Linde Interim Report 2009
JANuARy TO SEpTEmBER 2009 – Imprint | Financial Calendar | Contact Details


Published by
Linde AGKlosterhofstrasse 1
80331 munich
Germany
phone +49.89.35757-01
Fax +49.89.35757-1075
www.linde.com