linalool, a plant derived monoterpene … · changes, improved renal function and reduced lipid...
TRANSCRIPT

Key words: diabetic nephropathy, glycation, linalool, oxidative stress, proinflammatory cytokines
SUMMARY Linalool (LIN), a monoterpene alcohol, is a majorvolatile component of coriander seeds, which istraditionally known to possess antidiabetic potential.The present study investigated whether LIN canattenuate diabetes and prevent diabetes-inducedchanges in rat kidney. Diabetic rats were treated withLIN (25 mg/kg b.w.) for 45 days, after which plasmachemistry, proinflammatory cytokines, oxidative stressparameters, kidney function and the expression levelsof transforming growth factor-β1 (TGF-β1), tumornecrosis factor-α (TNF-α) and nuclear factor kappa B(NF-қB) were measured. The ability of LIN to improveglucose utilization in the normal rat diaphragm in thepresence and absence of insulin and its antiglycationproperty were monitored in vitro. LIN-treated diabeticrats showed decreased cytokine levels and oxidativechanges, improved renal function and reduced lipidlevels in kidney as compared to untreated diabetic
rats. LIN also rescued the kidney from inflammation bydecreasing the expression of TGF-β1, TNF-α and NF-қB mRNA levels. Moreover, the histologicobservations evidenced that LIN effectively improvedstructural integrity of the kidney. LIN enhanced theutilization of glucose in the rat diaphragm andprevented glycation of the model protein bovine serumalbumin in vitro in a dose-dependent manner. Thesefindings demonstrate that LIN can attenuate the risk ofdiabetic nephropathy secondary to reduction inhyperglycemia.
INTRODUCTION
Hyperglycemia, the hallmark of diabetes, is believed
to generate reactive oxygen species (ROS) through the
activation of polyol pathway, hexosamine pathway,
advanced glycation endproduct (AGE) formation and
activation of protein kinase C signaling that eventually
lead to oxidative stress and microvascular compli -
cations in several organs (1). Supra physio logical
levels of glucose are notorious to provoke these
changes in the kidney causing diabetic nephropathy
(DN), since the entry of glucose in the kidney is not
regulated by insulin (2). Besides, growing evidence
suggest that elevation in circulating lipids may also
Department of Biochemistry and Biotechnology, Faculty of Science, Annamalai University, Annamalainagar 608 002, India
Original Research ArticleReceived: October 11, 2011
Accepted: December 1, 2011
LINALOOL, A PLANT DERIVED MONOTERPENE ALCOHOL,
RESCUES KIDNEY FROM DIABETES-INDUCED
NEPHROPATHIC CHANGES VIA BLOOD GLUCOSE
REDUCTION
Balasubramaniam Deepa, Carani Venkatraman Anuradha
Corresponding author: Dr. C. V. Anuradha Professor, Department ofBiochemistry and Biotechnology Faculty of Sience Annamalai University,India
E-mail: [email protected]
Diabetologia Croatica 40-4, 2011 121

contribute to renal disease progression. A correlation
between the progression of renal disease and
dyslipidemia in diabetic subjects has been noted (3).
The development of DN involves various cell types
of kidney such as podocytes of glomeruli, mesangial
and endothelial cells, tubular epithelial cells,
interstitial cells, and interstitial fibroblasts. DN is a
gradual process that starts with hyperfiltration and
microalbuminuria followed by deterioration of renal
function and changes in the structure of glomeruli and
tubulointerstitial compartments (4). The changes
include hyperplasia and hypertrophy of various cell
types of the glomeruli and tubules, thickening of
glomerular and tubular basement membrane, and
tubulointerstital and mesangial expansion (5). The
mechanisms responsible are suggested to be
hyperglycemia-induced ROS generation of AGEs,
activation of proinflammatory cascades and
stimulation of mesangial cells to produce extracellular
matrix proteins (ECM) (6).
Recently, cytokines have attracted most attention
among all pathogenic factors related to kidney disease.
Proinflammatory cytokines are a group of pharma -
cologically active, low molecular weight polypeptides
that act as mediators of diverse inflammatory reactions
contributing to DN. Among the cytokines, tumor
necrosis factor-α (TNF-α) can promote local ROS
generation resulting in alterations in glomerular
permeability leading to albuminuria (7). There is
enough evidence that serum and urinary TNF-α levels
are significantly upregulated in various renal diseases
including DN (8). More recent studies in diabetic
patients demonstrate significant association between
DN and interleukin-6 (IL-6), another proinflammatory
cytokine. IL-6 mediates glomerular basement
membrane thickening, a crucial lesion of DN, and is a
strong predictor of renal disease progression (9).
Transforming growth factor β1 (TGF-β1), a pro-
sclerotic cytokine, is an important player in the
progression of DN. Stimulation of TGF-β1 and
upregulation of type II TGF-β receptor promote renal
deposition of extracellular matrix components like
collagen I, collagen IV and fibronectin, and stimulate
hypertrophy of mesangial cells inducing renal fibrosis
and glomerulosclerosis (10). TGF-β1 level is shown to
be elevated in animal models of diabetic kidney
disease (11).
Nuclear factor қB (NF-қB), an ubiquitous
transcription factor, is one of the cross-talk points of
multiple signal transduction pathways. Activated NF-
қB plays a key role in the regulation of transcription
and expression of many genes involved in
inflammatory responses (12) including TNF-α and IL-
6. An increase in the nuclear translocation of NF-қB
has been demonstrated in human and experimental
renal diseases (13).
(-)-Linalool (LIN), a monoterpene, is a major
volatile component of the essential oils of several
aromatic plant species including Coriandrum sativumLinn. It is used as an additive for processed foods and
beverages and as a fragrance ingredient in cosmetics,
toiletries and household detergents (14). LIN-
containing essential oils possess antimicrobial,
antibacterial and antiviral effects, as well as anti-
inflammatory, analgesic and local anesthetic activities
(15-19). LIN is suggested to be responsible for the
antidiabetic activity of coriander seeds, which are used
traditionally to control diabetes (20). The hypo -
glycemic effect of LIN in diabetic rats has already
been reported (21). Although LIN has been subjected
to such extensive research, the antioxidant, hypo-
lipidemic and antiglycation effects of LIN have not
been investigated in diabetic rats. Further, the effect of
LIN on cytokines is not found in the literature either.
These facts prompted us to investigate the effect of
LIN supplementation in a chronic model of DN.
The plasma levels of glucose, insulin, lipids, oxidant-
antioxidant balance, proinflammatory changes, and
TGF-β1 ,TNF-α and NF- қB expression in kidney were
analyzed to verify the protective effects of LIN on DN.
In addition, the antiglycating property and glucose
disposal effect of LIN in vitro were studied.
Deepa B, Anuradha CV / LINALOOL, A PLANT-DERIVED MONOTERPENE ALCOHOL, RESCUES KIDNEY FROM DIABETES-INDUCED NEPHROPATHIC CHANGES VIA BLOOD GLUCOSE REDUCTION
122
MATERIALS AND METHODS
Chemicals
Streptozotocin (STZ) and LIN were purchased fromSigma-Aldrich Chemicals Pvt. Ltd., MO, USA. Thekits for glucose, insulin, TNF-α and IL-6 assay werepurchased from Qualigen Diagnostics, Mumbai, India,Boehringer Manheim, Germany, BD Biosciences, SanJose, CA, USA and Koma Biotech, Seoul, SouthKorea, respectively. Bovine serum albumin (BSA) waspurchased from Merck Pvt. Ltd, Mumbai, India. Horseradish peroxidase (HRP) detection system waspurchased from Biogenex Laboratories, Chennai,India. Antibodies against TGF-β1 (rabbit polyclonal)were purchased from Santa Cruz Biotechnology, SantaCruz, CA, USA, and anti-rabbit secondary antibodyfrom Genei, Bangalore, India. All other chemicals andsolvents used were of analytical grade and werepurchased from Sisco Research Laboratories,Mumbai, India.
Treatment and maintenance of animals
Male adult Wistar rats of body weight 150-180 gwere obtained from Department of ExperimentalMedicine, Central Animal House, Rajah MuthiahMedical College (RMMCH), and the experimentswere carried out at Department of Biochemistry andBiotechnology, Annamalai University, AnnamalaiNagar, Tamil Nadu, India. The rats were housed undercontrolled conditions (22-25 °C) at 12 h light/12 hdark cycles and received standard pellet diet(Karnataka State Agro Corporation Ltd., Agro FeedsDivision, Bangalore, India) and water ad libitum. Thestudy protocol was approved by the institutionalAnimal Ethics Committee, RMMCH, AnnamalaiNagar.
Induction of experimental diabetes
Rats were rendered diabetic by administering STZ(45 mg/kg i.p.) dissolved in freshly prepared 0.01Mcitrate buffer, pH 4.5. Control rats received the vehiclealone. Fasting blood glucose concentration wasmeasured 72 h later. Rats that showed blood glucoselevels above 200 mg/dL were used in the study.
Experimental groups
The following groups of rats were maintained for atotal period of 45 days:
Group 1 (CON) – control rats receiving normal diet Group 2 (DIA) – diabetic rats administered STZ (45
mg/kg, dissolved in 0.1 M citrate buffer,pH4.5)
Group 3 (DIA+LIN) – diabetic rats treated with LIN(25 mg/kg b.w./day dissolved in carboxymethyl cellulose p.o.)
Group 4 (CON+LIN) – control rats treated with LIN.
The dosage of LIN was adopted from the literature(17). Food intake, body weight and fluid intake weredetermined at regular intervals. Urinary variables weremeasured in 24-h samples. For this, the animals wereplaced individually in metabolic cages and urine wascollected. The sample volume was measured andpreserved by adding 0.2 mL 10 N hydrochloric aciduntil analysis.
Oral glucose tolerance test
On day 44, the rats were fasted overnight. Bloodsamples were collected by sino-ocular puncture.Samples were again collected at 60 and 120 min afterthe administration of glucose (2 g/kg). The oralglucose tolerance test (OGTT) curves were drawn byplotting blood glucose (mmol/L) against time (min).The integrated area under the curve for glucose(AUCglucose) (mmol.L1 min-1) was calculated usingGraphPad Prism version 5.1.
At the end of the experimental period, the animalswere put on overnight fast and anesthesized with anintramuscular injection of ketamine hydrochloride (35mg/kg, i.m.) and sacrificed by cervical dislocation.Kidneys were removed, cleaned, dried andhomogenized in 0.1 M Tris-HCl buffer, pH 7.4. Blood,plasma, and kidney homogenate were used for thefollowing investigations.
Biochemical assays
Glucose and insulin levels in plasma were quantifiedusing kits. Glycated hemoglobin (22) and fructo -samine (23) were estimated.
Deepa B, Anuradha CV / LINALOOL, A PLANT-DERIVED MONOTERPENE ALCOHOL, RESCUES KIDNEY FROM DIABETES-INDUCED NEPHROPATHIC CHANGES VIA BLOOD GLUCOSE REDUCTION
Diabetologia Croatica 40-4, 2011 123

The levels of TNF-α, IL-6 were determined byELISA according to the manufacturer’s instructionsprovided in the kit. Thiobarbituric acid reactivesubstances (TBARS) (24) and lipid hydroperoxides(LHP) (25) were determined as a measure of lipidperoxidation. In brief, the concentration of TBARSwas estimated by measuring the pink-coloredchromophore formed upon heating the sample withthiobarbituric acid (0.375% in distilled water) at 535nm. The standard curve was prepared using 1,1’,3,3’-tetra methoxy propane. Lipid hydroperoxides weremeasured in methanol-extracted tissue homogenates.An aliquot of lipid sample (0.2 mL) was mixed with1.8 mL of the reagent, which contained 90 mL ofmethanol, 10 mLof 250 mM sulfuric acid, 88 mgbutylated hydroxyl toluene, 7.6 mg xylenol orange and9.8 mg ferrous ammonium sulfate. The colordeveloped was read at 560 nm. Protein carbonyl (PC)(26) and nitrosothiol (27) were determined.
Renal function markers such as urea, uric acid andcreatinine in plasma and urine were assayed on anautoanalyzer (Technicon-RA-XT, Boehringer,Germany). Urea and creatinine clearance rates werecalculated from the equation:
C= (U × V)/P,
where C is clearance rate, U is concentration of thesubstance in urine, V is the mL of urine excreted perminute, and P represents concentration of thesubstance in plasma. The rates were expressed inmL/s. Urinary albumin was determined using a kitobtained from Bayer Diagnostics, Germany.
Enzymatic antioxidants such as superoxidedismutase (SOD), catalase (CAT), glutathioneperoxidase (GPx), glutathione reductase (GR) andglutathione-S transferase (GST) and non-enzymaticantioxidants, namely vitamin E, ascorbic acid andglutathione (GSH) were assayed by standardprocedures described elsewhere (28). Briefly, SODwas assayed by the inhibition of the formation ofNADH-phenazine methosulfate nitroblue tetrazoliumformazan. CAT and GPx activities were assayed bymeasuring the amount of the substrate consumed(hydrogen peroxide and glutathione, respectively)after carrying out the reactions for a specified period
of time. The hydrogen peroxide remaining wasmeasured by dichromate color reaction at 620 nm,while the GSH remaining was measured using colorreaction with dithiobis nitrobenzoic acid (DTNB)reagent, which produced a yellow color that wasmeasured at 412 nm. The activity of GST wasmeasured by following the increase in absorbance at340 nm using 1-chloro-2,4, dinitro benzene (CDNB)as the substrate. GR activity in kidney was assayed bymeasuring the rate of NADPH oxidation. Vitamin Ewas estimated by the reduction of ferric ions to ferrousions by the sample followed by the formation of a red-colored complex with 2,2 dipyridyl. Ascorbic acid wasmeasured by the conversion to dehydroascorbic acid inthe presence of thiourea, a mild reducing agentfollowed by reacting with dinitro phenyl hydrazine(DNPH)-thiourea-copper sulfate reagent (DTC). Theproduct formed was converted to a red-coloredcomplex by treating with H2SO4, which was read at520 nm.
Lipid extraction and analysis
Lipids from kidney were extracted by the method ofFolch et al. (29). The contents of cholesterol,triglycerides (TG) and free fatty acids (FFA) in plasmaand kidney were measured (30-32).
Western blot analysis of TGF-β1
in kidney
Kidney samples were homogenized in an ice-coldbuffer (20 mM Tris-HCl, pH 7.4, containing 150 mMsodium chloride, 1 mM ethylene diamine tetra-aceticacid (EDTA), 0.5% Triton X-100, 0.1% sodiumdodecyl sulfate (SDS), 1mM phenyl methosulfonylfluoride and 10 µL of protease inhibitor cocktail) andthen centrifuged at 10,000 xg for 15 min at 4◦C. Thesolubilized protein (50 μg) was electrophoresed bySDS-polyacrylamide gel electrophoresis (SDS-PAGE)(12% gel) and then blotted onto a nitrocellulosemembrane. After 1 h, the membrane was incubated ina blocking buffer (3% BSA in Tris-buffered saline, pH7.5) containing 0.1% Tween-20 (TBST) and thenprobed with the primary antibody (rabbit polyclonalanti-TGF-β1, 1:1000 diluted in blocking buffer) at 4 °Covernight. The membrane was washed three times
Deepa B, Anuradha CV / LINALOOL, A PLANT-DERIVED MONOTERPENE ALCOHOL, RESCUES KIDNEY FROM DIABETES-INDUCED NEPHROPATHIC CHANGES VIA BLOOD GLUCOSE REDUCTION
124
with 0.1% TBST for 5 min and then incubated withHRP-conjugated anti-rabbit antibody (1:1500 dilution)for 2 h at room temperature. β-actin was used as thehouse-keeping control (1:1000 dilution). The bandswere detected by color reaction with H2O2 and thenscanned. Intensity was measured using densitometrysoftware (AlphaEaseFC Software, Alphatech InnotechCo., Johannesburg, South Africa).
RNA preparation and RT-PCR analysis of TGF-
β1,TNF-α and NF-қB
Total cellular RNA was extracted from kidney tissuewith TriZol reagent, which is based on the guanidiumthiocyanate method (33). Two µg of total RNA wasmixed with oligo DT primer (0.5 µg/µL), dNTP mix(deoxy nucleotide triphosphate mix) (10mM each, 2µL), RNase free water (2 µL) and heated at 65 ºC for5 min. Reverse transcription was carried out with 5XMoloney-Murine Leukaemia virus (M-MuLV) reversetranscription buffer (4 µL), M-MuLV reversetranscriptase enzyme (1.5 U, 1 µL ) and RNaseinhibitor solution (4 U, 0.5µL), incubated at 42 ºC for90 min and the reaction was terminated at 85 ºC for 5min. PCR amplification was performed in a mixturecontaining 2.5 µL Thermus aquaticus buffer (Taqbuffer), 3.5 µL of RNase free water, 1 µL of each senseand antisense primers (Sigma-Aldrich, Bangalore), 1µL dNTPs, 5 µL reverse transcribed template solution.Nucleotide sequence of the primers used is shown inTable 1. Thermocycling conditions for TGF-β1 weredenaturation at 95 °C for 30 sec, annealing at 53 °C for30 sec and 72 °C for 40 sec for primer extension (finalextension at 72 °C for 10 min) for a total of 30 cycles;PCR conditions for TNF-α were denaturation at 94 °Cfor 30 sec, annealing at 52 °C for 30 sec and 72 °C for
45 sec for primer extension (final extension at 72 °C
for 10 min) for a total of 30 cycles; for NF-қB the
conditions were denaturation at 95 °C for 3 min,
annealing at 51 °C for 30 sec and 40 °C for 45 sec for
primer extension (final extension at 72 °C for 10 min)
for a total of 30 cycles; and for β-actin the conditions
were denaturation at 55 °C for 45 sec, annealing at 72
°C for 40 sec and for 45 sec for primer extension (final
extension at 72 °C for 10 min) for 30 cycles. Five μL
of PCR products were applied to 1.5% agarose gels
and electrophoresed for 20 min, visualized and
photographed. The photodensitometry analysis was
done with the Image J software system. All reactions
were run in triplicate for each sample. The relative
quantity was represented by the ratio of band
intensities of TNF-α ,TGF-β1 and NF-қB to that of β-
actin.
Renal histology
A portion of kidney tissue removed from each group
was fixed in 8% neutral formalin, dried and embedded
in paraffin wax. Sections of 3-5 µm were cut,
processed, stained with hematoxylin and eosin, and
examined under light microscope.
Glycation of BSA in vitro
The ability of LIN to prevent glycation in vitro was
studied using BSA as the standard protein and a
mixture of glucose and fructose as the glycating agent.
The incubation mixture contained 14 mg BSA, 25 mM
fructose, 25 mM glucose and penicillin-VK 100 U
mL-1. The tubes were incubated for 30 days at 37 °C
after adding either water (control), LIN at 5, 10 and 20
mM, or AG at 10 mM (reference standard). After 30
days, the samples were dialyzed and then measured for
glycation (34). The values obtained were expressed as
percentage with reference to control tube that
contained only water.
Glucose utilization assay
Utilization of glucose in rat diaphragm in vitro was
carried out (35). Hemidiaphragms were removed from
control rats and placed in a cold buffer solution
Table 1. Nucleotide sequence of primers used in RT-
PCR
Gene Primers Nucleotide sequence 5’-3’
TGF-β1
Sense TGAGTGGCTGTCTTTTGACGAntisense ACTTCCAACCCAGGTCCTTC
TNF-αSense CTCGAGTGACAAGCCCGTAGAntisense TTGACCTCAGCGCTGAGCAG
NF-қBSense AAGATCAATGGCTACACGGG Antisense CCTCAATGTCTTCTTTCTGCC
β-actinSense TGTGATGGTGGGAATGGGTCAGAntisense TTTGATGTCACGCACGATTTCTC
Deepa B, Anuradha CV / LINALOOL, A PLANT-DERIVED MONOTERPENE ALCOHOL, RESCUES KIDNEY FROM DIABETES-INDUCED NEPHROPATHIC CHANGES VIA BLOOD GLUCOSE REDUCTION
Diabetologia Croatica 40-4, 2011 125
containing 4x10⁻² M sodium phosphate, pH 7.2 , 5x10-
3 M KCl, 4x10⁻³ M MgCl2, and 8.3x10⁻² M NaCl at 37°C. The pieces of diaphragm were blotted in filterpaper, weighed and incubated with the mediumcontaining 4x10⁻² M sodium phosphate, pH 7.2, 5x10-
3 M KCl, 4x10⁻³ MgCl2, 8x10⁻² M NaCl, 6x10⁻³ Mglucose at 37 °C for 24 h. LIN was added at 1 and2mM concentrations, and insulin at 0.2 U/mLconcentration in separate tubes. Control tube did notcontain LIN or insulin. The levels of glucose in the
medium were measured at the start (0 h) and afterincubation (2 h). The values were given as glucose h-1.
Statistical analysis
Values are expressed as means ± SD. Data within thegroups were analyzed by ANOVA followed byDuncan’s multiple range test (DMRT). For in vitrostudies, Student’s t-test for unpaired comparisons wasused. A value of P<0.05 was considered statisticallysignificant.
Table 2. Body weight, kidney weight, food intake and fluid intake of control and experimental animals
Parameter CON DIA DIA+LIN CON+LIN
Body weight
Initial (g) 180.55 ± 3.32 181.01 ± 6.87 180.36 ± 6.96 179.95 ± 6.64
Final (g) 203.90 ± 4.38 138.36 ± 5.54a 187.35 ± 6.00b 202.73 ± 4.70
Change in body weight (%) 13.18 (+) 23.56 (-) 7.19 (+) 12.65 (+)
Kidney weight (g) 1.91 ± 0.02 2.20 ± 0.14a 2.03 ± 0.14b 1.83 ± 0.13
Food intake (mg/kg b.w.) 19.88 ± 0.30 21.20 ± 0.21a 18.92 ± 0.49b 17.28 ± 0.17
Fluid intake (mL/day) 25.0 ± 0.21 40.16 ± 0.41a 28.16 ± 0.28b 23.66 ± 0.21
Values are means ± SD of 6 rats from each group. CON, control rats; DIA, diabetic rats; DIA+LIN, diabetic rats treated with linalool (25 mg/kg b.w./day); CON+LIN, control rats treated
with linalool (25 mg/kg b.w./day); asignificant as compared with CON group; bsignificant as compared to DIA group [one-way ANOVA followed by DMRT (P<0.05)].
Table 3. Levels of glucose, insulin, fructosamine (FAM), glycated hemoglobin (GHb) and inflammatory cytokines
in control and experimental animals
Parameter CON DIA DIA+LIN CON+LIN
Glucose (mmol/L) 5.15±0.32 15.57±1.19a 5.95±0.32a,b 5.19±0.31
Insulin (pmol/L) 84.59±3.35 27.01±2.38a 76.60±6.31a,b 89.17±7.03
FAM (mmol/L) 0.86±0.07 1.32±0.10a 0.89±0.07b 0.82±0.08
GHb (proportion total Hb) 0.002±0.0001 0.006±0.0005a 0.003±0.0002b 0.002±0.0001
TNF-α (fmol/mL) 798.50±76.65 2175.01±19.05a 1161.31±10.01b 826.14±7.62
IL-6 (fmol/mL) 3531.25±33.1 4772.95±40.04a 3695.96±33.28b 3560.26±32.14
Values are means ± SD of 6 rats from each group. CON, control rats; DIA, diabetic rats; DIA+LIN, diabetic rats treated with linalool (25 mg/kg b.w./day); CON+LIN, control rats treated
with linalool (25 mg/kg b.w./day); asignificant as compared with CON group; bsignificant as compared to DIA group [one-way ANOVA followed by DMRT (P<0.05)].
Table 4. Levels of lipid profile in plasma and kidney of control and experimental animals
Parameter CON DIA DIA+LIN CON+LINPlasma (mmol/L)
Cholesterol 2.12±0.15 3.06±0.21a 2.20±0.13b 2.43±0.11
Triglycerides 0.98±0.06 1.75±0.8a 1.02±0.7b 1.11±0.62
Free fatty acids 3.08±0.23 5.20±0.35a 3.18±0.16b 3.48±0.14
Kidney (mg/g wet tissue)
Cholesterol 4.02±0.30 6.04±0.46a 4.06±0.31b 5.08±0.39
Triglycerides 4.62±0.35 6.16±0.47a 4.72±0.36b 5.56±0.43
Free fatty acids 5.42±0.41 7.88±0.60a 5.46±0.42b 6.42±0.49
Values are means ± SD of 6 rats from each group. CON, control rats; DIA, diabetic rats; DIA+LIN, diabetic rats treated with linalool (25 mg/kg b.w./day); CON+LIN, control rats treated
with linalool (25 mg/kg b.w./day); asignificant as compared with CON group; bsignificant as compared to DIA group [one-way ANOVA followed by DMRT (P<0.05)].
Deepa B, Anuradha CV / LINALOOL, A PLANT-DERIVED MONOTERPENE ALCOHOL, RESCUES KIDNEY FROM DIABETES-INDUCED NEPHROPATHIC CHANGES VIA BLOOD GLUCOSE REDUCTION
126
RESULTS
Effect of LIN on the symptoms of diabetes
Body weight (initial and final), kidney weight, and
food and fluid intake/day of animals are given in Table
2. Increased food and water intake and failure to gain
body weight were observed in diabetic rats. These
symptoms were present throughout the experimental
period. The data shown in Table 2 also indicate that
LIN treatment of diabetic rats resulted in a significant
reduction (P<0.05) of food intake, fluid intake and
kidney weight as compared with untreated diabetic
animals.
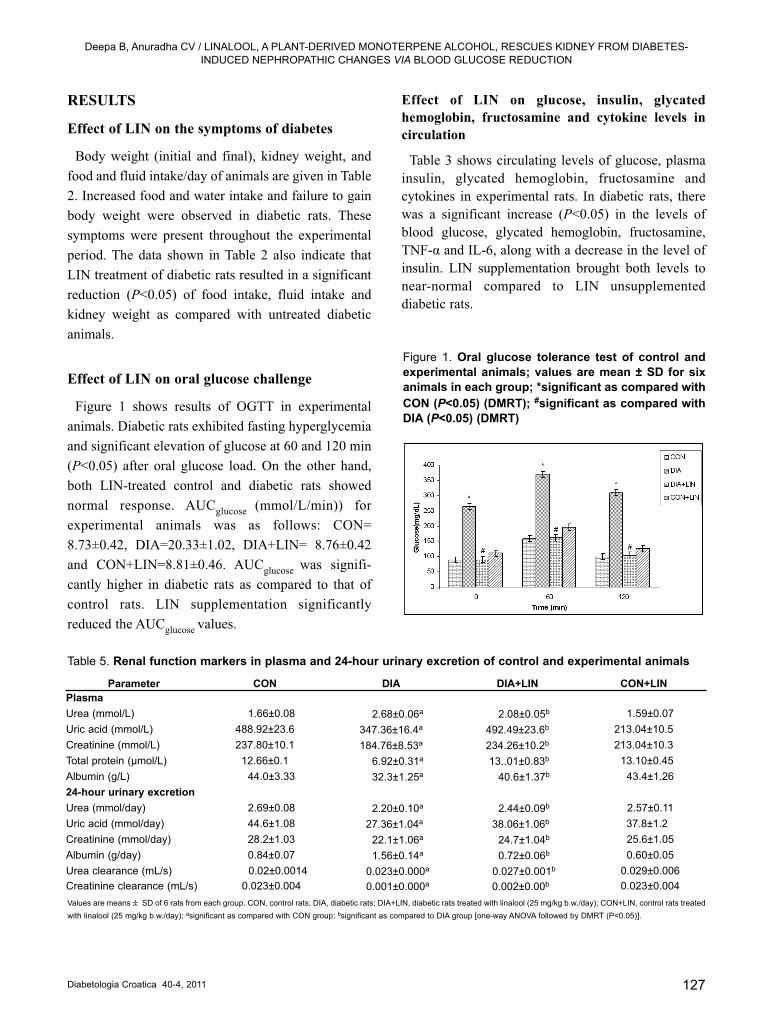
Effect of LIN on oral glucose challenge
Figure 1 shows results of OGTT in experimental
animals. Diabetic rats exhibited fasting hyperglycemia
and significant elevation of glucose at 60 and 120 min
(P<0.05) after oral glucose load. On the other hand,
both LIN-treated control and diabetic rats showed
normal response. AUCglucose (mmol/L/min)) for
experimental animals was as follows: CON=
8.73±0.42, DIA=20.33±1.02, DIA+LIN= 8.76±0.42
and CON+LIN=8.81±0.46. AUCglucose was signifi -
cantly higher in diabetic rats as compared to that of
control rats. LIN supplementation significantly
reduced the AUCglucose values.
Effect of LIN on glucose, insulin, glycated
hemoglobin, fructosamine and cytokine levels in
circulation
Table 3 shows circulating levels of glucose, plasmainsulin, glycated hemoglobin, fructosamine andcytokines in experimental rats. In diabetic rats, therewas a significant increase (P<0.05) in the levels ofblood glucose, glycated hemoglobin, fructosamine,TNF-α and IL-6, along with a decrease in the level ofinsulin. LIN supplementation brought both levels tonear-normal compared to LIN unsupplementeddiabetic rats.
Table 5. Renal function markers in plasma and 24-hour urinary excretion of control and experimental animals
Parameter CON DIA DIA+LIN CON+LIN
Plasma
Urea (mmol/L) 1.66±0.08 2.68±0.06a 2.08±0.05b 1.59±0.07
Uric acid (mmol/L) 488.92±23.6 347.36±16.4a 492.49±23.6b 213.04±10.5
Creatinine (mmol/L) 237.80±10.1 184.76±8.53a 234.26±10.2b 213.04±10.3
Total protein (μmol/L) 12.66±0.1 6.92±0.31a 13..01±0.83b 13.10±0.45
Albumin (g/L) 44.0±3.33 32.3±1.25a 40.6±1.37b 43.4±1.26
24-hour urinary excretion
Urea (mmol/day) 2.69±0.08 2.20±0.10a 2.44±0.09b 2.57±0.11
Uric acid (mmol/day) 44.6±1.08 27.36±1.04a 38.06±1.06b 37.8±1.2
Creatinine (mmol/day) 28.2±1.03 22.1±1.06a 24.7±1.04b 25.6±1.05
Albumin (g/day) 0.84±0.07 1.56±0.14a 0.72±0.06b 0.60±0.05
Urea clearance (mL/s) 0.02±0.0014 0.023±0.000a 0.027±0.001b 0.029±0.006
Creatinine clearance (mL/s) 0.023±0.004 0.001±0.000a 0.002±0.00b 0.023±0.004
Values are means ± SD of 6 rats from each group. CON, control rats; DIA, diabetic rats; DIA+LIN, diabetic rats treated with linalool (25 mg/kg b.w./day); CON+LIN, control rats treated
with linalool (25 mg/kg b.w./day); asignificant as compared with CON group; bsignificant as compared to DIA group [one-way ANOVA followed by DMRT (P<0.05)].
Deepa B, Anuradha CV / LINALOOL, A PLANT-DERIVED MONOTERPENE ALCOHOL, RESCUES KIDNEY FROM DIABETES-INDUCED NEPHROPATHIC CHANGES VIA BLOOD GLUCOSE REDUCTION
Diabetologia Croatica 40-4, 2011 127
Figure 1. Oral glucose tolerance test of control and
experimental animals; values are mean ± SD for six
animals in each group; *significant as compared with
CON (P<0.05) (DMRT); #significant as compared with
DIA (P<0.05) (DMRT)

Lipid profile
Lipid levels in plasma and kidney of experimentalanimals are shown in Table 4. Elevated levels of totalcholesterol, TG and FFA were observed in diabeticrats. LIN brought back these levels to near-controllevels.
Plasma and urinary levels of non-protein nitrogen
constituents, urine albumin and clearance rates
Table 5 shows plasma and 24-h urinary excretionlevels of urea, uric acid, creatinine and albumin, andclearance rates of creatinine and urea in experimentalanimals. The level of urea was significantly increased(P<0.05), while the levels of uric acid, creatinine, totalprotein and albumin were significantly decreased(P<0.05) in plasma of diabetic rats as compared withcontrol rats. Urinary urea, uric acid and creatinineclearance rates were lower in diabetic rats. LINadministration prevented these alterations and broughtback these parameters to near-normal levels. Improvedglomerular function in LIN-treated diabetic rats is
indicated by enhanced clearance rates as compared tothose of normal rats.
Oxidative stress markers and nitrosothiol
Table 6 gives the levels of oxidative stress markerssuch as LHP, TBARS, PC and nitrosothiol in kidney.Diabetic animals showed significantly (P<0.05) higherlevels of these parameters as compared with controlanimals. In DIA+LIN group, the levels of thesesubstances were significantly lowered (P<0.05) ascompared with DIA group.
Enzymatic and nonenzymatic antioxidants
Table 7 shows the activities of enzymaticantioxidants in the kidney of experimental animals.Significant decrease in the activities of SOD (31%),CAT (23%), GPX (22%), GST (27%) and GR (26%)was seen in diabetic group. The administration of LINto diabetic rats significantly upheld the activities ofthese enzymes. However, there were no significantdifferences in the activities of these enzymes betweenCON and CON+LIN.
128
Deepa B, Anuradha CV / LINALOOL, A PLANT-DERIVED MONOTERPENE ALCOHOL, RESCUES KIDNEY FROM DIABETES-INDUCED NEPHROPATHIC CHANGES VIA BLOOD GLUCOSE REDUCTION
Table 6. Levels of LHP, TBARS, PC and nitrosothiol in plasma and kidney of control and experimental animals
Parameter CON DIA DIA+LIN CON+LINPlasma
LHPA 0.92±0.07 1.31±0.10a 1.12±0.08b 0.96±0.07
TBARSA 2.80±0.21 5.28±0.40a 3.22±0.25b 2.82±0.21
Kidney
LHPB 1.72±0.13 2.38±0.18a 1.97±0.22b 1.74±0.14
TBARSB 1.66±0.13 2.76±0.21a 1.87±0.08b 1.64±0.12
PCB 1.90±0.14 2.29±0.17a 2.10±0.16b 1.92±0.15
NitrosothiolB 34.10±2.3 58.30±4.8a 36.0±2.8b 33.10±3.0
Values are means ± SD of 6 rats from each group. CON, control rats; DIA, diabetic rats; DIA+LIN, diabetic rats treated with linalool (25 mg/kg b.w./day); CON+LIN, control rats treated
with linalool (25 mg/kg b.w./day); asignificant as compared with CON group; bsignificant as compared to DIA group [one-way ANOVA followed by DMRT (P<0.05)]; Aμmol/L for plasma;Bμmol/L for μmol/mg protein for kidney.
Table 7. Activities of enzymatic antioxidants in kidney of control and experimental animals
Parameter CON DIA DIA+LIN CON+LIN
SODA 4.01±0.312 2.74±0.21a 3.6±0.12b 3.98±0.38
CATB 58.99±4.80 44.89±3.43a 50.29±3.85b 56.55±4.33
GPxC 5.98±6.46 4.67±0.35a 5.89±0.45b 6.00±0.46
GSTD 5.80±0.44 4.22±0.35a 5.68±0.43b 5.88±0.44
GRE 23.4±1.6 17.4±1.0a 22.2±1.3b 23.1±2.0Aunits/mg protein; Bµmol of H2O2.mg/protein/min; Cµmol of GSH consumed/min/mg /protein; Dmmol of chloro dimethyl nitrobenzene-glutathione conjugate formed/min/mg protein;
values are means ± SD of 6 rats from each group; CON, control rats; DIA, diabetic rats; DIA+LIN, diabetic rats treated with linalool (25 mg/kg b.w./day); CON+LIN, control rats treated
with linalool (25 mg/kg b.w./day); asignificant as compared with CON group; bsignificant as compared to DIA group [one-way ANOVA followed by DMRT (P<0.05)].

The levels of nonenzymatic antioxidants in plasmaand kidney of experimental animals are listed in Table8. The levels were significantly lower (P<0.05) indiabetic group than in control animals. On the otherhand, LIN-treated diabetic rats displayed significantlyhigher levels of nonenzymatic antioxidants.
Glucose disposal effect of LIN
Table 9 presents the glucose disposal effect of LINand insulin. A significant increase (P<0.05) in glucoseutilization was seen in tubes containing LIN ascompared with control. The glucose utilization effectof LIN was more pronounced when insulin was alsopresent. The rate of glucose disposal effect in isolatedrat diaphragm is depicted in Fig. 2A. Significantincrease (P<0.05) in glucose disposal was exerted byLIN at both concentrations (1mM and 2mM). Theeffect of LIN (INS+LIN 1mM and INS+LIN2mM)was higher when insulin (0.2 U/mL) was also present.
129Diabetologia Croatica 40-4, 2011
Deepa B, Anuradha CV / LINALOOL, A PLANT-DERIVED MONOTERPENE ALCOHOL, RESCUES KIDNEY FROM DIABETES-INDUCED NEPHROPATHIC CHANGES VIA BLOOD GLUCOSE REDUCTION
Figure 2. Effect of LIN on glucose utilization by the
diaphragm in the presence and absence of insulin
with time. Both LIN and insulin individually increased
glucose utilization. When present together, the effect
was greater. CON, control; LIN, linalool; INS, insulin.
LIN1- 1 mM LIN; LIN 2- 2mM LIN, INS- 0.2 U/mL
insulin; values are mean ± SD of six experiments
(Student’s t-test; P<0.001); *significant compared
with CON (Student’s t-test ); #significant at P<0.05
when compared with INS (Student’s t-test).
Table 8. Non-enzymatic antioxidants in plasma and kidney of control and experimental animals
Parameter CON DIA DIA+LIN CON+LIN
Plasma
GSH (μmol/L) 936.80±71.17 648.55±49.65a 842.64±65.38b 934.42±71.54
Vitamin C (μmol/L) 164.15±12.56 102.86±7.87a 139.88±9.93b 163.01±12.48
Vitamin E (μmol/L) 24.43±1.87 15.98±1.23a 18.48±1.42b 24.98±1.91
Kidney
GSH (µmol/mg protein) 5.32±0.41 4.64±0.35a 4.02±0.31b 5.28±0.40
Vitamin C (µmol/mg protein) 40.99±2.57 24.02±1.84a 30.84±1.57b 39.13±3.03
Vitamin E (µmol/mg protein) 20.22±1.78 12.96±0.99a 15.38±1.49b 19.48±2.07
Values are means ± SD of 6 rats from each group; CON, control rats; DIA, diabetic rats; DIA+LIN, diabetic rats treated with linalool (25 mg/kg b.w./day); CON+LIN, control rats treated
with linalool (25 mg/kg b.w./day); asignificant as compared with CON group; bsignificant as compared to DIA group [one-way ANOVA followed by DMRT (P<0.05)].
Table 9. Effect of LIN on glucose utilization in rat hemi diaphragm incubated with glucose in vitro
Group LIN (mM) Insulin (U/mL) Glucose utilization (µmol/g/h)CON - - 8.09±0.468
LIN1 1 - 12.83±0.95a
LIN2 2 - 16.14±1.22a
INS - 0.2 17.63±1.21
LIN1 + INS 1 0.2 25.32±1.77b
LIN2 + INS 2 0.2 33.48±1.93b
The incubation medium contained 0.04 M sodium phosphate (pH 7.2), 0.005 M potassium chloride, 0.004 M magnesium chloride, 0.006 M glucose and 0.08 M sodium chloride; LIN1,1 mM LIN; LIN 2, 2mM LIN; INS, 0.2 U/mL insulin; acompared with CON; bcompared with INS; significant at P<0.05 (Student’s t-test); values are mean ± SD of 6 experiments.
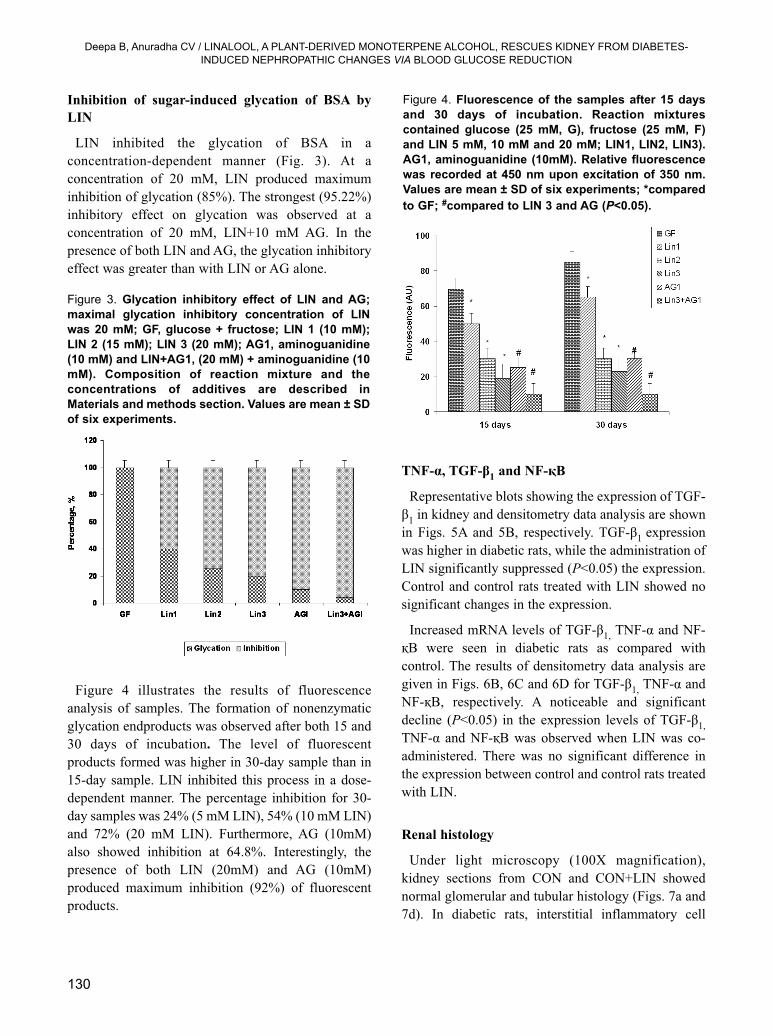
Inhibition of sugar-induced glycation of BSA by
LIN
LIN inhibited the glycation of BSA in aconcentration-dependent manner (Fig. 3). At aconcentration of 20 mM, LIN produced maximuminhibition of glycation (85%). The strongest (95.22%)inhibitory effect on glycation was observed at aconcentration of 20 mM, LIN+10 mM AG. In thepresence of both LIN and AG, the glycation inhibitoryeffect was greater than with LIN or AG alone.
Figure 4 illustrates the results of fluorescenceanalysis of samples. The formation of nonenzymaticglycation endproducts was observed after both 15 and30 days of incubation. The level of fluorescentproducts formed was higher in 30-day sample than in15-day sample. LIN inhibited this process in a dose-dependent manner. The percentage inhibition for 30-day samples was 24% (5 mM LIN), 54% (10 mM LIN)and 72% (20 mM LIN). Furthermore, AG (10mM)also showed inhibition at 64.8%. Interestingly, thepresence of both LIN (20mM) and AG (10mM)produced maximum inhibition (92%) of fluorescentproducts.
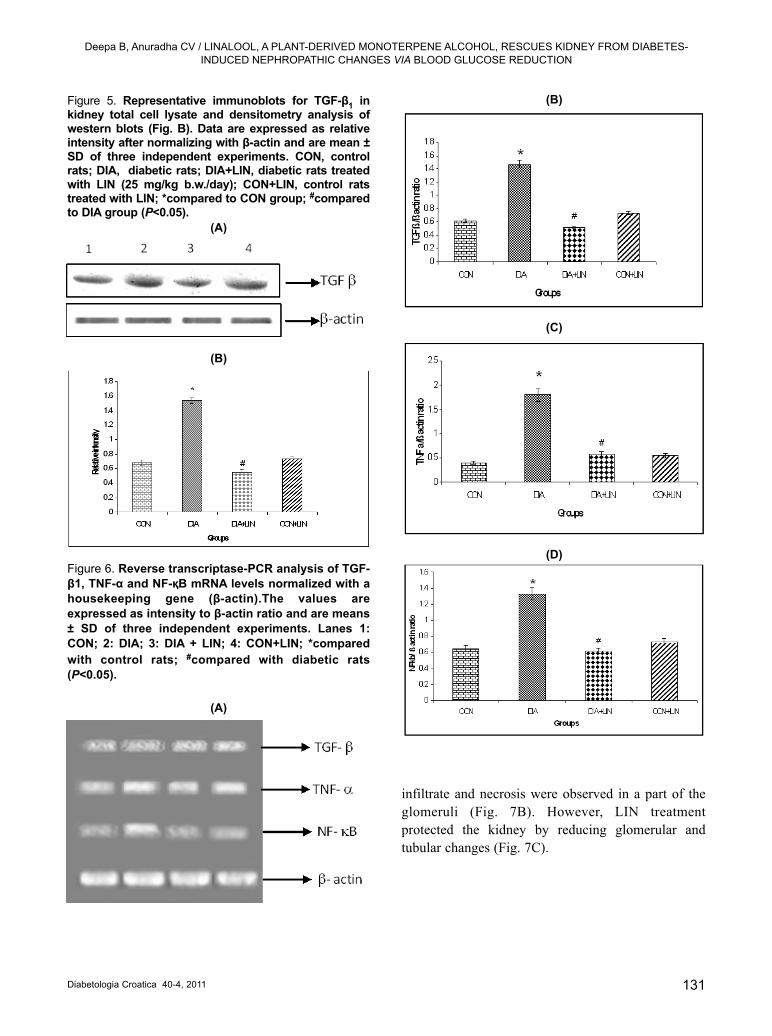
TNF-α, TGF-β1
and NF-қB
Representative blots showing the expression of TGF-β1 in kidney and densitometry data analysis are shownin Figs. 5A and 5B, respectively. TGF-β1 expressionwas higher in diabetic rats, while the administration ofLIN significantly suppressed (P<0.05) the expression.Control and control rats treated with LIN showed nosignificant changes in the expression.
Increased mRNA levels of TGF-β1, TNF-α and NF-қB were seen in diabetic rats as compared withcontrol. The results of densitometry data analysis aregiven in Figs. 6B, 6C and 6D for TGF-β1, TNF-α andNF-қB, respectively. A noticeable and significantdecline (P<0.05) in the expression levels of TGF-β1,
TNF-α and NF-қB was observed when LIN was co-administered. There was no significant difference inthe expression between control and control rats treatedwith LIN.
Renal histology
Under light microscopy (100X magnification),kidney sections from CON and CON+LIN showednormal glomerular and tubular histology (Figs. 7a and7d). In diabetic rats, interstitial inflammatory cell
Deepa B, Anuradha CV / LINALOOL, A PLANT-DERIVED MONOTERPENE ALCOHOL, RESCUES KIDNEY FROM DIABETES-INDUCED NEPHROPATHIC CHANGES VIA BLOOD GLUCOSE REDUCTION
130
Figure 3. Glycation inhibitory effect of LIN and AG;
maximal glycation inhibitory concentration of LIN
was 20 mM; GF, glucose + fructose; LIN 1 (10 mM);
LIN 2 (15 mM); LIN 3 (20 mM); AG1, aminoguanidine
(10 mM) and LIN+AG1, (20 mM) + aminoguanidine (10
mM). Composition of reaction mixture and the
concentrations of additives are described in
Materials and methods section. Values are mean ± SD
of six experiments.
Figure 4. Fluorescence of the samples after 15 days
and 30 days of incubation. Reaction mixtures
contained glucose (25 mM, G), fructose (25 mM, F)
and LIN 5 mM, 10 mM and 20 mM; LIN1, LIN2, LIN3).
AG1, aminoguanidine (10mM). Relative fluorescence
was recorded at 450 nm upon excitation of 350 nm.
Values are mean ± SD of six experiments; *compared
to GF; #compared to LIN 3 and AG (P<0.05).
infiltrate and necrosis were observed in a part of theglomeruli (Fig. 7B). However, LIN treatmentprotected the kidney by reducing glomerular andtubular changes (Fig. 7C).
Deepa B, Anuradha CV / LINALOOL, A PLANT-DERIVED MONOTERPENE ALCOHOL, RESCUES KIDNEY FROM DIABETES-INDUCED NEPHROPATHIC CHANGES VIA BLOOD GLUCOSE REDUCTION
Diabetologia Croatica 40-4, 2011 131
Figure 5. Representative immunoblots for TGF-β1
inkidney total cell lysate and densitometry analysis ofwestern blots (Fig. B). Data are expressed as relativeintensity after normalizing with β-actin and are mean ±SD of three independent experiments. CON, controlrats; DIA, diabetic rats; DIA+LIN, diabetic rats treatedwith LIN (25 mg/kg b.w./day); CON+LIN, control ratstreated with LIN; *compared to CON group; #comparedto DIA group (P<0.05).
Figure 6. Reverse transcriptase-PCR analysis of TGF-
β1, TNF-α and NF-қB mRNA levels normalized with a
housekeeping gene (β-actin).The values are
expressed as intensity to β-actin ratio and are means
± SD of three independent experiments. Lanes 1:
CON; 2: DIA; 3: DIA + LIN; 4: CON+LIN; *compared
with control rats; #compared with diabetic rats
(P<0.05).
(A)
(A)
(B)
(C)
(D)
(B)

Deepa B, Anuradha CV / LINALOOL, A PLANT-DERIVED MONOTERPENE ALCOHOL, RESCUES KIDNEY FROM DIABETES-INDUCED NEPHROPATHIC CHANGES VIA BLOOD GLUCOSE REDUCTION
132
Figure 7. Histology of kidney. Sections from control rat show normal glomerular and tubular histology (Fig. 7A).
Fig. 7B1, Fig.7B2, Fig. 7B3 are kidney sections of diabetic rat. The arrows show pathologic changes such as
capillary size reduction (B1), mesangial expansion (B2), hyaline tubular casts in the lumen of the tubules,
segmental glomeru lonephritis and necrosis (B3). Administration of LIN reduced these changes in the glomeruli
(Fig. C) as compared to LIN-unsupplemented diabetic rats. Fig. 7D is a section from LIN-treated control animals
showing normal histology.
(A) (B1)
(B2) (B3)
(C) (D)

Deepa B, Anuradha CV / LINALOOL, A PLANT-DERIVED MONOTERPENE ALCOHOL, RESCUES KIDNEY FROM DIABETES-INDUCED NEPHROPATHIC CHANGES VIA BLOOD GLUCOSE REDUCTION
Diabetologia Croatica 40-4, 2011 133
DISCUSSION
STZ-induced diabetic rodent model is considered agood one for screening antidiabetic agents (36) and iswidely used by researchers. In the present study, STZ-induced rats exhibited hypoinsulinemia andhyperglycemia. These changes persisted throughoutthe experimental period of 4 weeks. LIN reduced theplasma glucose level by increasing insulin levels. Theantihyperglycemic effect of LIN could be due to thestimulation of β-cells and subsequent release of insulinand activation of insulin receptors. Potentiating ofpancreatic secretion of insulin was clearly evidencedby the increased level of insulin in diabetic rats treatedwith LIN. In addition, we observed that LIN couldpromote glucose utilization by cells since LINpromoted glucose uptake in the diaphragm. Thisproperty of LIN could be a contributing mechanismfor its antidiabetic activity.
In the present study, diabetes was associated withpolydipsia, loss of body weight and hypertrophy of thekidney. LIN administration gave rise to a decrease indaily water consumption and food intake and finalkidney weight. This could be due to better control ofthe hyperglycemic state by LIN.
Elevation of lipids plays a pivotal role in theinduction and progression of DN. This contention issupported by the marked increase in cholesterol, TGand FFA in plasma and kidney of diabetic ratsobserved in this study. There is evidence thatcirculating lipids bind to and become trapped by ECMwhere they undergo oxidation, increasing theformation of ROS, which may deteriorate the structureand function of diabetic kidney (37). Treatment withLIN prevented lipid changes and this could be onemechanism for its renoprotective action. Diabetic ratsshowed decreased kidney function and glomerularfiltration as shown by albuminuria and alterations inthe renal function parameters. However, LINsupplementation reduced the levels of non-proteinnitrogen constituents and glomerular filtration.
The present findings also suggest oxidative changesin the kidney of diabetic rats. This can damage therenal architecture and create an environment for theinduction of nephropathic changes. However, co-
administration of LIN reduced the oxidative injury bymarkedly reducing the levels of TBARS and LHP withconcomitant elevation in renal antioxidant levels.Çelik and Özkaya (38) report that intraperitonealadministration of LIN reduces H2O2 induced changesin guinea pig brain by its antioxidant property.
Increase in protein carbonyl and nitrosothiol contentin STZ-induced rats suggest protein modification byoxidation and nitration. Peroxynitrite could causenitration of free tyrosine residues and cellular proteins,with a subsequent loss of protein structure resulting inreduction of the kidney function (39).
Consistent with other studies (40,41), we also foundincreased expression of TNF-α in rat kidney. LINtreatment reduced the rise in TNF-α levels. TNF-α, bybinding to its receptor, activates the inflammatoryresponse by influencing the expression of transcriptionfactors and an array of inflammatory mediators (42).Moreover, TNF-α has been shown to contribute tosodium retention and renal hypertrophy in diabetic rats(41).
IL-6 mediates the development of renal injury byinducing mesangial cell proliferation and fibronectinexpression (43). Kidney biopsies from patients withnephropathy stain positive for IL-6 mRNA and there ispositive correlation of IL-6 mRNA with albuminuriaand mesangial expansion (44). Although we did notquantitate the mRNA abundance, we noted a rise inplasma levels of IL-6 in diabetic rats, which werereduced in LIN-treated diabetic rats. In this regard, theanti-inflammatory activity of LIN has been evidencedby its ability to reduce the carrageenan-induced pawedema in rats (17).
LIN reduced TGF-β1 levels significantly comparedto diabetic rats. The observed beneficial LIN effect onrenal function can therefore be related to suppressionof augmented TGF-β1 signaling, which in turn may beattributed to its ability to reduce hyperglycemia. Theincrease in TGF-β1 mRNA in diabetic kidney could bemediated by prolonged hyperglycemia, since glucoseinduces TGF-β1 production in cultured mesangial cells(45). Further, TNF-α could promote transcription ofTGF-β1. TGF-β1 binds to type II receptor and activatesthe Smad pathway that stimulates the genes encoding
134
Deepa B, Anuradha CV / LINALOOL, A PLANT-DERIVED MONOTERPENE ALCOHOL, RESCUES KIDNEY FROM DIABETES-INDUCED NEPHROPATHIC CHANGES VIA BLOOD GLUCOSE REDUCTION
several matrix molecules (46). Activation of TGF-β1 in
kidney has been implicated in renal injury and
mesangial expansion (47). Several clinical studies
have demonstrated a rise in glomerular TGF-β1
expression (48) and urinary levels that correlate with
the severity of DN (49) and glycemic control (50). One
limitation of this study is that the PCR results are
semi-quantitative and data have to be verified with
real-time PCR.
We also measured the expression of NF-қB in kidney
since growing evidence suggests that NF-қB is
involved in diabetic disease progression and an
increase in nuclear translocation of NF-қB has been
demonstrated (51). NF-қB gets activated in diabetic
state by glucose-induced ROS production resulting in
the expression of a number of genes that encode
inflammatory factors such as cytokines and adhesion
molecules (52). These products have been documented
to play a vital role in the pathogenesis of renal
diseases. In the present study, LIN reduced the
overexpression of NF-қB, which in turn reduced the
expression of other cytokines. The mechanism by
which LIN prevents the overexpression of NF-қB is
not known and needs to be investigated. One possible
explanation could be the reduction of elevated blood
glucose and subsequent oxidative stress by LIN.
The renoprotective nature of LIN is also supported
by histologic studies. The major pathologic alteration
observed in diabetic kidney was the interstitial chronic
inflammatory infiltrate in the interstitial cells. Diabetic
kidney sections also revealed hyaline tubular casts in
the lumen of the tubules and necrosis in the glomeruli.
Concurrent administration of LIN markedly reduced
the glomerular and tubular changes in diabetic rats.
AG is suggested to have higher chemical reactivity
than proteins and thus spare proteins from glycation.
Delay in development of diabetic complications by
AG through the interaction of its nucleophilic
hydrazine group with carbonyl groups of reducing
sugars or dicarbonyl intermediates has been shown in
STZ-treated animals (53). Interestingly, we also found
LIN to possess antiglycating efficacy, which was
higher than AG.
Thus, the present investigation imparts new
information on the renoprotective action of LIN in
diabetic rats, associated with reduction of oxidative
stress, lipid levels, protein glycation and
inflammation. These effects might stem from the
antidiabetic potential of LIN, since hyperglycemia is
the causative factor for the pathogenesis and
progression of DN. Further studies are necessary to
examine the molecular interactions of LIN in vivo to
establish remission of DN by LIN. Overall, LIN holds
promise as an adjunct for diabetic therapy.
Acknowledgment
The authors acknowledge Dr. Sundrapandian, Theni
Medical College, Theni, Tamilnadu, for his help in
carrying out histopathology studies.
REFERENCES
1. Brownlee M. A radical explanation for glucose-induced beta cell dysfunction. J. Clin Invest2003;112:1788-1790.
2. Limaye PV, Raghuram N, Sivakami S. Oxidativestress and gene expression of antioxidant enzymesin the renal cortex of streptozotocin induceddiabetic rats. Mol Cell Biochem 2003;243:147-152.
3. Ravid M, Brosh D, Ravid-Safran D, Levy Z,Rachmani R. Main risk factors for nephropathy intype 2 diabetes mellitus are plasma cholesterollevels, mean blood pressure, and hyperglycemia.Arch Intern Med 1998;158:998-1004.
4. Reddy AS. Diabetic nephropathy: theory &practice. East Hanover, NJ: College BookPublishers, L.L.C., 2004;563.

5. Mason RM, Wahab NA. Extracellular matrix
metabolism in diabetic nephropathy. J Am Soc
Nephrol 2003;14:1358-1373.
6. Brownlee M. Biochemistry and molecular cell
biology of diabetic complications. Nature
2000;414:813-820.
7. Ortiz A, Bustos C, Alonso J, et al. Involvement of
tumor necrosis factor-alpha in the pathogenesis of
experimental and human glomerulonephritis. Adv
Nephrol Necker Hosp 1995;24:53-77.
8. Navarro JF, Mora C, Macia M, Garcia J.
Inflammatory parameters are independently
associated with urinary albumin excretion in type 2
diabetes mellitus. Am J Kidney Dis 2003;42:53-
61.
9. Nosadini R, Velussi M, Brocco E, et al. Course of
renal function in type 2 diabetic patients with
abnormalities of albumin excretion rate. Diabetes
2000;49:476-484.
10. Chen LL, Zhang JY, Wang BP. Renoprotective
effects of fenofibrate in diabetic rats are achieved
by suppressing kidney plasminogen activator
inhibitor-1. Vascul Pharmacol 2006;4:309-315.
11. Sharma K, Ziyadeh FN. Renal hypertrophy is
associated with upregulation of TGF-beta 1 gene
expression in diabetic BB rat and NOD mouse. Am
J Physiol 1994;267:1094-1101.
12. Wang ZP, Cai SX, Liu DB, Xu X, Liang HP. Anti-
inflammatory effects of a novel peptide designed
to bind with NF-kappaB p50 subunit. Acta
Pharmacol Sin 2006;27:1474-1478.
13. Lopez-Franco O, Suzuki Y, Sanjuan G, Blanco J,
Hernandez-Vargas P, Yo Y, et al. Nuclear factor-
kappa B inhibitors as potential novel anti-
inflammatory agents for the treatment of immune
glomerulonephritis. Am J Pathol 2002;161:1497-
1505.
14. Letizia CS, Cocchiara J, Lalko J, Api AM.
Fragrance material review on linalool. Food Chem
Toxicol 2003;41:943-964.
15. Kubo I, Muroi H, Himejima M. Antimicrobial
activity of green tea flavor components and their
combination effects. J Agric Food Chem
1992;40:245-248.
16. Do Socorro S, Rosa Mdo S, Mendonca-Filho, RR,
Bizzo, HR, De Lopes AH. Antileishmanial activity
of a linalool-rich essential oil from Crotoncajucara. Antimicrob Agents Chemother
2003;47:1895-1901.
17. Peana AT, D’Aquila, PS, Panin F, et al. Anti-
inflammatory activity of linalool and linalyl
acetate constituents of essential oils.
Phytomedicine 2002;9:721-726.
18. Peana AT, D’Aquila PS, Chessa ML, et al. (-)-
Linalool produces antinociception in two
experimental models of pain. Eur J Pharmacol
2003;460:37-41.
19. Ghelardini C, Galeotti N, Salvatore G, Mazzanti
G. Local anaesthetic activity of the essential oil of
Lavandula angustifolia. Planta Med 1999;65:700-
703.
20. Swanston-Flatt SK, Day C, Bailey CJ, Flatt PR.
Traditional plant treatments for diabetes. Studies in
normal and streptozotocin-diabetic mice.
Diabetologia 1990;33:462-464.
21. Afifi FU, Saket M, Jaghabir M. Hypoglycemic
effect of linalool in normal and streptozotocin
diabetic rats. Acta Technol Leg Med 1998;9:101-
106.
22. Rao P, Pattabiraman TN. Further studies on the
mechanism of phenol sulfuric acid reaction with
furaldehyde derivatives. Anal Biochem
1990;189:178-181.
23. Johnson RN, Metcalf PA, Baker JR. Fructosamine:
a new approach to the estimation of serum
glycosyl protein. An index of diabetic control. Clin
Chim Acta 1983;127:87-95.
24. Niehaus WG, Samuelsson B. Formation of
malondialdehyde from phospholipids arachidonate
during microsomal lipid peroxidation. Eur J
Biochem 1968;6:126-130.
135Diabetologia Croatica 40-4, 2011
Deepa B, Anuradha CV / LINALOOL, A PLANT-DERIVED MONOTERPENE ALCOHOL, RESCUES KIDNEY FROM DIABETES-INDUCED NEPHROPATHIC CHANGES VIA BLOOD GLUCOSE REDUCTION

25. Jiang Z, Hunt J, Wolff S. Ferrous ion oxidation inthe presence of xylenol orange for detection oflipid hydroperoxide in low density lipoprotein.Anal Biochem 1992;202:384-389.
26. Levine RL, Garland, Oliver CN, et al.Determination of carbonyl content in oxidativelymodified proteins. Methods Enzymol1990;186:464-478.
27. Cook JA, Kim SY, Teague D, et al. Convenientcolorimetric and fluorometric assays for S-nitrosothiols. Anal Biochem 1996;238:150-158.
28. Anitha Nandhini AT, Balakrishnan SD, AnuradhaCV. Taurine modulates antoxidant potential andcontrols lipid peroxidation in the aorta of highfructose-fed rats. J Biochem Mol Biol Biophys2002;6:129-133.
29. Folch, J, Loer M, Stanley G. A simple method forthe isolation and purification of total lipids fromanimal tissue. J Biol Chem 1951;126:497-509.
30. Zlatkis A, Zak B, Boyle AJ. A new method for thedirect determination of serum cholesterol. J LabClin Med 1953;41:486-492.
31. Foster, LB, Dunn RT. Stable reagents fordetermination of serum triglycerides by acolorimetric Hantzsch condensation method. ClinChem 1973;19:338-340.
32. Falholt K, Lund B, Falholt W. An easy colorimetricmicromethod for routine determination of freefatty acids in plasma. Clin Chim Acta1973;46:105-111.
33. Chomczynski P, Sacchi N. Single-step method ofRNA isolation by acid guanidinium thiocyanate-phenol-chloroform extraction. Anal Biochem1987;62:156-159.
34. Vinson AJ, Howard BT. Inhibition of proteinglycation and advanced glycation end products byascorbic acid and other vitamins and nutrients. JNutr Biochem 1996;7:659-663.
35. Haugaard N, Haugaard SE. Stimulation of glucoseutilization by thioctic acid in rat diaphragmincubated in vitro. Biochim Biophys Acta1970;222:583-586.
36. Ivorra MD, Paya M, Villar A. A review of natural
products and plants as potential antidiabetic drugs.
J Ethnopharmacol 1989;27:243-275.
37. Trevisan R, Dodesini AR, Lepore G. Lipids and
renal disease. J Am Soc Nephrol 2006;17:145-147.
38. Çelik S, Özkaya A. Effects of intraperitoneally
administered lipoic acid, vitamin E, and linalool on
the level of total lipid and fatty acids in guinea pig
brain with oxidative stress induced by H2O2.
Biochem Mol Biol 2002;35:547-552.
39. Akira I, Yoshiaki N, Mitsutoshi T, Hitoshi H,
Masao M, Kuniaki T. Sodium- dependent glucose
transporter reduces peroxynitrite and cell injury
caused by cisplatin in renal tubular epithelial cells.
Biochim Biophys Acta 2005;171:109-117.
40. Navarro JF, Milena FJ, Mora C, Leon C, Garcia J.
Renal proinflammatory cytokine gene expression
in diabetic nephropathy: effects of angiotensin-
converting enzyme inhibition and pentoxifylline
administration. Am J Nephrol 2006;26:562-570.
41. DiPetrillo K, Coutermarsh B, Gesek FA. Urinary
tumor necrosis factor contributes to sodium
retention and renal hypertrophy during diabetes.
Am J Physiol Renal Physiol 2003;284:113-121.
42. King GL. The role of inflammatory cytokines in
diabetes and its complications. J Periodontol
2008;79:1527-1534.
43. Rivero A, Mora C, Muros M, Garcia J, Herrera H,
Navarro-Gonzalez JF. Pathogenic perspectives for
the role of inflammation in diabetic nephropathy.
Clin Sci 2009;116:479-492.
44. Dalla Vestra M , Mussap M , Gallina P, Bruseghin
M, Cernigoi AM , Saller A, et al. Acute-phase
markers of inflammation and glomerular structure
in patients with type 2 diabetes. J Am Soc Nephrol
2005;16:78-82.
45. Wang W, Koka V, Lan HY. Transforming growth
factor-beta and Smad signaling in kidney diseases.
Nephrology (Carlton) 2005;10:48-56.
136
Deepa B, Anuradha CV / LINALOOL, A PLANT-DERIVED MONOTERPENE ALCOHOL, RESCUES KIDNEY FROM DIABETES-INDUCED NEPHROPATHIC CHANGES VIA BLOOD GLUCOSE REDUCTION

46. Riser BL, Denichilo M, Cortes P, Baker C,Grondin, JM, Yee J, Narins RG. Regulation ofconnective tissue growth factor activity in culturedrat mesangial cells and its expression inexperimental diabetic glomerulosclerosis. J AmSoc Nephrol 2000;11:25-38.
47. UmezonoT, Toyoda M, Kato M, Miyauchi M,Kimura M, Maruyama M, Honma M, et al.Glomerular expression of CTGF TGF-beta 1 andtype IV collagen in diabetic nephropathy. JNephrol 2006;19:751-757.
48. Ziyadeh FN, Wolf G. Pathogenesis of thepodocytopathy and proteinuria in diabeticglomerulopathy. Curr Diabetes Rev 2008;4:39-45.
49. Sharma K, McGowan TA. TGF-beta in diabetickidney disease: role of novel signaling pathways.Cytokine Growth Factor Rev 2000;11:115-123.
50. Li J H, Huang XR, Zhu HJ, Johnson R, Lan HY.Role of TGF-beta signaling in extracellular matrixproduction under high glucose conditions. KidneyInt 2003;63:2010-2019.
51. Navarro JF, Mora C. Diabetes, inflammation,proinflammatory cytokines, and diabeticnephropathy. Sci W J 2006:6:908-917.
52. Ohga S, Shikata K, Yozai K, Okada S, Ogawa D,Usui H, et al. Thiazolidinedione ameliorates renalinjury in experimental diabetic rats through anti-inflammatory effects mediated by inhibition ofNF-kappaB activation. Am J Physiol RenalPhysiol 2007;292:1141-1150.
53. Thornalley PJ. Use of aminoguanidine(Pimagedine) to prevent the formation of advancedglycation endproducts. Arch Biochem Biophys2003;419:31-40.
137Diabetologia Croatica 40-4, 2011
Deepa B, Anuradha CV / LINALOOL, A PLANT-DERIVED MONOTERPENE ALCOHOL, RESCUES KIDNEY FROM DIABETES-INDUCED NEPHROPATHIC CHANGES VIA BLOOD GLUCOSE REDUCTION