a comparison of new measurements of total monoterpene flux
TRANSCRIPT

HAL Id: hal-00301520https://hal.archives-ouvertes.fr/hal-00301520
Submitted on 1 Dec 2004
HAL is a multi-disciplinary open accessarchive for the deposit and dissemination of sci-entific research documents, whether they are pub-lished or not. The documents may come fromteaching and research institutions in France orabroad, or from public or private research centers.
L’archive ouverte pluridisciplinaire HAL, estdestinée au dépôt et à la diffusion de documentsscientifiques de niveau recherche, publiés ou non,émanant des établissements d’enseignement et derecherche français ou étrangers, des laboratoirespublics ou privés.
A comparison of new measurements of totalmonoterpene flux with improved measurements of
speciated monoterpene fluxA. Lee, G. W. Schade, R. Holzinger, A. H. Goldstein
To cite this version:A. Lee, G. W. Schade, R. Holzinger, A. H. Goldstein. A comparison of new measurements of totalmonoterpene flux with improved measurements of speciated monoterpene flux. Atmospheric Chem-istry and Physics Discussions, European Geosciences Union, 2004, 4 (6), pp.7819-7835. �hal-00301520�

ACPD4, 7819–7835, 2004
New measurementsof total monoterpene
flux
A. Lee et al.
Title Page
Abstract Introduction
Conclusions References
Tables Figures
J I
J I
Back Close
Full Screen / Esc
Print Version
Interactive Discussion
EGU
Atmos. Chem. Phys. Discuss., 4, 7819–7835, 2004www.atmos-chem-phys.org/acpd/4/7819/SRef-ID: 1680-7375/acpd/2004-4-7819European Geosciences Union
AtmosphericChemistry
and PhysicsDiscussions
A comparison of new measurements oftotal monoterpene flux with improvedmeasurements of speciated monoterpenefluxA. Lee1, G. W. Schade2, R. Holzinger1, and A. H. Goldstein1
1Department of Environmental Science, Policy, and Management, University of California,Berkeley, 151 Hilgard Hall # 3110, Berkeley, CA 94720-3110, USA2Institute of Environmental Physics, University of Bremen, NW1, Otto-Hahn-Allee 1, D-28359Bremen, Germany
Received: 29 October 2004 – Accepted: 24 November 2004 – Published: 1 December 2004
Correspondence to: A. Lee ([email protected])
© 2004 Author(s). This work is licensed under a Creative Commons License.
7819
ACPD4, 7819–7835, 2004
New measurementsof total monoterpene
flux
A. Lee et al.
Title Page
Abstract Introduction
Conclusions References
Tables Figures
J I
J I
Back Close
Full Screen / Esc
Print Version
Interactive Discussion
EGU
Abstract
Many monoterpenes have been identified in forest emissions using gas chromatogra-phy (GC). Until now, it has been impossible to determine whether all monoterpenesare appropriately measured using GC techniques. We used a proton transfer reac-tion mass spectrometer (PTR-MS) coupled with the eddy covariance (EC) technique to5
measure mixing ratios and fluxes of total monoterpenes above a ponderosa pine plan-tation. We compared PTR-MS-EC results with simultaneous measurements of eightspeciated monoterpenes, β-pinene, α-pinene, 3-carene, d-limonene, β-phellandrene,α-terpinene, camphene, and terpinolene, made with an automated, in situ gas chro-matograph with flame ionization detectors (GC-FID), coupled to a relaxed eddy accu-10
mulation system (REA). Monoterpene mixing ratios and fluxes measured by PTR-MSaveraged 30±2.3% and 31±9.2% larger than by GC-FID, with larger differences atnight than during the day. Four unidentified peaks that correlated with β-pinene wereresolved in the chromatograms and completely accounted for the daytime differenceand reduced the nighttime difference to 19±3.4%. Measurements of total monoter-15
penes by PTR-MS-EC indicated that GC-FID-REA measured the common, longer-livedmonoterpenes well, but that additional monoterpenes were emitted from the ecosys-tem that represented an important contribution to the total mixing ratio above the forestat night, and that must have been oxidized during the day before they escaped theforest canopy.20
1. Introduction
Monoterpenes are a large class of biogenic C10H16 hydrocarbons which include thecommonly observed species α-pinene and β-pinene. Monoterpenes are emitted fromall conifers and some flowering plants (Lerdau, 1991). They are highly reactive andcan be oxidized by ozone (O3) and the hydroxyl and nitrate radicals, with lifetimes that25
range from days to minutes (Fuentes et al., 2000). In addition to their influence on the
7820

ACPD4, 7819–7835, 2004
New measurementsof total monoterpene
flux
A. Lee et al.
Title Page
Abstract Introduction
Conclusions References
Tables Figures
J I
J I
Back Close
Full Screen / Esc
Print Version
Interactive Discussion
EGU
oxidative capacity of the atmosphere, monoterpene oxidation products can partition tothe particle phase and contribute to secondary organic aerosol (SOA) (e.g. Kavouraset al., 1999; Makela et al., 1997; Griffin et al., 1999). These SOA represent a naturalsource of aerosol to the atmosphere that impact regional air quality and global climate(Andreae and Crutzen, 1997), therefore, quantitative and qualitative knowledge of ter-5
pene emission is essential to reduce the uncertainty in biogenic production of SOA.Ecosystem scale monoterpene fluxes to the atmosphere have been measured as
a sum of the individual fluxes of a few speciated monoterpenes, using GC-FID cou-pled with the flux similarity approach (e.g. Schade et al., 1999; Rinne et al., 2000) orcoupled with the relaxed eddy accumulation technique (e.g. Greenberg et al., 2003;10
Schade and Goldstein, 2003). While models of tropospheric O3 and SOA productionrely on flux measurements of a few species of monoterpenes, it is currently unknownif speciated flux measurements of a limited number of monoterpenes represent theimpact of total monoterpenes to the atmosphere. In addition to monoterpenes, otherterpene compounds, such as sesquiterpenes and oxygenated terpenes, also affect15
tropospheric chemistry (Fuentes et al., 2000).In this paper, we address the question of whether above-canopy fluxes of monoter-
penes are well represented by GC-FID-REA measurements of a limited number ofmonoterpene species. We improved our speciated monoterpene mixing ratio and fluxmeasurements by increasing the number of monoterpene species routinely quantified20
by our GC-FID-REA from four to eight, and simultaneously made the first ecosystemscale measurements of total monoterpene fluxes using a PTR-MS-EC. Comparison ofthese measurements help determine if other monoterpene compounds, in addition tothe eight species quantified by the GC-FID, are emitted from the forest and detectedby the PTR-MS in the measurements of total monoterpenes.25
7821

ACPD4, 7819–7835, 2004
New measurementsof total monoterpene
flux
A. Lee et al.
Title Page
Abstract Introduction
Conclusions References
Tables Figures
J I
J I
Back Close
Full Screen / Esc
Print Version
Interactive Discussion
EGU
2. Experimental
We report on a four day period in August 2002 of total and speciated monoterpene mix-ing ratios and fluxes made simultaneously above a young ponderosa pine plantation at1315 m elevation on the western slope of the Sierra Nevada, California (35◦53′42.9′′ N,120◦37′57.9′′ W). Temperature and 3-D wind speeds were measured using a sonic5
anemometer (Campbell Scientific, Logan, UT), mounted 12 m above ground level, 5 mabove the forest canopy. The sample inlet was located at the top of the tower, adjacentto the sonic anemometer. Air was pulled at 10 L min−1 through a 2µm Teflon particu-late filter, and brought down, using 1
4 inch ID Teflon tubing, to a temperature controlledcontainer. Air was sub-sampled by the GC-FID and PTR-MS from the same sam-10
ple line, and the same sonic anemometer was used to control the REA valve systemand for EC flux calculations. The GC-FID-REA system was calibrated with an internalstandard, by diluting ppm-level n-octane in UHP N2 (Scott-Marrin, Inc., Riverside, CA)directly into the sample line at the top of the tower, downstream of the particulate filter.Monoterpenes were automatically and simultaneously calibrated on both instruments15
every ten hours, rotating between three separate ppm-level monoterpene standards,diluted into the sample line inside the temperature-controlled container to achieve low-ppb concentrations, before sub-sampling to the GC-FID and PTR-MS. One standardcylinder contained monoterpenes as a mixture of α-pinene, 3-carene, and d-limonenein UHP N2, and two cylinders contained monoterpenes singly as either α-pinene or20
β-pinene in UHP N2. Blank measurements were run on the GC-FID every ten hours,and were run for five minutes each hour on the PTR-MS, by sampling zero air (AADCO,Clearwater, FL).
For measurements of total monoterpene flux, the PTR-MS acquired 3-D wind speed,temperature, and monoterpene concentration (in counts per second) at 2 Hz, and25
fluxes were calculated according to EC from the mean covariance between deviationsof the vertical wind speed and the monoterpene mixing ratio calculated from the 30-min time series of the de-meaned, de-trended, tapered, and appropriately lagged data
7822

ACPD4, 7819–7835, 2004
New measurementsof total monoterpene
flux
A. Lee et al.
Title Page
Abstract Introduction
Conclusions References
Tables Figures
J I
J I
Back Close
Full Screen / Esc
Print Version
Interactive Discussion
EGU
(Stull, 1988). The PTR-MS (Ionicon Analytik, Innsbruck, Austria) was developed byWerner Lindinger and his group at the University of Innsbruck, and is described in de-tail elsewhere (Lindinger et al., 1998). Briefly, the PTR-MS is a chemical ionizationtechnique that uses H3O+ to transfer a proton from water to the compound of interest,thus, any compound with a proton affinity higher than water will be ionized and detected5
by the quadrupole mass spectrometer. For monoterpenes, fragmentation occurs butusually produces only one fragment ion, so for most monoterpenes >99% of the signalis detected as C10H16H+ and C6H8H+ ions, which are monitored at m/z 137 and 81,respectively (Tani et al., 2003). We monitored m/z 81 and 137, each with a dwell timeof 0.2 s, primary ions H3O+ and H2OH3O+, and recorded information from five ana-10
log channels on 3-D wind speed, temperature, and drift tube pressure of the PTR-MS,so that one measurement cycle was completed in 0.5 s. A lag time between the windand concentration measurements of ∼4 s was measured by popping balloons filled withacetone-enriched air at the co-located sonic anemometer and sample inlet, and sub-tracting the time difference between the sonic and acetone spikes. This method agreed15
well with the lag time inferred through analysis of the PTR-MS data by finding the timedifference that produced the best correlation between deviations in wind speed (w’)and deviations in m/z 81 or 137 count rates (c’).
Calculated mixing ratios were corrected against the single β-pinene and mix of the α-pinene, 3-carene, and d-limonene standards to account for uncertainties in the reaction20
rate constants, and the mass dependant transmission efficiency of the mass spectrom-eter. Additionally, this correction ensured that PTR-MS and GC-FID measurementswere calibrated against the same standard. While the mass based detection of thePTR-MS is an important distinction from the GC-FID because it detects all compoundswith an m/z of 137 and 81, and thus, is a measure of total monoterpenes in the air25
sample, an important consideration is the possibility of non-monoterpene compoundsoccurring at the monoterpene masses. We observed that sesquiterpenes (m/z=205)also produce fragments at m/z 137 and 81, with ratios of the fragment to m/z 205count rate varying significantly between β-caryophyllene and α-humulene, from 0.11
7823

ACPD4, 7819–7835, 2004
New measurementsof total monoterpene
flux
A. Lee et al.
Title Page
Abstract Introduction
Conclusions References
Tables Figures
J I
J I
Back Close
Full Screen / Esc
Print Version
Interactive Discussion
EGU
(cps 137/cps 205) and 0.26 (cps 81/cps 205) for α-humulene, and 0.30 and 0.62 forβ-caryophyllene. The sesquiterpenes α-longipinene, longifolene, and germacrene Dwere identified in the oleoresin distillates of ponderosa pine (Himejima et al., 1992),however, the signal at m/z 205, monitored in Summer 2003, never exceeded 5% ofthe signal at m/z 81 and 137. Therefore, fragmentation of sesquiterpenes onto the5
monoterpene masses should only be a minor issue. We must also consider the con-tribution of other non-terpene species to the count rates of m/z 137 or 81. However,because the slope of the correlations between masses 137 and 81 from ambient aircompared with the slope of the correlations between masses 137 and 81 from thestandard additions where within 7%, we conclude that any such interference was small10
compared to the monoterpene signal.Speciated flux measurements of eight monoterpene species were made using a
dual channel GC-FID combined with the relaxed eddy accumulation (REA) technique.The GC-FID-REA are described in detail elsewhere (Lamanna and Goldstein, 1999;Schade and Goldstein, 2001). Air was sub-sampled from the inlet line at 20 mL min−1
15
for 30 min. Fast response REA segregator valves (Bio-Chem Valve Inc., Boonton, NJ)were controlled by the sonic anemometer and partitioned sample air into updraft ordowndraft channels according to the sign of the vertical wind speed obtained at 10 Hz.Because of the potential smearing of small eddies inside our sampling line, a dead-band (0.4σw ) was applied to reduce the sampling of these small eddies (Lenschow20
and Raupach, 1991). Sample air was cold trapped in 116 inch Silcosteel tubes (Restek
Inc., Bellafonte, PA) packed sequentially with glass beads, Tenax TA, and CarbopackX (Supelco, St. Louis, MO). The two sample tubes were heated from −10◦C to 220◦Cwithin 20 s to desorb the trapped compounds into He carrier gas, which delivered thesamples to two RTX-5 chromatography columns. The monoterpenes were identified25
according to their retention times on the columns, and quantified by the two flame ion-ization detectors. The n-octane served as an internal standard to correct for potentialleaks or changes in instrument response. Using the monoterpene standards, an instru-ment response factor was calculated according to the method described by (Lamanna
7824
ACPD4, 7819–7835, 2004
New measurementsof total monoterpene
flux
A. Lee et al.
Title Page
Abstract Introduction
Conclusions References
Tables Figures
J I
J I
Back Close
Full Screen / Esc
Print Version
Interactive Discussion
EGU
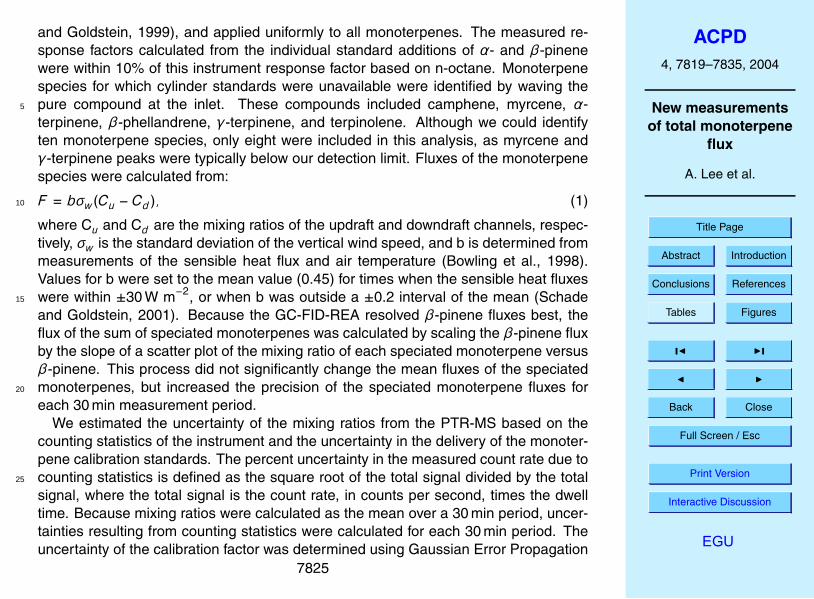
and Goldstein, 1999), and applied uniformly to all monoterpenes. The measured re-sponse factors calculated from the individual standard additions of α- and β-pinenewere within 10% of this instrument response factor based on n-octane. Monoterpenespecies for which cylinder standards were unavailable were identified by waving thepure compound at the inlet. These compounds included camphene, myrcene, α-5
terpinene, β-phellandrene, γ-terpinene, and terpinolene. Although we could identifyten monoterpene species, only eight were included in this analysis, as myrcene andγ-terpinene peaks were typically below our detection limit. Fluxes of the monoterpenespecies were calculated from:
F = bσw (Cu − Cd ), (1)10
where Cu and Cd are the mixing ratios of the updraft and downdraft channels, respec-tively, σw is the standard deviation of the vertical wind speed, and b is determined frommeasurements of the sensible heat flux and air temperature (Bowling et al., 1998).Values for b were set to the mean value (0.45) for times when the sensible heat fluxeswere within ±30 W m−2, or when b was outside a ±0.2 interval of the mean (Schade15
and Goldstein, 2001). Because the GC-FID-REA resolved β-pinene fluxes best, theflux of the sum of speciated monoterpenes was calculated by scaling the β-pinene fluxby the slope of a scatter plot of the mixing ratio of each speciated monoterpene versusβ-pinene. This process did not significantly change the mean fluxes of the speciatedmonoterpenes, but increased the precision of the speciated monoterpene fluxes for20
each 30 min measurement period.We estimated the uncertainty of the mixing ratios from the PTR-MS based on the
counting statistics of the instrument and the uncertainty in the delivery of the monoter-pene calibration standards. The percent uncertainty in the measured count rate due tocounting statistics is defined as the square root of the total signal divided by the total25
signal, where the total signal is the count rate, in counts per second, times the dwelltime. Because mixing ratios were calculated as the mean over a 30 min period, uncer-tainties resulting from counting statistics were calculated for each 30 min period. Theuncertainty of the calibration factor was determined using Gaussian Error Propagation
7825

ACPD4, 7819–7835, 2004
New measurementsof total monoterpene
flux
A. Lee et al.
Title Page
Abstract Introduction
Conclusions References
Tables Figures
J I
J I
Back Close
Full Screen / Esc
Print Version
Interactive Discussion
EGU
to combine the uncertainty from counting statistics with the other sources of uncertaintyin the calculation of the calibration factor, including the uncertainty in β-pinene stan-dard concentration (±2%), the concentrations of the mixture of three monoterpenes(±5%), and the ±1% uncertainty, at full scale, of the two mass flow controllers (MKSInstruments Inc., Andover, MA). For each 30-min average count rate from the PTR-MS,5
uncertainties from counting statistics ranged from 1 to 4.8% with a mean uncertaintyof 2.3%. Combining the uncertainty from counting statistics with the calibration un-certainty, the mean uncertainty in the total monoterpene mixing ratio measurementswas 4.9% with a range of 2.4 to 11.3%. Given our primary ion signal of 2–4 millioncounts per second, and the response of monoterpenes to the PTR-MS, the detection10
limit during this measurement period was ∼60 ppt. The lowest total monoterpene mix-ing ratio measured was 50% higher than the detection limit. It is important to note thatthe uncertainty estimate is based on four monoterpenes, and the actual uncertaintyis somewhat larger because the total monoterpene measurement consists of a mix ofmonoterpenes whose reaction rate constants contain additional uncertainty.15
Gaussian Error Propagation was also used to estimate the uncertainty of the mixingratios and fluxes measured by the GC-FID-REA system. Uncertainty in the monoter-pene concentration in the standard cylinders was combined with uncertainty in theaccuracy of the flow controllers. In addition, the deviation of the measured responsefactors of the monoterpene standards from the instrument response factor (Lamanna20
and Goldstein, 1999) was included in the uncertainty estimate for each monoterpenespecies. The mean uncertainty in the speciated monoterpene mixing ratios rangedfrom 17% for α- and β-pinene, to 34% for 3-carene. Given the response factor formonoterpenes in the GC-FID, the detection limit for speciated monoterpenes was 8 ppt.Mixing ratios of the dominant monoterpenes were always above the detection limit.25
Because we calibrated both the GC-FID and the PTR-MS instruments with the sameppm-level standards diluted to ppb levels in the same sample stream, any error in theabsolute concentration of the standards and measured flow rates for the dilution systemwould be propagated identically through both measurements. Thus, our conclusions
7826
ACPD4, 7819–7835, 2004
New measurementsof total monoterpene
flux
A. Lee et al.
Title Page
Abstract Introduction
Conclusions References
Tables Figures
J I
J I
Back Close
Full Screen / Esc
Print Version
Interactive Discussion
EGU
regarding percent differences in concentrations measured by the two methods shouldbe more accurate than the above uncertainty analysis implies. A critical difference ininstrument calibration would occur only if the GC-FID or PTR-MS system respondedsignificantly differently to monoterpenes that we could not calibrate directly versus com-pounds for which we had quantitative standards.5
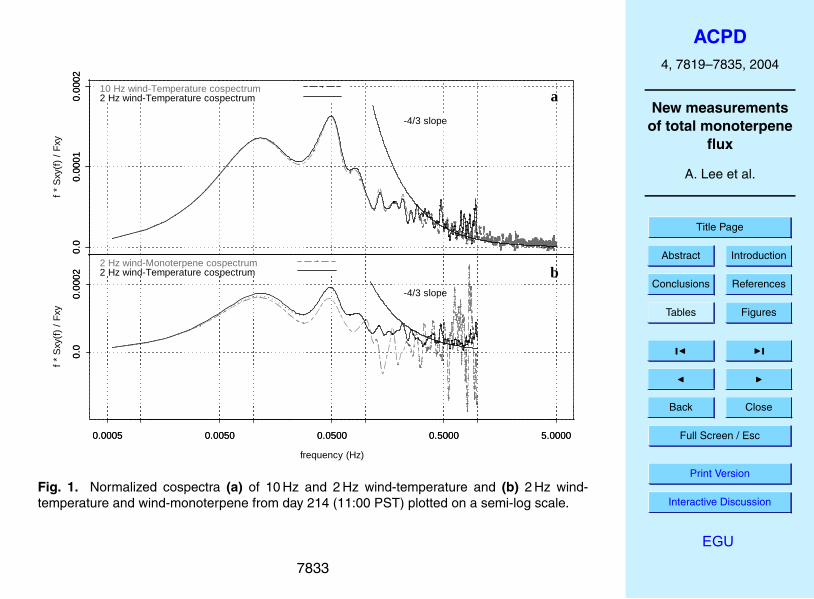
Potential underestimates in EC flux measurements due to loss of high frequency sig-nals are typically assessed using spectral analysis of the time series data. To examinethe potential bias in the calculated flux associated with our 2 Hz sampling frequency,we sub-sampled vertical wind and temperature collected at 10 Hz to match our 2 Hzsampling protocol. The cospectra are plotted on a semi-log scale so that the area un-10
der the curve is proportional to the covariance (Stull, 1988). Figure 1a shows that the2 Hz cospectrum is slightly elevated and noisier compared to the 10 Hz cospectrum atfrequencies near the Nyquist frequency (sampling frequency/2; the highest frequencythat can be resolved in the Fourier transform) (Stull, 1988), suggesting that aliasingmay cause the folding of high frequency energy onto lower frequencies, resulting in a15
distortion of the 2 Hz cospectrum. Because of the lower sampling frequency and addednoise, we expected to underestimate the calculated flux from the 2 Hz data comparedto the 10 Hz data, however, the sensible heat fluxes calculated at 2 Hz were not con-sistently lower than at 10 Hz, and agreed within ±10%, despite the additional noise.
The correction for high frequency flux loss due to the inertia of sensors can be esti-20
mated by applying an empirically-determined time constant, which acts as a low passfilter, to the “ideal” wind-temperature cospectrum (w ′T ′) so that the transformed w ′T ′
mimics the non-ideal cospectrum of w ′monoterpene′(w ′M ′; Fig. 1b) (e.g. Bauer etal., 2000). The ratio of the measured w ′T ′ and the transformed w ′T ′ represents thecorrection factor for the monoterpene flux. The normalized cospectra for the 2 Hz25
w ′T ′ and w ′M ′ (Fig. 1b) show that both cospectra follow the expected −43 slope in
the inertial sub-range, but the w ′M ′ cospectra suffers from noise at higher frequencies.Median correction factors calculated for the 2 Hz w ′M ′ data were small (<10%), but
7827

ACPD4, 7819–7835, 2004
New measurementsof total monoterpene
flux
A. Lee et al.
Title Page
Abstract Introduction
Conclusions References
Tables Figures
J I
J I
Back Close
Full Screen / Esc
Print Version
Interactive Discussion
EGU
highly variable due to the high frequency noise in the cospectra. We chose not to ap-ply these relatively small corrections based on the cospectral densities, which wouldhave slightly increased the difference between the fluxes measured by PTR-MS-ECand GC-FID-REA.
3. Results and discussion5
The diurnal cycles of total (PTR-MS) and the sum of speciated (GC-FID) monoterpenesover the four-day period in early August agree well (Fig. 2a), with higher mixing ratiosmeasured by the PTR-MS. Mixing ratios of total monoterpenes averaged 30±2.3%(mean ± standard error) larger than mixing ratios of the sum of eight monoterpenespecies, which is a significant contribution to monoterpene mixing ratio, considering10
β-pinene, the dominant monoterpene, contributes 40±1% to the sum of the eightmonoterpenes detected by GC-FID. Total monoterpene mixing ratios were 35±3.5%larger at night and 19±2.5% larger during the day (07:00–19:00 PST) than the sum ofspeciated monoterpenes. The time series of the percent difference between the mix-ing ratios measured by PTR-MS and GC-FID, plotted with O3 mixing ratio, show that15
periods when the PTR-MS measures significantly more monoterpene than the GC-FIDcoincide with periods of low O3 mixing ratio (Fig. 2b).
Careful inspection of the chromatograms showed that 6–10 small peaks were re-solved by the GC-FID in addition to the eight identified monoterpenes, and four ofthose peaks were correlated with β-pinene mixing ratios. Taking the area of those four20
unidentified peaks, and applying the GC-FID response factor used for the identifiedmonoterpenes, the resulting mixing ratios reduced the difference between total andsum of speciated monoterpenes to −0.94±2.8% during the day, and 19±3.4% at night.Thus, PTR-MS measurements of total monoterpenes and GC-FID measurements ofeight identified monoterpenes and 4 unidentified potential monoterpenes agree well25
during the day, but at night, additional compounds are detected by PTR-MS that arenot resolved by GC-FID. The detection of these additional compounds by PTR-MS at
7828
ACPD4, 7819–7835, 2004
New measurementsof total monoterpene
flux
A. Lee et al.
Title Page
Abstract Introduction
Conclusions References
Tables Figures
J I
J I
Back Close
Full Screen / Esc
Print Version
Interactive Discussion
EGU
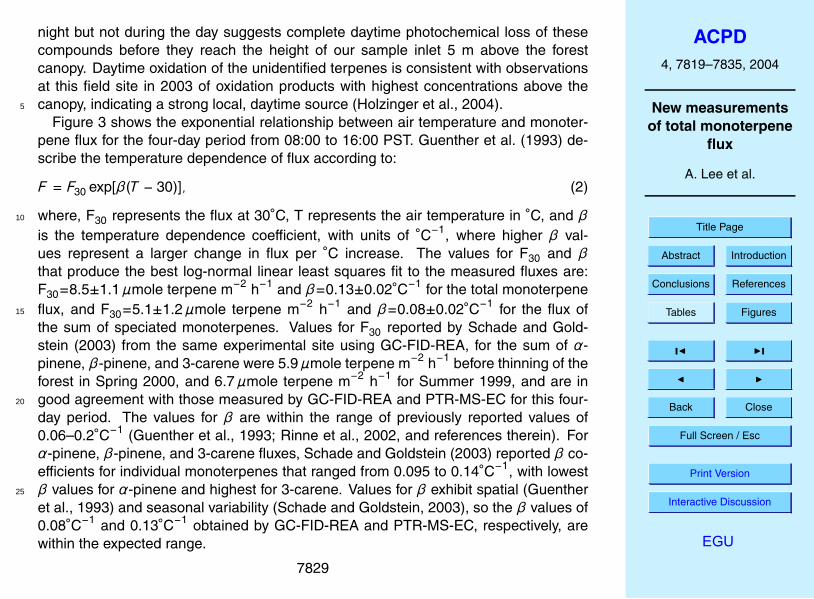
night but not during the day suggests complete daytime photochemical loss of thesecompounds before they reach the height of our sample inlet 5 m above the forestcanopy. Daytime oxidation of the unidentified terpenes is consistent with observationsat this field site in 2003 of oxidation products with highest concentrations above thecanopy, indicating a strong local, daytime source (Holzinger et al., 2004).5
Figure 3 shows the exponential relationship between air temperature and monoter-pene flux for the four-day period from 08:00 to 16:00 PST. Guenther et al. (1993) de-scribe the temperature dependence of flux according to:
F = F30 exp[β(T − 30)], (2)
where, F30 represents the flux at 30◦C, T represents the air temperature in ◦C, and β10
is the temperature dependence coefficient, with units of ◦C−1, where higher β val-ues represent a larger change in flux per ◦C increase. The values for F30 and βthat produce the best log-normal linear least squares fit to the measured fluxes are:F30=8.5±1.1µmole terpene m−2 h−1 and β=0.13±0.02◦C−1 for the total monoterpeneflux, and F30=5.1±1.2µmole terpene m−2 h−1 and β=0.08±0.02◦C−1 for the flux of15
the sum of speciated monoterpenes. Values for F30 reported by Schade and Gold-stein (2003) from the same experimental site using GC-FID-REA, for the sum of α-pinene, β-pinene, and 3-carene were 5.9µmole terpene m−2 h−1 before thinning of theforest in Spring 2000, and 6.7µmole terpene m−2 h−1 for Summer 1999, and are ingood agreement with those measured by GC-FID-REA and PTR-MS-EC for this four-20
day period. The values for β are within the range of previously reported values of0.06–0.2◦C−1 (Guenther et al., 1993; Rinne et al., 2002, and references therein). Forα-pinene, β-pinene, and 3-carene fluxes, Schade and Goldstein (2003) reported β co-efficients for individual monoterpenes that ranged from 0.095 to 0.14◦C−1, with lowestβ values for α-pinene and highest for 3-carene. Values for β exhibit spatial (Guenther25
et al., 1993) and seasonal variability (Schade and Goldstein, 2003), so the β values of0.08◦C−1 and 0.13◦C−1 obtained by GC-FID-REA and PTR-MS-EC, respectively, arewithin the expected range.
7829
ACPD4, 7819–7835, 2004
New measurementsof total monoterpene
flux
A. Lee et al.
Title Page
Abstract Introduction
Conclusions References
Tables Figures
J I
J I
Back Close
Full Screen / Esc
Print Version
Interactive Discussion
EGU
4. Conclusions
The eight identified monoterpenes measured by GC-FID above the forest account for∼70% of the total monoterpene mixing ratio and flux measured by PTR-MS. Six toten additional peaks were resolved by the GC-FID; four of these peaks correlated withβ-pinene and accounted for the daytime discrepancy between PTR-MS and GC-FID5
mixing ratios, and reduced the nighttime discrepancy to 19±3.4%. Thus, despite thedetection of eight identified and four unidentified potential monoterpenes, the PTR-MS still measured ∼20% more monoterpenes above the forest at night. The goodagreement between PTR-MS and GC-FID during the day but not at night suggests thatthe additional compounds detected by PTR-MS are reactive enough to be oxidized10
before escaping the forest canopy, and undergo complete photochemical destructionbefore we can detect them during the day. This is consistent with the recent daytimeobservations of oxidation products in and above the forest canopy (Holzinger et al.,2004). This work shows that GC-FID-REA measurements of speciated monoterpenemixing ratio and flux measure longer-lived and commonly occurring compounds well,15
but simultaneous measurements of total monoterpene mixing ratio and flux by PTR-MS-EC indicate that additional very reactive monoterpene species are emitted fromour field site and can be detected at night above the forest canopy by PTR-MS.
Acknowledgements. This research was supported by the National Science Foundation Atmo-spheric Chemistry Program (award ATM-0119510), the California Air Resources Board (con-20
tract 00-732), and the University of California Agricultural Experiment Station. A. Lee was sup-ported by a Graduate Research Education Fellowship from DOE-GCEP. We thank B. Heald,D. Rambeau, S. Rambeau, and the Blodgett Forest Crew for their invaluable support, D. Bal-docchi, L. Misson, and D. Farmer for discussions on spectral analysis, and SPI for allowing usto conduct our research on their property.25
7830

ACPD4, 7819–7835, 2004
New measurementsof total monoterpene
flux
A. Lee et al.
Title Page
Abstract Introduction
Conclusions References
Tables Figures
J I
J I
Back Close
Full Screen / Esc
Print Version
Interactive Discussion
EGU
References
Andreae, M. O. and Crutzen, P. J.: Atmospheric aerosols: Biogeochemical sources and role inatmospheric chemistry, Science, 276 (5315), 1052–1058, 1997.
Bauer, M. R., Hultman, N. E., Panek, J. A., and Goldstein, A. H.: Ozone deposition to a pon-derosa pine plantation in the Sierra Nevada Mountains (CA): A comparison of two different5
climatic years, J. Geophys. Res.-A, 105 (D17), 22 123–22 136, 2000.Bowling, D. R., Turnipseed, A. A., Delany, A. C., Baldocchi, D. D., Greenberg, J. P., and Monson,
R. K.: The use of relaxed eddy accumulation to measure biosphere-atmosphere exchangeof isoprene and of her biological trace gases, Oecologia, 116 (3), 306–315, 1998.
Fuentes, J. D., Lerdau, M., Atkinson, R., Baldocchi, D., Bottenheim, J. W., Ciccioli, P., Lamb, B.,10
Geron, C., Gu, L., Guenther, A., Sharkey, T. D., and Stockwell, W.: Biogenic hydrocarbons inthe atmospheric boundary layer: A review, Bull. Am. Met. Soc., 81 (7), 1537–1575, 2000.
Greenberg, J. P., Guenther, A., Harley, P., Otter, L., Veenendaal, E. M., Hewitt, C. N., James,A. E., and Owen, S. M.: Eddy flux and leaf-level measurements of biogenic VOC emissionsfrom mopane woodland of Botswana, J. Geophys. Res.-A, 108 (D13), 8466–8475, 2003.15
Griffin, R. J., Cocker, D. R., Flagan, R. C., and Seinfeld, J. H.: Organic aerosol formation fromthe oxidation of biogenic hydrocarbons, J. Geophys. Res.-A, 104 (D3), 3555–3567, 1999.
Guenther, A. B., Zimmerman, P. R., Harley, P. C., Monson, R. K., and Fall, R.: Isoprene andmonoterpene emission rate variability – model evaluations and sensitivity analyses, J. Geo-phys. Res.-A, 98 (D7), 12 609–12 617, 1993.20
Himejima, M., Hobson, K. R., Otsuka, T., Wood, D. L., and Kubo, I.: Antimicrobial terpenes fromoleoresin of Ponderosa pine tree pinus ponderosa: A defense mechanism against microbialinvasion, J. Chem. Ecol., 18 (10), 1809–1818, 1992.
Holzinger, R., Lee, A., Paw U, K. T., and Goldstein, A. H.: Observations of oxidation productsabove a forest imply biogenic emissions of very reactive compounds, Atmos. Chem. Phys.25
Discuss., 4, 5345–5365, 2004,SRef-ID: 1680-7375/acpd/2004-4-5345.
Kavouras, I. G., Mihalopoulos, N., and Stephanou, E. G.: Formation and gas/particle parti-tioning of monoterpenes photo-oxidation products over forests, Geophys. Res. Lett., 26 (1),55–58, 1999.30
Lamanna, M. S. and Goldstein, A. H.: In situ measurements of C-2-C-10 volatile organic com-pounds above a Sierra Nevada Ponderosa pine plantation, J. Geophys. Res.-A, 104 (D17),
7831
ACPD4, 7819–7835, 2004
New measurementsof total monoterpene
flux
A. Lee et al.
Title Page
Abstract Introduction
Conclusions References
Tables Figures
J I
J I
Back Close
Full Screen / Esc
Print Version
Interactive Discussion
EGU
21 247–21 262, 1999.Lenschow, D. H. and Raupach, M. R.: The attenuation of fluctuations in scalar concentrations
through sampling tubes, J. Geophys. Res.-A, 96 (D8), 15 259–15 268, 1991.Lerdau, M.: Plant function and biogenic terpene emissions, in: Trace gas emissions from plants,
edited by: Sharkey, T., Holland, E., and Mooney, H., 121–134, Academic Press, 1991.5
Lindinger, W., Hansel, A., and Jordan, A.: Proton-Transfer-Reaction Mass Spectrometry (PTR-MS): On-line monitoring of volatile organic compounds at pptv levels, Chem. Soc. Rev., 27(5), 347–354, 1998.
Makela, J. M., Aalto, P., Jokinen, V., Pohja, T., Nissinen, A., Palmroth, S., Markkanen, T.,Seitsonen, K., Lihavainen, H., and Kulmala, M.: Observations of ultrafine aerosol particle10
formation and growth in boreal forest, Geophys. Res. Lett., 24 (10), 1219–1222, 1997.Rinne, J., Hakola, H., Laurila, T., and Rannik, U.: Canopy scale monoterpene emissions of
Pinus sylvestris dominated forests, Atmos. Envir., 34 (7), 1099–1107, 2000.Rinne, H. J. I., Guenther, A. B., Greenberg, J. P., and Harley, P. C.: Isoprene and monoterpene
fluxes measured above Amazonian rainforest and their dependence on light and tempera-15
ture, Atmos. Envir., 36 (14), 2421–2426, 2002.Schade, G. W. and Goldstein, A. H.: Fluxes of oxygenated volatile organic compounds from a
ponderosa pine plantation, J. Geophys. Res.-A, 106 (D3), 3111–3123, 2001.Schade, G. W. and Goldstein, A. H.: Increase of monoterpene emissions from a pine plantation
as a result of mechanical disturbances, Geophys. Res. Lett., 30 (7), 1380–1384, 2003.20
Schade, G. W., Goldstein, A. H., and Lamanna, M. S.: Are monoterpene emissions influencedby humidity?, Geophys. Res. Lett., 26 (14), 2187–2190, 1999.
Stull, R. B.: An introduction to boundary layer meteorology, Kluwer Academic Publishers,Boston, 1988.
Tani, A., Hayward, S., and Hewitt, C. N.: Measurement of monoterpenes and related com-25
pounds by Proton Transfer Reaction-Mass Spectrometry (PTR-MS), Int. J. Mass Spec., 223(1–3), 561–578, 2003.
7832
ACPD4, 7819–7835, 2004
New measurementsof total monoterpene
flux
A. Lee et al.
Title Page
Abstract Introduction
Conclusions References
Tables Figures
J I
J I
Back Close
Full Screen / Esc
Print Version
Interactive Discussion
EGU
f *
Sxy
(f)
/ F
xy
0.0
0.00
010.
0002
0.0
0.00
010.
0002
10 Hz wind-Temperature cospectrum2 Hz wind-Temperature cospectrum
-4/3 slope
frequency (Hz)
f *
Sxy
(f)
/ F
xy
0.0005 0.0050 0.0500 0.5000 5.0000
0.0
0.00
02
0.0005 0.0050 0.0500 0.5000 5.0000
0.0
0.00
02
2 Hz wind-Monoterpene cospectrum2 Hz wind-Temperature cospectrum
-4/3 slope
a
b
Fig. 1. Normalized cospectra (a) of 10 Hz and 2 Hz wind-temperature and (b) 2 Hz wind-temperature and wind-monoterpene from day 214 (11:00 PST) plotted on a semi-log scale.
7833

ACPD4, 7819–7835, 2004
New measurementsof total monoterpene
flux
A. Lee et al.
Title Page
Abstract Introduction
Conclusions References
Tables Figures
J I
J I
Back Close
Full Screen / Esc
Print Version
Interactive Discussion
EGU
mix
ing
ratio
(pp
b)
0.0
0.4
0.8
1.2
1.6
PTRMSGCFID
050
010
0015
0020
00
PA
R (
mic
rom
ole
m-2
s-1
)
PAR
% L
arge
r P
TR
MS
than
GC
FID
020
4060
8010
0
020
4060
80
ozon
e m
ixin
g ra
tio (
ppb)
Ozone Mixing Ratio% Difference
mic
rom
ole
m-2
h-1
214.0 214.5 215.0 215.5 216.0 216.5 217.0 217.5 218.0
-50
5
05
1015
2025
air
tem
pera
ture
(de
g C
)
PTR-MS-ECGC-FID-REA
Air Temperature
a
b
c
2002 day of year
Fig. 2. (a) Total monoterpene mixing ratios and (c) fluxes measured by PTR-MS are greaterthan the sum of eight monoterpene species measured by GC-FID. (b) Diurnal cycle of thepercent difference between PTR-MS and GC-FID mixing ratios, plotted with O3 mixing ratio,show that the PTR-MS measures more monoterpenes than the GC-FID, particularly when O3mixing ratios are lower.
7834

ACPD4, 7819–7835, 2004
New measurementsof total monoterpene
flux
A. Lee et al.
Title Page
Abstract Introduction
Conclusions References
Tables Figures
J I
J I
Back Close
Full Screen / Esc
Print Version
Interactive Discussion
EGU
temperature (degrees C)
mic
rom
ole
terp
ene
m-2
h-1
0 5 10 15 20 25 30
-10
12
34
56 PTRMS-EC
GCFID-REA
PTRMS-EC F30 = 8.53 ± 1.14 � mol m-2 h-1 �
= 0.13 ± 0.02 ºC-1
GCFID-REA F30 = 5.07 ± 1.23 � mol m-2 h-1 �
= 0.08 ± 0.02 ºC-1
Fig. 3. Temperature dependence of total and speciated monoterpene fluxes.
7835