lime, cement, and lime-cemen'l' stabilizat.ion of a clay soil
TRANSCRIPT

LIME, CEMENT, AND LIME-cEMEN'l'
STABILIZAT.ION OF A CLAY SOIL
by-
Richard Frederick Broberg
Thesis submitted to the Graduate Faculty- ot the
Virginia Polytechnic Institute
in candidacy for the degree 0£
MASTER OF SCIENCE
in
Civil Engineering
August, 1962
Blacksburg, Virginia

2
TABLE or CONTE?iTS
I. Introduction•• •••• • •• • ••••••••• • •••
II. Review ot Literature.• •• •.•• •• • • •• • • • • •
III.
A. Cement Stabilization ot Soils •• • •• • • •••••
B. Lime Stabilization ot Soils ••••••• • •••••
c. Lime-Cement Stabilization of Soils
Materials •••• • •••• • • • ••
• • • •
• • • • • • • •
• • • • • • • • A. Soil • • • • • • • • • • • • • • • • • • • • • • • , •
B. Cement • • •••••••••••••• • •• • • • ••
c. Lime • • • • • • • .• • • • • • • • • • • • • • • • • •
IV. Laboratory Test Procedures • • • , • • • • • • • • • • • •
V. Results •••••••••• • .• • ••••••• • ••••
VI.
A. Preliminary Laboratory Testing Results ••••••••
B. Major Laboratoey Testing Results• •••• •••••.
c. Statistical Analysis ••• • •••
Discussion and Conclusions •••••• • • • •
• • • • • • • • • • • • • • • •
A. Atterberg Limits.••.• •••• • •• • • •••••
B. Uncured Compressive Strengths •••••••••• •.
c. Four-Day Cured Compressive Strengths ••••• • •••
D. Statistical Analyses • ••••••••••••••••
1. Lime percentages of o, ;, and 10 ••• •. • •••
2. Cement percentages ot o, S, and 10 • • ••••••
'.3. Lime-cement percentages ot 5-0, 0-5, 3-2, and 2-3 •
4. Lime-cement percentages of 10-0, 0-10, 6-4, and 4-6
Page
6
9
9
13
17
19
19
19
19
20
25
25 28
33
49
49 so 51 52 52
53 53 54

VII.
VIII.
IX. x.
TABLE or CONTENTS
5. Lime-cement percentages ot 6-4 and 4-6 • • • • • •
Page
• 54
E. Conclusions. ••• • • • • • • • • • • • • • • • • •• ss Recommendations •• • • • • Ac1cnowledgements • •.
Bibliography- •••••
Vita • • • • • • • • •
• • • •
• •
• ••• • • • • • • • • • • • • 57
• • • • • • • • • • • • • •• 58
••••••• • • •••• • •• 59
• • • • • • • • • • • • • • • • 61

LIST OF TABLES
Table Page
1. Atterberg Limits--Various Peroentagee ot Cement and Lime • • 25
2. Summary of Specimen Strengths. (O, ;, and 10 Per Cent Lime Additive) • • • • . • • • • • • • • • • • • • • • • • • 39
,3. 'l'hree-Wa.y Analysis of Variance Results for Streneth Da.ta (O, ;, and 10 Per Cent Lime Additiw) • ••• • ••• • • 40
4. Summa.ry of Specimen Strengths. (O, ;, and 10 Per Cent Cement Additive • • • • • • • • • • • • • • • • • • • . • • 4l
;. 'lhree-Way Analysis ot Variance Results for Strength Data (O, ;, and 10 Per Cent Cement Additive} • •••• • •• • 42
6. SU111DB.ry of Specimen Strengths (;-o, .o-;, ;-2, and 2-3 Per Cent Lime-Cement Additive}• ••••••• • •••••• • 43
7. 'l'hree-Way A."1alysis of Variance Results f'or Strength Data (5-o, 0-5, )-2, and 2-3 Per Cent Lime-Cement Additive) • • 44
s. Summary ot Specimen Strel'gths (10-0, 0-10, 6-4, and 4-6 Per Cent Lime-Cement Additiw) •••••••••••••• 45
9. 'lbree-Way Analysis ot Variance Results for Strength Data (10-0, 0-101 6-4, and 4-6 Per Cent Lime-Cement Addi tiff). • 46
10. Sminary of Specimen Strengths (6-4 and 4-6 Per Cent Lime-Cement Additive) • • ••••••• • • •• • • • • • • • • 47
ll. Three...Way Analysis ot Variance Results for Strength Data (6-4 and 4-6 Per Cent Lime-C..nt Additive) , •. •. • • 48

5
LIST 01'' FIGURES
figure Page
l. Effeet of lime-and cement-soil mixtures on Atterberg limits • 26
2. Effect of (cement-lime) soil mixtures on Attorberg limits • • 26a
3. St~a.ndard i?roctor and Standard Mini~ture compaction curves • , 27
4. Compacted strength-moisture-lime relationships ••••••• 29
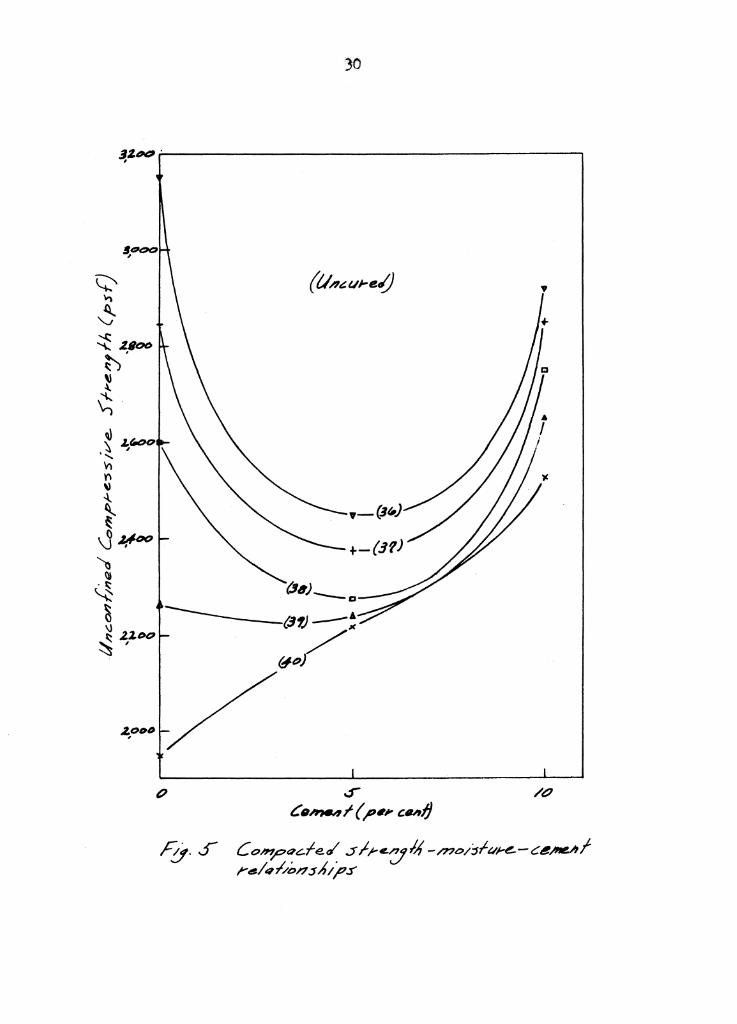
;. Compacted strenith-1noisture-ce.r.1ent relationships •••••• 30
6. Compacted strength-moisture-(cement-1.ime) relationships ••• 31
7. Compacted strength-moisture-(celll.ent-llme) relationships.• • 32 8. Cured strength-m.oisture-lime relationships ••••••••• 35
9. CU.red strength-moisture-cement relationships •••••••• 36 10. Cu.red strength-moisture-(cement-lim.e) relationships ••••• 37
ll. Cured strength-m.oisture-(eement-lime) relationships •• • • • .38

6
I. INTRODUCTION
Foremost among road construction problems, from an economic stand-
point, is the locating of soil deposits which can be used satisfactorily
in highway eubgrades, subbases, and base courses. In some areas of the
United States, the locating of such deposits is extremely difficult, due
to the fact that abundant sand and gravel deposits are nonexistent. It
is in these areas of nonexistent base and subbase material primarily that
construction agencies are now exploring and using chemical stabilization
of substandard highway soils. In its broadest sense, chemical stabili-
zation implies improvement of a soil so that it can be used for subba.sea,
bases, and in some rare instances, surface courses. The types of admix-
tures which have been used in stabilization work include cementing agents,
modifiers, waterproofing a.gents, water-retaining agents, water-retarding
agents, and miscellaneous chemicals. Each admixture behaves vastly
different £ran the others, each has its own particular use, and, accord-
ingly, each has its own lind.ta.tions. (1)
Among the cementing materials which may be used are portland cement
and lime. Portland cement has been used with great success to improve
existing gravel roads, as well as to stabilize granular soils, silty
soils, and lean clays. This success can be attributed to the strength
gains which soil cement combinations show over the natural material.
Besides portla.nd cement, hydrated lime has been used, particularly in
the southern states to improve the engineering properties of various
soils. Lime increases soil strength primarily by pozzolanic action,
which is the formation of cem.entatious silicates a."\d aluminates. This

7
uteri.al is most efficient when used in granular materials and lean clays;
the quantity required for a proper hydration generally is relatively low.
Since they are generally susceptible to freezing and thawing action, how-
ever, lime-soil mixtures are limited in use to regions ot mild climate. (l)
This brief description of lime and cement stabilization serves to
introduce the subject matter of this thesis. In a general sense, the
effects ot adding both hydrated lime and portland cement to one particu-
lar clay soil were studied. In the case of both the lime and cement
a.ddi ti ves, a study was made ot unconfined compress! ve strength change•
following a four-day curing period in a "moist" room.. In order to make
the investigation more complete, a similar study was made by using combi-
nations of both additives with the same soil. In both cases where the
additives were added separately, the percentages used were 5 and 10 per
cent by dry weight of soil. In the additive combination study, lime-
cement percentage additions were 2-3, .3-2, 4-6, and 6-4 by dry weight ot
soil. '!he first two percentages, when added together, amount to ; per
cent stabilizing agent, while the latter two total 10 per cent. Since
these two totals were the same as those used in the separate lime and
cement studies, an analysis of strength changes when lime-cement combi-
nations, lime, and cement were added to the soil could. be ma.de.
In addition to unconfined compressive strength testing, moisture-
density relationships were established as well as changes in Atterberg
limits (liquid limit, plastic limit, and plasticity index) with varia-
tions or both the quantity and type of stabilizing a.gent used.. Atterberg

l1mi ts were first determined for lime ad.di ti ve percentages ot O, $1 and
10 by dry weight of soil, after which the limits were then run with the
same percentages of cement stabilizing agent. For the additiw combi-
nation study, Atterberg limit determinations were ma.de for lime-cement
percentages of 2-.3, .3-2, 4-6, and 6-4 by dry weight of soil.

9
II. P.EVIEW OF LIT.ERA TORE
The tremendous increases in tra.tfic on u. s. highways haw high-
lighted the importance ot the base course and subbase in modern highway
construction more than ever before. In locations where satisfactory
base course materials are readily available, construction ot such bases
presents no problem. However, a serious aggregate depletion problc has
res~ted in many states due to the heavy consumption ot aggregate in the
post-World War II construction boom. To solve this depletion problem
and stUl produce satistactoey bases and subbases, the engineer ia either
forced to employ "marginal" base course material.a or to stabilize the
soil-in-place with chemical additives.
A. Cement Stabilization of Soil.a
The origin or the idea of mixing soil and chemical additives together
to produce a structural material has not been definitely established.
'.the first record in the United States of mixing soil and cement involves
a patent for 11Soilamies 11 issued in 1917 tor highway uae. Following this
in 1920 was another patent tor "Soilcrete, 11 also tor highway use. Within
the next decade, mixing soil and cement together was tried in Iowa, Ohio,
South Dakota, and Texas. However, none or the records on experiences
mention the use ot a material ot known or predictable characteristics
that could be quantitatively evaluated by laboratory tests nor wen con-
struction procedures outlined by suitable specifications. (2)
In 1932, the South Carolina Highway Department began inwstigationa
of mixing soil and cement under the leadership ot the late Dr. c. H.

10
Moorefield. SeTeral test sections were built in 1933 and 19.34. Although
the causes ot the soil and cement reactions remained elusive, the field
performance ot these trial projects clearly' demonstrated that soil and
cement were compatible materials and that they eoul.d be mixed together
to torm a usable road. Following this, the Portla.nd Cement Association
initiated an extensive research program in Januar., ot 1935 under the
direction ot F. T. Sheets, Consulting Engineer, and M. D. Catton, Devel-
opnent Department. (2)
To confirm results of the laboratory- research, the South Carolina
State Highway Department, Bureau of Public Roads, and the Portland Cement
Aasociation cooperated in construction ot a 1.5-mile section of pavement
near JohnsonTille in the tall ot 1935. '!his project was the tirst 11cigl-
neered" soil-cement road. Following this, additional experimental
sections were constructed in South Carolina, Illinois, Michigan, Missouri,
and Wisconsin. M. D. Catton (.3) has reported on the success ot these
experimental sections. B7 1940 over 7.5 million square yards of soil-
cement had been built in the United States, mostly on roads and streets.
During the war period, 1941-1944, 22 million square yards ot soil-cement
airports were built. Following World War II, the use ot soil-cement tor
roads and streets increased rapidly. Additional uses included subbaaea
tor concrete pavements, shoulders, widening, parking and storage areas,
and linings tor reservoirs, ditches, and canals. By 1960 the annual use
or soil-cement in the United States and Canada reached 46 million square
yards with a total constructed yardage to that date ot almost 294 million
square yards. (4)

11
The first noticeable property change which takes place when cement
is mixed with moist coheain soils is a marked reduction 1n plasticity.
This reduction takes place either because of a cation exchange or a
crowing ot additional cations onto the clay, both processes acting to
change the electrical charge density around the clay particles. Clay
particles then become electrically attracted to one another, causing
flocculation or aggredation. the aggregated clay behaves like a silt,
which has a low plasticity or cohesion. Even the addition of relatively
small amounts of cement causes this aggregation to take place rather
quickly. The hydration ot the different cement constitWtnta occurs at
different rates in compacted cement-treated soil. The cementation is
mainl.7 chemical 1n nature and may be visualized as due to the developaent
of chemical bonds between adjacent cem.ent grain surtaoee, and between
cement grain surfaces and exposed soil particle surtaces. (5) ' The manner in which portland cement stabilizes soils to meet require-
ments for soil-cement differs somewhat tor tine-grained and gram1l ar
soils. In 1'1.ne-grain silty and clayey soils, the cement developa strong
linkages among and between the mineral aggregates and the soil aggregates
to tom. a matrix that ettectively encases the soil aggregates. lbe result-
ing matrix torma a honeycomb type of structure on which the strength ot
the mixture depends, since the clay aggregations within the matrix have
little strength and contribute little to the strength ot the soil-cement.
'lhe aurtace chem.cal ettect of the cement reduces the water affinity and
thus the water-holding capacity ot clayey soils. With reduced water
at1'1.n1ty, reduced water-holding capacity, and a strong matrix, an

12
encasement of the larger unpulverized raw soil aggregates is proYided.
Because of its strength and reduced water aftlnity, this encasement eervea
not only to protect the aggregates but also to prevent them trom swelling
and softening from absorption ot moisture and from sut.fering detrimental
freeze-thaw effects. (5)
With granular soils, the cementing action is aimUar to that which
takes place in concrete, with the exception that the cement paste does
not till. the voids in theaggregate. In sands, the aggregates become
cemented only at points of contact. The more densely graded the soil,
the smaller the voids, the more numerous and greater the contact areas,
and the stronger the cementing act.ion. Since well-graded granular soila
generally haTe a low swell potential and low trost susceptibil.1.ty, it is
possible to stabilize them with lesser cement contents than are needed
tor the uniformly graded sands, 'Nhich have a minimum ot contact area
between grains. For any type of soil, howeTer, the cementing process is
giwn the maxSmnm opportunity to dnelop when the mixture is hi~ coa-
pacted at a moisture content that facilitates both the densitication ot
the m:1x and the hydration of the cement.. (5)
the main requirements tor soil-cement of a prescribed quality are
that: (a) an adequate amount or cement ia mixed with the pulverized soil;
(b} the proper amount of water ia dispersed through the aoil-cement mix;
{c) the soil-cement mixture is properly denaitied; and (d) the compacted
soil-cement is protected against moisture loss and excessively low tempera-
tures during a prescribed curing period. In order tor the first three
requirements to be met, comm.only used tests and observations are now uaed

13
to predetermine control £actors. 'lb.ese tests and observations a.re ot two
types: those performed on the soil for the purpose of identification, and
those performed principally for controlling the design of the soil-cement
mix to meet specific requirements. For each of the two categories there
are several tests which a.re cormnonly used. The most commonly used soil
identification tests are liquid limit, plastic limit, and mechanical
analysis. quality control tests on soil-cement mixtures include moisture-
density relations, freeze-thaw tests, wet-dry tests, and COl'llpresaive-
atrength tests. (6)
B. Lime Stabilization of Soils
Although older types of stabilization such as bituminous, soil-cement,
and calcium chloride have been employed for years, lime stabilization, in
a modern sense, is relatively new. However, the Romans used lime exten-
sively in building roads, one of which was the Appian Way. In f'act, the
only materials used by the Romans were rock of various sizes, sand, and
lime, with lime being used in three of the five layers trom subbase to
wearing surface. 'n"ie Chinese have also used a crude form of lime stabi-
lization on the rural and village roads of China for years. Rule of thumb
mixing of lime with the soil-in-place was followed by compaction with
crude methods, with no wearing surface being used. In addition, lime has
also been used as the cementing material for earth dams constructed in
both China and India. (7) In the l920's the University of Missouri experimented with hydrated
lime on unpaved earth roads in cooperation with the Missouri Highway
Department. The only purpose of the experiments conducted then was to

14
prnent rutting and disintegration ot the earth roads during rain and snow.
Later, the u. s. Bureau or Public Roads became interested in the use of
lime tor stabilizing and conducted some field tests in South Dakota and.
Iowa. It was just two or three years later though that these roads tailed
since the stabilized base without a wearing surface had little resistance
to the abrasive action of traffic. (7) Nothing of importance was attempted with lime for road stabilization
until about 1938 when the Texas Highway Department conducted extensive
laboratory tests with varying percentages of lime on different types ot
southwestem soils. However, field work using lime was interrupted b7
World War II, even though laboratory.tests had proved lime to be generally
et.fective with clay soils. The first actual lime stabilization project
occurred in 1943 when two per cent of hydrated lime was used by the Corps
of Engineers to reduce the plasticity index of a caliche gravel in the
construction of a base course tor the runways and taxiways at Chase FJ..eld,
Texas. In spite of heavy wheel loads and considerable traffic during
World War II and for several years afterwards, the lime treated sections
showed remarkable durability. (7) It was not until August, 194.5, that lime stabilization was first
employed on a scientific basis by the Texas Highway Department. Approxi-
mately three per cent of commercial hydrated lime was used around Austin
in treating clay-gravels, granite gravels, and callche soils on tarm-to-market roads., stretches of state and u. s. highways, shoulders, and city
streets. Gradually other sections of the state tried lime, so much so that
within eight years the equivalant of about 250 miles of lime stabilized
15
roads had been constructed in Texas. EYentually-, other states began
experimenting with lime. Among these states were California, Kansas,
Arkansas, Missouri, Iowa, and Minnesota, while other states have started
to carry on laboratory and field tests, after which will come further
experimentation with lime in actual projects. (7) For the most part, lirn.e stabilization projects which have been U."'lder-
taken in recent years have been quite successful. With over 11,000 miles
of road equivalant in 35 states, lime stabilization is not experimental;
it is a well-proven road building method (8). That lime stabilization
is another 11tool 0 tor the road builder to use in complex construction
problems is evident because of its successtul and economic use on all
types ot roads, including 500 miles of interstate freeway in seven states.
'!he action of lime in soil can be explained by three distinct steps.
The first step is alteration of the water film surrounding the clay
minerals. A second step is the agglomeration of fine clay particles into
coarse, friable particles (silt and sand sizes) through a phenomenon
called base exchange (9). Base exchange involves either a cation exchange
or a crowding of additional cations onto the clay, with both processes
acting to change the electrical charge density around the clay particles.
Clay particles then become electrically attracted to one another, causing
flocculation or aggregation. Once the electrical charge density has been
changed, the clay particles behave as a silt, which has a low plasticity
or cohesion. A second chemical reaction is carbonation of lime by carbon
dioxide of the air producing calcium carbonate, a weak cement which is
deleterious to over-all strength gains. (10)

16
The third step in the action of lime in so.il can be explained as a
reaction of the lime with soil components to form new chemicals. 'lhe two
principal components of soil which react with lime are alumina and silica.
'lhis reaction is a long-term reaction and one that results in greater
strengths if lime-soil mixtures are cured for a period of time. It has
been teriued 11pozzolanic action. 11 'l'he amount of pozzolanic action which
will take place depends on such variables as qua.""'l.tity of lime, soil type,
and the length of curing time. (l)
Changes in the engineering properties or clayey soils, such as plas-
ticity, density, and strength, with addition of lime depend a.ppree,iably
on the cation originally absorbed on the clay surfaces, and on the type
ot clay (11). The nature or the exchangeable cation does not make much
difference in kaollr..i tie soils, but it makes a tremendous difference in
montmorillonitic soils. Expanding clays containing montmorUlonite react
readily with lime irr.mediately losing plasticity, and. after oom.paction
slowly gain pozzolanic strength. Clays contairdng mainly illite,. chlorite,.
or kaolinite are less effective users of lime. (9)
One of the most important functi9ne of lime is that it changes the
soil's plasticity appreciably. Lime increases both the liquid- and
plastic-1.i:mit values for soils having a plasticity index of less than
fifteen, which brings about an increase in plasticity index. For the
more plastic soils, however, lime generally decreases the liquid limit
and increases the plastic limit,. bringing about a decrease in plasticity
index. Lime-soil mixtures generally have lower compacted densities than
those of the natural soil. The decrease in density may be as much as five

17
per cent. Because of lower densities, a decrease in soil strength might
be expected. However, the reverse is true. The immediate increase in
soil strength is brought about by changes in the water films surrounding
the clay particles as well as granulation of the particles. Curing the
specimens for a period of time brings about further increases in strength.
(l) Coramonly used tests in soil-lime quality control are moisture-d.enslty
relations, freeze-thaw test, wet-dry tests, and compressive strength
tests. (12)
c. Lime-cement Stabilization of Soils
The large-scale employment of lime-cement soil stabilization is rela-
tively recent. In tact it was the success or the Texas Highway Department
in tLe field of lime stabilization which eventually bro~;ht about the firet
lime-cement stabilization project in 1950. Credit for the initial use ot
this type of si:.abilization belongs to the Fourth Army Engineers operating
out 0£ Fort Sam Houston, Texas. Around 1950, the Fourth Army Engineers
encountered areas of non-plastic materials which were not materially
affected by tLe addition of lime at Fort Sam Houston, Camp Polk, and Fine
Bluff Arsenal. In many instances these areas were interspersed with areas
having the soil portion too plastic to be mixed satisfactorily and eco-
nomically with cement unless the plastic characteristics of the clay were
changed. In order to correct this situation, a hydrated lime-cement combi-
nation plan was developed and used very effectively. By 1952, a total ot
2181000 square yards of lime-ce.~ent stabilization had either been completed
or placed under contract by the Fourth Army Engineers. (13)
In lime-cement stabilization., the lime lowers the plasticity index
of the clay, thereby making the cement combine more readily and ef.f'i-
cienUy with the soil particles. The cement combines so much more readily
that tbe Army clai.ms any extra manipulation required by using two admix-
tures separately is more than offset, since soil containing lime is much
more easily pulverized. In using this type of stabilization, the Anrty
combined two per cent hydrated lime by weight with six per cent cement
by volume. Fuller and Dabney (10) have reported on the success obtained
by using this percentage combination. In one particular case., this lime-
cei:1.e:.1t percentage was added to a. soil with a plasticity index of 25, and
a liquid limit o.f 40. After the samples had been subjected to 12 cycles
of a wet-dry test, the percent loss was 3.7. After a sample containing
eigb.t per cent cer.':ent by volume had been subjected to the same test., the
per cent loss was 8.4. Therefore, for the sample containing the additive
co.11bination, the per cent loss was but one-half the loss obtained with
the specimen containing eight r,er cent cement. (13)

19
III. MATIRIALS
'lb• clay ~11 used in all teats was taken frcm. the foundation exca-
vation for the Civil Engineering Building on the Virginia Pol:,t.echnic
Institute campus, It was reddish-brown in color, with plasticity charac-
teristics aa follows s liquid 1imi t - 67, plastic limit - 37, and
plasticity index - ,30. A mechanical. analysis which had previously- been
performed by Jan (14) showed that 96,9111, of the soil was finer than Sieve
No. 200. Classification of the soil according to the AASHO system (15)
showed it to be an A-7-5(20).
B. Lime -The quality ot the qdrated lime uaed in the experiments is coftNd
in AS'l'M Designation C-207, 'lype N. It waa manufactured by the Ripplemead.
Lime Company, Inc. of Ripplemead, Virginia.
c. Cement
An air-entraining {Type I-A) Lone Star :portland cement was ueed in
all cement additive experiments. Previous research (16) comparing the
use of normal (Type I) and air-entraining (Type I-A) cements with three
soils has shown that IGOisture-denait.y relationships and compreseive
strengths were sufficiently similar ao that the two types ot cement can
be used interchangeably in soil-cement construction,

20
IV. LABORA 'roRY TEST PROCEDURES
The major portion or this thesis is based on results obtained from
the unconfined compression of specimens ::nade with the Harvard i•liniature
Compaction apparatus (17). However, other tests were performed in con-
junction with the compression testing, and they will be described along
with any difficulties wtiich were encountered.
Tne miniature compaction mold used measures 1.313 inches inside
diameter with a length of 2.861 inches. Its volume is equal to 1/454
cubic feet. With this volwne, the weight of compacted soil in grams is
equal to the wet density in pounds per cubic feet. Before the unconfined
compression testing could be done, it was first necessary to determine
what compactive effort should be used to produce dry densities which
would be equivalant to Standard AA3HO dry deru!dties. The miniature com-
paction apparatus is equipped v,ri th a plunger attached to a spring which
compresses U.."1der a force of 40 pounds. It was found that 25 blows of this
plunger applied to three u..'tlform soil layers in the ha.rvard device yielded
dry densities which were equal to dry densities obtained by running the
Standard hASHO teat on the same soil. 'l1he opti.mull density occurred at
approximately the same moisture content in both cases, but a distinct
variance was noted in the two density-water content curves. The 11Standa.rd 11
curve re~.ained relatively flat within 3 or 4 percentage points of the
optimum moisture content on both the dry a.nd wet sides, while the "Minia-
turett curve yielded a much steeper sloJ;ie on both sides of the optimum
moisture content. Because of this much steeper slope, the miniature
compaction dry density is extremely sensitive to water content, and it

21
was found that a difference in water content of only one per cent could
create a difference in dry density of as much as two pounds per cubic foot.
It was also~sired to run unconfined. compression tests at a oom.pactift
effort equi val.ant to Modified AASHO, but this phase of the testing had
to be abandoned. 'l'"w0 different com.pa.ctive efforts were tried in an
attempt to obtain the sa.'lle dry density as the Modified AASHO test yielded
with the same soil, but in each case the dry density obtained was approxi-
mately six pounds per cubic toot less than what it should have been. It
may therefor~ be concluded tl~at Modified AASHO density cannot be obtained
with the Harvard apparatus, a.t least not with the 40 pound spring which,
along with a 20 pound spring, is part of the auxiliary equipnent that
comes with this compaction device. The desired resul.ts may have been
obtained with a heavier spring.
The unconfined compression testing was divided into two parts. In
the fir&t pa.rt, compacted specimens were tested in unconfined compression
immediately after they had been molded. A total of 81 specimens were
ma.de and tested, with nine samples being fabricated. for each additin
percentage used. 'lhree specimens were compacted at a water content on
the dry side ot the density curve, three a.t optimwn moisture content
(OMC), and three at a water content approximately three per cent greater
than OMC. When the cett.ent and lime additives were added to the aoil
separately, 5 .and 10 per cent by dry weight of soil was used. In the
additive combination study, lime-cement percentage additions were 2-3,
3-2, 4-6, and 6-4 by dry weight of soil. In the second part of the uncon-
fined compression testing, the same procedure was toll.owed, with the

22
exception that the specimens were not failed in compression until after
a tour-day storage period in a 100 per cent humidity curing room.
Prior to the compression testing, several specimens were compacted
at each stabilizing agent percentage tc determine the optimum moisture
content. With this known beforehand, "d.rr' :moisture contents were kept
about 3 per cent less than OMC while "Wet" moisture contents were kept
at appNXimateq the same percentage above OMC. For the uncured apeci-
ana, the moisture content sample included the entire tailed specimen.
J'or the cu:red specimens, however, the moisture content sample was taken
trca the soil which remained in the mixing pan after each cylinder had
been compacted. 'Dd.e water content, along v.1.th the weight ot the com-
pacted specimen, was uaed in determining the as-ccmpacted dJ7 densities.
Foll.owing the foar-day curing period, each specimen was weighed, and its
length and diameter dim.ens.ions were measured to the nearest 0.01 inch.
This was done before the unconfined compression testing. After testing,
water content determinations were again made, this time using the tailed
specimens. 'l'hese water contents, along with the weights ot the cured
specimens prior to testing were used to determine the as-cured dry' densi-
ties. In some casee during curing, overall epecimen dimensions either
increased or deereasedJ accordingly, compacted. dry densities and moisture
contents also changed scraewhat. 'ftlerefore, two dry densities-one at
compaction and one at compression testing-were detel"llined tor each cured
specimen.
caring ot the soil specimens at first presented a probl•• 'lbe
specimens were placed in gallon cans with the lids raised somewhat so

2,3
that the specimens would be exposed to the temperature and humidity con-
ditions which existed in the curing room. Ll.ds were kept over the cans
so that water would not collect on the top of the specimens. However,
attempts were first made to cure the specimens on moist porous stones
with the water level in the gallon cans kept at almost the top of the
porous stones. With the use of porous stones, water was able to rise up
into the specimens ttrough capillary action. This, in effect, increased
the water content appreciably, and hindered gains in strength which would
have developed if curing conditions had been beneficial. Since this
method of curing proved unsatisfactory, specimens were again paced inside
the gallon containers, but this time on inverted moisture cans so that
water could not penetrate into the specimens. This method of curing
proved satisfactory, and noticeable strength gains developed in those
specL'llens containing the larger amounts of stabilizing agent.
Attempts to run liquid limit tests on the soil according to ASTM
test n;.ethods after lime had been added were unsuccesstul. This can be
attributed to tbe capacity or lirne to rapidly dry out a clay soil. Hilt
and Davidson (10) have reported some degree of success in running limits
after the lim~ soil, and water mixture had been seasoned. tor two days in
a curing room. '!his procedure allowed the water to infiltrate the clay-
particles thoroughly and produce uniform wetting of the sample. Since
prelindn~y tests run by Hilt and Davidson after different storage periods
up to four days showed no perceptible daily change in the liquid and
plastic limits after two days storage, it was decided for the purposes ot
this thesis to ru.n all Atterberg limit teets after a two-day curing period..

24
With the exception of the two-day curing period., plastic limit tests
were run in accordance with AS'l'M D424-54T, "Plastic Limit and Plasticity
Index of Soils." Liquid llmit tests were run in accordance with .ASTM
D423-54T, "Liquid Limit of Soils, .. with the additional moditiea.tion that
the Casagrande grooving tool was used.

25
V. R&SULTS
A. Fr,elimiparz Laboratol"'l,l Test1A£; Results
Prior to ti:e unconfined compression testing, two other series or tests were run. Atterberg lint test results are suramarized in Table l
and reported graphically in Figures land 2. '!hese figures and table
TABLE l
ATTERBERG LIMITS-VARIOUS PERCENTAGES OF CJMENT AND LIME
ilme-Cement Liquid iliiiit Plastic Lim!t Plasticity Index Per Cent (LL) (PL) (PI)
0-0 67 37 30 0-5 66 39 27
0-10 75 47 28
5-0 64 41 23 10...0 68 4S 23
2 ... 3 63 42 2l
3-2 62 43 19
4-6 78 49 29
6-4 70 49 2l
illustrate the changes which took place in the plasticity index, as well
a.s the liquid (Lt) and plastic (PL) li.'nits• with changes in the type and
percentage of stabilizing agent added to the soil, In Figures la and lb,
the e!'fectfl of adding; and 10 per cent lime and cement separately to the
soil are shown. Similarly, significant changes which occurred in the
limits once ceno..ent-lime combinations had been added to the soil are

t fo,-------------------------. 1-" ~H i -~.,... p.r..,z;s.
L~ '1'.
.PI-.3e> J ,, 1 ~.i "' .h
35"--------------0 -5
1,,;,,e ( pt!,,. c,z,,f by tl,.7 w,!fl.-1)
t ?7
./'.I-1.8
,P.I-2.1 ,'.C-30
:JS---------------------__. 0 J /D
C4.,,,e~l(,1:n11• c:.e,,f 1,7 a-1,..1 iuqj/,1) , .,..
F;j. / £1./"~c../-o( /4',,,e.-- 0'1d CfZ~Q.,,/ -Jo// ;,, .,j /uJ..e.s on ,4/--h .. 1--/.u .. 7 J,;,.;./s

26a
t ?or--------------------=1--, I.J.-6'1 - '/4'
i,1 t ""S"• t ~I-3o
'3 H
.,.,.
PI-:u
l . ho..,,
2.-.a Ct1m,v,f-L;,,,,. ( pa; c&Af /Jy tl1-y w•iAf)
'1
t 70
u.-.1 ;-,J
'I-..
!s-• '1
'3 ,l'J-3d7
ct H ½
.3S' (,)-.::>
l'I-~1
;PI-2/
L-.3-2 a.-1-
Cen,t1M1"- L/;,,e. { p•r t:.J£11/ b)" q';.y wtaj,if)
E.f".fec.l of So// hJ/Jt.lwJ--~s on /-ll-ls;,Je.7 /,;,,,.,ifs

I 'lo
'S B;f' \)
\. . \\
v 8t:J
..... ""'
'1 t-'1 1.r +
J. 'l
a s h,,-,d',," a' ? 1--oc. for + :5A:::,nc/4,-tl ~A/q,fu;,~
+-
3/
.5,lqnd<7rd hoc../o,.,, t7/Jd .J7'-qn/4;,-d )1/l'J/4fu;.-~ compc:,c.hon cu,-,J/e.~

28
brought out 1n ftgures 2& and 2b. 'I.be second eeries ot.teata vaa an
attempt to correlate result.a obtained by using a Harvard Miniature Com-
paction apparatus with Standard AASHO dry density and moisture content
tor one particular clay soil. Figure 3 illustrate• the aueceu ot this
correlation. It may be seen that maximum densities varied by not more
than 0.5 pounds per cubic foot, while optimum moisture content (OMC)
remained at 32.4 per cent in both cases. This correlation ot the minia-
ture compaction device was obtained with a 40-pound spring-plunger
assembly. 'J.wenty-five blows of the plunger were applied to three equal
layers of soil.
B. Major Laboratoq Test!Pg Result9
The greatest portion ot the laboratory testing was concentrated on
the unconfined compression of miniature compaction specimens. For the
sake of clarity, a description of the graphical. result, presented in
Figures 4-ll will be di'Yided into two parts. '!he first part will be con-
cerned with ftgurea 4-7, which show strength curves for uncured specimens
which were tailed imudiately atter compaction. For each ot the four
figures, uncon.tined compresaiw strengths for different moisture contents
are plotted against additive percentages. In Figure 4, lime waa uaed u the additive, while 1n Figure 5., cement was used. In Figures 6 and 7,
strengths were plotted against cement-lime combinations. Detore these
plots could be made, however, moisture-atrength curves had to first be
drawn tor each additive percentage. Following this, three or tour water
contents which were within three per cent ot OMC were se.lected and the
corresponding strengths read ott the graph. Wi tn additive percenta.aea,
water contents, and strengths known, Figures 4-7 could be plotted.

»Od',----------------------,
/0
C o/np,G-fe.d' sl;-•h:,l/,-h?o/Slvre-t~e.-1-'e./,,h~n:1 A ii"~
30
9-z~~·----------------------,
.z.,ooo
.s-- /0 C11~ / ( ,PIJr Clllh/)
F_j. S' Compa?fe./ .5/;,e~,U -;770/j/-vH!--C8/#le.hf r4i/q//cn J/p.f

31
+
t,8)-- a
+(.Jf}
~•'701-------------L----------1-~ P-0 2-.3
C ftlAlll"7 /- -L /Me. { p eJ.- all I)
C on1pa(.,.fe. a" s /-;,s,yll,- n,o/f f u~ -{ceMe11l-/;;.,,e J ;.-,~ /q./,/ons/11,i?.s

3Z
t
• ~8)-a---
--------A-~~------
)1-{fo)------,c
/,IDO .___ ________ -L-------------'----' (!)-(?
Fj. 7
.s-Z Ceme11/--Liwe.(pq c.tY1I)
•-+
C om_po-c. le c/ r I-1-e,~f J. - ,,?'JO/S' lff 1-~ -{t.t!A1611l-hm ~) Alps

Figu.res 8-11 show strength cunes tor cured specimens which were
tailed atter a tour-day euring period in a 100 per cent humi.dit7 curing
room. In F.1.gure s, lime was used as the additive, while in Figure 91
cement was used. In Figures' 10 and ll~ strengths were plotted against.
cem.ent-llme combinations~ 'lb• procedure used tor determining water con-
tents and corresponding etrengtha to plot Figures 4-7 was also used for,
plotting Piguree 8-ll. Numbers in parentheses refer to water contents.
c. Statiftical Analzaia
A three-way- statistical analysis ot variance was performed on
Tarious aspects ot the unconfined compressive strength data. The three
variables upon which the analJ,sis is based included moisture condition
(A), test condition (B), and additive percentage (C). Moisture condition
refers to molded water content with relation to moisture-density curves
plotted for each additive percentage. Since specimens were compacted
at OMC, as well as on the "dry'" and "wet" aidea of the optimum moisture
content, three moisture condition• were used. Test conditions were tw
1n number-cured and uncured. Details ot the method ot a.nalyais used
and the proc.dures followed are outlined 1n Duncan ,is). In Tables 2 and 4, S1lDIU..riee ot strengths for specimens containing
lime and cenent only are presented. '!he s1gn11'1cance 0£ the three n.ria-
bles was detendned by va.l"iance ratios or "F" tests at 0.01 and o.00.l levels, and the results of the "f" tests for Tables 2 and 4 appear in
Tables 3 ands. SUl21!1B.ries ot strengths for specimens containing addi-
tives at the 5 and 10 per cent level.a, both separatelY' and in combination,
appear in Tables 6 and 8, while corresponding variance an~a are

34
described in Tables 7 and 9. The last swran.ary o.f strengths presented
in Table 10 is or.e of two additive combinations at the 10 per cent
level. The ma.in purpose of this study was to determine the ettect ot
varying the ce..-uent-lime :percentage ratio from 4-6 to 6-4. The var.lance
analysis for this phase of the study may be found in Table ll.

6606----------------------, I
/(:MJO,__ __ ---''---------'-------------~ 0 .5 /d
L,.,1",,,,,e (pa;,, c.-.,,r)
C u1-e.. al s l-1-e.~./l. - ,n,,o/s .Jw,-.e. - bme-re.lQ hon .:Ji /ps

36
+
~#DO,___ ________ _,_ _________ -'--~
0
Fij. 9
.:r C11mu f (pfrl' cc,, f.)
Cu;-e.d_ :J" f;--e.":J/l.-n-,o/.fJ~;-e... -c:e..me.nf-/-"t!-/4/-/on :5 ii,r;s

/'fl~---------------------;
tN>~·.__ ________ ...a_ ________ ...L-___,I
0-0 ~-B c....,_,,/-,t.,-;,,, .. {per- CIJ'II)
Fj. /t7 C ~,-e. ~. s l-1-~IA -/ho/:S-./-'-'1--.e.. -{~en1e~f-b me-j ;.,e, /4 I-/ on s A, j:,.:f

38
J,.OODr------,
Fj,. II
3-,2, Ca/1"/1V1/--L1;,,c. ~" c.a;,f)
C"!1-e..t/ :5/-1-e~IA -~01.:rlwJ,e--{c.e.;ne.nl-~n,e) 1-elof /on.:J'/,117s

TABLE 2
SUMMARY OF SPECIMEN S'fflENGfflS (O, 5• AND 10 PER CENT LIME ADDITIVE)
Une Une Cured Tota. s
0-0 3.255 1.150 2.480 1.045 1.415 1.200 3.345 1.815 2.480 2.910 1.760 l.,380 37.065 3.145 1.345 2.330 2.590 2.010 1.330
Lime-Cement 5-0 2.925 le'845 2.890 3.720 2.108 1.445 Percentages 2.430 1.345 3.205 3.010 2.045 1.745 42.928
2.92; 1.030 3.290 3.525 1.880 l.565
10-0 2.580 2.910 1.775 5.36; 1.960 4.020 2.870 2.360 1.940 5.560 1.880 3.870 56.780 2.990 2.460 2.10; 4.880 2.17; ;.oao
Totals 26.465 16.260 22.495 .32.605 17.233 21.715 136.773 42.725 55.100 38.948

40
TABLE 3
'l'HRE.E-WAY ANALYSIS OF VARIANCE RESULTS FOR S'lRENaffl DATA (O, 5, AHD 10 FER CENT LIME ADDITIVE)
Source of Variance F F .Ol F .OOl 51.gniricance
Moisture Condition., A 30.46 5.39 8.77 .001 leftl.
OUring, B 2.77 7.56 13.29 NS
Lime Percentage, C 43.s; 5 • .39 s.77 .001 l.evel
Interactions: AxB 47.00 5.39 8.77 .001 level
AxC s.54 4.02 6.12 .001 level
BxO 70.77 5.39 s.77 .001 level
Ax'BXC 4.15 4.02 6.12 .Ol level
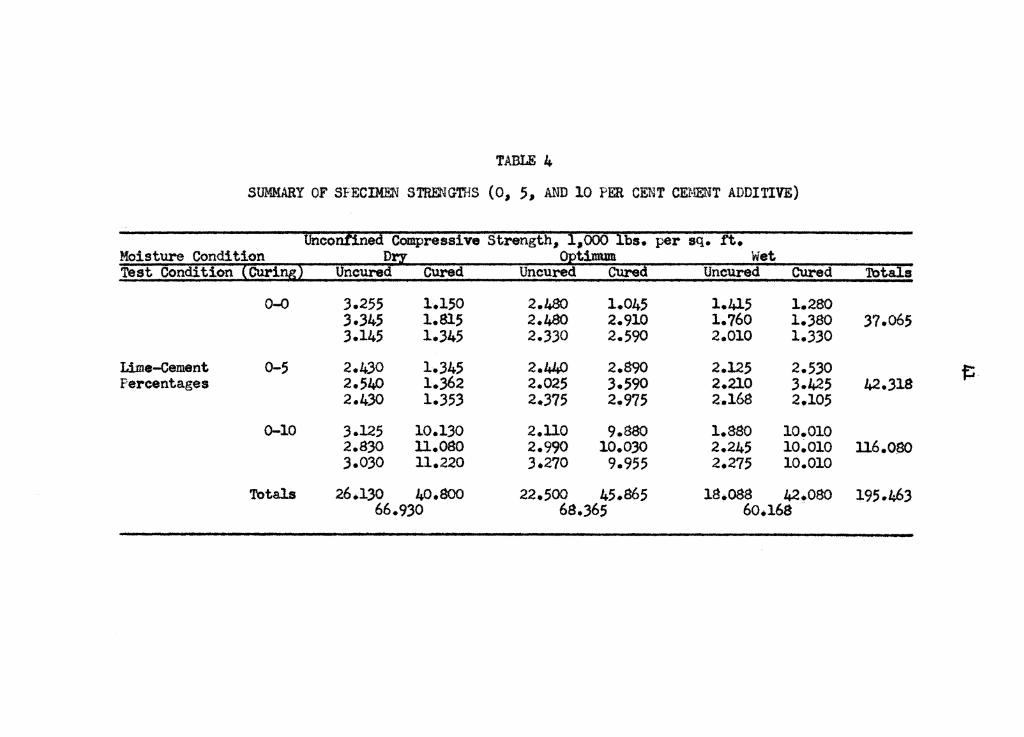
TABLE 4
SUMMARY OF SFECD@l" STREl'WTHS (O, 511 AND 10 PER CENT CEMENT ADDITIVE)
Unconfined Compressive Strength, 111000 lbs. per sq. tt. ti.mum Wet
Uncured C Uncured Cured 'lbtals
0-0 3.255 1.150 2.480 1.045 1.415 1.280 3.345 1.815 2.480 2.910 1.760 1.)80 :37.065 3.145 1.345 2.330 2.590 2.010 1.330
Li.me-Cement 0-5 2.430 1.345 2.J+J..0 2.s90 2.12; 2.530 Percentages 2.540 1 • .362 2.025 3.590 2.210 3.425 42.318
2.430 1.353 2.375 2.975 2.168 2.105
0-10 3.125 10.130 2.uo 9.880 1.sso 10.010 2.83() ll.080 2.990 10.0.30 2.245 10.010 ll6.0SO .3.030 11.220 3.270 9.955 2.275 10.010
Tota.ls 26.1,30 40.800 22.;oo 45.865 18.088 42.oso 195.l;63 66.9,30 68.365 6o.l68

42
TABLE 5
THREE-WAY ANALYSIS OF VARIANCE RESULTS FOR STRENGTH DATA (O, 5, AND 10 PER CENT CEMENT ADDITIVE)
Source of Variance F F .Ol F .ool Significance
Moisture Condition., A 7.19 5.39 8.77 .ol level
Curing, B 48.20 7.56 13.29 .001 level
Cement Percentage, C 73.25 5/39 s.77 .001 level
Interactions: AxB 1.02 5.39 8.77 NS
AxC 0.77 4.02 6.12 NS
:axe 65.25 5/}9 s.77 .001 level
AxBxC o.;1 4.02 6.12 NS

TABLE 6
SUMMARY OF SPECIMEN STRENGTHS (5-0., 0-5., 3-2., AND 2-3 PER Cl!.1-IT LIME-CE."UT ADDITIVE)
Unconfinm.Compressive Strength, 1.,000 lbs._ per sq._ ft •. Moisture Condition thmm Wet Test Con · tion Curi Uncured Cured Uncured Cured Uncured Cure s
5-0 2.925 1.845 2.890 3.720 2.108 1.445 2.430 1 • .345 .3.205 3.010 2.045 1.745 42.928 2.925 1.030 3.290 .3.525 1.880 1.565
0-5 2.430 1.345 2.440 2.890 2.125 2.5.30 2.540 1.362 2.025 3,.590 2 .. 210 3.425 42.317 2.430 1.353 2.375 2.975 2.167 2.105 e;
Lime-Cement 3-2 3.090 1.645 1.695 2.090 1.960 5.070 Percentages .'.3.105 1.890 l.890 2.560 1.695 4.470 45.907
2.510 2.090 1.990 1.514 l.82J 4.820
2-3 2.810 2.840 2.225 2.520 1.462 2.060 2.960 2.645 1.975 2.450 1.595 2.160 41.955 2.845 2.743 2.uo 2 • .3.30 1.500 2.345
Totals 33.000 22.133 28.410 33.174 22.650 33.740 173.107 55.1.33 61.584 56.390

TABLE 7
'IHREE-\'IAY Ai'l'ALYSIS OF VARIANCE RESULTS FOR S'lRENGTH DATA (5-0., 0-5., 3-2, and 2-3 PER CENT LIME-CulENT ADDITIVE)
Source of Variance F F .01 F .001 Significance
Moisture Condition, A 6.53 4.9s 7.76 .Ol level
Curing, B 4.61 7.08 ll.97 NS
Lime-Ceaent Percentage, C 2.40 4.13 6.17 NS
Interactions: AxB 71.00 4.98 7.76 .001 level
AxC 37.30 3.12 4.37 .001 level
BxC 14.87 4.13 6.17 .001 level
AxBxC 17.15 :3.12 .001 level

TABLE 8
SUMMARY OF SPECIMEN STRENGTHS (10-0• 0-10• 6-4• AND 4-6 PER CEHT LIME-CEtmlT ADDITIVE)
Unconfined Compressive Strength, 1,ooo lbe. per sq • .rt. Y.10isture Condition D timum Test Con tion Cur ncured Unc
10-0 2.500 2.910 1.775 5 • .365 1~960 4.020 2.870 2.360 1.940 5.;6o 1~880 3.870 56.780 2.990 2.460 2.105 4.880 2.175 ,.oso
0-lO .3.125 10.130 2.llO 9.880 1.880 lOtPlO 2.830 ll.080 2.990 10.030 2.24; 10 .. 010 JJ.6.080 3.030 u.220 J.270 9.955 2.27; 10.010 t;
Lime-Cement 6-4 3.070 5.140 1.74; 8.8.30 1.565 7.570 Percentages 3.250 4.710 2.10; 9.210 l.815 10.uo 89.805
3.160 4.470 2.310 9.980 1.925 8.840
4-6 2.740 5.570 2.020 8.080 l.763 7.225 .3.040 6.970 1.680 9.J.1:,0 1.776 9.570 91.949 3.270 6.270 2.020 s.730 1.665 10.100
Totals 35.955 73.290 26.C170 99.96o 22.924 96.415 354.614 109.245 l26.030 ll9.J39

TABLE 9
'lHRD-WAY ANALYSIS OF VARIANCE RESULTS FOR S'l'.RENG'!H DATA (10-0, 0-10 1 6-4, AND 4-6 PER CENT LIME-CEJIENT ADDITIVE)
Source of Variance F F .Ol F .001 Sigrd.ticance
Moisture Condition, A 9.98 4.9s 7.76 .001 level
curing, B 1590.00 7.08 u.97 .001 leftl
Lime-Cement Percentage, C U0.60 4.13 6.17 .001 leftl.
Interactions: AxB 61.60 4.9s 7.76 .001 level
AxC .5.S6 3.12 4.37 .001 level
BxC 89.10 4.13 6.17 .001 level
AxBxC 10.82 3.12 4.,1 .001 level

TABLE 10
SUMMARY OF Sl'.ECIMEN S'l''RENGTHS (6-4 A.I\JD 4-6 PER CENT LIME-CEMENT ADDITIVE)
Unconfined Compressive Strength, 1,000 lbs. per sq. tt. Moisture Condition timwn Wet Test Co tion CUri Uncure Cured Uncured CUred To 8
6-4 .3.070 5.140 1.745 8.$30 1.565 · 7.570 .3.250 4.710 2.105 9.210 1.815 10.llO 89.805 !i 3.160 4.470 2.310 9.980 1.925 8.84()
Lime-cement 4-6 2.740 5.570 2.020 8.080 1.763 7.225 Percentages 3.040 6.970 l.680 9.460 1.776 9.570 91.949
3.270 6.270 2.020 s.730 l.66; 10.100
Totals 18.530 3.3.130 ll.880 54.290 10.509 53.415 181.754 51.660 66.170 63.924

48
TABLE ll
'IF.REE-WAY ANALYSIS OF VARIANCE RESULTS FOR STRENGTH DATA (6-4 AND 4-6 PER CI!:NT I.DIE-CEMENT ADDITIVE)
Source of Variance F F .Ol F .OOl Significance
Moisture Condition, A 10.S6 5.61 9.34 .001 level
Curing, B ;91.-00 7.82 14.00 .001 level
Lime-Cement Fercentage, C 0.27 7.82 ll+.00 t.!S
Interactions: AxB 46.70 5.61 9.34 .001 level
AxC 1.76 5.61 9.34 NS
BxC 0.99 7.s2 14.00 NS
AxBxC 1.s., 5.61 9.34 NS

49
VI. DISCUSSION AND CONCLUSIONS
1be results presented in the previous section will be reviewed and
discussed in the order in which they appeared. All results will be
enlarged upon through discussion, and, when possible, conclusions con-
cerning the significance of results will be presented. 'lhe statistical
analysis emphasized the more important points; hence, the majority of
the discussion will be concentrated on the £actors brought out in Tables
2-ll.
A. Atterberg Limits (Figures 2-3) All Atterberg limit specimens were cured for two days in a 100 per
cent humidity curing room prior to testing. Since previous research by
Filt and Davidson (10) subst;:ntiated the practicability of this procedure
in running limits on lime-soil mixtures, 1 t was followed by the author
after difficulty was encountered in running liquid limit tests on lime-
soil mixtures. The difficulty can be attributed to the ability ot lime
to dry out a soil immediately efter it has been added.
In order to use similar test procedures for all specimens, cement-
soil and cement-lime-soil mixtures were also cured in the same manner.
For all conditions, the plastic limit increased with increasing
additiTe percentages. '.l'tlis result is in agreement with the literature
for both lime (19) and cement (20) stabilization. However, for soils
with plasticity indexes greatet' than 15, lime and cement both will nor-
mall.y reduce the liquid limit (1)(20). This result was not achieved in
any of the tests, including those in which only lime was used. In the
;o
case ot lime however, the liquid limit only increased from 64 at 5 per
cent additive to 68 at 10 per cent additive. In all other studies the
increase in liquid limit wns more pronounced between the 5 and 10 per
cent levels, with the greatest increases occurring in the 10 per cent
cement specimen and the one containing the 6 per cent cement-4 per cent
lime combination. Since the greatest liquid limit increases at the 10
per cent additive level occurred in the samples containing the greater
percentages of cement, it may be concluded that the two-day curing period
which all specimens containing cement received was a major factor in the
erratic results obtained. A further error Fossibility is th~it hardening
had set up in these two mixtures after one day of curing; each had to be
re-worked with a spatula and the moisture content increased.
One interesting point was noticed concerning the relationship o! the
optimum moisture content to the plastic limit tor ea.ch mix. In the case
of the raw soil, its OMC exceeded the plastic limit. For additive-soil
mixtures, however, plastic limits either equalled or exc!,3eded all opti-
mum moisture contents.
B. Uncured Compressive Stre9B1hs ( F'ieu:res 4-7) Both the tr~ and amount of chemical additive in a specimen have an
immediate effect on compacted strength. This is evident in Figures 4-7.
In all cases except one, the greatest uncured strengths were obtained at
the lower water contents below OMC. The one exception was in the group
of samples containing 5 per cent lime, where the maximum strength was
achieved at OMC. This is brought out in Figure 4. In Figures 5-7, the
curves show similar trends. The lower moisture contents produced the
51
highest strengths, which decreased progressively with each moisture
increase. With regard to the four additive percentage studies (lime,
cement, and two lime-cement combinations), no definite trend was estab-
lished as to the additive percentage at which the greatest strengths
were obtained. When no curing is involved, it appears that moisture
content is extremely significant in determining the additive percent-
age at which the greatest strengths will occur.
c. Four-Day Cured Compressive ~>trengths (Figures 8-11)
Fieu.res 8-11 point out a number of interesting factors. For the
cured specimens containing nc stabilizing agent, the greatest strengths
corres;ponded to molded water contents below OMC. In those instances
where additives were used, however, highest strengths were obt,ained at
and al:.."Ove 0..'4C., with two exceptions. One exception occurred at the (3-2)
cement-lime percentage in Figure ll. At this percentage, only a small
variance in strengths exists though, and the difference in the trend may
be ignored. The other exception was at the 10 per cent cement level in
Figure 9. The reason for this will be explained later in the discussion
of the statistical. analysis presented in Tables 4 and 5.
The effects of curing and additive percentage on strengthe ma;r also
be seen in Fii'1lres S-ll. Little or no strength increases were noted at
any of the 5 per cent additive levels. The 10 per cent levels did pro-
duce notable gains however. 'lhe largest increases occurred in the
cement-stabilized samples; the smallest in those samples containing lime.
The combination-additive strength increases were inteimediate between
these two.

S2
D. Statistical An!ll:ae• (Tables 2-112
Fift indi'Vidual statistical analysea were run on the strength data
obtained in the laboratory. Two of the studies were concerned with
strengths when cement and lime were used individuall.y' as additives; two
others dealt with lime. cement, and lime-cement additives at the 5 and
10 per cent levels. 'lbe fifth study was of the tw lime-cement combi-
nations at the 10 per cent level of stabilization.
1, Lime percentages ot o, 5, and 10 (Tables 2 and .3), '!bis analy-
sis showed that the test condition (curing) of specimens, when
considered separatel7, was not significant (NS), 1,e., was not
attecting the strength data, However, judgement tells ua to
consider curing as significant when we note that there was a
very signiticant interaction between moisture and curing, Obser-
vation of the data shows that curing had no ettect at the lower
moisture contents only, Furt.her analysis shows moisture condition
and lime percentage both to be significant to the 0,001 level.
With 0.001 levels ot significance, it may be stated, with only
one chance in a thousand of being wrong, that both moisture
condition and lime percentage attected the strength data.
'lb• interaction ot AxC (moisture and per cent lime) was
also significant at the 0.001 level. The significance ot this
interaction supports the data which show that higher moiature
contents produce higher strengths only with larger amounts of
lime. The BxC interaction ( curing and per cent liae) yielded
a 0.001 level ot significance because of the tact that curing

53
was effective only after lime had been added to the samples.
Curing did nothing for samples containing O per cent lime.
2. Cement percentages of o, 5, and 10 (Tables 4 and 5). Of the
three variables, cement percentage (C) and curing (D) were the
most significant, each to the 0.001 level. The interaction of
these two, BxC, was likewise significant to the 0.001 level,
since curing made no difference at O per cent, but ma.de a great
deal of difference at 10 per cent cement. Moisture condition
(A) did not exert as much influence on the strength data as did
Band c, since it only had a 0.01 level of significance. This
is in direct contrast to the 0.001 level of aignitieance that
moisture condition had in the lime-soil analysis. It should
be pointed out here that curing was very significant when used
with cement-soil specimens, even at the lower moisture contents.
Curing was not nearly as important at the lower moisture con-
tents in the lime-soil specimens.
3. Lime-cement percentages of 5-0, 0-5, 3-2, and 2-.3 (Tables 6 and 7). Only one individual variable, moisture, had any sig-
nificance (O.Ol level). Again, as was the case in the lime-soil
study, test condition (curing) was not significant. A glance
at the data indicates that this might be because of lower cured
strengths than uncured strengths on the dry side tor each addi-
tive percentage. The interaction AxB (moisture and curing) thus
is found to be significant. Most important, the analysis shows
no significant differences in strength at the different lime-cement

;4
eom.binations. There.fore, at the 5 pe:r cent additive level, it
can be said that these tests indicate that similar results will
be obtained whether 5 per cent lime, 5 per cent cement, or a
combination of the two is used. That no great strength increases
were obtained at any of the 5 per cent levels is the probable
reason that no individual variable had outstanding significance.
4. Lime-cement percentages of 10-0, 0-10, 6-4, and 4-6 (Tables 8
and 9). The most important result of this study is that the
analysis showed ea.ch of the three variables to be significant
at least to the 0.001 level. i~1ile all three were significant,
it should be emphasized that curing was especially significant
because of its high ttF11 value. It can therefore be concluded
that moisture, curing, and lime-cement percentage all have a
pronounced effect on sample strengths. Observation of the data
would lead one to believe that cement was more effective in
raising strengths than lime. This difference was not apparent
at the 5 per cent additive percentage study.
5. Lime-cement percentages of 6-4 and 4-6 ( Tables 10 and ll) • 'Ihl.s
analysis was made primarily to determine if a variation of the
lime-cement percentage from 6-4 to 4-6 made any difference in
strengths of cured specimens. Table 11 supports the statement
that only moisture condition, test condition, and the interac-
tion between these two were significant. All other factors were
NS. 'Ihus tbe question of strength differences with the percent-
age variation of the addi.ti ves is answered. The lime-cement

;;
percentage change from 6-4 to 4-6 had no significant effect on
strengths after a four-da.y curing period.
E. Conclusions
'lhrou.ghout the discussion just presented, a number of conclusions
were either stated or implied. At this point, all conclusions which can
be made from. this laboratory study will be summarized.
1. The plastic limit of a soil can be increased with either a
cement, li..'1le, or cement-lime additive. 'l'his increase will con-
tinue with t.he a.ddi tion of more additive, at least within the
additive percentage range used.
2. Curing of lime-soil mixtures for a two-day period prior to
Atterberg li:nit testing is a satisfactory method of prepara.-
ti.on. This curing period is needed in order to _permit the
water to infiltrate the clay particles thoroughly and produce
uniform wettinG of the sample.
3. Curing .for two days as was done for the lime-soil mixes is an
unsatisfactory r.,ethod of preparation of samples containing
cement when Atterberg limit testing is to be done.
4. Standard AASHO maximum dry density and optimum moisture content
c1c.n be obt;:;.i.ned with the Harvard Miniature Compaction equipment..
Twenty-five blows of the 40-i:,ound. S}'.Jring-plun,ger asse111bly applied
to three equal soil layers in the Harvard Miniature Compaction
mold will yield an eq_uivalant maximum dry density and OMC.
5. Modified AASHO maximum dry density and OMC cannot be obtained
wlth the Harvard ¥J.niature Compaction apparatus.
S6
6. '!he type and amount or additive used will have some effect on
strength even if samples are failed immediately after compaction.
7. For cured specin1ens containing a stabilizing agent, the greatest
tour-day strengths will occur at or above OMC, in most eases.
'Ihis may not always be true in the case or cement, since moisture
condition is not as si,snificant in c~~ent stabilization as it
is in other types.
8. Control of moisture at or near OMC during field compaction
appears to be much more important in lime stabilization than
in cement stabilization if maximum strengths are to deYelop.
9. '!he variation of tbe lime-cement percenta2,--e from 6-4 to 4-6 has
no effect on tour-day cured strengths.
10. Curing had the greatest effect at the highest additive percent-
ages., since greater strengths were obtained at the higher additiw
percentages.

57
VII. RECOMMENDATIONS
Further research with lime-cement combinations as additives to
highly plastic clays is warranted, since lime will greatly improve worka-
bility and the two together will yield significant strength gains. This
type of stabilization may be particularly adaptable in northern climates
where lime stabilization has to be used with caution. This caution has
to be exercised since lime sets much more slowly than cement over a much
longer period of time. If a "hard" frost should occur only two or three
weeks after a job is completed, se1·ious damage of a perm.anent nature
could be inflicted to a lime-stabilized soil.
One last recommendation is for further study of the molded water
content-greatest cured strength relationship for all three types of
stabilization-lime, cement, and lime-cement.

58
VIII. ACKNOWLEDGEMENTS
'!he author would like to express his appreciation to Dr. Richard D.
Walker, his advisor in the Civil Engineering Department., for the guidance
he gave during the laboratory testing and the preJ,oaration of this thesis.
Without his help and valuable comments, the statistical analysis pre-
sented in Section V and discussed in Section VI would not have been
possible.
A special note of thanks is also due Dr, Robert D. Krebs, who,
tr-irough his class lectures, presented a major portion of the materiaJ.
which gave the author a minor in soil meahQ,nics.

59
IX. BIBLIOGRAPHY
. l. Yoder, E. J., Principles £! Pe.:vement Desiff Chapter 10,, nsoil Stabilization." 255-268, Wiley and Sons 959).
2. Catton, M. n., "Early Soil-Ce,nent Research and P,evolopment. 11 re A. Bulletin D42:3-18 {January 195.9).
3. Catton, M. D., "Soil-Cement Mixtures for Roads.11 HRB Proc., 18:Part II, 314-21 {1938).
4. Davidson, D. T., Ooil Stabilization with Portland Cement, "Forwa.rcl.11
HRB Bulletin 292 ~,. -
5. Highway Research Board, Soil Stabilization with Portland Cement, "lntroduction.tt HRB Bulrnn 292 (f96t~. -
. 6. American Road Builders Association, "Soil-Cement Stabilization Com-mittee Report." ARBA Technical Bulletin No. 191:7-10 (1953).
7. National Lime Association, Lime Stabilization of Roads, Chapter l, "Background of Lime Stabilization." National iline Association Bulle-tin 323:7-ll (1954).
8. National Lime Association, Lime Stabilization Pamphlet, 925 Fitteenth Street, N.W., Washington 5, D. c.
9. Davidson, D. T., and Handy, R. L., Highway ftf1neeri1': Handbook, Chapter 21, "Soil Stabilization." McGraw-Hi! {19~.
10. Hilt, G. H., and Davidson, D. T., "Linle Fixation in Clayey Soils." HRB Bulletin 262:20-24 {January, 1960).
ll.
12.
Grimm, R. E., Clay Mineralogy. McGraw-Hill {195.'.3).
National Lime Asaoeiation, Lime Stabilization of Roads, Chapter;, "Evaluation of Lime-Soil Mixes." National flm.eAssoclation Bulletin 323:21-30 {1954).
Puller, M. G., and Dabney,, G. w., 11Stabilizing Weak and Defective Bases with Hydrated Lime." Roads and Streets, 95:64-69 (March, 1952).
14. Jan, M.A., "Lime Stabilization ot a Virginia Clay Soil," Master of Science Thesis, Virginia Polytechnic Institute, Department or Cinl Engineering (1962).
15. Hennes, R. G., and Ekse, M. I., Fundamentals or Transportation Jm&!-neering, Chapter 21 "Grading the Roadbed." 2-:C.27, McGraw-Hill {IB5).

60
16. Clare, K. E., and Pollard, A. E., 11'1he Relationship Between Com-pressive Strength and Age for Soils Stabilized with Four Types of Cement.11 Magazine of Concrete Research {London), .3:8, 57-64 (December, 1951).
17. Wilson, Stanley D., "Comparative Investigation of a Miniature Com-paction Test with Field Compaction," presented before the Annual Meeting, American Society of Civil F,ngineers (January, 1950).
18. Duncan, A. J., ~tr Control and Industrial Statistics, Richard D. Irwin, Inc., omewood, Iffino1s(i9;9).
19. American Road Builders Association, Lime Stabilization Construction Manual, ''Introduction." ARBA Technical :Biiftetin 243:5-b (197,!i}.
20. Highway Research Board, Soil Stabilizat,ion with Portland Cement, Properties of Cement-Treated Soif. 11 HRB Bu!ietin 292:i2-1J (!961).
ADDITIONAL REFERENCE
l. ttAS'.IM Standards-1958, 0 American Society for Testing Materials.

The vita has been removed from the scanned document
ABSTRACT
LIME, CEMEtIT, AND LIME-CEMENT STABILIZATION OF A CLAY SOIL
The main purpose behind this thesis was to study the variations of
strength in a soil after it had been stabilized with various percentages
of lime, cement, and combinations of the two. In both cases where the
additives were added separately to the soil, the percentages used were
5 and 10 per cent by dry weight of soil. In the additive combination
study, lime-cement percentage additions were 2-3, 3-2, 4-6, and 6-4 by
dry weight of soil. The first two percentages, when added together,
amount to 5 per cent stabilizing agent, while the latter two total 10
per cent. Since these two totals were the sa.T.e a.s those used in the
separate lime and cement studies, an analysis ot strength changes when
lime, cement, and lime-cement combinations were added to the soil could
be made. Strength studies which were 1:1ade consisted of unconfined com-
pression immediately a!ter compaction and after a four-day curing period
in a 100 per cent humidity curing room. Atterberg limit tests were also
run at the various percentages of additive.
'lbe laboratory test results indicate:
1. For cured specimens containing a stabilizing agent, the greatest
four-day strengths will occur at or above OMC., in most cases. This may
not always be true in the case of cement, since moisture condition is
not as significant in caent stabilization as it is in other types.
2. Control of moisture at or near OMC during field compaction
appears to be much more important in lime stabilization than in cement

stabilization if maximum strengths are to develop. '!hie statement is
supported by a. statistical analysis which was performed on the strength
data.
3. The variation of' the lime-cement percentage trom 6-4 to 4....6 has
no effect on four-day cured strengths.