light-emitting tag testing in conjunction with testing of ... · light-emitting tag testing in...
TRANSCRIPT

PNNL-13415
Light-Emitting Tag Testing in Conjunction with Testing of the Minimum Gap Runner Turbine Design at Bonneville Dam Powerhouse 1 T. J. Carlson M. A. Weiland January 2001 Prepared for the U.S. Army Corps of Engineers under a Related Services Agreement with the U.S. Department of Energy under Contract DE-AC06-76RL01830

DISCLAIMER This report was prepared as an account of work sponsored by an agency of the United States Government. Neither the United States Government nor any agency thereof, nor Battelle Memorial Institute, nor any of their employees, makes any warranty, express or implied, or assumes any legal liability or responsibility for the accuracy, completeness, or usefulness of any infor-mation, apparatus, product, or process disclosed, or represents that its use would not infringe privately owned rights. Reference herein to any specific commercial product, process, or service by trade name, trademark, manufac-turer, or otherwise does not necessarily constitute or imply its endorsement, recommendation, or favoring by the United States Government or any agency thereof, or Battelle Memorial Institute. The views and opinions of authors ex-pressed herein do not necessarily state or reflect those of the United States Government or any agency thereof.
PACIFIC NORTHWEST NATIONAL LABORATORY
operated by BATTELLE
for the UNITED STATES DEPARTMENT OF ENERGY
under Contract DE-AC06-76RLO 1830
Printed in the United States of America
Available to DOE and DOE contractors from the
Office of Scientific and Technical Information, P.O. Box 62, Oak Ridge, TN 37831-0062
ph: (865) 576-8401 fax: (865) 576-5728
email: [email protected]
Available to the public from the National Technical Information Service. U.S. Department of Commerce, 5285 Port Royal, Rd., Springfield, VA 22161
ph: 9800) 553-6847 fax: (703) 605-6900
email: [email protected] Online ordering: http://www.ntis.gov/ordering.htm
This document was printed on recycled paper.

PNNL-13415
Light-Emitting Tag Testing in Conjunction with Testing of the Minimum Gap Runner Turbine Design at Bonneville Dam Powerhouse 1 T.J. Carlson M.A. Weiland January 2001 Prepared for the U.S. Army Corps of Engineers under a Related Services Agreement with the U.S. Department of Energy under Contract DE-AC06-76RLO 1830 Pacific Northwest National Laboratory Richland, Washington 99352
Summary This report describes a pilot study conducted to test the feasibility of using light-emitting tags (LETs) to visually track objects within the turbine environment of a hydroelectric dam. The project is part of an investigation of fish survival through a minimum gap runner (MGR) turbine installed at Bonneville Dam Powerhouse 1. The study was conducted from December 11, 1999, to January 29, 2000, by Pacific Northwest National Laboratory (PNNL) and AScI Corporation for the U.S. Army Corps of Engineers under the Turbine Passage Survival Program (TSP). (Note: After this study was completed the Corps transferred the contract for this work from AscI Corporation to MEVATEC Corporation.) We released fish with light emitting tags and light sticks at blade tip, mid-blade and hub loca-tions in Unit 6 (the MGR turbine) and in Unit 5 (a standard Kaplan turbine) of Bonneville Pow-erhouse 1. We installed two underwater video cameras on the scroll case of each unit to ob-serve LET trajectories out of the release pipes and tracked the released LETs at four turbine op-erating levels. Based on this pilot study we conclude that it is possible to detect light-emitting tags within the turbine environment. It may be possible to collect three-dimensional data for objects released into a turbine environment using video cameras and LETs, provided the location of interest is determined in advance and cameras are positioned properly. We have the following recommen-dations: A larger sample size than the one used in the study reported here is needed to deter-mine differences in LET trajectory. The accuracy of the trajectory measurements would be im-proved by the use of three or more cameras, positioning light-emitting beacons in the turbine for reference points, and better mapping of the turbine area. Resolution could also be improved by the use of three-dimensional (3-D) software and video systems now commercially available.
iii

Acknowledgments Acknowledged for their valuable assistance on this project are Craig Smith for many hours spent collecting the data and Charlie Escher, Erin Wright, and Nathan Barrett for analyzing video tapes.
iv

Contents Summary ………………………………………………………………………………….. 2 Acknowledgments ………………………………………………………………………... 3 1.0 Introduction ………………………………………………………………………... 1 2.0 Methods ……………………………………………………………………………. 2 3.0 Results and Discussion …………………………………………………………….. 4
3.1 Visual Tracking of LETs ………………………………………………………… 4 3.2 X and Y Trajectories …………………………………………………………….. 4 3.3 Z Trajectory ……………………………………………………………………... 5 3.4 Three-Dimensional Trajectory ………………………………………………….. 6
4.0 Conclusions and Recommendations for Future In-Turbine Monitoring ………….. 8
v

Figures
1 Cross-Sectional View of Turbine Unit 5 or 6 at Bonneville Dam Showing the
Three Release Pipes from Bottom to Top: Blade Tip, Mid-Blade, and Hub …………. 8
2 View of the Induction System in the B-Slot of Unit 6, Facing Downstream toward the Scroll Case ………………………………………………………………… 9
3 View of the Induction System in the B-Slot from Near the Scroll Case, Facing
Upstream toward the Head Gate ……………………………………………………… 9
4 Blade Tip, Mid-Blade, and Hub Release Pipes at the Scroll Case from Bottom to Top, Respectively …………………………………………………………………….. 9
5 Top and Side Viewing Cameras at Unit 6 and their Orientation Relative to the Release Pipes …………………………………………………………………………. 9
6 Plan and Cross-Sectional Views of the Turbine Environment and the Estimated Sampling Volume Covered by both the Side and Top-Mounted Cameras at Unit 6 …. 10
7 Grid System used on Video Monitor to Assign X and Y Position Coordinates to Individual LET Observations …………………………………………………………. 11
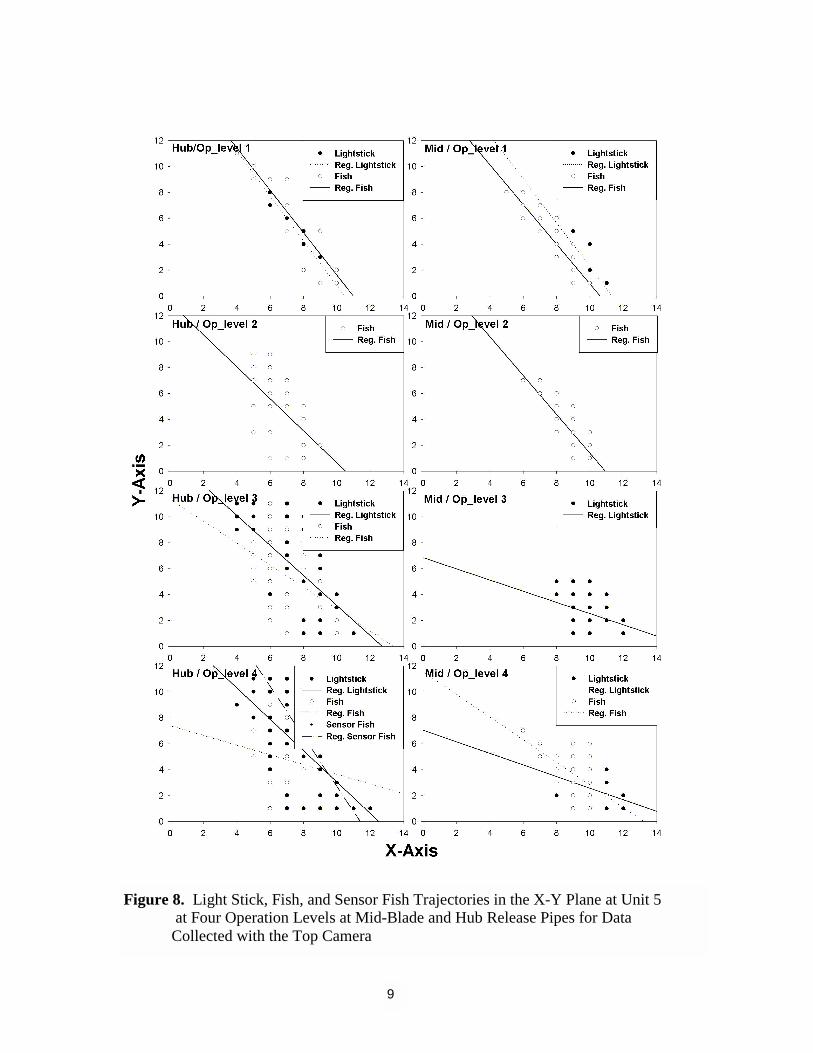
8 Light Stick, Fish, and Sensor Fish Trajectories in the X-Y Plane at Unit 5 at Four Operation Levels at Mid-Blade and Hub Release Pipes for Data Collected with the Top Camera …………………………………………………………………………… 14
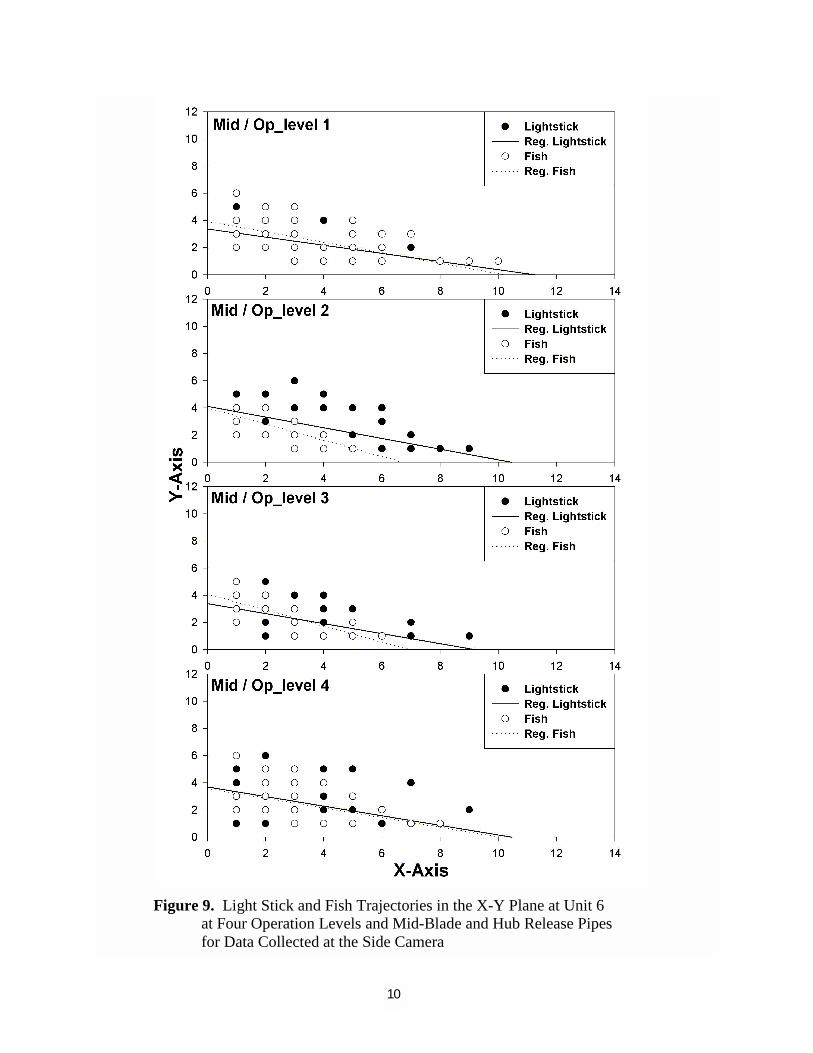
9 Light Stick and Fish Trajectories in the X-Y Plane at Unit 6 at Four Operation
Levels and Mid-Bade and Hub Release Pipes for Data Collected at the Side Camera .. 15
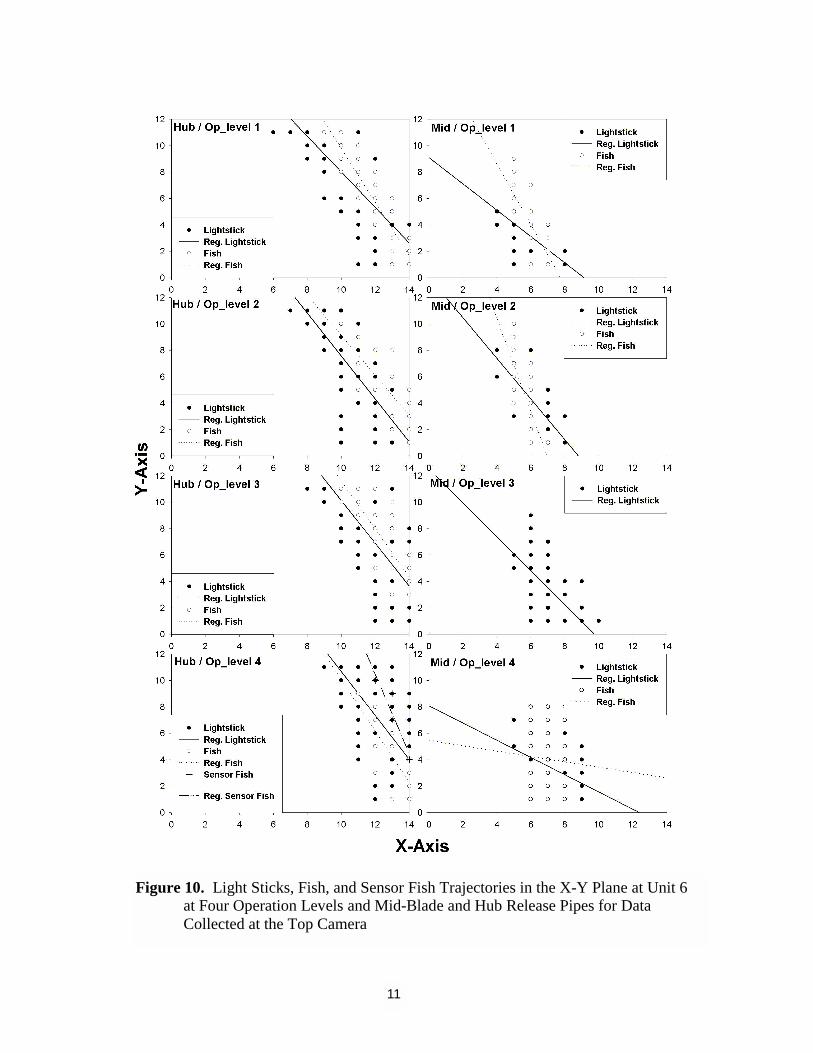
10 Light Sticks, Fish, and Sensor Fish Trajectories in the X-Y Plane at Unit 6 at Four Operation Levels and Mid-Blade and Hub Release Pipes for Data Collected at the Top Camera ………………………………………………………………………. 16
Tables 1 Number of Light Sticks, Light-Tagged Fish, and Light-Tagged Sensor Fish
Released at Each Release Site and Operation Level …………………………………. 11
vi

1
1.0 Introduction This report describes a pilot study conducted at Bonneville Dam between December 11, 1999, and January 29, 2000, to test the feasibility of using light-emitting tags to visually track objects within the turbine environment of a hydroelectric dam. The study was conducted by Pacific Northwest National Laboratory (PNNL) and AScI Corporation for the U.S. Army Corps of En-gineers under the Turbine Passage Survival Program (TSP). (Note: After this study was com-pleted, the Corps transferred the contract for this work from AscI Corporation to MEVATEC Corporation.) The purpose of the TSP is to investigate potential modifications to the structure and operation of turbines within the federal hydropower system that might improve fish survival. One project of the TSP has been the installation and testing of a minimum gap runner turbine (MGR) to in-vestigate its potential advantages for improving the survival of salmon smolts. A MGR was in-stalled in Unit 6 at Bonneville Dam Powerhouse 1 in the fall of 1999. Comprehensive testing is being conducted on the MGR turbine to evaluate the effects of the tur-bine environment on fish survival. Biological testing of the MGR was conducted by Norman-deau Associates from November 1999 to February 2000. This testing included the release of balloon-tagged fish through a flow-compensating induction system at precise locations at the wicket gates of the MGR. For comparison, fish were released into an identical induction sys-tem installed at Unit 5, a standard Kaplan turbine, to test the effectiveness of the MGR at im-proving the survivorship and overall health of the fish passing through the turbine. The pilot study discussed in this report was conducted in conjunction with the Normandeau bal-loon tag testing. This pilot study tested the use of light-emitting tags (LET) to visually observe the trajectory of fish passing from the point of injection immediately upstream of the turbine’s wicket gates into the region immediately above the turbines’ runners. The goals of the study were 1) to determine if LETs could be seen in this environment, 2) to obtain sufficient informa-tion to design and implement means for obtaining quantitative observations of LETs in future studies, and 3) to analyze the data, if it were of sufficient quality, to describe aspects of the tra-jectories of fish entering the turbine units as a function of release point and turbine operating conditions.
2
2.0 Methods
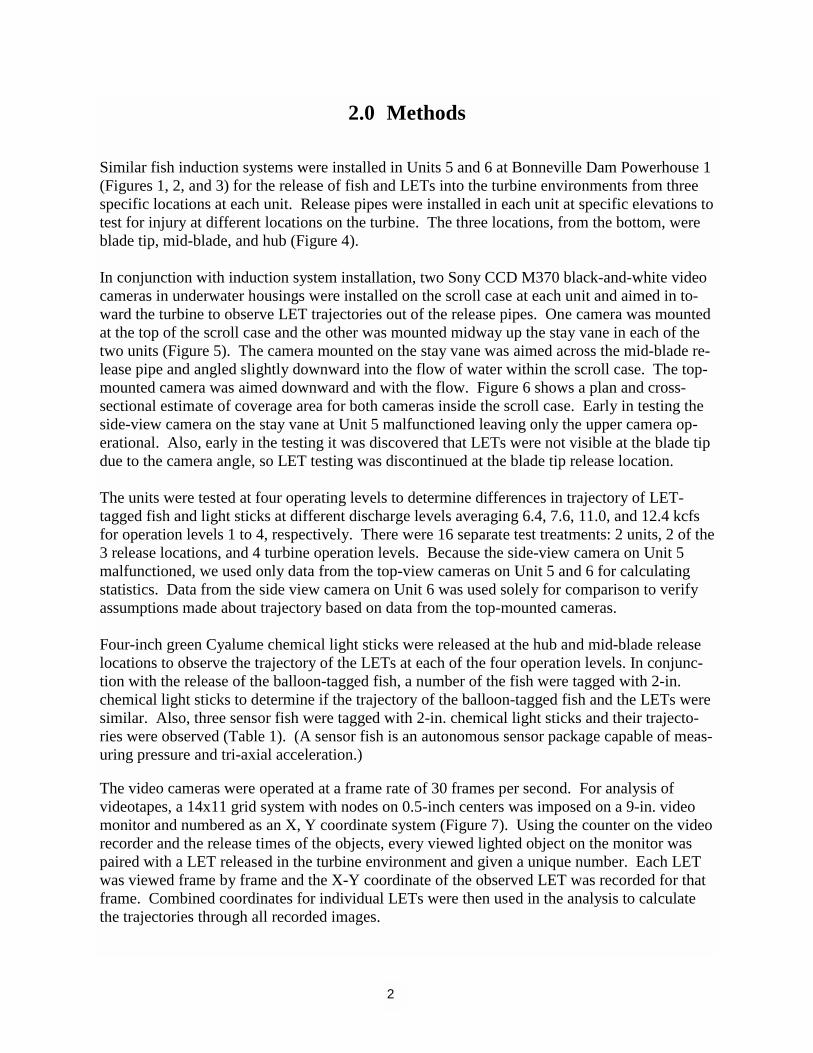
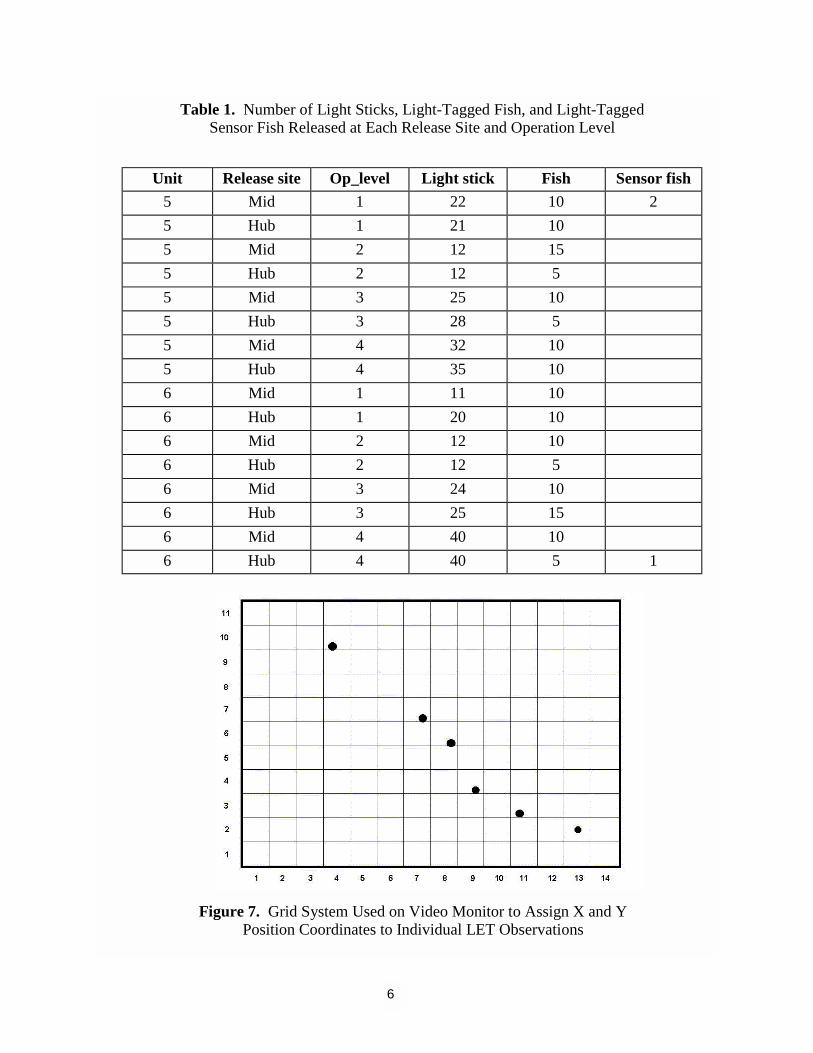
Similar fish induction systems were installed in Units 5 and 6 at Bonneville Dam Powerhouse 1 (Figures 1, 2, and 3) for the release of fish and LETs into the turbine environments from three specific locations at each unit. Release pipes were installed in each unit at specific elevations to test for injury at different locations on the turbine. The three locations, from the bottom, were blade tip, mid-blade, and hub (Figure 4). In conjunction with induction system installation, two Sony CCD M370 black-and-white video cameras in underwater housings were installed on the scroll case at each unit and aimed in to-ward the turbine to observe LET trajectories out of the release pipes. One camera was mounted at the top of the scroll case and the other was mounted midway up the stay vane in each of the two units (Figure 5). The camera mounted on the stay vane was aimed across the mid-blade re-lease pipe and angled slightly downward into the flow of water within the scroll case. The top-mounted camera was aimed downward and with the flow. Figure 6 shows a plan and cross-sectional estimate of coverage area for both cameras inside the scroll case. Early in testing the side-view camera on the stay vane at Unit 5 malfunctioned leaving only the upper camera op-erational. Also, early in the testing it was discovered that LETs were not visible at the blade tip due to the camera angle, so LET testing was discontinued at the blade tip release location. The units were tested at four operating levels to determine differences in trajectory of LET-tagged fish and light sticks at different discharge levels averaging 6.4, 7.6, 11.0, and 12.4 kcfs for operation levels 1 to 4, respectively. There were 16 separate test treatments: 2 units, 2 of the 3 release locations, and 4 turbine operation levels. Because the side-view camera on Unit 5 malfunctioned, we used only data from the top-view cameras on Unit 5 and 6 for calculating statistics. Data from the side view camera on Unit 6 was used solely for comparison to verify assumptions made about trajectory based on data from the top-mounted cameras. Four-inch green Cyalume chemical light sticks were released at the hub and mid-blade release locations to observe the trajectory of the LETs at each of the four operation levels. In conjunc-tion with the release of the balloon-tagged fish, a number of the fish were tagged with 2-in. chemical light sticks to determine if the trajectory of the balloon-tagged fish and the LETs were similar. Also, three sensor fish were tagged with 2-in. chemical light sticks and their trajecto-ries were observed (Table 1). (A sensor fish is an autonomous sensor package capable of meas-uring pressure and tri-axial acceleration.) The video cameras were operated at a frame rate of 30 frames per second. For analysis of videotapes, a 14x11 grid system with nodes on 0.5-inch centers was imposed on a 9-in. video monitor and numbered as an X, Y coordinate system (Figure 7). Using the counter on the video recorder and the release times of the objects, every viewed lighted object on the monitor was paired with a LET released in the turbine environment and given a unique number. Each LET was viewed frame by frame and the X-Y coordinate of the observed LET was recorded for that frame. Combined coordinates for individual LETs were then used in the analysis to calculate the trajectories through all recorded images.
3
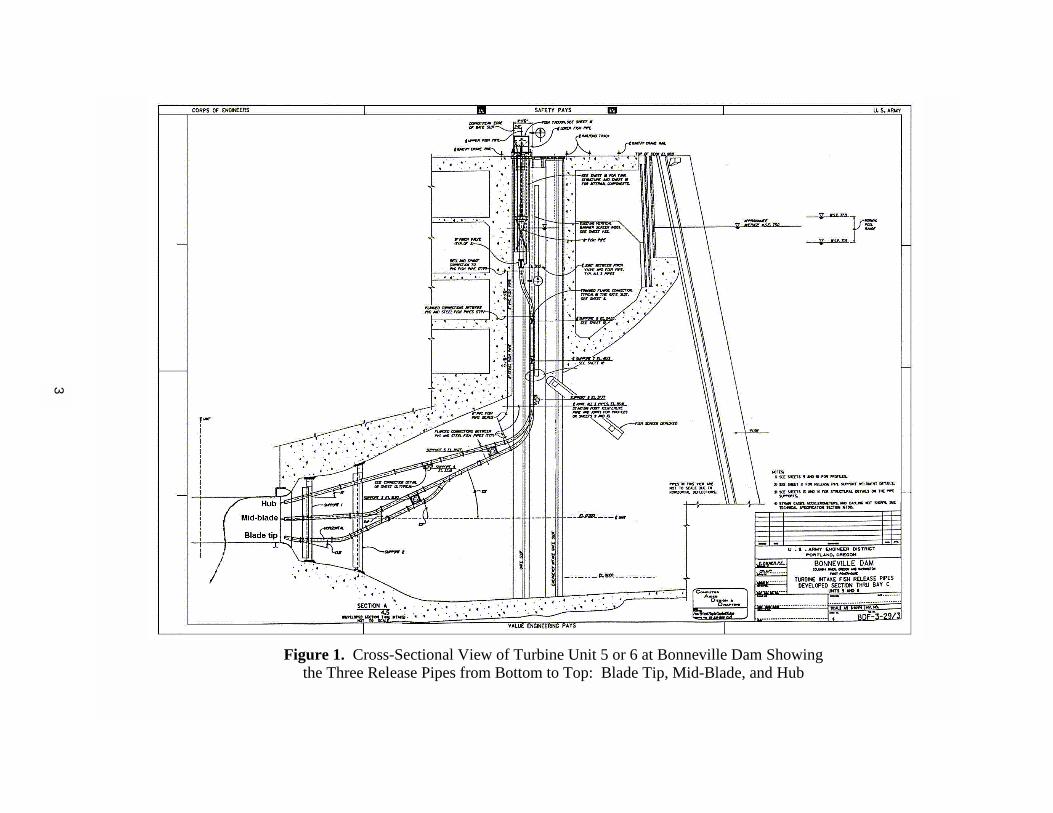
Figure 1. Cross-Sectional View of Turbine Unit 5 or 6 at Bonneville Dam Showing the Three Release Pipes from Bottom to Top: Blade Tip, Mid-Blade, and Hub
4
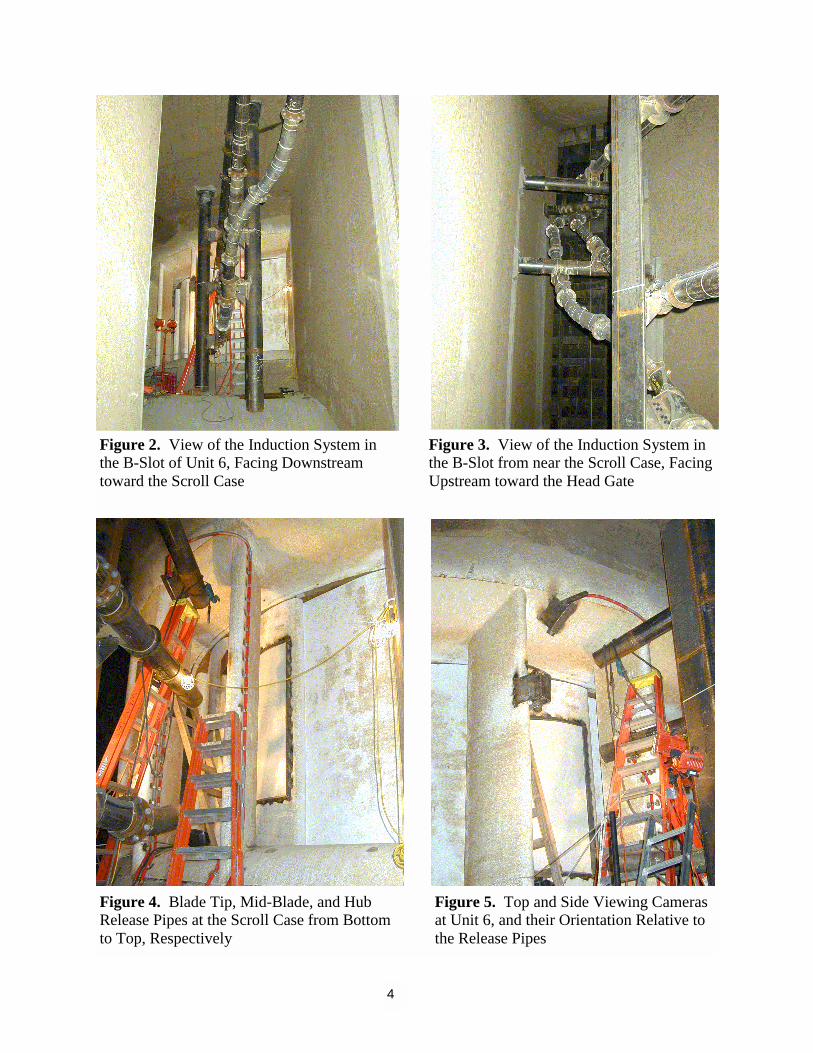
Figure 2. View of the Induction System in the B-Slot of Unit 6, Facing Downstream toward the Scroll Case
Figure 3. View of the Induction System in the B-Slot from near the Scroll Case, Facing Upstream toward the Head Gate
Figure 4. Blade Tip, Mid-Blade, and Hub Release Pipes at the Scroll Case from Bottom to Top, Respectively
Figure 5. Top and Side Viewing Cameras at Unit 6, and their Orientation Relative to the Release Pipes
5
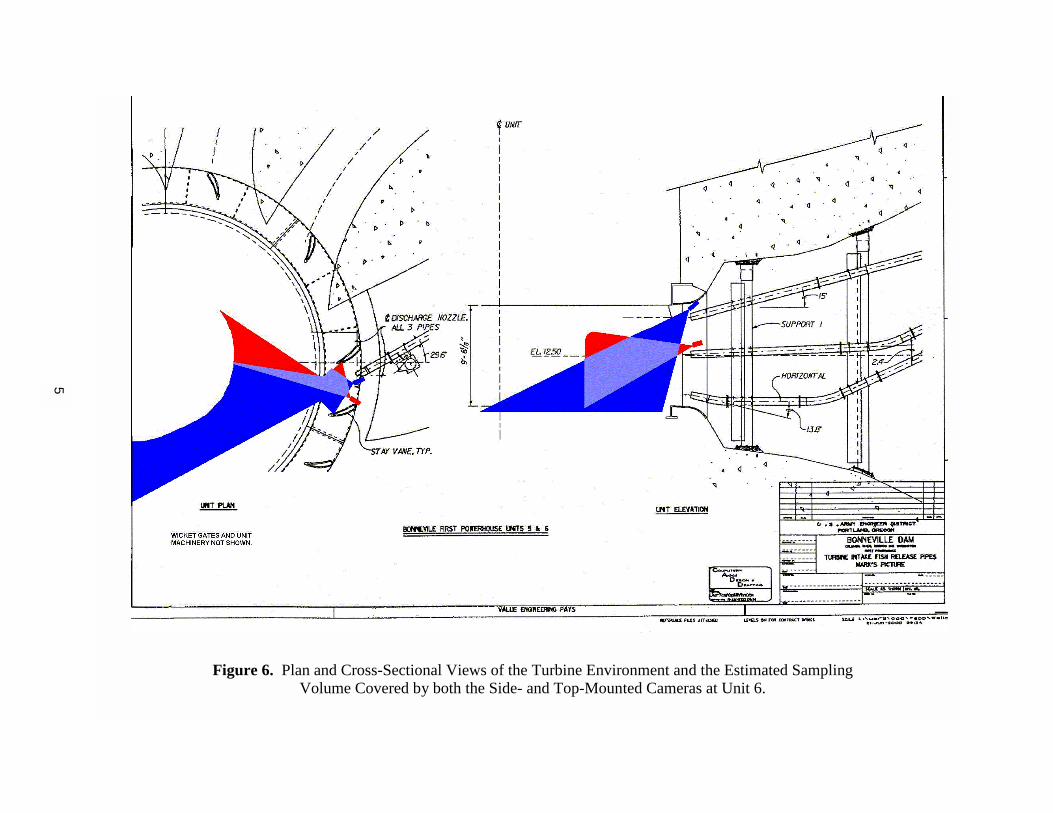
Figure 6. Plan and Cross-Sectional Views of the Turbine Environment and the Estimated Sampling Volume Covered by both the Side- and Top-Mounted Cameras at Unit 6.
6
Unit Release site Op_level Light stick Fish Sensor fish 5 Mid 1 22 10 2 5 Hub 1 21 10
5 Mid 2 12 15
5 Hub 2 12 5
5 Mid 3 25 10
5 Hub 3 28 5
5 Mid 4 32 10
5 Hub 4 35 10
6 Mid 1 11 10
6 Hub 1 20 10
6 Mid 2 12 10
6 Hub 2 12 5
6 Mid 3 24 10
6 Hub 3 25 15
6 Mid 4 40 10
6 Hub 4 40 5 1
Table 1. Number of Light Sticks, Light-Tagged Fish, and Light-Tagged Sensor Fish Released at Each Release Site and Operation Level
Figure 7. Grid System Used on Video Monitor to Assign X and Y Position Coordinates to Individual LET Observations
7
3.0 Results and Discussion 3.1 Visual Tracking of LETs LETs were generally visible for the entire viewable range of the camera within the turbine envi-ronment, although the 4-in. LETs were brighter and were easier to detect than the 2-in. LETs attached to the fish. Not every LET inducted was detected by the cameras. Some LETs were probably blocked from the camera’s view by the fish and some may have been hard to detect because of their orientation relative to the camera during passage. Of the 506 LETs inducted at the hub and mid-blade during testing, 403 (80%) were detected on the cameras and recorded. Approximately 75% of the LETs released at the mid-blade of Unit 6 and detected on the side camera were also detected on the top camera, but no hub-released fish were detected on the side camera due to the small viewing area and angle of the camera into the flow (Figure 6). Of the two cameras mounted in each unit, the top-mounted camera provided the largest volume of cov-erage and provided the longest viewing time. Having the camera mounted with the flow and aimed in the same vertical orientation the LET was moving, down in this case, maximized the possible viewing time. The number of frames in which an object was detected varied from 1 to 14 and was signifi-cantly affected by operation level (ANOVA P<0.05) with objects passing out of view signifi-cantly faster at higher operation levels. The discharge through the units was almost twice as high at the highest discharge as at the lowest. The velocity of water through the viewing region of the cameras was therefore proportionally faster at the higher discharge rates. Due to camera field of view and object trajectories, objects were viewed for more frames on the top-mounted cameras than on the side-mounted camera. In the lower operation range, mean viewable frames between cameras averaged 6 to 8 whereas at the upper operation level the mean number of viewable frames varied from 3 to 5. At the higher load levels it is difficult to produce good tra-jectories with such a short track. Twice as many viewable frames are necessary at the highest load level to provide adequate tracks for analysis. The speed of the cameras used during testing was 30 frames per second. Doubling the frame rate to 60 frames per second would probably be adequate under similar test conditions. 3.2 X and Y Trajectories From the data it was possible to determine the relative X-Y trajectory of the LETs. The slope and intercept of each object was calculated to determine the projection of the trajectory in the X-Y plane parallel to the camera lens, with intercept being the edge of view in the video moni-tor. The trajectories of the LETs varied a little within treatments; however, much of this posi-tion variance we viewed in the X-Y plane is probably due to the variation in the Z component of the trajectory. The cameras were not positioned or synchronized to enable 3-D trajectory analysis so we were unable to determine the distance (Z) of the LET from the camera. If there were actually large location variances for the LETs viewed in the X-Y plane, we would proba-bly have seen larger scatter than we did, given the system we used to determine LET position.
8
The X-Y trajectories of released fish were plotted by unit, release location, and camera on which images were recorded. The mean trajectory for each of the three release types was then plotted using regression (Figures 8, 9, and 10). When the trajectories of the fish, light sticks, and sensor fish were compared, there was no significant difference in the slope or intercept for the trajectories (heterogeneity of slopes P>0.05) within treatments at any of the three cameras so fish, light stick, and sensor fish data within treatments were combined to increase our sample size for the rest of this report. The trajectories of the released objects were compared by unit, camera, and release location. At Unit 5, there was no significant difference in the slope (trajectory), in the X-Y plane, of the re-leased objects at the four operation levels for objects released at the hub (heterogeneity of slopes P>0.05) (Figure 8). For objects released at the mid-blade location there was no signifi-cant difference in slope, in the X-Y plane, between operation levels 1 and 2, or operation levels 3 and 4 (P>0.05). There was, however, a significant difference in trajectory between the lower two operation levels (1 and 2) and the upper two operation levels (3 and 4). For objects released at the mid-blade location and viewed with the side camera at Unit 6 there was no significant difference in trajectory, in the X-Y plane, between any of the four operation levels (P>0.05) (Figure 9). Also no significant difference (P>0.05) was found for releases made at the hub and viewed on the top camera (Figure 10). Nor was there a significant difference (P>0.05) in trajectory for operation levels 1, 2, or 3 for mid-blade releases viewed with the top camera at Unit 6. There was, however, a significant difference (P>0.05) between operation level 4 and operation levels 1, 2, and 3. It is possible that a significant difference in trajectory at different operation levels could be detected if cameras were mounted at different angles, or locations, than were used during this preliminary study and if the Z component of the trajectory could be taken into account. Also larger sample sizes for each treatment are needed to detect a significant difference. To detect a significant difference (alpha=0.05, power=0.80) between operation levels, a mini-mum of 80 LETs needed to be released at each operation level and release site. To be 90% con-fident (alpha=0.05, power=0.90) at least 125 LETs had to be released at each operation level and release site. It was not feasible to make comparisons between Units 5 and 6. Though cameras were mounted in similar locations, the mounting point and camera angle were not identical. 3.3 Z Trajectory Given the camera set up, it was impossible to determine the actual trajectory of the objects; the study did not enable permit 3-D tracking of LETs due to the lack of the Z component necessary for 3-D resolution. To get an actual 3-D estimate of location, it would be necessary to have two, or preferably three, cameras separated in space with an overlapping viewing area.
9
Figure 8. Light Stick, Fish, and Sensor Fish Trajectories in the X-Y Plane at Unit 5 at Four Operation Levels at Mid-Blade and Hub Release Pipes for Data Collected with the Top Camera
10
Figure 9. Light Stick and Fish Trajectories in the X-Y Plane at Unit 6 at Four Operation Levels and Mid-Blade and Hub Release Pipes for Data Collected at the Side Camera
11
Figure 10. Light Sticks, Fish, and Sensor Fish Trajectories in the X-Y Plane at Unit 6 at Four Operation Levels and Mid-Blade and Hub Release Pipes for Data Collected at the Top Camera
12
Using the estimated sampling area from the two cameras at Unit 6 (Figure 6) it is, however, possible to estimate the likely region where the LETs entered the turbine environment. Since blade tip-released LETs were not detected on either the side or top camera at Unit 6, we speculate that these LETs passed over the lower lip of the scroll case and dropped into the tur-bine following the planned trajectory near the blade tip. The top cameras were aimed just past the edge of the lip and would have detected released objects if they had passed more than a few feet from the lip of the scroll case. Observations of LETs injected using the mid-blade release pipe indicate that the LETs did pass the turbines’ runners in the mid-blade region. The mid-blade region encompasses a large area relative to that for the hub and tip regions. Data from the side camera at Unit 6 showed the LETs remained fairly level vertically after release as they entered the scroll case. When de-tected by the top camera in Unit 6 the LETs remained near the middle of the X-axis and in the lower two-thirds of the Y-axis. Similar orientation was observed on the top camera at Unit 5. Comparing the X and Y coordinate data for complete image traces of point of entry into the tur-bine to gridded video images collected after the unit was dewatered places the LETs entering the turbine in the mid-blade region. On one occasion light sticks were released from the hub pipe while the turbine was being shut down. One of these light sticks came to rest on a turbine blade and was distinctly visible. From this observation it is apparent that we were able to ob-serve the LETs to immediately above the turbines’ runners. It is much harder to speculate on the fate of objects released at the hub. The trajectory of the X and Y coordinates does seem to imply an object might remain high in the water column in the scroll case but determining its actual location relative to the hub cannot be determined from the data collected this year. 3.4 Three-Dimensional Trajectory With the equipment used for this pilot study, we could not determine the three-dimensional tra-jectory of the LETs. Because the video camera only afforded a two-dimensional perspective, we are only able to estimate the general trajectory of the LETs. We can only speculate on the trajectories for blade-tip release fish because they did not pass through the field of view of the cameras. Several factors limited our ability to obtain 3-D trajectories in this study: 1) Cameras were not aimed with adequate overlapping viewing area; 2) the camera position and field of view were not mapped out well relative to the scroll case and turbine environment; 3) the Hi8 tape decks used to record the data could not be synchronized, so frame-by-frame comparisons were not precise. To produce accurate 3-D images and trajectories, it is imperative that the camera position and viewing area of the camera relative to the turbine environment be well mapped and that at least two cameras have overlapping fields of view for the area of interest. Also, to produce accurate 3-D trajectories, it is important to synchronize viewed images between cameras. This can be accomplished using Hi8 tape decks, as was used for this pilot study, and a flashing light that

13
could be detected by all cameras as a reference. Or, a more accurate method is to collect the data digitally and synchronize the frames with a time stamp. Digital cameras are available with faster frame rates than we used. Those cameras are suitable for viewing LETs in low light conditions like those in the turbine environment if the cameras are protected with an underwater housing. There are also computer systems available to collect synchronized data from multiple cameras simultaneously. Software also is available for track-ing of the LET images and providing 3-D trajectories as well as velocity and acceleration data.

14
4.0 Conclusions and Recommendations for
Future In-Turbine Monitoring Based on the data we collected at Bonneville Powerhouse 1 during the winter of 1999/2000, we conclude the following:
• It is possible to detect LETs within the turbine environment.
• It may be possible to collect 3-D data for objects released into a turbine environment us-ing video cameras and LETs, provided the location of interest is determined in advance and cameras are positioned and calibrated properly to collect synchronized images from multiple cameras.
We recommend the following: • A larger sample size is necessary for determining differences in LET trajectory. • At least two, and preferably three or more, properly aimed video cameras with overlapping
viewing areas are needed to collect accurate 3-D data. • To provide accurate location estimates, the turbine area needs to be well mapped with coor-
dinate data and distance measurements by location for each camera, as well as for the areas where the coordinates overlap between cameras. Even with these calculations, the resolu-tion of the position estimates degrades with increasing distance from the cameras. There are several 3-D software packages and video systems available to capture data and analyze it at a much greater resolution and accuracy than was used in this pilot study. Those systems are essential for acquisition of 3-D trajectories and are recommended. Companies supplying this technology include Sensors Applications Inc. and Media Cybernetics.
• In addition to multiple cameras, light-emitting beacons should be mounted at known loca-
tions. This would permit calibration of the 3-D tracking system and aid in identification of reference points. The beacons would also aid in synchronization of cameras and quantifica-tion of water quality conditions such as turbidity that affect visual tracking capability and the quality of visual data. Viewing a LET in a dark location is disorienting, and an addi-tional fixed reference is imperative.

15
PNNL-13415
Distribution No. of Copies ONSITE 29 Pacific Northwest National Laboratory T.J. Carlson (20) BPO T.L. Gilbride BPO MA. Weiland BPO Information Release Office (7) K1-06
Distr.1