stress testing of organic light-emitting diode panels and ... · stress testing of organic...
TRANSCRIPT
Stress Testing of Organic Light-
Emitting Diode Panels and Luminaires
January 2018
Month Year (Franklin Gothic 12pt)
(This page intentionally left blank)
iii
RTI Project Number 0215939.001.001
Stress Testing of Organic Light-
Emitting Diode Panels and
Luminaires
January 2018
Prepared for
Client Name: U.S. Department of Energy
Through contract with KeyLogic Systems, Inc. 3168 Collins Ferry Road
Morgantown, WV 26505
Prepared by
RTI Author(s): Lynn Davis, Kelley Rountree, and Karmann Mills RTI International
3040 E. Cornwallis Road
Research Triangle Park, NC 27709

Stress Testing of Organic Light-Emitting Diode Panels and Luminaires
iv
Acknowledgments This material is based upon work supported by the Department of Energy, Office of Energy Efficiency and
Renewable Energy (EERE), under Award Number DE-FE0025912.
Disclaimer This report was prepared as an account of work sponsored by an agency of the United States Government.
Neither the United States Government nor any agency thereof, nor any of their employees, makes any
warranty, express or implied, or assumes any legal liability or responsibility for the accuracy, completeness, or
usefulness of any information, apparatus, product, or process disclosed, or represents that its use would not
infringe privately owned rights. Reference herein to any specific commercial product, process, or service by
trade name, trademark, manufacturer, or otherwise does not necessarily constitute or imply its endorsement,
recommendation, or favoring by the United States Government or any agency thereof. The views and opinions
of authors expressed herein do not necessarily state or reflect those of the United States Government or any
agency thereof.
Stress Testing of Organic Light-Emitting Diode Panels and Luminaires
v
List of Acronyms ac Alternating current
AST Accelerated stress test
CALiPER Commercially available LED product evaluation and reporting
CCR Constant current reduction
CCT Correlated color temperature
CRI Color rendering index
dc Direct current
DOE U.S. Department of Energy
DUT Device under test
IES Illuminating Engineering Society
LED Light-emitting diode
LPW Lumens per watt
OLED Organic light-emitting diode
PWM Pulse-width modulation
RT Room temperature
RTI Research Triangle Institute
RTOL Room temperature operational life
SPD Spectral power distribution
SSL Solid-state lighting
TM Technical memorandum

Stress Testing of Organic Light-Emitting Diode Panels and Luminaires
vi
Executive Summary Luminaires and other lighting devices using organic light-emitting diode (OLED) sources have many
advantages over their competitors for indoor lighting, including thin form factors that produce highly diffuse,
potentially low-glare, lighting with excellent color rendering properties. However, several significant issues
with OLED products have limited their commercial acceptance to date, including source efficacy, source
lifetime, driver performance, and initial costs. The U.S. Department of Energy (DOE) has released four reports
on OLED technologies to provide the lighting industry with information on the state of the technology. These
reports include the evaluation of two different field deployment sites, a market analysis, and an independent
assessment of the performance of several commercially available OLED products.
This report builds on previous DOE efforts with OLED technology by updating information on a previously
benchmarked OLED product (the Chalina luminaire from Acuity Brands) and provides new benchmarks on the
performance of Brite 2 and Brite Amber OLED panels from OLEDWorks. During the tests described here,
samples of these devices were subjected to continuous operation in stress tests at elevated ambient temperature
environments of 35°C or 45°C. In addition, samples were also operated continuously at room temperature in a
room temperature operational life test (RTOL). One goal of this study was to investigate whether these test
conditions can accelerate failure of OLED panels, either through panel shorting or an open circuit in the panel.
These stress tests are shown to provide meaningful acceleration of OLED failure modes, and an acceleration
factor of 2.6 was calculated at 45°C for some test conditions. In addition, changes in the photometric properties
of the emitted light (e.g., luminous flux and chromaticity maintenance) was also evaluated for insights into the
long-term stability of these products compared to earlier generations. Because OLEDs are a lighting system,
electrical testing was also performed on the panel-driver pairs to provide insights into the impact of the driver
on long-term panel performance.
The Chalina luminaire from Acuity Brands uses OLED panels made by LG Display. These panels utilize a 3-
tandem stack structure with one layer containing a blue fluorescent emitter and two layers containing
combined green and red phosphorescent emitters. In this study, three different generations (denoted as Gen 1,
Gen 2, and Gen 3) of OLED panels were found to be used in the tested Chalina luminaires. Gen 2 and Gen 3
OLED panels are characterized by a copper foil adhered to the back of the panel, whereas Gen 1 OLED panels
have a mirror-like finish on the back. Chalina luminaires with Gen 1 panels were previously discussed in
CALiPER 24.
While the light emission characteristics of the OLED panels in the Chalina luminaire were the same regardless
of the generation of the light source, the thermal stability of the emitter materials was found to have improved
over previous benchmarks. Stress tests described in CALiPER 24 demonstrated that the phosphorescent green
and red emitters used in the Gen 1 OLED panels have lower thermal stability than the fluorescent blue emitter.
As a result, the chromaticity of the Gen 1 panels shifted in the blue direction, and that trend continued in the
additional testing reported here. Furthermore, the impedance increase in the Gen 1 panels was also significant
in an elevated ambient temperature of 45°C, resulting in the need for progressively higher driver voltage to
maintain a constant current. In the benchmark testing reported here, the thermal stability of the phosphorescent
emitters was much better in the Gen 2 and Gen 3 OLED panels used in the Chalina luminaires, and there was
minimal change in the impedance of the OLED panels, even at an elevated ambient temperature of 45°C for
2,000 hours. These findings demonstrate a significant improvement in the thermal performance of OLED
panels, although the luminous flux maintenance improved little.
Likewise, the color rendition properties of the Brite 2 FL300 panels from OLEDWorks has been improved
significantly over that of the Brite 1 panels benchmarked in earlier DOE studies. This improvement has been
produced by a new mix of phosphorescent emitters that include significant emission in the far red. As a result,
the color rendering metrics including color fidelity (Rf), color gamut (Rg), red color rendering (R9), and the
color rendering index (CRI) are generally improved over that of the Brite 1 panels benchmarked in earlier
DOE studies. It appears that the same organic emitters are used for both neutral white and warm white Brite 2
Stress Testing of Organic Light-Emitting Diode Panels and Luminaires
vii
panels with the ratio of blue, green, and red emitters altered to achieve a desired color point. As a result, the
luminous efficacy of the commercial Brite 2 lighting system was 32 lumens per watt (LPW) for the neutral
white product (including OLED panel, power supply, and driver) and 38 LPW for the warm white product
(including the OLED panel, power supply, and driver). The efficiency of the power supply and the driver were
measured to be 70.5%. As a result, the luminous efficacy of the OLED panels alone was 45 LPW for the
neutral white panel and 54 LPW for the warm white panel, at driver currents of 263 mA. These values are
slightly below the manufacturer’s specification of 46 LPW (neutral white) and 57 LPW (warm white). Both the
Brite 2 warm white and Brite 2 neutral white panels were found to render red colors in a manner comparable to
the reference sources; however, the Brite 2 panels produced some desaturation in green colors, and this effect
was larger for the neutral white panels than for the warm white. To date, samples of the Brite 2 panels
described in this testing have been through 1,500 hours of testing at 45°C, 35°C, and room temperature with no
failures; however, black spots have appeared on two samples operated continuously at room temperature.
OLEDWorks also manufactures an amber emitter, consisting of a 2-tandem stack of mixed red and green
phosphorescent emitters. The intended application of this light source is melanoptic lighting. These samples
have generally fared well through 1,500 hours of testing at 35°C and room temperature; however, at 45°C, all
three samples failed as electrical shorts before 1,500 hours had elapsed. Because this device operates at only 6
volts direct current (dc), finding an appropriate driver for consistent operation may be difficult. Based on this
result, additional testing is needed to determine whether the failure of the Brite Amber panels in the 45°C test
is due to an issue with the OLED panel or with the driver.
The results demonstrate that the performance of OLED panels continues to improve. Additional gains are
necessary to increase the system efficiency of OLEDs to be more comparable to that of inorganic LEDs. Gain
in the luminous efficacy of OLED panels will help to improve overall system efficiency, but attention must be
paid to the drivers used in OLEDs as well. The driver for the Chalina luminaire demonstrated good efficiency
(83.9%) and a high power factor (0.99). In contrast, the drivers used for the Brite 2 and Brite Amber products
was less efficient, and the power factor was significantly lower. These findings reinforce conclusions from
earlier DOE studies that developing custom power supplies for OLED products is imperative for the industry.
Stress Testing of Organic Light-Emitting Diode Panels and Luminaires
viii
Table of Contents
Executive Summary .......................................................................................................................................... vi
Introduction .................................................................................................................................................. 1 1
Previous DOE Efforts with OLEDs ................................................................................................. 1 1.1
Scope of This Report ..................................................................................................................... 2 1.2
Comparison of LED and OLED Reliability Studies .................................................................................. 3 2
Experimental Methods ............................................................................................................................... 3 3
Samples ......................................................................................................................................... 4 3.1
3.1.1 Acuity Brands Chalina Luminaire with Panels from LG Display ...................................... 4
3.1.2 OLED Panels from OLEDWorks ......................................................................................... 5
Stress Testing Methods ................................................................................................................. 8 3.2
Results .......................................................................................................................................................... 9 4
Chalina Luminaires ........................................................................................................................ 9 4.1
4.1.1 Photometric Measurements .............................................................................................. 9
4.1.2 Luminous Flux Maintenance .......................................................................................... 10
4.1.3 Chromaticity .................................................................................................................... 13
4.1.4 Electrical Analysis ........................................................................................................... 15
OLEDWorks Panels ..................................................................................................................... 15 4.2
4.2.1 Photometric Analysis ...................................................................................................... 15
4.2.2 Luminous Flux Maintenance .......................................................................................... 16
4.2.3 Chromaticity .................................................................................................................... 18
4.2.4 Electrical Analysis ........................................................................................................... 21
4.2.5 Uniformity of OLEDWorks Panels ................................................................................... 26
Recommended Next Steps ..................................................................................................................... 27 5
References ....................................................................................................................................................... 29
Appendix A ...................................................................................................................................................... A-1
Appendix B ...................................................................................................................................................... B-1
Stress Testing of Organic Light-Emitting Diode Panels and Luminaires
ix
List of Figures
Figure 3–1. View of the backside of Chalina OLED luminaires from Acuity Brands. .............................. 5
Figure 3–2. Neutral white, warm white, and amber panels from OLEDWorks. ....................................... 6
Figure 3–3. Wall power supply and driver for Brite 2 panels and driver from Brite Amber
panels. ........................................................................................................................................................... 7
Figure 3–4. OLED devices mounted for Photometric testing. .................................................................... 9
Figure 4–1. Luminous flux maintenance for the Chalina luminaire during continuous
operation at room temperature (in RTOL) testing and at 35°C. ...................................................... 10
Figure 4–2. Luminous flux maintenance for DUT-225, which contains Gen 1 panels. ....................... 11
Figure 4–3. Luminous flux maintenance for DUT-227, which contains Gen 1 panels. ....................... 12
Figure 4–4. Luminous flux maintenance for DUT-394 and DUT-395, which contain Gen 3
panels. ........................................................................................................................................................ 12
Figure 4–5. Time dependence of uʹ and vʹ for Chalina luminaires with Gen 1 OLED panels
in 45°C stress testing. ............................................................................................................................ 13
Figure 4–6. Deconvolution of the SPD for DUT-227 containing Gen 1 OLED panels. .......................... 14
Figure 4–7. Relative emission intensity over time of the three emitters used in a Chalina
luminaire with Gen 1 OLED panels........................................................................................................ 14
Figure 4–8. Average luminous flux maintenance for neutral white panels .......................................... 17
Figure 4–9. Average luminous flux maintenance for warm white panels ............................................. 18
Figure 4–10. Average luminous flux maintenance for amber panels.................................................... 18
Figure 4–11. Chromaticity diagram for neutral white panels ................................................................. 19
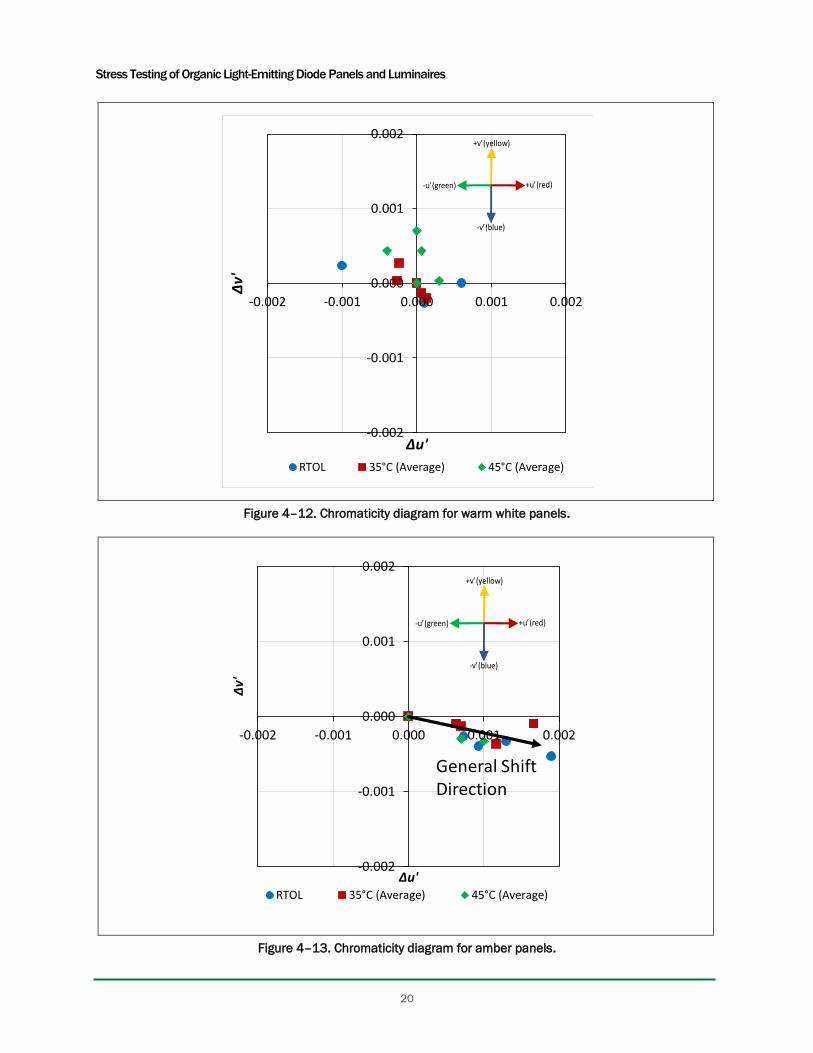
Figure 4–12. Chromaticity diagram for warm white panels .................................................................... 20
Figure 4–13. Chromaticity diagram for amber panels ............................................................................. 20
Figure 4–14. Emission spectra modeling for red and green components relative to the
control sample over 1,500 hours .......................................................................................................... 21
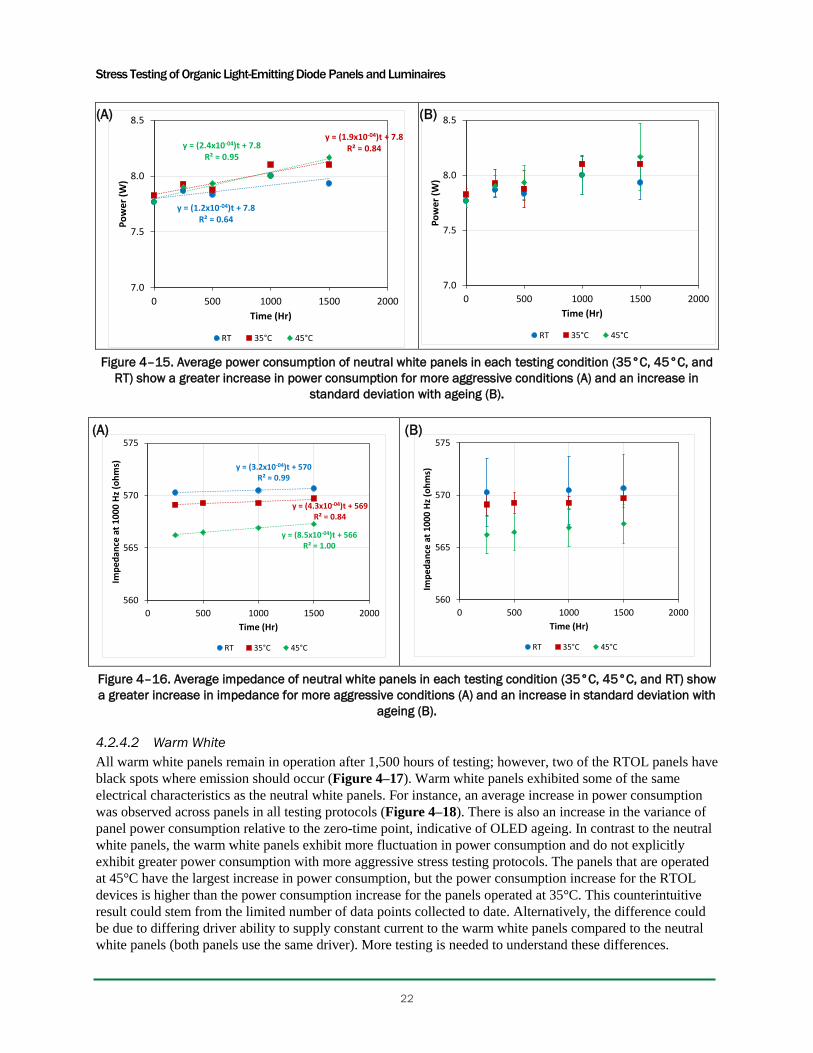
Figure 4–15. Average power consumption of neutral white panels in each testing condition
(35°C, 45°C, and RT) show a greater increase in power consumption for more
aggressive conditions (A) and an increase in standard deviation with ageing (B). ....................... 22
Figure 4–16. Average impedance of neutral white panels in each testing condition (35°C,
45°C, and RT) show a greater increase in impedance for more aggressive conditions (A)
and an increase in standard deviation with ageing (B). ..................................................................... 22
Figure 4–17. Black spot on warm white panel in RTOL testing. ............................................................. 23
Figure 4–18. Average power consumption of warm white panels in each testing condition
(35°C, 45°C, and RT) show a greater increase in power consumption for more
aggressive conditions (A) and an increase in standard deviation with ageing (B). ....................... 23
Stress Testing of Organic Light-Emitting Diode Panels and Luminaires
x
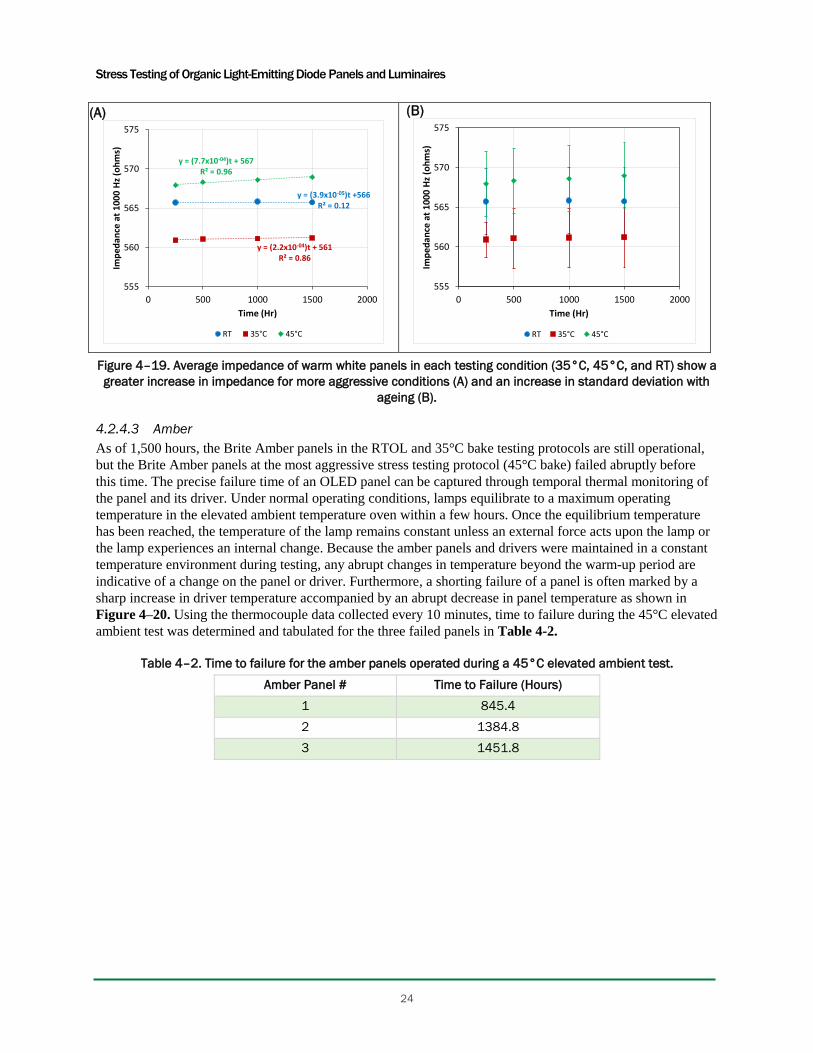
Figure 4–19. Average impedance of warm white panels in each testing condition (35°C,
45°C, and RT) show a greater increase in impedance for more aggressive conditions (A)
and an increase in standard deviation with ageing (B). ..................................................................... 24
Figure 4–20. Failure is indicated by the red line for a Brite Amber panel. OLED drivers
experience a temperature increase and OLED panels experience a temperature
decrease when a shorting failure arises within the OLED panel. ..................................................... 25
Figure 4–21. Mask used to measure neutral white and warm white panel uniformity ...................... 26
Figure B-1. Color data for Chalina luminaire with Gen 2 OLED panels. ................................................ B-1
Figure B-2. Color data for Chalina luminaire with Gen 3 OLED panels. ................................................ B-2
Figure B-3. Color rendition data for OLEDWorks Brite 2 FL300 neutral white panels. ....................... B-3
Figure B-4. Color rendition data for OLEDWorks Brite 2 FL300 warm white panels. ......................... B-4
Figure B-5. Color rendition data for OLEDWorks Brite Amber panels. .................................................. B-5
Stress Testing of Organic Light-Emitting Diode Panels and Luminaires
xi
List of Tables
Table 1–1. Comparison of OLED panel performance given in DOE studies [2, 5]. ................................. 2
Table 3–1. Testing Methods Used during this Investigation. ...................................................................... 4
Table 3–2. Comparison of the initial impedance of OLED panels in the Chalina luminaire
with purchase date. .................................................................................................................................... 5
Table 3–3. Comparison of OLED panel area. ................................................................................................ 5
Table 3–4. Impedance of panels from OLEDWorks. .................................................................................... 6
Table 3–5. Part numbers for the power supply and drivers used with OLEDWorks panels in
this study. ..................................................................................................................................................... 7
Table 4–1. Impedance of Chalina OLED luminaires. ................................................................................ 15
Table 4–2. Time to failure for the amber panels operated in a 45°C elevated ambient test ............ 24
Table 4–3. Average power consumption for the amber panel-driver pairs subject to each
AST protocol after 1,500 hours .............................................................................................................. 25
Table 4–4. Average impedance values for amber panels subject to each AST protocol after
1,500 hours ............................................................................................................................................... 26
Table 4–5. Average luminance uniformity of OLEDWorks panels in...................................................... 27
Table 5–1. Summary of efficiencies and other power characteristics for the Acuity Chalina
luminaire and OLEDWorks panel drivers ............................................................................................. 27
Table A-1. Accelerated Stress Test (AST) Methods Developed and/or Used during this
Investigation............................................................................................................................................. A-1

Stress Testing of Organic Light-Emitting Diode Panels and Luminaires
1
Introduction 1Lighting using organic light-emitting diodes (OLEDs) is still in its infancy, and the technology faces several
notable challenges, including reducing costs and commercializing the high-efficacy performance that has been
demonstrated in the laboratory [1]. Especially in some indoor lighting applications, OLED technologies have
the potential to offer intriguing benefits including brightness, thin form factor, high light quality (with
excellent color rendering indices [CRI]), and the delivery of diffuse light that can be deployed close to the task
without creating uncomfortable glare.
Some of the challenges faced by OLED technologies in lighting application are analogous to those faced by
inorganic light-emitting diodes (LEDs) during the early stages of technology development. In an effort to
provide the industry with information on the state of the technology, this report documents findings from a
follow-up investigation on a commercial OLED luminaire product and recent testing results on the
performance of commercial OLED panels using new breakthroughs. Test results on the performance of OLED
panels will depend upon the match between the panel and the driver supplying the panel. Consequently, OLED
lighting products, even at the panel level, need to be considered an entire system comprised of OLED panel(s),
a driver, and a luminaire frame (for assembled products).
Previous DOE Efforts with OLEDs 1.1
The U.S. Department of Energy (DOE) has supported the development of OLED technologies as an integral
part of the solid-state lighting (SSL) program. Recently, DOE published four reports highlighting OLED
technologies including two field evaluations [2, 3], a Commercially Available LED Product Evaluation and
Reporting (CALiPER) study as part of a laboratory evaluation [4], and a market analysis [5]. A general
conclusion from these studies is that the cosine emission profile of the light produced by OLED devices is
beneficial, especially for indoor lighting, and provides the product with a unique look and functionality.
However, issues with the efficacy, lifetime, driver performance, and initial costs of OLED devices are
analogous to the early years of inorganic LEDs used for lighting applications. One goal of this report is to
update benchmark information on OLED products to document any improvement in OLED technologies since
the CALiPER 24 study was completed.
While there are several manufacturers of OLED panels for lighting applications [5], panels made by LG
Display and OLEDWorks have been the primary focus of DOE studies to date due to their use in commercial
luminaires. While panels from both manufacturers use fluorescent blue emitters and phosphorescent red and
green emitters, LG panels employ a 3-tandem stack device structure [6], whereas panels from OLEDWorks
incorporate a 6-tandem stack structure [7]. Panels from LG Display have been used in a broad range of
luminaire types examined in DOE studies including both Gateway and CALiPER reports [2–5]. The
luminaires in these DOE reports that incorporated panels from OLEDWorks mainly used the older Brite 1
technology [2 – 4], although the newer Brite 2 panel was examined in the most recent DOE report [3].
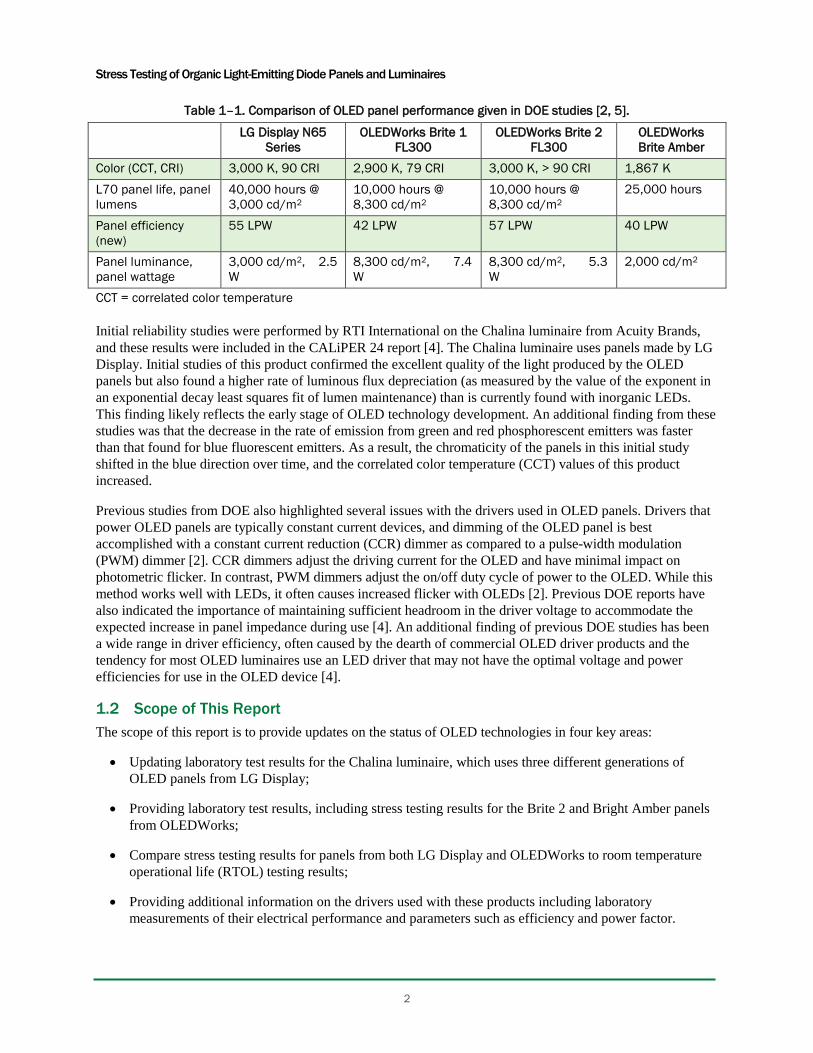
Previous DOE reports provide a snapshot of the manufacturer’s specified performance for these OLED panels,
and relevant parameters are collected from these previous reports and provided in Table 1–1. Spectral power
distributions (SPDs) and Illuminating Engineering Society (IES) Technical Memorandum-30 (TM-30)
calculations for these panels were included in previous DOE studies using data from CALiPER studies and the
manufacturers [2–5].
Stress Testing of Organic Light-Emitting Diode Panels and Luminaires
2
Table 1–1. Comparison of OLED panel performance given in DOE studies [2, 5].
LG Display N65
Series
OLEDWorks Brite 1
FL300
OLEDWorks Brite 2
FL300
OLEDWorks
Brite Amber
Color (CCT, CRI) 3,000 K, 90 CRI 2,900 K, 79 CRI 3,000 K, > 90 CRI 1,867 K
L70 panel life, panel
lumens
40,000 hours @
3,000 cd/m2
10,000 hours @
8,300 cd/m2
10,000 hours @
8,300 cd/m2
25,000 hours
Panel efficiency
(new)
55 LPW 42 LPW 57 LPW 40 LPW
Panel luminance,
panel wattage
3,000 cd/m2, 2.5
W
8,300 cd/m2, 7.4
W
8,300 cd/m2, 5.3
W
2,000 cd/m2
CCT = correlated color temperature
Initial reliability studies were performed by RTI International on the Chalina luminaire from Acuity Brands,
and these results were included in the CALiPER 24 report [4]. The Chalina luminaire uses panels made by LG
Display. Initial studies of this product confirmed the excellent quality of the light produced by the OLED
panels but also found a higher rate of luminous flux depreciation (as measured by the value of the exponent in
an exponential decay least squares fit of lumen maintenance) than is currently found with inorganic LEDs.
This finding likely reflects the early stage of OLED technology development. An additional finding from these
studies was that the decrease in the rate of emission from green and red phosphorescent emitters was faster
than that found for blue fluorescent emitters. As a result, the chromaticity of the panels in this initial study
shifted in the blue direction over time, and the correlated color temperature (CCT) values of this product
increased.
Previous studies from DOE also highlighted several issues with the drivers used in OLED panels. Drivers that
power OLED panels are typically constant current devices, and dimming of the OLED panel is best
accomplished with a constant current reduction (CCR) dimmer as compared to a pulse-width modulation
(PWM) dimmer [2]. CCR dimmers adjust the driving current for the OLED and have minimal impact on
photometric flicker. In contrast, PWM dimmers adjust the on/off duty cycle of power to the OLED. While this
method works well with LEDs, it often causes increased flicker with OLEDs [2]. Previous DOE reports have
also indicated the importance of maintaining sufficient headroom in the driver voltage to accommodate the
expected increase in panel impedance during use [4]. An additional finding of previous DOE studies has been
a wide range in driver efficiency, often caused by the dearth of commercial OLED driver products and the
tendency for most OLED luminaires use an LED driver that may not have the optimal voltage and power
efficiencies for use in the OLED device [4].
Scope of This Report 1.2
The scope of this report is to provide updates on the status of OLED technologies in four key areas:
Updating laboratory test results for the Chalina luminaire, which uses three different generations of
OLED panels from LG Display;
Providing laboratory test results, including stress testing results for the Brite 2 and Bright Amber panels
from OLEDWorks;
Compare stress testing results for panels from both LG Display and OLEDWorks to room temperature
operational life (RTOL) testing results;
Providing additional information on the drivers used with these products including laboratory
measurements of their electrical performance and parameters such as efficiency and power factor.

Stress Testing of Organic Light-Emitting Diode Panels and Luminaires
3
Comparison of LED and OLED Reliability Studies 2A recent investigation of the reliability of LED-based lighting systems, performed by the Research Triangle
Institute (RTI), used both accelerated stress test (AST) methods and failure models to assess entire luminaires
and key system components, such as LEDs, drivers, and optical elements [8]. A systems-level view of
reliability has been shown to be important in understanding the expected lifetime of SSL devices [8, 9]. OLED
luminaires are different in many ways from LED luminaires, but in the current study, OLED panels and drivers
are examined together as a system to understand lifetime expectations.
OLED lighting systems differ from LED luminaires in several ways. Most significantly, OLED lighting
systems contain one or more emission panels at a scale size of centimeters as opposed to the packaged LED die
in LED luminaires that have a scale size of millimeters. OLED panels are planar light sources made up of
layered chemistries, sandwiched between two electrodes. As a result, OLED lighting systems do not typically
use additional secondary optical components such as diffusers and lenses. OLED lighting systems mainly
consist of the OLED panel(s), one or more drivers, and a frame; components such as lenses, diffusers, and
reflectors, which are common among luminaires with inorganic LEDs, are incorporated into the OLED panels
or not used at all. Consequently, an OLED lighting system can fail during stress testing differently than an
LED luminaire does. For example, an entire OLED panel may not fail at once; instead, pixels may fail within
the OLED panel, reducing luminous flux and becoming visible to the end user. In addition, the multiple
emitters used to produce white light in OLEDs may exhibit significantly different lifetime characteristics,
which can cause chromaticity shifts through different mechanisms and at different rates than inorganic LED
devices do [4]. Other failure modes that can occur in OLED lighting systems include panel shorting, moisture
ingress, and driver failure [4].
Previous stress testing studies of LED luminaires showed the robustness of LEDs themselves was high and any
fragility most likely resides in luminaire components, such as the driver and optics [8, 9]. LED luminaires have
been exposed to high temperature and high humidity conditions (e.g., 75°C and 75% relative humidity) and
withstood several thousands of hours, on average, in such conditions before failure occurred. However,
OLEDs tested at these conditions were found to be over-stressed, thus resulting in unrealistic failure modes
[4]. Since OLED devices are most likely to be used indoors, changes in temperature and electrical currents
were found to be the most appropriate conditions for ASTs [10]. These findings agree with previous studies
demonstrating that models built on combined degradation from temperature and electrical current can
accurately capture the decay in luminous flux from OLED devices [11, 12]. Alternatively, if an OLED device
is operated at a known current, such as would occur when driven by a constant current driver, the decay
process of the device can be accelerated using temperature alone. This approach is analogous to accelerated
tests commonly used with inorganic LEDs (e.g., IES LM-80 testing) and is likely to be pursued in standardized
tests of OLEDs to keep testing duration to a practical level [10].
Experimental Methods 3The current study focuses on OLED luminaires and panels from two commercial sources, Acuity Brands, a
luminaire manufacturer, and OLEDWorks, a panel manufacturer. Luminaires from Acuity Brands contain
panels from LG Display, although recent information suggests that Acuity Brands is using OLED panels from
both LG Display and OLEDWorks in some products [13]. CALiPER 24 provided early results on the Chalina
luminaire from Acuity Brands with panels from LG Display [4], and the findings on this product are updated
here. An examination of the Brite 2 panels from OLEDWorks is also provided in this report as a complement
to earlier DOE studies on Brite 1 panels [2-5].
As summarized in Table 3–1, this report provides findings from stress testing involving temperature bakes at
mildly elevated temperatures. The findings from these tests are compared to the performance of the OLED
devices during RTOL testing to gauge the acceleration factor of a temperature-only test at a constant current
Stress Testing of Organic Light-Emitting Diode Panels and Luminaires
4
for device operation. During all tests, the OLED devices were continually powered, and there was no effort to
power cycle the devices. In addition, all OLED devices were operated with the drivers provided by the
manufacturer, and these drivers were operated at their expected maximum conditions with no dimming signals
applied to the product.
Table 3–1. Testing methods used during this investigation.
Test Name Test Description
45°C Continuous operation at a constant temperature of 45°C
35°C Continuous operation at a constant temperature of 35°C
RTOL Room temperature operational life — room temperature and ambient humidity
Samples 3.1
3.1.1 Acuity Brands Chalina Luminaire with Panels from LG Display
The Chalina luminaire from Acuity Brands was one of the first commercial OLED products produced on a
large scale by a major luminaire manufacturer. This product uses five square OLED panels (made by LG
Display) with emission areas between 813 cm2 and 835 cm
2, depending on the purchased population. An
evaluation of this product has been given previously [4]. During the testing reported herein, the drivers
supplied with the Chalina product were used to power the OLEDs, and these drivers were placed outside the
temperature chamber to minimize the effects of driver degradation on panel performance.
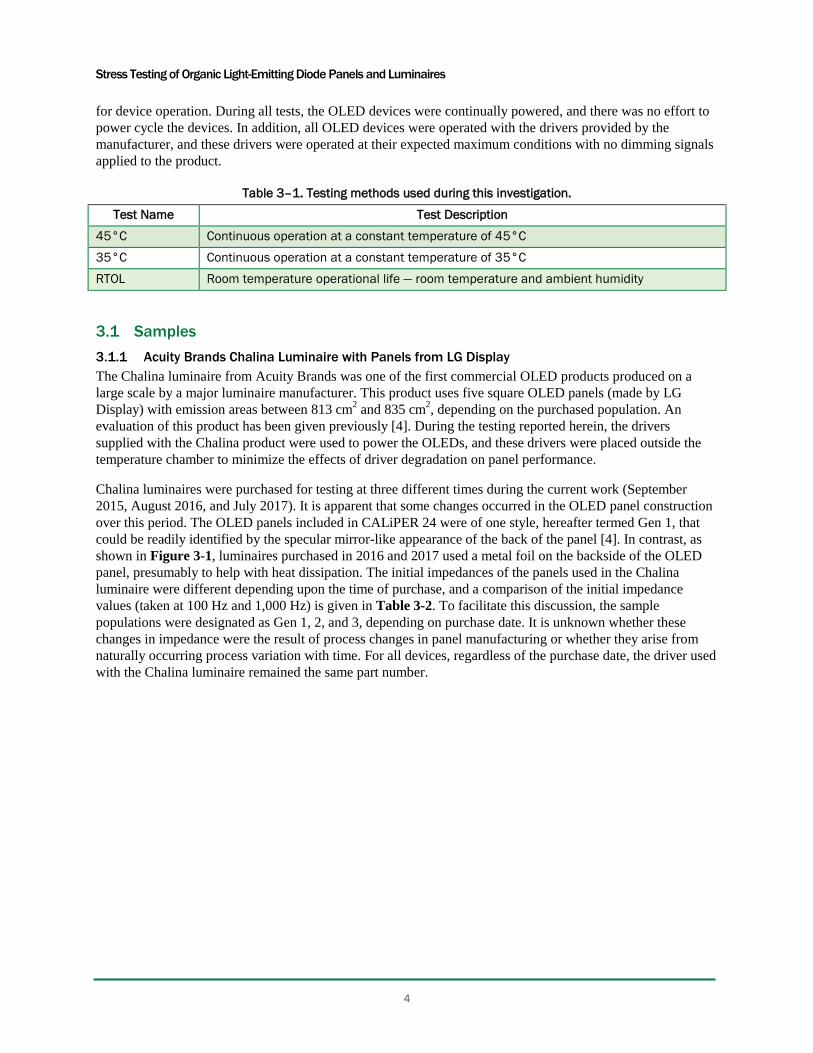
Chalina luminaires were purchased for testing at three different times during the current work (September
2015, August 2016, and July 2017). It is apparent that some changes occurred in the OLED panel construction
over this period. The OLED panels included in CALiPER 24 were of one style, hereafter termed Gen 1, that
could be readily identified by the specular mirror-like appearance of the back of the panel [4]. In contrast, as
shown in Figure 3-1, luminaires purchased in 2016 and 2017 used a metal foil on the backside of the OLED
panel, presumably to help with heat dissipation. The initial impedances of the panels used in the Chalina
luminaire were different depending upon the time of purchase, and a comparison of the initial impedance
values (taken at 100 Hz and 1,000 Hz) is given in Table 3-2. To facilitate this discussion, the sample
populations were designated as Gen 1, 2, and 3, depending on purchase date. It is unknown whether these
changes in impedance were the result of process changes in panel manufacturing or whether they arise from
naturally occurring process variation with time. For all devices, regardless of the purchase date, the driver used
with the Chalina luminaire remained the same part number.

Stress Testing of Organic Light-Emitting Diode Panels and Luminaires
5
Figure 3–1. View of the backside of Chalina OLED luminaires from Acuity Brands.
Table 3–2. Comparison of the initial impedance of OLED panels in the Chalina luminaire with purchase date.
Purchase Date Population ID
Initial Impedance (ohm)
@ 100 Hz
Initial Impedance (ohm)
@ 1,000 Hz
September 2015 Gen 1 2375 ± 10 248 ± 1
August 2016 Gen 2 2721 ± 30 296 ± 4
July 2017 Gen 3 2246 ± 12 237 ± 2
3.1.2 OLED Panels from OLEDWorks
OLEDWorks panels and associated drivers were purchased directly from the company, and the tested products
included the Brite 2 FL300 neutral white, Brite 2 FL300 warm white, and Brite Amber products. The neutral
white and warm white products were the recently introduced Brite 2 panels [14], whereas the amber OLED
products were the Brite Amber OLED panels introduced in May 2017 [15]. A comparison of the panel sizes
for the samples examined in this study is given in Table 3–3, and pictures of these samples are shown in
Figure 3–2.
Table 3–3. Comparison of OLED panel areas.
OLEDWorks Panel Emissive Area Overall Dimensions
Brite 2 FL300 warm white 10.3 cm x 10.3 cm 12.8 cm x 12.8 cm
Brite 2 FL300 neutral white 10.3 cm x 10.3 cm 12.8 cm x 12.8 cm
Brite Amber 2.5 cm x 8.7 cm 4.1 cm x 11.1 cm

Stress Testing of Organic Light-Emitting Diode Panels and Luminaires
6
Figure 3–2. Neutral white, warm white, and amber panels from OLEDWorks.
The measured impedance for these samples differed between the Brite 2 and Brite Amber panels, with the
latter having a significantly higher impedance as shown in Table 3-4. The higher impedance for the Brite
Amber product likely reflects the different construction. The measured impedances for the Brite 2 panels were
statistically the same for the neutral white and warm white products.
Table 3–4. Impedance of panels from OLEDWorks.
OLEDWorks Panel
Impedance (ohm)
@ 100 Hz
Impedance (ohm)
@ 1,000 Hz
Brite 2 FL300 neutral white 5,542 ± 19 565 ± 2
Brite 2 FL300 warm white 5,556 ± 43 566 ± 4
Brite Amber 12,059 ± 9 1,234± 0.1
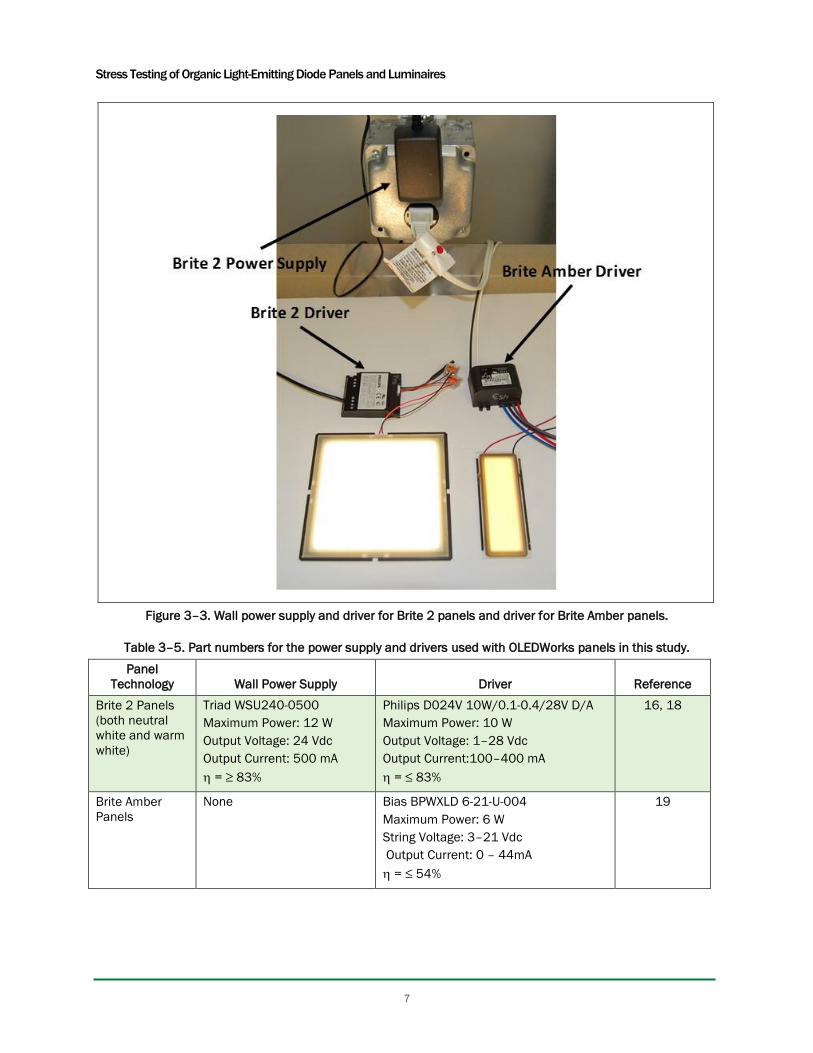
The panels from OLEDWorks used different approaches to provide the necessary voltage and current for
operation. The Brite 2 panels, which employ a 6-tandem stack structure [7], used a 24 volt driver that was
powered by a power supply providing the alternating current (ac) to direct current (dc) conversion stage. The
driver was custom-designed by Philips Lighting for OLED panels [16]. In contrast, the Brite Amber panels,
which employ a 2-tandem stack structure [7, 17], used a driver that converts electrical mains to the dc power
required to drive the panel. This driver was a stock device designed for use with inorganic LED products and
the low voltage output needed for a 2-tandem stack device. These configurations are shown in Figure 3–3 for
the Brite 2 and Brite Amber panels, and additional details on these products are provided in Table 3–5. During
stress testing exposure, the drivers were included in the test ovens with the panels, so there is a potential for
degradation in the driver.
Stress Testing of Organic Light-Emitting Diode Panels and Luminaires
7
Figure 3–3. Wall power supply and driver for Brite 2 panels and driver for Brite Amber panels.
Table 3–5. Part numbers for the power supply and drivers used with OLEDWorks panels in this study.
Panel
Technology Wall Power Supply Driver Reference
Brite 2 Panels
(both neutral
white and warm
white)
Triad WSU240-0500
Maximum Power: 12 W
Output Voltage: 24 Vdc
Output Current: 500 mA
= ≥ 83%
Philips D024V 10W/0.1-0.4/28V D/A
Maximum Power: 10 W
Output Voltage: 1–28 Vdc
Output Current:100–400 mA
= ≤ 83%
16, 18
Brite Amber
Panels
None Bias BPWXLD 6-21-U-004
Maximum Power: 6 W
String Voltage: 3–21 Vdc
Output Current: 0 – 44mA
= ≤ 54%
19
Stress Testing of Organic Light-Emitting Diode Panels and Luminaires
8
Stress Testing Methods 3.2
The 45C elevated ambient was chosen as a stress testing protocol because of its use in previous CALiPER
testing of LED products, including A19 and PAR38 lamps [20, 21]. Performance in this test environment can
provide some comparison of the performance of OLEDs to conventional LED products made from 2011 to
2013. Additional stress testing protocols were chosen to examine the behavior of the devices under lower and
higher stress levels, and further details on the findings from the higher stress exposures are given in the
CALiPER 24 report [4].
In this report, findings from five testing protocols are given:
35°C elevated ambient bake of Chalina luminaires operated at 150 mA,
35°C elevated ambient bake of OLEDWorks warm white and neutral white panels operated at 263 mA
and Brite Amber panels operated at 43 mA,
45°C elevated ambient bake of Chalina luminaires operated at 150 mA,
45°C elevated ambient bake of OLEDWorks warm white and neutral white panels operated at 263 mA
and Brite Amber panels operated 43 mA,
Operation of Chalina luminaires and OLEDWorks panels at ambient room temperature (25°C ± 2°C).
Two groups of Chalina luminaires, one with the Gen 1 and the second with Gen 3 OLED panels, were
subjected to the 45°C elevated ambient temperature (2 samples in each group); four Chalina luminaire samples
with Gen 3 panels were used in the 35°C testing; and two Chalina luminaire samples with Gen 2 panels were
used in the RTOL testing. One Chalina luminaire sample, containing Gen 1 panels, was kept as a control and
was only operated during photometric testing.
For simplicity, all devices under test (DUTs) were operated continuously during stress testing, and there was
no power cycling of the DUTs. All DUTs that were operated at the elevated ambient temperature of 45°C were
monitored thermally using chromel-alumel thermocouples multiplexed to a data acquisition module that
recorded temperature every 10 minutes. In all cases, the temperature of both the OLED panel and the driver
were monitored separately with different thermocouples. The temperatures of DUTs operated at an elevated
ambient of 35°C were monitored on a weekly basis using chromel-alumel thermocouples.
After completion of each stress test cycle, photometric measurements were performed individually on each
DUT using a calibrated 65-inch or 10-inch integrating sphere. In addition, electrical properties of luminaires
and the individual panels were checked with an Agilent handheld LCR meter (Model U1733) and Kill-A-Watt
EZ power meter. Additional power measurements were made, as necessary, using a Xitron 2802 two-channel
power analyzer.
The photometric measurement setup for each DUT model was designed to maximize lumen capture and ensure
measurement accuracy. The luminous flux from both the Chalina luminaire and the OLEDWorks white panels
were sufficient for them to be measured in a 65-inch integrating sphere. Due to the lower luminous flux of the
Brite Amber panels, we chose to measure them in a 10-inch integrating sphere. Chalina luminaires were
measured in the 65-inch integrating sphere and mounted to the center post using a secured screw and minimal
wiring. Likewise, the Chalina and OLEDWorks panels were mounted to the 65-inch sphere center post, and
each panel was secured, facing up, using a low-profile bracket that did not affect light emission. OLEDWorks
Brite Amber panels were mounted in a similar fashion in the 10-inch integrating sphere. In all cases,
integrating sphere measurements were taken using a 4 geometry with the device at the center of the sphere.
Pictures of the test configuration of the different samples in the integrating spheres are shown in Figure 3–4.

Stress Testing of Organic Light-Emitting Diode Panels and Luminaires
9
Figure 3–4. OLED devices mounted for photometric testing.
Results 4
Chalina Luminaires 4.1
As originally reported in CALiPER 24, four Chalina OLED luminaires (labeled DUTs 224–227), containing
Gen 1 OLED panels, were tested by RTI at an elevated ambient temperature of 45°C [4]. While there were
early failures in DUT-224 (≤ 250 hours) and DUT-226 (between 5,000 and 5,500 hours) due to panel shorting,
DUT-225 and DUT-227 are still in testing as of the date of this report. Two additional Chalina luminaires
(purchased July 2017) containing Gen 3 OLED panels were added to the 45°C elevated ambient test and have
now reached 2,000 hours. Thus, a total of six Chalina luminaires have been tested at the elevated ambient
temperature of 45°C. Because two luminaires have failed during the initial 45°C testing, the findings for the
four operational luminaires will be provided here as an update on the testing reported in CALiPER 24.
To provide additional insights into the performance of the Chalina luminaire and the panels from LG Display
in the luminaire, two additional tests were initiated on Chalina luminaires and are described here. First, two
luminaires (with Gen 2 panels) were continuously operated at room temperature in RTOL testing. These
luminaires have now reached over 9,000 hours of testing. Second, four Chalina luminaires (with Gen 3 panels)
were subjected to an elevated ambient temperature of 35°C, and these DUTs have now reached 2,000 hours of
exposure.
4.1.1 Photometric Measurements
The SPDs of the Chalina luminaires with Gen 2 and Gen 3 OLED panels are given in Figure B-1 and Figure
B-2 of Appendix B, respectively. The color rendition of these sources was calculated from the respective SPDs
using IES TM-30-15 [22], and the results are also included in Figure B-1 and Figure B-2. The color vector
graphic demonstrates that the Chalina luminaire with Gen 2 and Gen 3 OLED panels does a good job of
reproducing the color rendition properties of the reference source, although the OLED panels desaturate red
and orange colors. In addition, the chroma shifts produced by these light sources is generally small, often 4%
or less.
In comparing the SPD and source color rendition of the Chalina luminaires with Gen 2 and Gen 3 panels with
that reported in CALiPER 24 for Chalina luminaires with Gen 1 OLED panels [4], only minor differences can
be discerned. For the three generations of light sources, the color fidelity (Rf) and color gamut (Rg) scores are
very similar as are the CRI and R9 values. This finding indicates that the overall emission properties of the
OLED panels remained the same among the different generations of Chalina luminaires even though there
were changes in the physical appearance of the panels (see Figure 3–1) and different initial impedance values
(see Table 3–2) for three generations of products.

Stress Testing of Organic Light-Emitting Diode Panels and Luminaires
10
4.1.2 Luminous Flux Maintenance
As expected, the luminous flux maintenance of the Chalina luminaires in RTOL testing is better than that of
equivalent luminaires operated at elevated temperatures. While there is no accepted standard method to fit the
luminous flux maintenance of an OLED, a simple exponential decay is used in this report. For the RTOL
samples, the fit was started at 250 hours due to anomalous data in the initial measurement. For the rest of the
samples in this report, the fit begins with the initial measurement. The raw data for the RTOL measurements
along with an exponential fit are shown in Figure 4–1.
Figure 4–1. Luminous flux maintenance for the Chalina luminaire during continuous operation at room
temperature (in RTOL) testing and at 35°C.
Using this approach, the luminous flux of the RTOL samples can be seen to decrease by roughly 9.5% per year
when operated continuously at an ambient environment of 25°C. In contrast, the luminous flux of the samples
tested at 45°C was shown to decrease by roughly 24.5% per year in CALiPER 24 [4]. From this limited sample
set, we can calculate an acceleration factor for the 45°C test (relative to 25°C) of approximately 2.6, which
agrees with earlier studies of OLED panels operating at the same current [11]. For the DUTs operated at an
elevated ambient temperature of 35°C, there was a slight initial increase in luminous flux followed by a
decrease. Unfortunately, the 35°C measurements have not progressed a sufficient amount of time to allow a
meaningful model of the luminous flux decay to be created; however, we expect the acceleration factor to be
lower than that observed for 45°C.
Because the make-up of the two sets of Chalina luminaires in the 45°C elevated ambient test may be different,
we chose to examine the behavior of the four operational luminaires separately. In addition, DUT-225 and
DUT-227 were each removed from testing for short periods of time for maintenance reasons. For DUT-225,
this break consisted of five months due to other testing priorities, whereas for DUT-227, this hiatus consisted
of two separate breaks of five months each. Upon returning to the test population, the luminaires were
measured before continuing stress testing and showed minimal change in both the luminous flux and the rate
of luminous flux decay (see Figure 4–2 and Figure 4–3). This finding provides some insight into the stability
of the devices when not in use (e.g., in storage). Shortly after testing resumed, one panel in DUT-225 failed
due to an electrical short, which resulted in a sharp drop in luminous flux as indicated in Figure 4–2. The five-
month storage time is not believed to be responsible for panel failure in DUT-225 because it occurred after
more than 250 hours of new testing. In addition, no panel failures have been observed to date for DUT-227,
which has undergone two separate hiatuses of five-months each.
y =0. 990e-1.14E-05x
R² = 0.760E
0.5
0.6
0.7
0.8
0.9
1.0
1.1
0 2000 4000 6000 8000 10000
Lum
ino
us
Flu
x M
ain
ten
ance
HoursRTOL 35°C Expon. (RTOL)
Stress Testing of Organic Light-Emitting Diode Panels and Luminaires
11
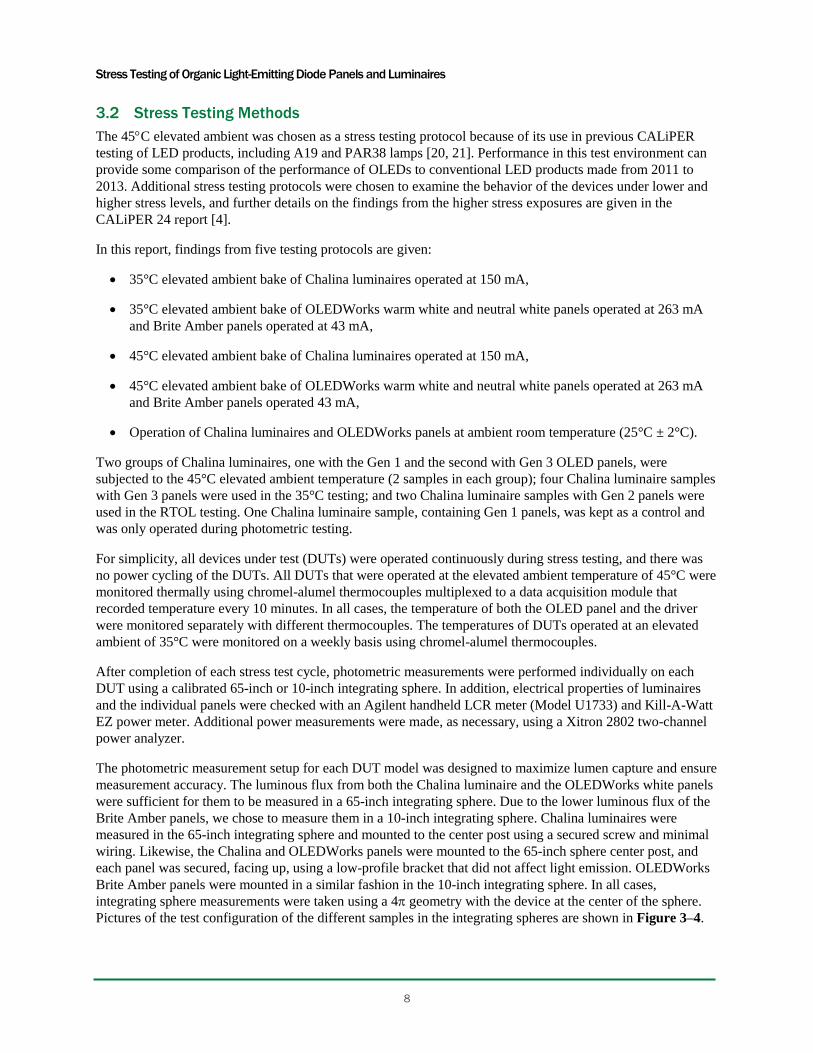
Figure 4–2. Luminous flux maintenance for DUT-225, which contains Gen 1 panels.
As shown in Figure 4–4, the luminous flux maintenance behavior of the two Chalina luminaires with Gen 3
panels in the 45°C test was very similar. Furthermore, the rates of luminous flux maintenance decay for these
samples is in approximate agreement with that found for Chalina luminaires with Gen 1 OLED panels. These
findings demonstrate that the luminous flux maintenance characteristics of the Chalina luminaires is similar
regardless of the generation of OLED panel used in the product.

Stress Testing of Organic Light-Emitting Diode Panels and Luminaires
12
Figure 4–3. Luminous flux maintenance for DUT-227, which contains Gen 1 panels.
Figure 4–4. Luminous flux maintenance for DUT-394 and DUT-395, which contain Gen 3 panels.
Stress Testing of Organic Light-Emitting Diode Panels and Luminaires
13
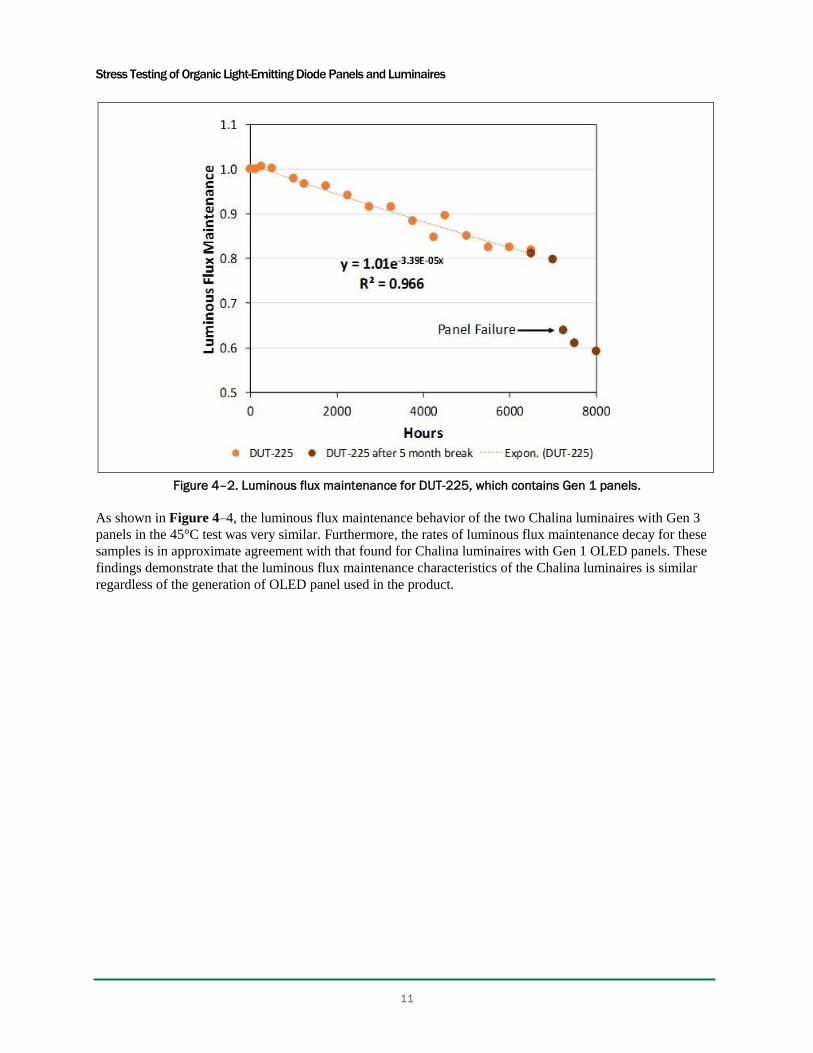
4.1.3 Chromaticity
CALiPER 24 reported that the chromaticity shift for Chalina luminaires with Gen 1 panels proceeds in the
blue-green direction during testing at an ambient environment of 45°C with both uʹ and vʹ decreasing in
roughly equal proportions [4]. Additional testing reported here found that the chromaticity shift begins to move
more in the blue direction (i.e., v decreasing much faster than u) after approximately 4,500 hours of testing as
shown in Figure 4–5.
A representative SPD of Chalina luminaires with Gen 1 OLED panels (DUT-227) is given in Figure 4–6. The
SPD can be deconvoluted into two different skewed Gaussians for each assumed emitter color (i.e., blue,
green, red), with varying levels of skew in the calculated emission peaks. Integration of the area of the two
peaks for each color provides the emission intensity for that color. By deconvoluting the SPDs measured at
each test interval, the relative emission intensities of the three colors can be compared over time as shown in
Figure 4–7. This charting can explain the observed chromaticity shift for the Chalina luminaires with Gen 1
panels through a faster reduction in emission from red and green sources while the blue emitter reduces at a
slower rate. The lower stabilities of the red and green emitters found in the Gen 1 panels are characteristic of
phosphorescent sources, which have higher initial efficiencies but lower stability than fluorescent emitters
have [22]. In contrast, the higher stability of the blue source confirms that a fluorescent emitter was used in
these samples, in agreement with the published literature [6].
Figure 4–5. Time dependence of uʹ and vʹ for Chalina luminaires with Gen 1 OLED panels
in 45°C stress testing.
While the Chalina luminaires with the Gen 1 panels exhibited a strong blue shift at 45°C elevated ambient
temperature, the same behavior was not found for Chalina luminaires with Gen 2 and Gen 3 panels. As shown
in Figure 4–5, the luminaires with Gen 2 and Gen 3 panels tended to shift in the red direction (i.e. uʹ and vʹ increasing). This finding indicates an improved thermal stability for luminaires with the Gen 2 and Gen 3
OLED panels. The chemical change responsible for the improved thermal stability changed the nature of
chromaticity shift during RTOL and stress testing but does not appear to affect the rate of lumen depreciation.
-0.008
-0.006
-0.004
-0.002
0.000
0.002
0.004
0 2000 4000 6000 8000 10000
uʹ
Time (hours)
45°C with Gen 1 OLED panels 45°C with Gen 3 OLED panels
35°C with Gen 3 OLED Panels RTOL with Gen 2 OLED Panels
-0.008
-0.006
-0.004
-0.002
0.000
0.002
0.004
0 2000 4000 6000 8000 10000
vʹ
Time (hours)
45°C with Gen 1 OLED panels 45°C with Gen 3 OLED panels
35°C with Gen 3 OLED Panels RTOL with Gen 2 OLED Panels

Stress Testing of Organic Light-Emitting Diode Panels and Luminaires
14
Figure 4–6. Deconvolution of the SPD for DUT-227 containing Gen 1 OLED panels.
Figure 4–7. Relative emission intensity over time of the three emitters used in a Chalina luminaire
with Gen 1 OLED panels.

Stress Testing of Organic Light-Emitting Diode Panels and Luminaires
15
4.1.4 Electrical Analysis
As part of the characterization of the OLED luminaires, the impedance of all fully operational OLED panels
was compared across the control (Gen 1 panel), the first samples at 45°C (Gen 1 panels stress test-exposed),
the RTOL samples (Gen 2 panel), and later samples (Gen 3 panels, both 45°C and 35°C exposed). The
impedance of each panel was measured at three frequencies—100 Hz, 1,000 Hz, and 10,000 Hz—as shown in
Table 4–1. A close inspection of the data reveals several main trends. First, the mean impedance of the panels
from luminaires subjected to the 45C elevated ambient temperature is higher than that of the control sample at
all measured frequencies, and this difference was found to be statistically significant using the t-test. In
contrast, the measured impedance of the Gen 3 samples decreased throughout the testing performed to date
(i.e., 2,000 hours) at 45°C, and this decrease is also statistically significant. A similar trend was found for the
Gen 2 panels in RTOL testing (through 9,000 hours) and the Gen 3 panels subjected to the 35°C elevated
ambient test. These data indicate that the changes in panel construction between the different generations of
OLED panels improved the stability of the device with ageing. In CALiPER 24, we estimated the driver
efficiency for these OLED luminaires as 86.8%. Using a Xitron two-channel power analyzer, measured driver
efficiencies (with Gen 1 control as the load) were found to be respectable at 83.9%.
Table 4–1. Impedance of Chalina OLED luminaires.
Frequency Panel Type 100 Hertz 1000 Hertz 10,000 Hertz
Panels from control LG Display – Gen 1 2,375 ± 10 ohms 248 ± 1 ohms 25.9 ± 0.1 ohms
Operational panels
from 45C bake (≥
6,500 hours)
LG Display – Gen 1 2,728 ± 41 ohms 289 ± 6 ohms 29.8 ± 0.6 ohms
Initial measurement
RTOL samples
LG Display – Gen 2 2,721 ± 30 ohms 296 ± 4 ohms 30.9 ± 0.4 ohms
Operational panels
from RTOL testing
(9,000 hours)
LG Display – Gen 2 2,711 ± 31 ohms 295 ± 4 ohms 30.8 ± 0.4 ohms
Initial measurements LG Display – Gen 3 2,246 ± 12 ohms 237 ± 2 ohms 25.7 ± 0.2 ohms
Operational panels
from 35°C bake
(2,000 hours)
LG Display – Gen 3 2,238 ± 11 ohms 242 ± 2 ohms 25.8 ± 0.2 ohms
Operational panels
from 45C bake
(1,500 hours)
LG Display – Gen 3 2,209.9 ± 15 ohms 244 ± 19 ohms 25.6 ± 0.1 ohms
Note: The reported uncertainties represent one standard deviation.
OLEDWorks Panels 4.2
Three models of OLED panels from OLEDWorks were investigated in this study and are described as warm
white, neutral white, and amber. Three stress testing protocols were used to examine each OLED panel model:
RTOL, 35°C elevated ambient bake, and 45°C elevated ambient bake. For each stress testing protocol, three
panels of each model were investigated. The exposure time to date for all OLEDWorks panels is 1,500 hours.
4.2.1 Photometric Analysis
The SPDs of the Brite 2 FL300 Neutral White, Brite 2 FL300 Warm White, and Brite Amber OLED panels are
given in Figure B-3, Figure B-4, and Figure B-5 of Appendix B, respectively. IES TM-30-15 was used to
calculate the color rendition of these sources from the respective SPDs measured in this work [21], and the
results are also included in Appendix B. As expected, the color rendition properties of the two white sources
Stress Testing of Organic Light-Emitting Diode Panels and Luminaires
16
demonstrate their suitability for general lighting applications, whereas the Brite Amber OLED panel is more of
a special application light source.
In comparing the SPDs of the warm white panels from OLEDWorks (Figure B-3) with those of the LG
Display panels in the Chalina luminaires, the OLEDWorks warm white panels have more intensity in the deep
red spectral region as evidenced by the presence of a small emission peak near 670 nm. As a result, the Brite 2
warm white panels were determined to have higher CRI and R9 values than the panels from LG Display did.
Consequentially, the color rendition graphic demonstrates that the Brite 2 OLED warm white source renders
red and orange colors slightly more accurately than the LG Display panels; however, the Brite 2 OLED warm
white source is slightly desaturated for green colors and oversaturated for blue and purple. These findings align
with the manufacturer’s data included in a recent DOE field study [3] and confirm the improved color
rendition of the Brite 2 panels compared to the Brite 1 panels.
The SPD of the Brite 2 neutral white panel suggests that it uses the same emitters as the warm white product;
however, the relative concentrations of the emitters have changed to achieve a different CCT value. Brite 2
neutral white OLED panels also provide good color rendering at a higher CCT value. The color vector graphic
demonstrates that the source accurately renders red and orange colors, but there is more desaturation of green
than found with the warm white source.
The SPD of the Brite Amber product confirms that it is a mix of green and red emitters [17], and these sources
appear to be very similar to those used in the warm white and neutral white products. As is to be expected from
such a light source targeting a specific application (e.g., melanoptic lighting), the overall color rendition
properties are poor with both Rf and Rg values of 35 and 33, respectively. Ironically, the CRI of this source is
79 and the R9 value is 10, which would make this source acceptable for some general lighting applications if
only these two metrics were used. However, the color vector graphics demonstrate that this light source
severely desaturates most colors, as would be expected from the absence of a blue emitter. Consequently, this
light source is best suited for its intended application in melanoptic lighting.
4.2.2 Luminous Flux Maintenance
Through 1,500 hours of exposure to three different stress testing protocols, the average luminous flux
maintenance for neutral white panels remains above 96%. Three samples were used for each OLED color (e.g.,
neutral white, warm white, and amber) in each test condition. The average luminous flux maintenance across
the stress testing protocols remains very similar, except at 250 hours when the panels at room temperature
(RT) experienced an increase in luminous flux maintenance due to burn-in, as shown in Figure 4–8. All panels
started to experience a steady decrease in luminous flux after 500 hours.

Stress Testing of Organic Light-Emitting Diode Panels and Luminaires
17
Figure 4–8. Average luminous flux maintenance for neutral white panels.
The average luminous flux maintenance for warm white panels also remained above 95% through 1,500 hours
of exposure to the three different testing protocols as shown in Figure 4–9. This level of lumen depreciation in
the first 1,500 hours of testing is comparable to that found for the LG Display panels used in the Chalina
luminaires. An increase in luminous flux was also seen for the warm white panels operated at RT for 250
hours. After 250 hours, the average luminous flux maintenance in neutral white panels for all testing protocols
decreased, with the largest change occurring among the panels subjected to the 45°C bake. It is anticipated that
the luminous flux of the panels tested at 45°C will continue to decay at a faster rate than those at less
aggressive stress testing protocols. However, additional data is needed before a meaningful projection can be
made.
By 1,500 hours, the luminous flux maintenance of six Brite Amber panels remains above 95%; these panels
were subjected to the RT and 35°C bake testing protocols. The three amber panels operated at RT had an
average luminous flux maintenance above 1.0 through 1,000 hours (Figure 4–10), while the three panels
operated at 35°C and 45°C had an average luminous flux maintenance above 1.0 through 500 and 250 hours,
respectively. As mentioned, there were three panel failures in the samples subjected to the 45°C elevated
ambient test that resulted in no light emission by 1,500 hours. The exact time to failure for each device is given
in Table 4–2. As such, at 1,000 hours, the average luminous flux maintenance for the 45°C bake includes only
the two operational panels. Of the two operational panels, one experienced a drastic reduction in luminous flux
maintenance (67.8%) at 1,000 hours, accounting for the sharp decrease in average luminous flux maintenance
for the 45°C bake panels. All three panels in the 45°C tests had failed by 1,500 hours.
0.80
0.85
0.90
0.95
1.00
1.05
1.10
0 500 1000 1500 2000
Lum
ino
us
Flu
x M
ain
ten
ance
Time (Hr)
RT 35°C 45°C

Stress Testing of Organic Light-Emitting Diode Panels and Luminaires
18
Figure 4–9. Average luminous flux maintenance for warm white panels.
Figure 4–10. Average luminous flux maintenance for amber panels.
4.2.3 Chromaticity
Chromaticity shift for the neutral white and warm white panels remains subtle at 1,500 hours as shown in
Figure 4–11 and Figure 4–12, respectively. Neutral white panels experienced a small chromaticity shift in the
green-yellow direction, with greater tendency toward yellow for the 45°C bake samples (Figure 4–11). There
was no clear trend for the chromaticity shift in the warm white panels (Figure 4–12). Furthermore, the average
chromaticity shift for the warm white panels was less than one step, and therefore, it is expected that the
0.80
0.85
0.90
0.95
1.00
1.05
1.10
0 500 1000 1500 2000
Lum
ino
us
Flu
x M
ain
ten
ance
Time (Hr)
RT 35°C 45°C
0.80
0.85
0.90
0.95
1.00
1.05
1.10
0 500 1000 1500 2000
Lum
ino
us
Flu
x M
ain
ten
ance
Time (Hr)
RT 35°C 45°C

Stress Testing of Organic Light-Emitting Diode Panels and Luminaires
19
fluctuations in chromaticity are mostly due to the experimental variation. Further testing is needed to
determine the long-term chromaticity behavior for these panels.
The Brite Amber panels experienced the largest chromaticity shift of the tested OLEDWorks panels:
approximately two steps in the red direction with uʹ increasing much faster than vʹ decreases (Figure 4–13). To
better understand this behavior, a component analysis of the emission spectra was performed. The Brite Amber
panels use a 2-tandem stack phosphorescent OLED structure with two mixed red and green phosphorescent
emitters [17]. In our spectral analysis of the Brite Amber panels, the red and green emitters were fit with
skewed Gaussians, and a linear least squares regression was performed to estimate their individual contribution
to the overall emission spectrum as shown in Figure 4–14. The red emitter was estimated as a sum of two
skewed Gaussians due to its broader peak shape at lower energy (without knowing the identity of the red
emitter, this fit serves to best estimate the spectrum of the red emitter). The intensities of the red and green
emitters of the amber panel subjected to stress testing were then compared to the respective intensities of the
red and green emitters from the control panel, allowing the deduction of the relative emission intensity over
time for both red and green emitters. From this analysis, there is strong evidence to support that the red color
shift of the amber panels is caused by a greater stability period of the red emitters relative to the green emitter
during the test period.
Figure 4–11. Chromaticity diagram for neutral white panels.
-0.002
-0.001
0.000
0.001
0.002
-0.002 -0.001 0.000 0.001 0.002
Δv'
Δu'RTOL 35°C (Average) 45°C (Average)
+v(yellow)
-v(blue)
+u(red)-u(green)
General Shift Direction
Stress Testing of Organic Light-Emitting Diode Panels and Luminaires
20
Figure 4–12. Chromaticity diagram for warm white panels.
Figure 4–13. Chromaticity diagram for amber panels.
-0.002
-0.001
0.000
0.001
0.002
-0.002 -0.001 0.000 0.001 0.002
Δv'
Δu'
RTOL 35°C (Average) 45°C (Average)
+v(yellow)
-v(blue)
+u(red)-u(green)
-0.002
-0.001
0.000
0.001
0.002
-0.002 -0.001 0.000 0.001 0.002
Δv'
Δu'RTOL 35°C (Average) 45°C (Average)
+v(yellow)
-v(blue)
+u(red)-u(green)
General Shift Direction

Stress Testing of Organic Light-Emitting Diode Panels and Luminaires
21
Figure 4–14. Emission spectra modeling for red and green components relative to the control sample over
1,500 hours.
4.2.4 Electrical Analysis
4.2.4.1 Neutral White
As of 1,500 hours, all neutral white panels remain in good operating condition. Electrical analysis of the
average power consumed by the test panels at the end of each testing cycle revealed an increase in power
consumption for all testing protocols (Figure 4–15). OLED panels are known to have an increase in power
consumption as they age due to the increase in the voltage needed to maintain constant current across the panel
as the OLEDs degrade [4]. The greatest increase in power consumption is observed for the most aggressive
testing protocol (45°C), indicating that the greatest progression of OLED ageing had occurred in the panels
operated at 45°C. In addition, a larger variation in panel power consumption (measured by the standard
deviation) as time progresses is observed for all testing protocols, which is consistent with ageing of the
panels.
Impedance values were recorded for each panel at the conclusion of each testing cycle to provide further
characterization of the neutral white panels. The impedance was measured at three frequencies: 100 Hz, 1 kHz,
and 10 kHz. The average impedance (measured at 1 kHz) was calculated for each testing protocol at the
conclusion of each cycle as shown in Figure 4–16. Temporal examination of the average neutral white panel
impedances shows an increase in impedance across all testing conditions. This finding supports the increase in
power consumption observed for the panels; further evidence to support this claim is contained in the fact that
the most aggressive testing conditions (45°C) also result in the greatest relative increase in impedance (i.e., the
largest slope in the linear least squares fit). Interestingly, the standard deviation of panel impedance values did
not vary significantly with time.
Stress Testing of Organic Light-Emitting Diode Panels and Luminaires
22
Figure 4–15. Average power consumption of neutral white panels in each testing condition (35°C, 45°C, and
RT) show a greater increase in power consumption for more aggressive conditions (A) and an increase in
standard deviation with ageing (B).
Figure 4–16. Average impedance of neutral white panels in each testing condition (35°C, 45°C, and RT) show
a greater increase in impedance for more aggressive conditions (A) and an increase in standard deviation with
ageing (B).
4.2.4.2 Warm White
All warm white panels remain in operation after 1,500 hours of testing; however, two of the RTOL panels have
black spots where emission should occur (Figure 4–17). Warm white panels exhibited some of the same
electrical characteristics as the neutral white panels. For instance, an average increase in power consumption
was observed across panels in all testing protocols (Figure 4–18). There is also an increase in the variance of
panel power consumption relative to the zero-time point, indicative of OLED ageing. In contrast to the neutral
white panels, the warm white panels exhibit more fluctuation in power consumption and do not explicitly
exhibit greater power consumption with more aggressive stress testing protocols. The panels that are operated
at 45°C have the largest increase in power consumption, but the power consumption increase for the RTOL
devices is higher than the power consumption increase for the panels operated at 35°C. This counterintuitive
result could stem from the limited number of data points collected to date. Alternatively, the difference could
be due to differing driver ability to supply constant current to the warm white panels compared to the neutral
white panels (both panels use the same driver). More testing is needed to understand these differences.
y = (1.2x10-04)t + 7.8R² = 0.64
y = (1.9x10-04)t + 7.8R² = 0.84y = (2.4x10-04)t + 7.8
R² = 0.95
7.0
7.5
8.0
8.5
0 500 1000 1500 2000
Po
wer
(W
)
Time (Hr)
RT 35°C 45°C
7.0
7.5
8.0
8.5
0 500 1000 1500 2000
Po
wer
(W
)
Time (Hr)
RT 35°C 45°C
y = (3.2x10-04)t + 570R² = 0.99
y = (4.3x10-04)t + 569R² = 0.84
y = (8.5x10-04)t + 566R² = 1.00
560
565
570
575
0 500 1000 1500 2000
Imp
edan
ce a
t 10
00 H
z (o
hm
s)
Time (Hr)
RT 35°C 45°C
560
565
570
575
0 500 1000 1500 2000
Imp
edan
ce a
t 10
00 H
z (o
hm
s)
Time (Hr)
RT 35°C 45°C
(A) (B)
(A) (B)

Stress Testing of Organic Light-Emitting Diode Panels and Luminaires
23
Figure 4–17. Black spot on warm white panel in RTOL testing.
The average impedance (measured at 1 kHz) of the warm white panels operated at each testing protocol is
shown in Figure 4–19. Temporal examination of the average impedances shows an increase in impedance
across all testing conditions, with the more aggressive stress testing conditions (45°C and 35°C) having a
greater relative increase in impedance compared to the RTOL panels. Similar to the neutral white panels, the
measured standard deviation in warm white panel impedances did not vary significantly with time. However,
the standard deviation of the both the power consumed and impedance at 1 kHz was greater for the warm white
samples compared to the neutral white samples.
Figure 4–18. Average power consumption of warm white panels in each testing condition (35°C, 45°C, and
RT) show a greater increase in power consumption for more aggressive conditions (A) and an increase in
standard deviation with ageing (B).
y = (1.9x10-04)t + 7.6R² = 0.69
y = (1.1x10-05)t + 7.6R² = 0.01
y = (3.1x10-04)t + 7.7R² = 0.75
7.0
7.5
8.0
8.5
0 500 1000 1500 2000
Po
we
r (W
)
Time (Hr)
RT 35°C 45°C
7.0
7.5
8.0
8.5
0 500 1000 1500 2000
Po
wer
(W
)
Time (Hr)
RT 35°C 45°C
(A) (B)
Stress Testing of Organic Light-Emitting Diode Panels and Luminaires
24
Figure 4–19. Average impedance of warm white panels in each testing condition (35°C, 45°C, and RT) show a
greater increase in impedance for more aggressive conditions (A) and an increase in standard deviation with
ageing (B).
4.2.4.3 Amber
As of 1,500 hours, the Brite Amber panels in the RTOL and 35°C bake testing protocols are still operational,
but the Brite Amber panels at the most aggressive stress testing protocol (45°C bake) failed abruptly before
this time. The precise failure time of an OLED panel can be captured through temporal thermal monitoring of
the panel and its driver. Under normal operating conditions, lamps equilibrate to a maximum operating
temperature in the elevated ambient temperature oven within a few hours. Once the equilibrium temperature
has been reached, the temperature of the lamp remains constant unless an external force acts upon the lamp or
the lamp experiences an internal change. Because the amber panels and drivers were maintained in a constant
temperature environment during testing, any abrupt changes in temperature beyond the warm-up period are
indicative of a change on the panel or driver. Furthermore, a shorting failure of a panel is often marked by a
sharp increase in driver temperature accompanied by an abrupt decrease in panel temperature as shown in
Figure 4–20. Using the thermocouple data collected every 10 minutes, time to failure during the 45°C elevated
ambient test was determined and tabulated for the three failed panels in Table 4-2.
Table 4–2. Time to failure for the amber panels operated during a 45°C elevated ambient test.
Amber Panel # Time to Failure (Hours)
1 845.4
2 1384.8
3 1451.8
y = (3.9x10-05)t +566R² = 0.12
y = (2.2x10-04)t + 561R² = 0.86
y = (7.7x10-04)t + 567R² = 0.96
555
560
565
570
575
0 500 1000 1500 2000
Imp
edan
ce a
t 1
00
0 H
z (o
hm
s)
Time (Hr)
RT 35°C 45°C
555
560
565
570
575
0 500 1000 1500 2000
Imp
edan
ce a
t 10
00 H
z (o
hm
s)
Time (Hr)
RT 35°C 45°C
(A) (B)
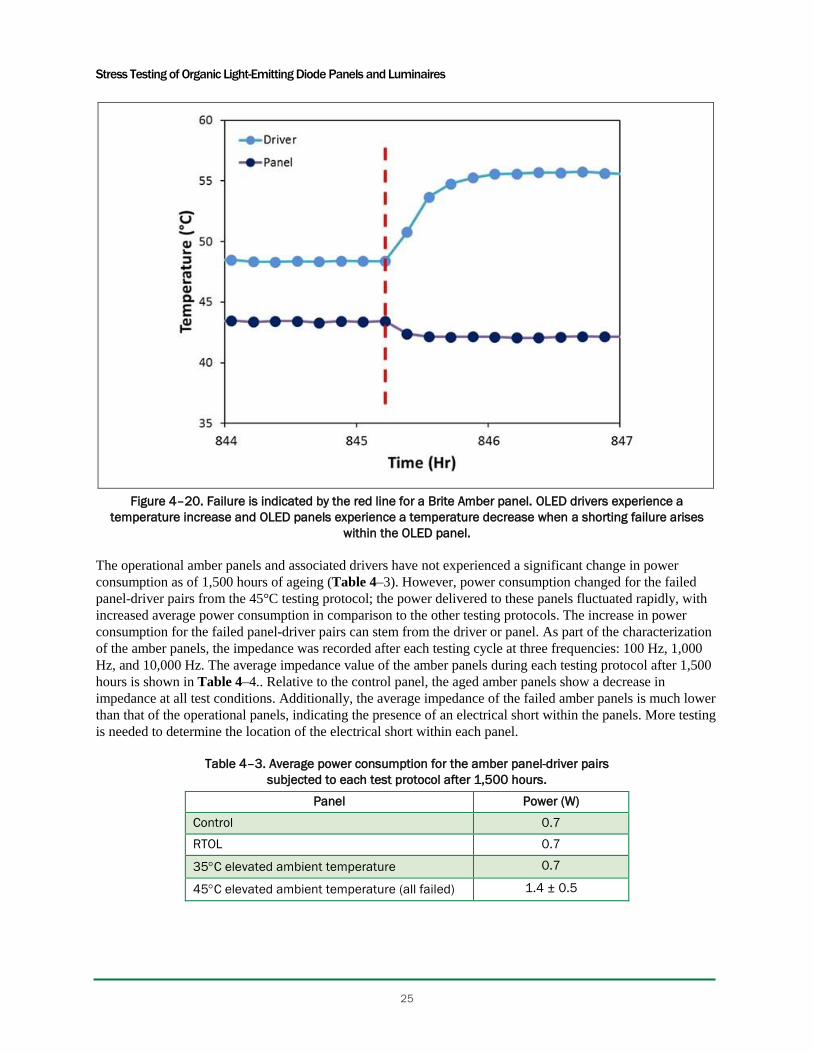
Stress Testing of Organic Light-Emitting Diode Panels and Luminaires
25
Figure 4–20. Failure is indicated by the red line for a Brite Amber panel. OLED drivers experience a
temperature increase and OLED panels experience a temperature decrease when a shorting failure arises
within the OLED panel.
The operational amber panels and associated drivers have not experienced a significant change in power
consumption as of 1,500 hours of ageing (Table 4–3). However, power consumption changed for the failed
panel-driver pairs from the 45°C testing protocol; the power delivered to these panels fluctuated rapidly, with
increased average power consumption in comparison to the other testing protocols. The increase in power
consumption for the failed panel-driver pairs can stem from the driver or panel. As part of the characterization
of the amber panels, the impedance was recorded after each testing cycle at three frequencies: 100 Hz, 1,000
Hz, and 10,000 Hz. The average impedance value of the amber panels during each testing protocol after 1,500
hours is shown in Table 4–4.. Relative to the control panel, the aged amber panels show a decrease in
impedance at all test conditions. Additionally, the average impedance of the failed amber panels is much lower
than that of the operational panels, indicating the presence of an electrical short within the panels. More testing
is needed to determine the location of the electrical short within each panel.
Table 4–3. Average power consumption for the amber panel-driver pairs
subjected to each test protocol after 1,500 hours.
Panel Power (W)
Control 0.7
RTOL 0.7
35C elevated ambient temperature 0.7
45C elevated ambient temperature (all failed) 1.4 ± 0.5
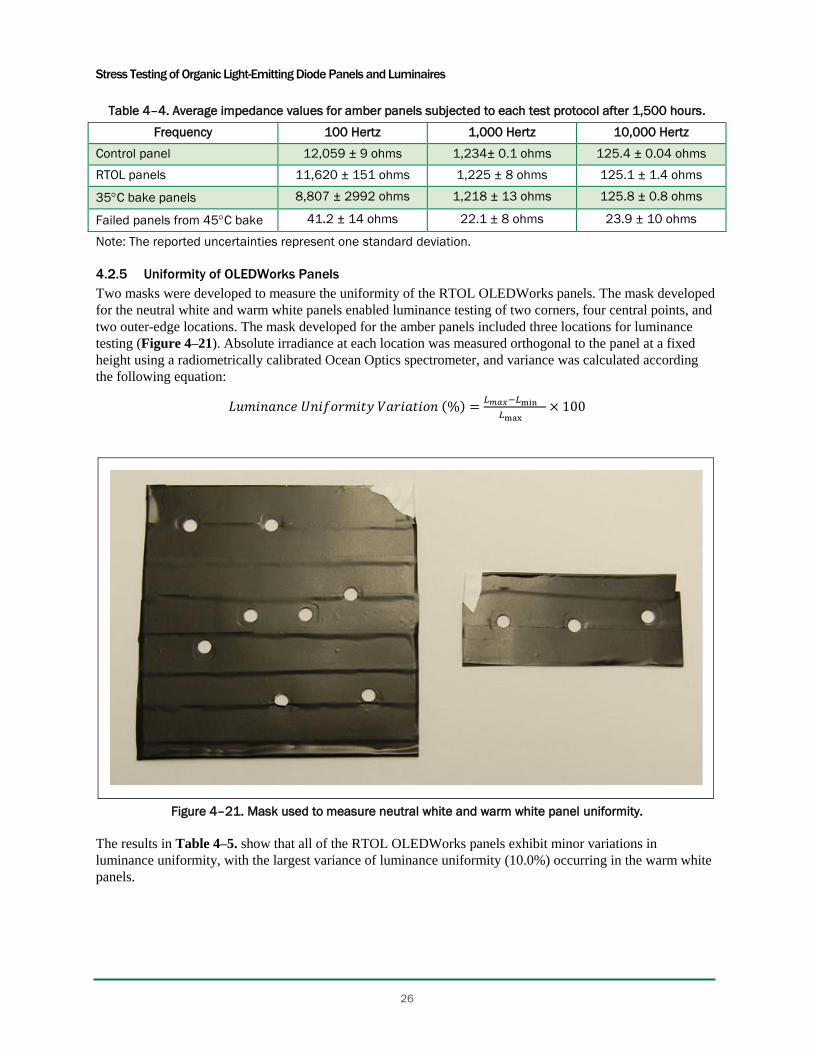
Stress Testing of Organic Light-Emitting Diode Panels and Luminaires
26
Table 4–4. Average impedance values for amber panels subjected to each test protocol after 1,500 hours.
Frequency 100 Hertz 1,000 Hertz 10,000 Hertz
Control panel 12,059 ± 9 ohms 1,234± 0.1 ohms 125.4 ± 0.04 ohms
RTOL panels 11,620 ± 151 ohms 1,225 ± 8 ohms 125.1 ± 1.4 ohms
35C bake panels 8,807 ± 2992 ohms 1,218 ± 13 ohms 125.8 ± 0.8 ohms
Failed panels from 45C bake 41.2 ± 14 ohms 22.1 ± 8 ohms 23.9 ± 10 ohms
Note: The reported uncertainties represent one standard deviation.
4.2.5 Uniformity of OLEDWorks Panels
Two masks were developed to measure the uniformity of the RTOL OLEDWorks panels. The mask developed
for the neutral white and warm white panels enabled luminance testing of two corners, four central points, and
two outer-edge locations. The mask developed for the amber panels included three locations for luminance
testing (Figure 4–21). Absolute irradiance at each location was measured orthogonal to the panel at a fixed
height using a radiometrically calibrated Ocean Optics spectrometer, and variance was calculated according
the following equation:
𝐿𝑢𝑚𝑖𝑛𝑎𝑛𝑐𝑒 𝑈𝑛𝑖𝑓𝑜𝑟𝑚𝑖𝑡𝑦 𝑉𝑎𝑟𝑖𝑎𝑡𝑖𝑜𝑛 (%) =𝐿𝑚𝑎𝑥−𝐿min
𝐿max× 100
Figure 4–21. Mask used to measure neutral white and warm white panel uniformity.
The results in Table 4–5. show that all of the RTOL OLEDWorks panels exhibit minor variations in
luminance uniformity, with the largest variance of luminance uniformity (10.0%) occurring in the warm white
panels.
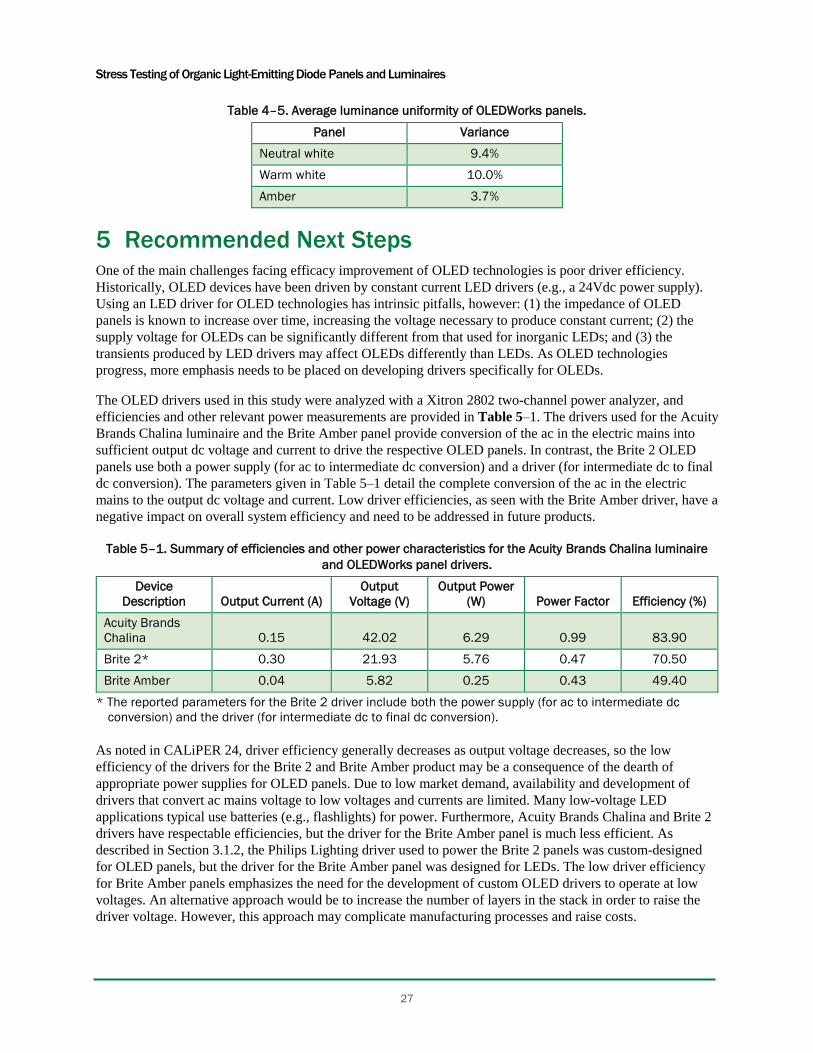
Stress Testing of Organic Light-Emitting Diode Panels and Luminaires
27
Table 4–5. Average luminance uniformity of OLEDWorks panels.
Panel Variance
Neutral white 9.4%
Warm white 10.0%
Amber 3.7%
Recommended Next Steps 5One of the main challenges facing efficacy improvement of OLED technologies is poor driver efficiency.
Historically, OLED devices have been driven by constant current LED drivers (e.g., a 24Vdc power supply).
Using an LED driver for OLED technologies has intrinsic pitfalls, however: (1) the impedance of OLED
panels is known to increase over time, increasing the voltage necessary to produce constant current; (2) the
supply voltage for OLEDs can be significantly different from that used for inorganic LEDs; and (3) the
transients produced by LED drivers may affect OLEDs differently than LEDs. As OLED technologies
progress, more emphasis needs to be placed on developing drivers specifically for OLEDs.
The OLED drivers used in this study were analyzed with a Xitron 2802 two-channel power analyzer, and
efficiencies and other relevant power measurements are provided in Table 5–1. The drivers used for the Acuity
Brands Chalina luminaire and the Brite Amber panel provide conversion of the ac in the electric mains into
sufficient output dc voltage and current to drive the respective OLED panels. In contrast, the Brite 2 OLED
panels use both a power supply (for ac to intermediate dc conversion) and a driver (for intermediate dc to final
dc conversion). The parameters given in Table 5–1 detail the complete conversion of the ac in the electric
mains to the output dc voltage and current. Low driver efficiencies, as seen with the Brite Amber driver, have a
negative impact on overall system efficiency and need to be addressed in future products.
Table 5–1. Summary of efficiencies and other power characteristics for the Acuity Brands Chalina luminaire
and OLEDWorks panel drivers.
Device
Description Output Current (A)
Output
Voltage (V)
Output Power
(W) Power Factor Efficiency (%)
Acuity Brands
Chalina 0.15 42.02 6.29 0.99 83.90
Brite 2* 0.30 21.93 5.76 0.47 70.50
Brite Amber 0.04 5.82 0.25 0.43 49.40
* The reported parameters for the Brite 2 driver include both the power supply (for ac to intermediate dc
conversion) and the driver (for intermediate dc to final dc conversion).
As noted in CALiPER 24, driver efficiency generally decreases as output voltage decreases, so the low
efficiency of the drivers for the Brite 2 and Brite Amber product may be a consequence of the dearth of
appropriate power supplies for OLED panels. Due to low market demand, availability and development of
drivers that convert ac mains voltage to low voltages and currents are limited. Many low-voltage LED
applications typical use batteries (e.g., flashlights) for power. Furthermore, Acuity Brands Chalina and Brite 2
drivers have respectable efficiencies, but the driver for the Brite Amber panel is much less efficient. As
described in Section 3.1.2, the Philips Lighting driver used to power the Brite 2 panels was custom-designed
for OLED panels, but the driver for the Brite Amber panel was designed for LEDs. The low driver efficiency
for Brite Amber panels emphasizes the need for the development of custom OLED drivers to operate at low
voltages. An alternative approach would be to increase the number of layers in the stack in order to raise the
driver voltage. However, this approach may complicate manufacturing processes and raise costs.
Stress Testing of Organic Light-Emitting Diode Panels and Luminaires
28
The OLED panel and driver are coupled together in the OLED lighting system. Consequently, the performance
of one may affect the performance of the other. Results from CALiPER 24 suggested that failure of too many
OLED panels may cause the driver to operate outside its intended design voltage, which may adversely affect
reliability [4]. In addition, because the three Brite Amber failures at 45°C testing occurred while the panels
were operating near the lower voltage of the driver, it cannot be ruled out that the driver played a role in device
failure. Future work is needed to evaluate whether the Brite Amber driver contributed to the electrical shorting
within the panel.
The OLED panels evaluated in this study show improvements over previous DOE benchmarks [2–5]. The
thermal stability of the OLED panels from LG Display that are used in the Chalina luminaires are more stable
and do not exhibit the rapid blue color shift previously observed [4]. While this change along with an increase
in the stability of device impedance are needed technical advances, additional work is also needed to raise the
luminous efficacy of the panel to values measured in laboratory testing. Likewise, the Brite 2 OLED panel has
significantly improved luminous efficacy and color properties over the Brite 1 panels benchmarked in previous
DOE studies. Additional improvements in luminous efficacy, driver performance, and overall system
efficiency are needed.
This report is the latest in a series of reports from DOE on OLED performance. We anticipate providing an
update on this testing when the devices have reached approximately one year of laboratory testing.

Stress Testing of Organic Light-Emitting Diode Panels and Luminaires
29
References 1. Brodrick, J. ed. (2017). Solid-State Lighting: 2017 Suggest Research Topics Supplement: Technology and
Market Context. Washington, D.C.: DOE. Available from https://energy.gov/eere/ssl/technology-
roadmaps.
2. Miller, N.J.(2016, March). OLED Lighting in the Offices of Aurora Lighting Design, Inc. Report Number
PNNL-SA-25337. Washington, D.C.: DOE. Available from https://energy.gov/eere/ssl/oled-studies.
3. Miller, N.J. (2017). OLED Lighting in the Offices of DeJoy, Knauf & Blood, LLP. Report Number PNNL-
SA-26642. Washington, D.C.: DOE. Available from https://energy.gov/eere/ssl/oled-studies.
4. Miller, N.J., F.A. Leon, and J.L. Davis. (2016). CALiPER Report 24: Photometric Testing, Laboratory
Teardowns, and Accelerated Lifetime Testing of OLED Luminaires. Report Number PNNL-SA-25932-
Sup1. Washington, D.C.: DOE. Available from https://energy.gov/eere/ssl/oled-studies.
5. Miller, N J. and F.A. Leon. (2016) OLED Lighting Products: Capabilities, Challenges, Potential. Report
Number PNNL-SA-25479. Washington, D.C.: DOE. Available from https://energy.gov/eere/ssl/oled-
studies.
6. Jang, S. Y. Lee, M.C. Park. (2015). “OLED Lighting for General Lighting Applications.” SID Symposium
Digest of Technical Papers; (46) p. 661. doi: 10.1002/sdtp.10246.
7. Spindler, J., M. Kondakova, M. Boroson, J. Hammer, V. Gohri, M. Buchel, M. Ruske, and E.
Meulenkamp. (2016). “High Brightness OLED Lighting.” SID Symposium Digest of Technical Papers
(47). doi: 10.1002/sdtp.10647.
8. Davis, J.L. and K. Mills. (2017). System Reliability Model for Solid-State Lighting (SSL) Luminaires.
Final report of DOE project DE-EE0005124. Washington, D.C.: DOE.
9. Next Generation Lighting Industry Alliance and LED Systems Reliability Consortium. 2014, September.
LED Luminaire Lifetime: Recommendations for Testing and Reporting, prepared for the U.S. Department
of Energy, Washington, D.C. Available from
https://energy.gov/sites/prod/files/2015/01/f19/led_luminaire_lifetime_guide_sept2014.pdf.
10. Davis, J.L., K. Rountree, and K. Mills. 2017. Reliability of Lighting Systems: How Inorganic LEDs can
Inform OLEDs. OLED Stakeholders Meeting. Minneapolis, MN 2017.
11. Yoshioka, T., K. Suginoto, K. Katagi, Y. Kitago, M. Tajima, S. Miyaguchi, T. Tsutsui, R. Iwasaki, and Y.
Furukawa. (2014). “An Improved Method for Lifetime Prediction Based on Decoupling of the Joule Self-
heating Effect from Coulombic Degradation in Accelerated Aging Tests of OLEDs.” SID 2014 Digest of
Technical Papers p. 642 – 645.
12. Kim. D.W. H. Oh, B.D. Youn, D. Kwon. (2017). “Bivariate Lifetime Model for Organic Light-emitting
Diodes. IEEE Transactions on Industrial Electronics, (64:3) pp. 2325 – 2334.
13. “Acuity Develops OLED Luminaire with Panel-integrated Drivers and Advanced Controls,” (2017). U.S.
Department of Energy, Washington, D.C.: DOE. Available from https://energy.gov/eere/ssl/acuity-
develops-oled-luminaire-panel-integrated-drivers-and-advanced-controls.
14. OLEDWorks (2016, October). “OLEDWorks Announces Availability of the Newest Addition to the
Lumiblade Portfolio.” OLEDWorks (website). Available from

Stress Testing of Organic Light-Emitting Diode Panels and Luminaires
30
https://www.oledworks.com/news/oledworks-announces-availability-of-the-newest-addition-to-the-
lumiblade-portfolio/.
15. OLEDWorks. (2017) “OLEDWords Introduces Brite Amber OLED Panel.” OLEDWorks (website).
Available from https://www.oledworks.com/news/oledworks-introduces-brite-amber-oled-panel/.
16. Philips Lighting. (2017, November). Lumiblade OLED Driver – Low Voltage (specification sheet).
Available from http://www.assets.lighting.philips.com/is/content/PhilipsLighting/fp925400010101-pss-
global.
17. Lee, D. J. Spindler, M. Kondakova, A. Pleten, M. Boroson. (2017). “Amber OLED Lighting Technology
Development and Application.” SID 2017 Digest pp. 91-94.
18. Triad Magnetics. (2017, January). Wall Plug-in Power Supply WSU240-0500 (specification sheet).
Available from http://catalog.triadmagnetics.com/Asset/WSU240-0500-R.pdf.
19. Cita Technologies. (2017, March). BPWXLD 6-21U-004: 6 Watt 44 mA LED Driver (specification
sheet). Available from http://citapower.com/wp-content/uploads/BPWXLD-6-21U-004-DS1.2.pdf.
20. Pacific Northwest National Laboratory. (2014, December.) CALiPER Report 3.2: Lumen and Chromaticity
Maintenance of LED A Lamps Operated in Steady-State Conditions (prepared for the U.S. Department of
Energy, Report Number PNNL-SA-23984). Washington, D.C.: DOE.
21. Davis, J.L., J. Young, and M. Royer. 2016, February. CALiPER Report 20.5: Chromaticity Shift Modes of
LED PAR38 Lamps Operated in Steady-State Conditions (prepared for the U.S. Department of Energy,
Report Number PNNL-25201). Washington, D.C.: DOE.
22. IES. TM-30-15: IES Method for Evaluating Color Source Rendition. (2015). New York, NY: IES.
23. Bobashev, G., N. Baldasaro, K. Mills, and J.L. Davis. 2016. “An Efficiency Decay Model for Lumen
Maintenance.” IEEE Transactions on Device and Materials Reliability (16:3); pp. 277-281. doi:
10.1109/TDMR.2016.2584926.
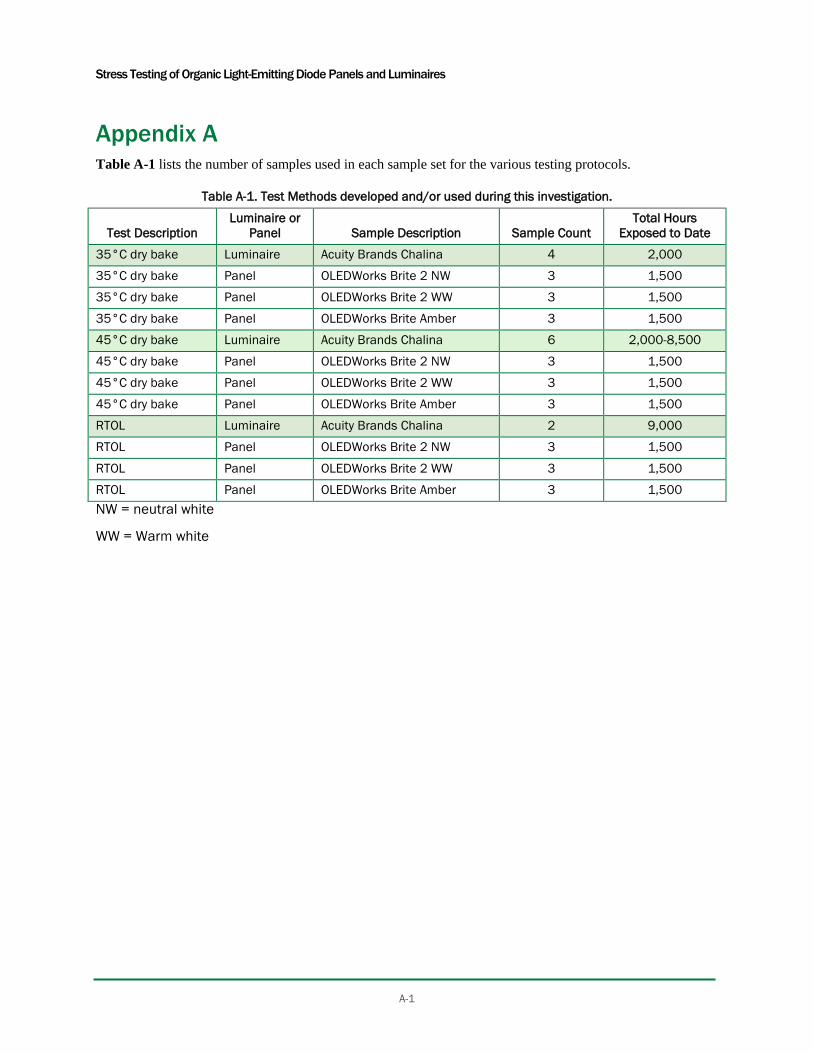
Stress Testing of Organic Light-Emitting Diode Panels and Luminaires
A-1
Appendix A Table A-1 lists the number of samples used in each sample set for the various testing protocols.
Table A-1. Test Methods developed and/or used during this investigation.
Test Description
Luminaire or
Panel Sample Description Sample Count
Total Hours
Exposed to Date
35°C dry bake Luminaire Acuity Brands Chalina 4 2,000
35°C dry bake Panel OLEDWorks Brite 2 NW 3 1,500
35°C dry bake Panel OLEDWorks Brite 2 WW 3 1,500
35°C dry bake Panel OLEDWorks Brite Amber 3 1,500
45°C dry bake Luminaire Acuity Brands Chalina 6 2,000-8,500
45°C dry bake Panel OLEDWorks Brite 2 NW 3 1,500
45°C dry bake Panel OLEDWorks Brite 2 WW 3 1,500
45°C dry bake Panel OLEDWorks Brite Amber 3 1,500
RTOL Luminaire Acuity Brands Chalina 2 9,000
RTOL Panel OLEDWorks Brite 2 NW 3 1,500
RTOL Panel OLEDWorks Brite 2 WW 3 1,500
RTOL Panel OLEDWorks Brite Amber 3 1,500
NW = neutral white
WW = Warm white
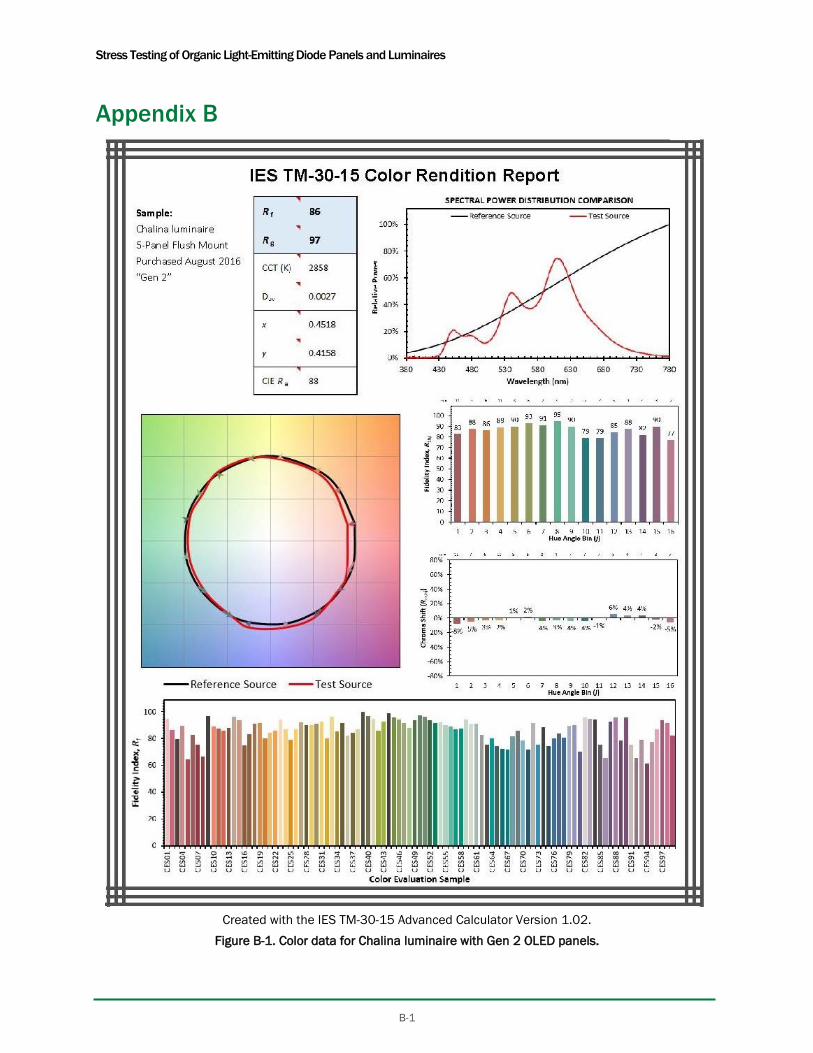
Stress Testing of Organic Light-Emitting Diode Panels and Luminaires
B-1
Appendix B
Created with the IES TM-30-15 Advanced Calculator Version 1.02.
Figure B-1. Color data for Chalina luminaire with Gen 2 OLED panels.

Stress Testing of Organic Light-Emitting Diode Panels and Luminaires
B-2
Created with the IES TM-30-15 Advanced Calculator Version 1.02.
Figure B-2. Color data for Chalina luminaire with Gen 3 OLED panels.

Stress Testing of Organic Light-Emitting Diode Panels and Luminaires
B-3
Created with the IES TM-30-15 Advanced Calculator Version 1.02.
Figure B-3. Color rendition data for OLEDWorks Brite 2 FL300 neutral white panels.

Stress Testing of Organic Light-Emitting Diode Panels and Luminaires
B-4
Created with the IES TM-30-15 Advanced Calculator Version 1.02.
Figure B-4. Color rendition data for OLEDWorks Brite 2 FL300 warm white panels.

Stress Testing of Organic Light-Emitting Diode Panels and Luminaires
B-5
Created with the IES TM-30-15 Advanced Calculator Version 1.02.
Figure B-5. Color rendition data for OLEDWorks Brite Amber panels.

DOE/EE-1748 ▪ January 2018
For more information, visit:
energy.gov/eere/ssl/solid-state-lighting