life tables and insurance applications · • he also published in the journal of the institute of...
TRANSCRIPT

Mortality in Australia: Marking the 150th Anniversary of the
First Australian Life Table
13 November 2017, Melbourne Town Hall
Life Tables and Insurance Applications
Michael Sherris
Professor of Actuarial Studies,
School of Risk and Actuarial Studies,
UNSW Sydney
Chief Investigator, CEPAR

Early Life Table Insurance Applications
• In the early third century, Roman Praetorian
prefect Aemilius Macer and praetorian prefect
Domitius Ulpianus (Ulpian) constructed life
tables used as an annuities table for
determining tax based on age and the annuity
value.
• John Graunt (1620-1674) was the first to
produce a life table based on the Bills of
Mortality of London. The Bills of Mortality
included details of the deaths each week and
the cause of death.
• Johann de Witt (1625-1672), the Prime
Minister of the Netherlands, used the chances
of death to value Life Annuities issued by the
government.
1
Early Life Table Insurance Applications
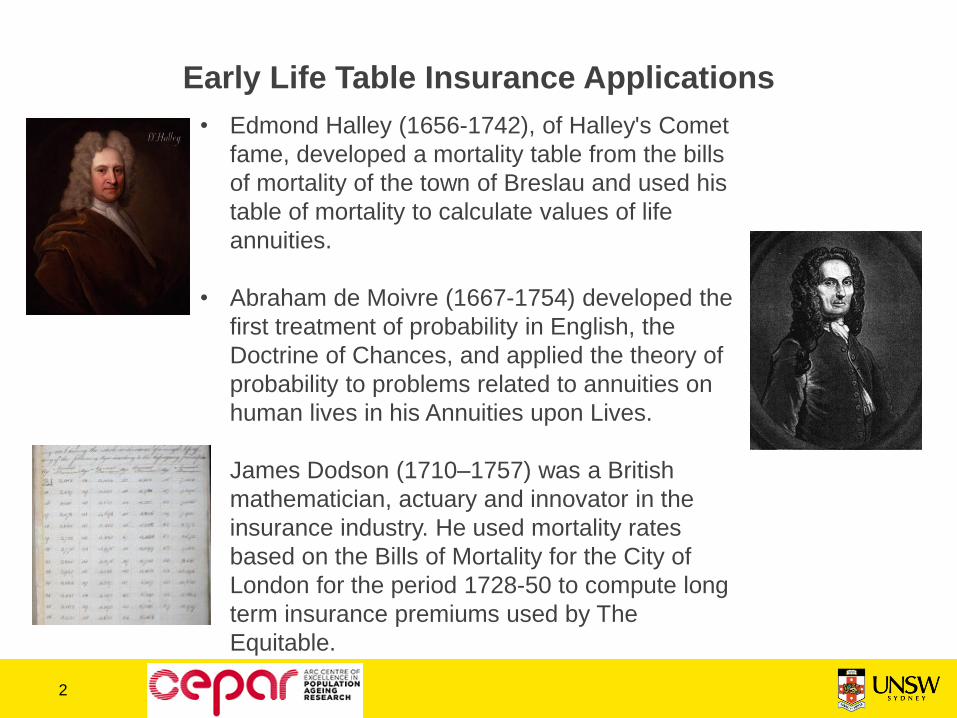
• Edmond Halley (1656-1742), of Halley's Comet
fame, developed a mortality table from the bills
of mortality of the town of Breslau and used his
table of mortality to calculate values of life
annuities.
• Abraham de Moivre (1667-1754) developed the
first treatment of probability in English, the
Doctrine of Chances, and applied the theory of
probability to problems related to annuities on
human lives in his Annuities upon Lives.
• James Dodson (1710–1757) was a British
mathematician, actuary and innovator in the
insurance industry. He used mortality rates
based on the Bills of Mortality for the City of
London for the period 1728-50 to compute long
term insurance premiums used by The
Equitable.
2

Life Tables and Insurance Applications
3
• Morris Birkbeck Pell (1827–1879) was a mathematician,
professor, lawyer and actuary.
• In 1854 he had become actuarial consultant to the
Australian Mutual Provident Society
• In 1870 he was a director and consulting actuary of the
Mutual Life Association of Australasia.
• He published papers 'On the Rates of Mortality and
Expectation of Life in New South Wales' (1867) and 'On
the Constitution of Matter' (1871).
• He also published in the Journal of the Institute of
Actuaries, London, 'On the Distribution of Profits in
Mutual Insurance Societies' (1869) and 'On the Institute
of Actuaries' life tables' (1879) among other papers.
Source: Australian Dictionary of Biography

Data for Life Tables
Individual data
• Risk factors: Age, sex, smoking status, education, occupation, ethnicity, income, geographical location, marital status
• Cause of death
• Survey data (HRS)
• Government administrative data
Population by country
• Aggregate deaths by age, gender, period, cohort
• Aggregate cross sectional health data
• Prevalence of health conditions
• Mortality rates by Causes of death
• Human Mortality Database
Life insurance, pension fund and annuity pools
• Aggregation of deaths and exposures by underwriting risk factors
• Effect of selection
• Insured lives
• Annuitants
• Pensioners
• Role of Actuarial associations (CMIB, SoA)

Frailty and Markov Physiological Ageing Models
Markov Physiological Age Model –
Distribution of Physiological Ages
for a 65 year old Australian male
Frailty Model – 1945 Australian Male
Cohort with varying levels of frailty
Source: Shu and Sherris (2010)
Life insurers “select” lives using underwriting allowing for
heterogeneity in individual mortality
Su, S. and Sherris, M. (2012), Heterogeneity of Australian Population Mortality and Implications for a
Viable Life Annuity Market, Insurance: Mathematics and Economics, 51, 2, 322–332

Life Tables for Insurance allowing for Risk Factors
GLMM can allow for both
underwriting risk factors
and residual variability
(frailty)
Heterogeneity still significant
after underwriting
Insurer can adjust annuity
prices by pricing using
adjusted mortality
reflecting risk profiles and
a frailty factor
6
Meyricke, R., and Sherris, M. (2013), The determinants of mortality heterogeneity and implications for
pricing annuities. Insurance: Mathematics and Economics, 53, 2, 379–387.
Multi-State Life Tables for Functional Disability
7
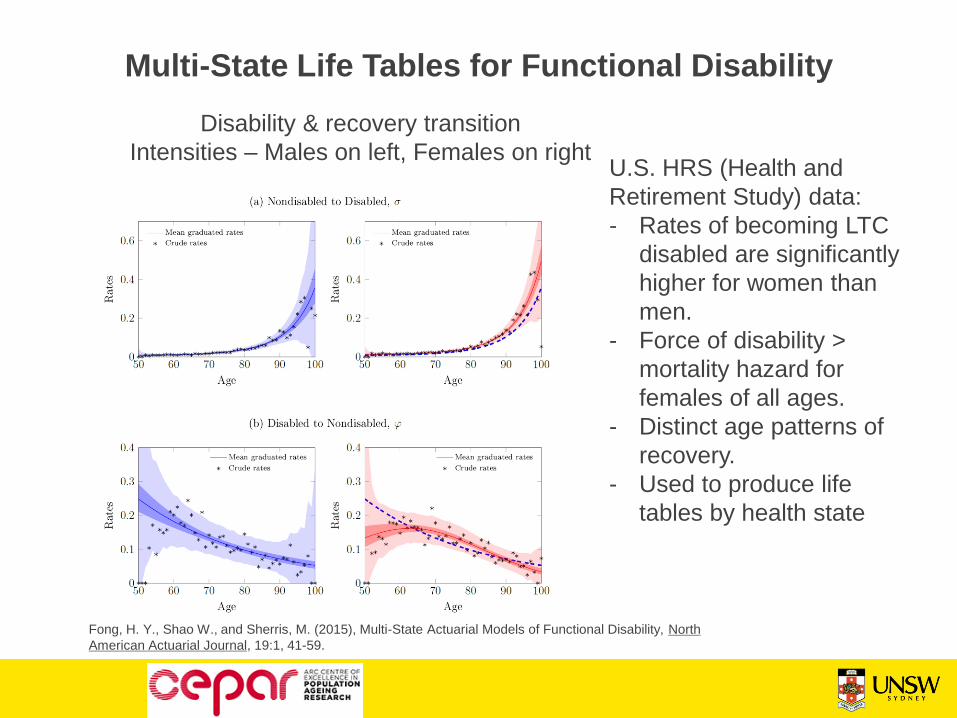
Disability & recovery transition
Intensities – Males on left, Females on rightU.S. HRS (Health and
Retirement Study) data:
- Rates of becoming LTC
disabled are significantly
higher for women than
men.
- Force of disability >
mortality hazard for
females of all ages.
- Distinct age patterns of
recovery.
- Used to produce life
tables by health state
Fong, H. Y., Shao W., and Sherris, M. (2015), Multi-State Actuarial Models of Functional Disability, North
American Actuarial Journal, 19:1, 41-59.

Multi-State Life Tables for Functional Disability
US Mortality rates from
HRS data
Higher male mortality
Higher disabled
mortality
Mortality transition Intensities –
Males on left and Females on right
Fong, H. Y., Shao W., and Sherris, M. (2015), Multi-State Actuarial Models of Functional Disability, North
American Actuarial Journal, 19:1, 41-59.
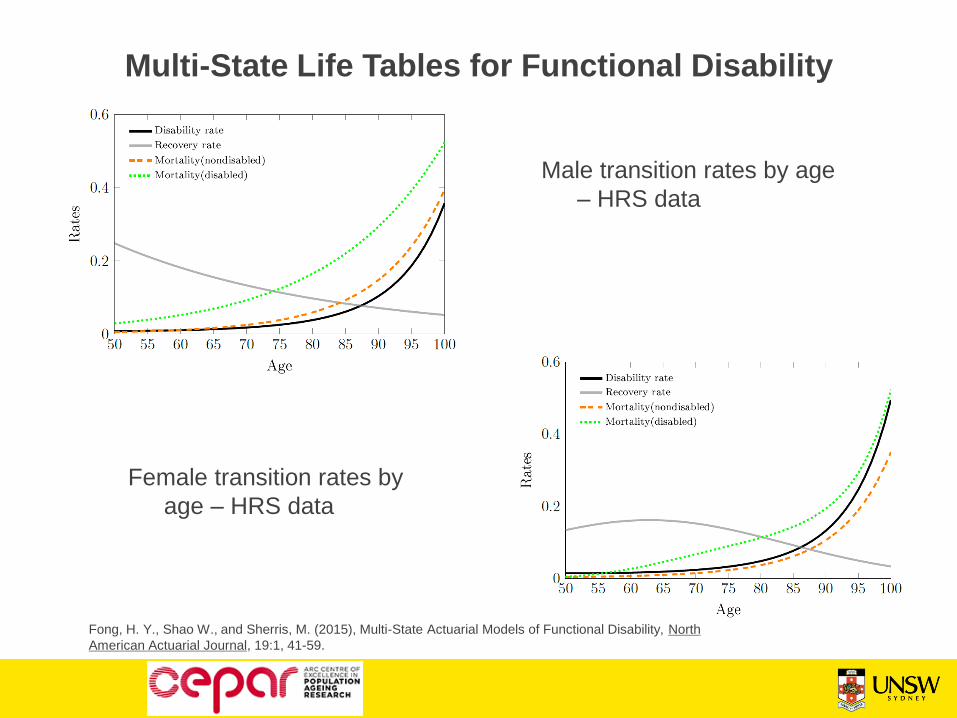
Multi-State Life Tables for Functional Disability
Male transition rates by age
– HRS data
Female transition rates by
age – HRS data
Fong, H. Y., Shao W., and Sherris, M. (2015), Multi-State Actuarial Models of Functional Disability, North
American Actuarial Journal, 19:1, 41-59.
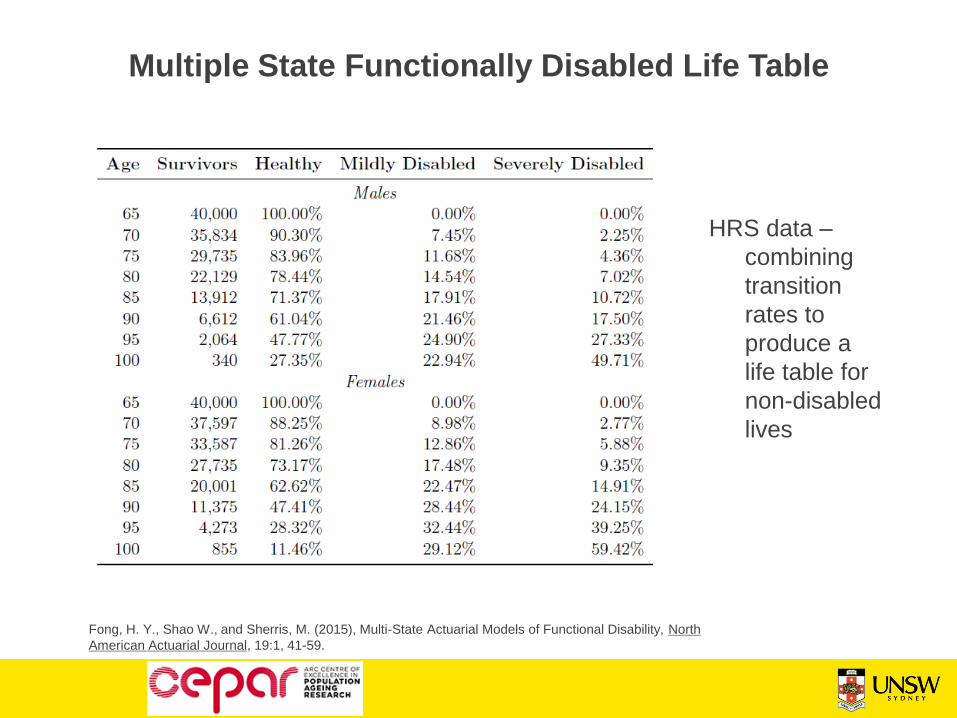
Multiple State Functionally Disabled Life Table
HRS data –
combining
transition
rates to
produce a
life table for
non-disabled
lives
Fong, H. Y., Shao W., and Sherris, M. (2015), Multi-State Actuarial Models of Functional Disability, North
American Actuarial Journal, 19:1, 41-59.

Functional Disability Life Table and LTC Insurance
11
- Disability (functional) free life expectancy
- Estimated from HRS data
Fong, H. Y., Shao W., and Sherris, M. (2015), Multi-State Actuarial Models of Functional Disability, North
American Actuarial Journal, 19:1, 41-59.

Static Life Tables
Society of Actuaries Mortality TablesMortality and Other Rate Tables (MORT)
The Mortality and Other Rate Tables (MORT) application was developed by the Society of
Actuaries (SOA) to provide easy electronic access to a variety of rate tables of interest
to actuaries and others. As of 2014, the inventory of rate tables available via this
database numbers over 2,500 and encompasses SOA experience mortality and lapse
tables, regulatory valuation tables, population tables and various international tables.
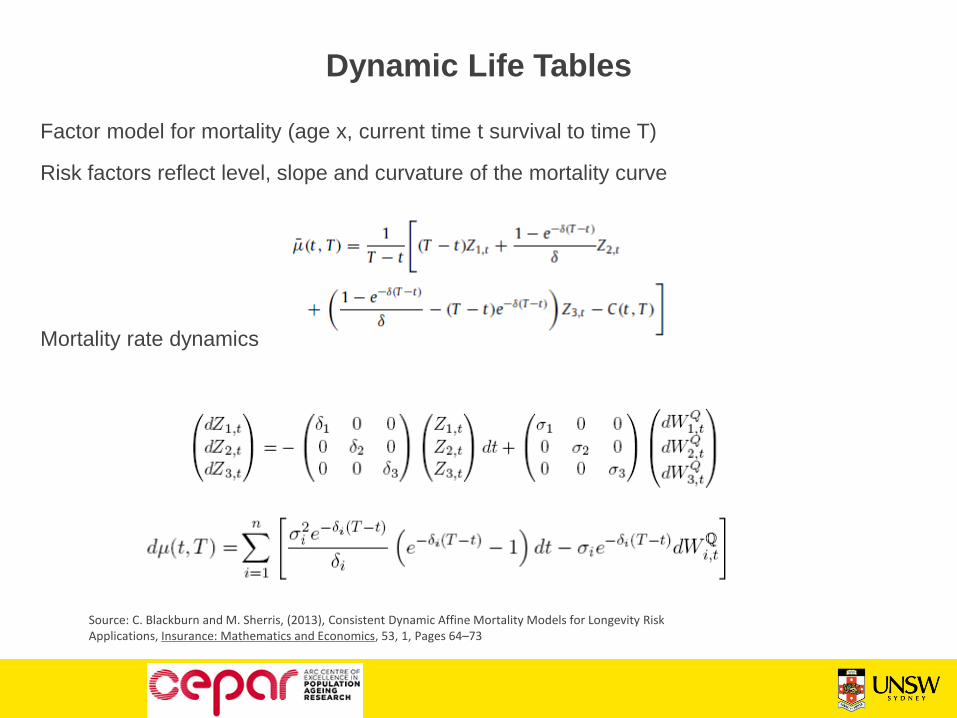
Dynamic Life Tables
Factor model for mortality (age x, current time t survival to time T)
Risk factors reflect level, slope and curvature of the mortality curve
Mortality rate dynamics
13
Source: C. Blackburn and M. Sherris, (2013), Consistent Dynamic Affine Mortality Models for Longevity Risk Applications, Insurance: Mathematics and Economics, 53, 1, Pages 64–73

Dynamic Factor Model for Survival Curve
• Survivor curve
• Swedish mortality 1910 to
2007 ages 50 to 100
14
Source: C. Blackburn and M. Sherris, (2013), Consistent Dynamic Affine Mortality Models for Longevity Risk Applications, Insurance: Mathematics and Economics, 53, 1, Pages 64–73

Dynamic Life Tables – Mortality Survival Curve with
Confidence Intervals
Cohort
survival
curves
Uncertainty
calibrated to
historical data
Parameter
uncertainty
included
Source: C. Blackburn and M. Sherris, (2013), Consistent Dynamic Affine Mortality Models for Longevity Risk Applications, Insurance: Mathematics and Economics, 53, 1, Pages 64–73

Individual Life Tables – Longevity Illustrator

Individual Life Tables using Facial Recognition
• Facial recognition can be used to estimate physiological age, BMI, gender,
smoker status - application of data science and machine learning. Example –
Lapetus Solutions https://www.lapetussolutions.com/about/
From just a simple selfie, our Facial Analytics technology examines 100’s of points and 1000’s of regions
on the face to instantly provide: BMI calculation, Estimated Age, Gender, Smoking Indication

http://www.cepar.edu.au/
Michael Sherris
CEPAR, Risk and Actuarial Studies
UNSW Business School
UNSW
http://papers.ssrn.com/author=410919

References
Su, S. and Sherris, M. (2012), Heterogeneity of Australian Population Mortality and
Implications for a Viable Life Annuity Market, Insurance: Mathematics and Economics,
51, 2, 322–332.
Blackburn, C. and Sherris, M. (2013), Consistent Dynamic Affine Mortality Models for
Longevity Risk Applications. Insurance: Mathematics and Economics. 53, 1, 64-73.
Meyricke, R., and Sherris, M. (2013), The determinants of mortality heterogeneity and
implications for pricing annuities. Insurance: Mathematics and Economics, 53, 2, 379–
387.
Fong, H. Y., Shao W., and Sherris, M. (2015), Multi-State Actuarial Models of Functional
Disability, North American Actuarial Journal, 19:1, 41-59.

Questions and Discussion
20