liberia: issues and options in the energy sector
TRANSCRIPT

Report No. 5279-LBR
Liberia: Issues and Optionsin the Energy Sector
December 1984
Report of the Joint UNDP/World Bank Energy Sector Assessment ProamThis document has a restricted distribution. Its contents may not be disclosedwithout authonzation from the Govemment, the UNDP or the Worid Bank.
...
Pub
lic D
iscl
osur
e A
utho
rized
Pub
lic D
iscl
osur
e A
utho
rized
Pub
lic D
iscl
osur
e A
utho
rized
Pub
lic D
iscl
osur
e A
utho
rized

JOINT UNDP/WORLD BANK ENERGY SECTOR ASSESSMENT PROGRAMREPORTS ALREADY ISSUED
Country Date Number
Indonesia November 1981 3543-INDMauritius December 1981 3510-MASKenya May 1982 3800-KESri Lanka May 1982 3792-CEZimbabwe June 1982 3765-ZIMHaiti June 1982 3672-HAPapua New Guinea June 1982 3882-PNGBurundi June 1982 3778-BURwanda June 1982 3779-RW.Malawi August 1982 3903-MALBangladesh October 1982 3873-BDZambia January 1983 4110-ZATurkey February 1983 3877-TUBolivia April 1983 4213-BOFiji June 1983 4462-FliSolomon islands June 1983 4404-SOLSenegal July 1983 4182-SESudan July 1983 4511-SUUganda July 1983 4453-UG
Nigeria August 1983 4440-UNINepal August 1983 4474-NEPGambia November 1983 4743-GMPeru January 1984 4677-PECosta Rica January 1984 4655-CRL esothc Tanuary 1984 4676-LSOSeychelles january 1984 4693-SE'YMorocco March 194 4157-MORPortugal Acri; i984 4824-PONiger May 1984 4642-NIRE;thiopia Ju`v 1984 4741-ETC.ape Verde Auzust 1984 5073-CVGuinea Bissau Auzaust 1984 5033-CUBBotswana Seotember 1984 4'998-BTSt. Vincen: and
the Grenadcnes September 1984 5103-STVSt. Lucia Sep1e r 984 5111-SLUParaguay Oc' h.er 1984 51'5-PATanzania Ncv e.-nber 1984 '959-TA

FOR OFFICIAL USE ONLY
REPORT NO. 5279-1BR
LIBERIA
ISSUES AND OPTIONS IN THE ENERGY SECTOR
DECEMBER 1984
This is one of a series of reports of th- Joint UNDP/World Bank EnergySector Assessment Program. Finance for thie work has been provided, inpart, by the UNDP Energy Account, and the work has been carried out bythe World Bank. This report has a restricted distribution. Its contentsmay not be disclosed without authorization from the Government, the UNDPor the World Bank.

ABSTRACT
The economy of Liberia has been in decline since 1979 and theprospects for future economic growth are uncertain. Between 1979 and1983, the modern sector GDP was estimated to have declined at a rate of5.6Z per year. The impact of the lessened demand for Liberia's exportproducts, especially iron ore, has been magnified by poor management ofthe economy and of the major state-owned enterprises. The two mainenergy parastataLs - the Liberian Electricity Corporation (LEC) and theLiberian Petroleum Refining Company (LPRC) -- are now threatened withsevere liquidity problems. Three main themes have been pursued in thisreport to address the severe issues facing the Liberian energy sector:restoring financiaL viability to LEC and LPRC; maximizing the service-ability and productivity of installed energy production, storage, andhandling capacity in the petroleum and power sectors; and optimizing theexploitation and replenishment of presently abundant woody fuelresources. An energy sector investment program of US$60 million is putforth between 1984 and 1993, and technical assistance projects are recom-mended to assist in the implementation of the investment program.

ABBREVIATIONS AND ACRONYMS
Abbreviations
bbl barrelbd bone dryGJ gigajouleGDP gross domestic productGWh gigawatt hourha hectarekg kilogramKVA kilovolt amperekW kilowattkWh kilowatt hour1 literLPG Liquified Petroleum Gasm mcwb moisture content, moisture content wet basis* cubic meterM,M thousandMM millionMVA megavolt ampereKW megawattKWh megawatt hourOD oven drysv,s solid volume, solidtonne,te metric tonnetoe tonnes of oiL equivalenttpa,tpy tonnes per annum, tonnes per year
Acronyms
AfDB African Development BankEFMC Econonic and Financial Management CommitteeLEC Liberia ELectricity CorporationLPRC Liberia Petroleum Refinery CorporaticnGOL Government of LiberiaDOE Department of EnergyMLME Ministry of Lands, Mines and EnergyFDA Forestry Development AuthorityNEC National Energy CommitteeORNL Oak Ridge National Laboratory
This report is based on the findings of an energy assessment mission whichvisited Liberia in February, 1984. The mission assignments were, K. Newcombe,Mission Leader, Power Sector Management and Household Energy; H. Ansari,Deputy Mission Leader, Petroleum Sector Co-ordination and InstitutionalArrangements; G. Alibaruho, Economist, Macroeconomic Linkages; G. Herrmann,(Cons) Power Systems Planning and Engineering; R. Chronowski, (Cons) Wood-fired Power Systems and Industrial Energy; G. Duxbury, (Cons) PetroleumEconomist; J. Russel, (Cons) Petroleum Procurement and Transportation Issues;J. Shillingford, (Cons) Refinery and Depot Engineering and Economics. KenNewcombe was the principal author of the report.
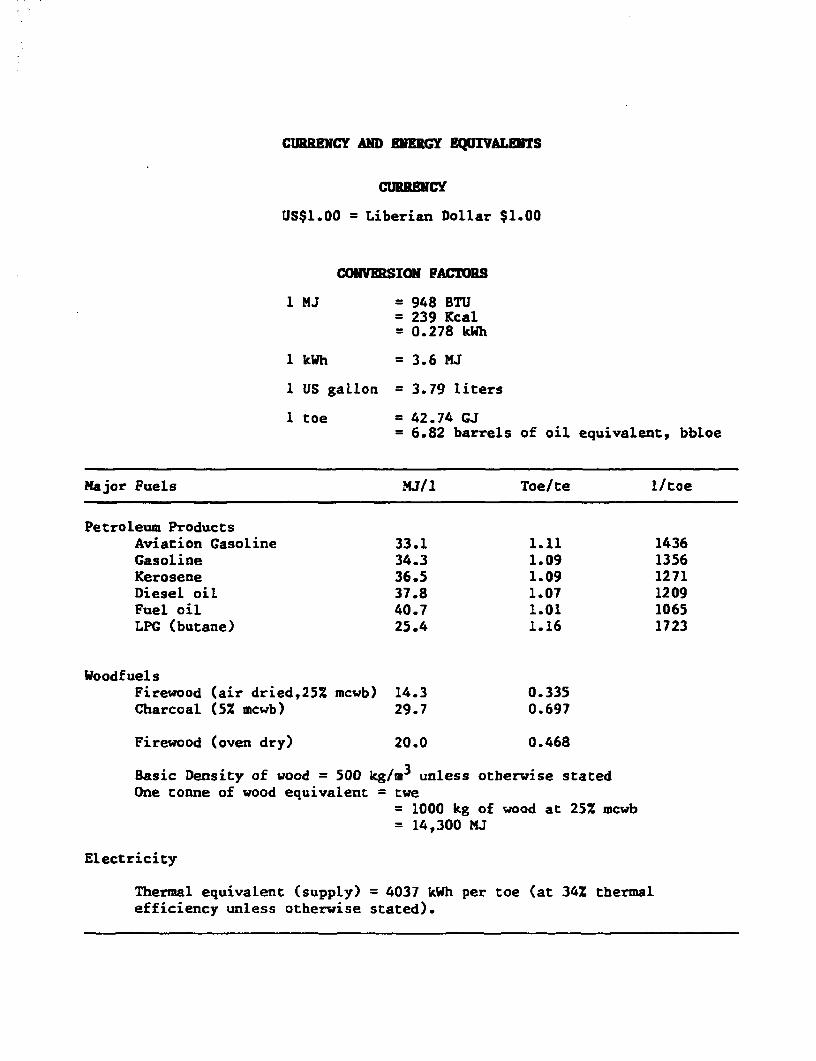
CUB ENY ND EEGY ZQUIVALENTS
cUrRC
US$1.00 = Liberian Dollar $1.00
CONVERSION FACTORS
1 MJ = 948 BTU= 239 Kcal= 0.278 kWh
1 kWh = 3.6 MJ
1 US gaLlon = 3.79 liters
1 toe = 42.74 GJ= 6.82 barrels of oil equivalent, bbloe
Major Fuels MJ/i Toe/te 1/toe
Petroleum ProductsAviation Gasoline 33.1 1.11 1436Gasoline 34.3 1.09 1356Kerosene 36.5 1.09 1271Diesel oil 37.8 1.07 1209Fuel oil 40.7 1.01 1065LPG (butane) 25.4 1.16 1723
WoodfuelsFirewood (air dried,25% mcwb) 14.3 0.335Charcoal (52 mcwb) 29.7 0.697
Firewood (oven dry) 20.0 0.468
Basic Density of wood = 500 kg/m3 unless otherwise statedOne tonne of wood equivalent = twe
= 1000 kg of wood at 25Z mcwb= 14,300 MJ
Electricity
Thermal equivalent (supply) = 4037 kWh per toe (at 34X thermalefficiency unless otherwise stated).

TABLE OF CONrENTSPage
SUMMARY AND RECOMMENDATIONS ................... ......... .... i
I. ENERGY AND THE ECONOMY OF LIBERIA .......................... 1Country Background ............ ....... .........-. 1Trends in Economic Performance ........................... 1Energy and the Economy........ ........................... 2Indices of Change in the Energy Economy ................ 3
The Present Pattern of Energy Consumption** ............. 3Recent Trends in Power and Petroleum Consumption ....... 6
Future Energy Demand ................................... . 8Changing Fuel Mix.......... ........................... 10
Energy Pricing .................... .............................. 11
II. PETROLEUM ..................................... ............. 14Background ......... .. ........... ............ 14Petroleum Resources ...................................... 14Petroleum Product Demand ........................................ . 14Supply of Petroleum ......................... ......... 16Port Facilities ............. ................................. 17
Procurement Arrangements ...... ................... 18Product Purchasing Performance......................... 19Other Components of the Landed Price ................... 20Final Cost of Petroleum Supply at the Depot*& ........a 21Short Term Measures. ........... ....... ....... 23
Financing of Petroleum Imports ........................... 23Distribution Costs.....6-0-060 ........ ....... 24
Private Sector RoLe in Product Supply . . 25Options for Private Sector Involvement ......ol em....en.t. 26
Product Storage Capacity ................................. 26Parcel Size Limitations ................................ 28
Prospects for Oil Refining in Li b e r i a ................. 28Institutional Issues and Options . . 29Petroleum Investment and TechnicalAssistance Requirements..................... 30
III. ELECTRICITY ................. e-sov.......... e.e........ 31Introduction .......................................... 31Institutional Arrangements ............................... 31The Power System .... 00 ........... . 32
Short Term Problems .... .. ............................ 36Current Financial Status ............................... 36Liquidity ................. 0......................... 36Non-Technical Losses ................................... 37
Reducing Non-Technical Losses...... ....... .... 37Privatization ...................................... 39
Reducing Technical L o s s e s ................. 39rmplementation ...................................... 40Efficient Use of ELectricity ........................... 41

Page
Electricity Demand Projections............................ 42Financial Projections....... ...... 43
Generation Needs and Options............................. 43Immediate Supply .......................... ............ 44Long Term Supply Agreement with BMC.................... 45Fuel Oil Fired Dieselse....................... 46Wood-fired Steam Power Generation..................... 46Coal as a Power Source ................... 47Hydropower ............................................ 48Upgrading the Mt. Coffee Hydropower Station............ 49Conclusions and Recommendations onGeneration Expansion ................................ 50
Generation and Transmission Planning Studies........... 51HydroLogy ............................................... S1Transmission Expansion...6.06606606-see ............... . 52
Isolated Supply Systems........................ .......... 52Alternative Energy Supply for IsolatedPower Generation ..................................... 55
Electricity Pricinge.e.e........................... 56Short Run Marginal Cost of Hydropower ........ 0........ 56Long Run Marginal Costs................................ 56Tarif fs. . . . . . . . . . . . . . 0. 0. . . . . . . .4. 000. a6. . ... . . 56M-anagement Isus.......................58
Subsector Investment and TechnicalAssistance Requirements................. e............. 59
IV. HOUSEHOLD AND INDUSTRIAL ENERGY ............................* 62Introduction................................................ 62Household Energy....................................... 62The Pattern of Household Energy Use .................... 62Comparative Economy of HousehoLd Fuels ................. 63
Woodfuel Supply and Demand............................... 66Present Woodfuel Resources ............................. 66National Woodfuel Demandt.. .. . . . . . . e.. .. ... .. e.e..... . 67Supply and Demand of Woodfuels to Monroviao.s............ 67Rubber as an Energy Crop............... ............. ... 68The Economics of Rubbertree Wood Charcoal Production... 70Policy Implications and Recommendations ................ 72Other Woodfuel Resource Management Optionse............. 72
The Charcoal Industry...& .............. o ........ .... 74Improved Charcoaling Efficiency ........................ 74The Prospect for Exporting Charcoal.................. O.. 75Modifying Demand for Household Cooking Fuels....e..... 78Kerosene and LPG Supplies................. .............. 80
Solar Water Heating.... ... * . ........ & 80Industry ........es........ 0.00........ ........................ 81Energy Efficiency in Manufacturing ..................... 81Interfuel Substitution in the Manufacturing Sector..... 82Risks and Logistics ........ ......... .... ... 84
Page
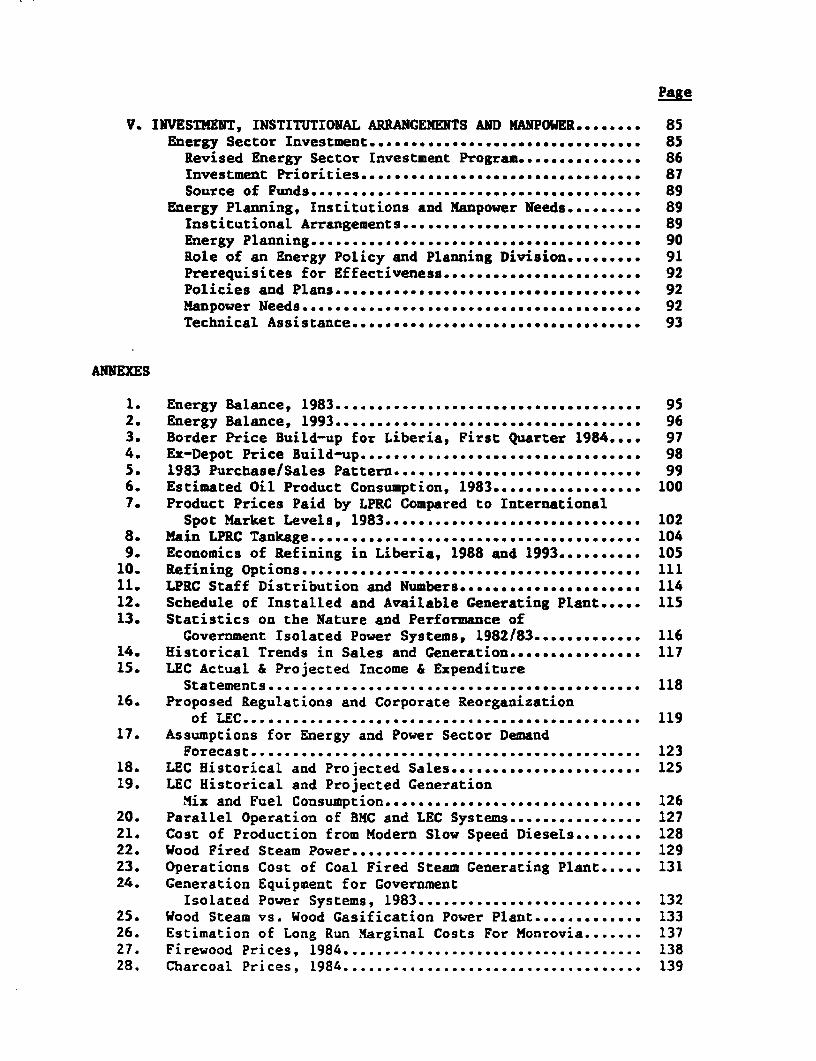
V. INVESTMENT, INSTITUTIONAL ARRANGEMENTS AND MPOW...ER........ 85Energy Sector Investment... .6..... .0.....e.g...... .... 85Revised Energy Sector Investment Program .............. 86Investment Priorities....... .............. 87Source of Funds ...... ............................0 89
Energy Planning, Institutions and Manpower Needs ......... 89Institutional Arrangements ...... .... ....060000000 89Energy Planning ...................... 90Role of an Energy Policy and Planning Division 0. o...... 91Prerequisites for Effectiveness ........... 000......... 92Policies and ............................ ..... 92Manpower Needs ......................................... * 92Technical Assistance.........e.............e............ 93
ANNEXES
1. Energy Balance, 1983 ................... 952. Energy Balance, 1993.... ... . .. .g..... ... **** 963. Border Price Build-up for Liberia, First Quarter 1984 .... 974. Ex-Depot Price Build-up. ....... . 985. 1983 Purchase/Sales Pattern............................. 996. Estimated Oil Product Consumption, 1983................ 1007. Product Prices Paid by LPRC Compared to International
Spot Market Levels, 1983 ........... ............. 1028 Main LPRC Tankage ................ ........ 1049. Economics of Refining in Liberia, 1988 and 1993 .......... 10510. Refining Options ................ l................. 11111. LPRC Staff Distribution and Numbers...................... 11412. Schedule of Installed and Available Generating Plant..... 11513. Statistics on the Nature and Performance of
Government Isolated Power Systems, 1982/83............. 11614. Historical Trends in Sales and Generation................ 11715. LEC Actual & Projected Income & Expenditure
Statements ............................. .00..................... 11816. Proposed Regulations and Corporate Reorganization
of LEC .... .6 *** 0*........... 11917. Assumptions for Energy and Power Sector Demand
Forecast ..... ...... ......* 12318. LEC Historical and Projected Sales ...... 12519. LEC Historical and Projected Generation
Mix and Fuel Consumptione. .. .........e.e.o... 12620. Parallel Operation of BMC and LEC Systems .. 0 ............. 12721. Cost of Production from Modern Slow Speed Diesels........ 12822. Wood Fired Steam Power ............ ...... ... ....... *0 12923. Operations Cost of Coal Fired Steam Generating Plant..... 13124. Generation Equipment for Government
Isolated Power Systems, 1983 .......................... 13225. Wood Steam vs. Wood Gasification Power Pl ant ........... 13326. Estimation of Long Run Marginal Costs For Monrovia ....... 13727. Firewood Prices, 1984 . ............. o ..................... 13828. Charcoal Prices, 1984 .................................... 139

Page
29. Forest Resources, 1983 ........... . 14030. Estimated Rubber Tree Stand, 1983 ........................ 14131. Plantation Timber Resources, 1983........................ 14232. Current and Projected Woodfuel Use by Households ......... 14333. Woodfuels Supply and Demand to Monrovia Households ....... 14434. Price Build-up for Charcoal in Liberia, 1984 ............. 14535. Energy Sector Investment Program, 1984-93...........0..... 146
TABLES1. Final Energy Consumption1.1 Trends in GDP and Modern Energy Consumption1.2 Petroleum Imports, Re-exportes, and Total Merchandise Trade, 1976-821.3 Final Energy Consumption, 19831.4 Energy Intensities of Selected Regional Countries, 1981-821.5 Recent Consumption Trends for Petroleum and Power1.6 Final Consumption of Petroleum Products by Sector, 19821.7 Significant Future Trends in Energy Supply and Consumption1.8 Petroleum Prices and Costs, Monrovia, Liberia, First Quarter, 19842.1 Development of Petroleum Products Consumpti3n, 1979-832.2 Mining Sector Fuel Requirements2.3 Countrywide Petroleum Demand Forecast2.4 Premia Paid by LPRC on 1983 Imports2.5 LPRC's Other Purchasing Costs2.6 Simplified Comparison of Costs of Petroleum Products Import2.7 LPRC Refined Petroleum Product Storage Capacity, 19842.8 Petroleum Sector Investment Program3.1 Installed Capacity of Electrical Generating Plant in Liberia, 19833.2 Estimated Power Generation in Lib-ria, 19833.3 Generation and Sales for the Monrovia Power System, 1979-833.4 Generation and Sales Projection for the Monrovia Power System3.5 Short Run Marginal Costs of Thermal Generation, 19843.6 Hydropower Resources of Liberia3.7 Characteristics of IsoLated Generating Systems, Liberia, 1982-833.8 Load Projection for Isolated Generating Stations, Liberia, 1984-933.9 Long Run Marginal Cost Estimates, Monrovia Power System3.10 Power Sector Investment Program, 1984-934.0 HousehoLd Energy Consumption, 19834.1 Comparative Cost of Household Energy Forms in Monrovia,
First Quarter, 19844.2 CharcoaL Production Costs, 19834.3 CharcoaL Production Costs Using Improved Metal Kilns4.4 Possible Charcoal Export Price Structure4.5 Cost of Cooking in Liberia with Present and Improved Stoves5.1 Overview of Energy Investment in the Public Sector, 1976-875.2 Average Annual Component of Public Investment Program
by Sector, 1981-875.3 Major New Investments by Priority Class5.4 Energy Sector Investment Program: 1984-93

MAPSIBRD 12867R: Country MapIBRD 18368: Offshore PetroLeum ExplorationIBRD 18383: Generation and Transmission Network
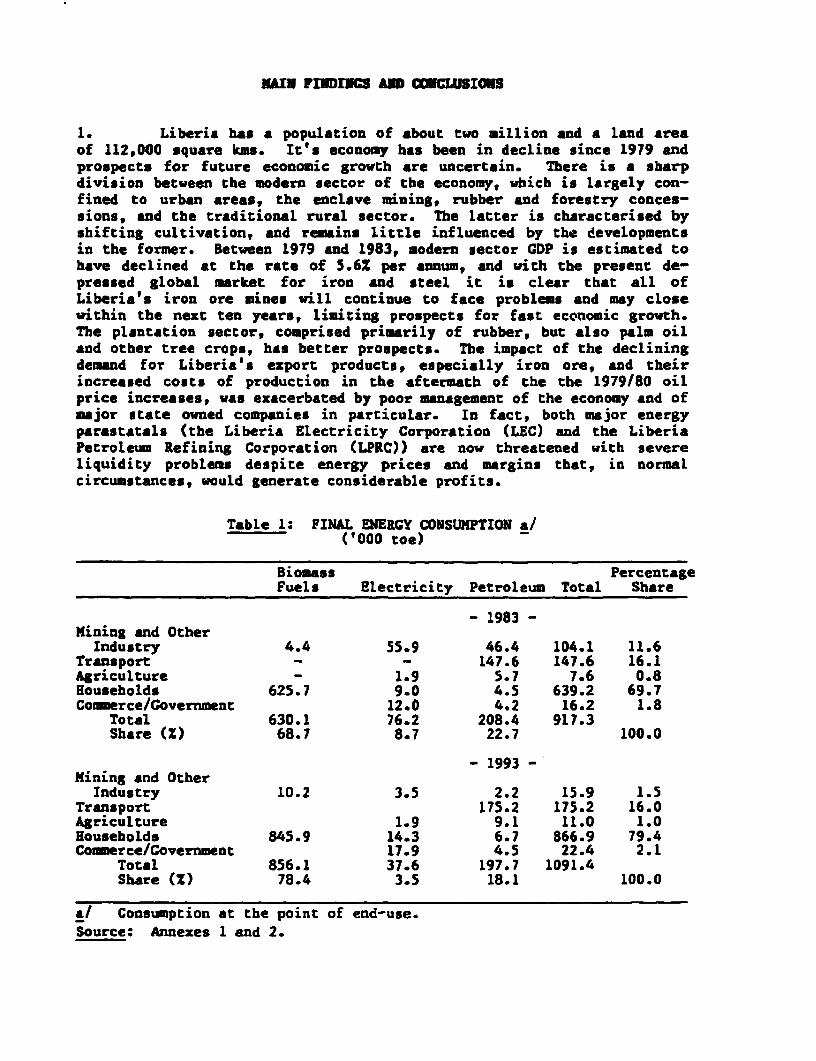
MAIN FINDINGS AND COECLUSIG0S
1. Liberia has a population of about two million and a land areaof 112,000 square kms. It's economy has been in decline since 1979 andprospects for future economic growth are uncertain. There is a sharpdivision between the modern sector of the economy, which is largely con-fined to urban areas, the enclave mining, rubber and forestry conces-sions, and the traditional rural sector. The latter is characterised byshifting cultivation, and remains little influenced by the developmentsin the former. Between 1979 and 1983, modern sector CDP is estimated tohave declined at the rate of 5.62 per annum, and with the present de-pressed global market for iron and steel it is clear that all ofLiberia's iron ore mines will continue to face problems and may closewithin the nezt ten years, limiting prospects for fast economic growth.The plantation sector, comprised primarily of rubber, but also palm oiland other tree crops, has better prospects. The impact of the decliningdemand for Liberia's export products, especially iron ore, and theirincreased costs of production in the aftermath of the the 1979/80 oilprice increases, was exacerbated by poor management of the economy and ofmajor state owned companies in particular. In fact, both major energyparastatals (the Liberia Electricity Corporation (LEC) and the LiberiaPetroleum Refining Corporation (LPRC)) are now threatened with severeliquidity problems despite energy prices and margins that, in normalcircumstances, would generate considerable profits.
Table 1: FINAL ENERGY CONSUMPTION a/('000 toe)
Biomass PercentageFuels Electricity Petroleum Total Share
- 1983 -Mining and OtherIndustry 4.4 55.9 46.4 104.1 11.6
Transport - - 147.6 147.6 16.1Agriculture - 1.9 5.7 7.6 0.8Bouseholds 625.7 9.0 4.5 639.2 69.7Coouerce/Government 12.0 4.2 16.2 1.8
Total 630.1 76.2 208.4 917.3Share (Z) 68.7 8.7 22.7 100.0
- 1993 -Mining and OtherIndustry 10.2 3.5 2.2 15.9 1.5
Transport 175.2 175.2 16.0Agriculture 1.9 9.1 11.0 1.0Households 845.9 14.3 6.7 866.9 79.4Coerce/Government 17.9 4.5 22.4 2.1
Total 856.1 37.6 197.7 1091.4Share (X) 78.4 3.5 18.1 100.0
a/ Consumption at the point of end-use.Source: Annexes 1 and 2.

- ii -
The pattern of final energy consumption is summarized in Table 1.1. From1980 to 1984, Liberia's consumption of petroleum and electricity declinedin line with economic activity and is projected to decline further, bothin absolute terms, and relative to the consumption of traditional biomassfuels, particularly during the early 1990s as the Bong mine closes. Con-versely, over the same period the share of firewood and charcoal is pro-jected to increase from about 70% to 80%. While Libe-ia's present percapita energy consumption of 438 kgoe per year is well above that of itsneighbours, the likelihood is that this distinction will be shortlived.In effect, the Liberian energy economy is in a transition just the oppo-site of most developing economies where the share of modern fuels of thetotal energy mix increases as urbanization and industrialization pro-ceeds. In Liberia, the overall growth in energy supply over the 1984-1993 period is expected to be 3.6% p.a., or marginally higher than popu-lation growth, and its source will be almost exclusively woodfuels. Thedeclining demand for modern fuels has far-reaching implications for powerand petroleum subsector management and planning, and the growing demandfor woodfuels raises important questions regarding the optimal exploita-tion of the country's forests.
Overall Energy Strategy
2. Three main themes of a comprehensive energy strategy emergefrom this energy assessment:
(a) Restore financial viability to the main public sector energysupply and production agencies - the Liberian Electricity Cor-poration (LEC) and the Liberian Petroleum Refining Corporation(LPRC). So long as these parastatals are unable to generatesufficient surpluses for adequate maintenance and for capitalinvestment there is little prospect of reliable and reasonablypriced energy supply. The achievement of this objective willrequire upgraded management and strict enforcement of paymentof energy accounts supported by new legislation, regulationsand consumer billing practices and a determined political willto succeed.
(b) Maximize the serviceability and productivity of installedenergy production, storage and handling capacity in the petro-leum and power sectors. While there is either declining oralmost stagnant markets for modern energy forms, maximum bene-fit will be derived from the rehabilitation of existing faci-lities in each subsector, with the exception of the refinerywhich should be dismantled forthwith. Crash programs to re-meter consumers, redesign and refurbish electrical distributionand to rehabilitate economically serviceable ceieration plantare required. Similarly, maximum use is to be made of under-utilized generating plant within the enclave mining sector inpreference to purchase of new generating equipment. In the

- iii -
petroleum subsector, storage facilities should be revamped andport handling equipment upgraded to facilitate efficientoperation of a petroleum depot relocated at the Water Frontarea instead of at the old refinery site.
(c) Optimize the exploitation of presently abundant woody fuelresources in order to reduce the destruction of accessible highforest and to increase the benefit to the economy of the con-sumption of woodfueLs by using wood from retired rubber treeplantations. Resource inventories, systematic incentives forprivate sector exploitation of the least cost forest resourcesand the demonstration of modern efficient production and end-use equipment will be required.
Key Issues and Options
Petroleum Subsector
3. Until 1982, petroleum products were produced at the Govern-ment's refinery in Monrovia under the management of its wholly-ownedLiberian Petroleum Refining Corporation (LPRC). The refinery was closedat the beginning of 1983 due to the LPRC's inability to meet a majorpayment for crude oil. Subsequently the GOL decided not to re-open therefinery because further evaluation indicated that it was cheaper toimport petroleum products than to refine them locally. However, LPRCstaff had little experience in product procurement and frequently boughttoo late and paid above market rates. In addition, not only were mostrefinery cost centers kept active but new equipment was purchased andinstalled after the Government's decision that the refinery was not to bere-opened. Unauthorized extraction of petroleum products added furtherto the costs of petroleum supply. The LPRC management is also burdenedby serious litigation following the collapse of crude oil supply arrange-ments, and by confused debtor-creditor obligations and, as a resutlt, isunable to devote sufficient attention to day-to-day problems of opera-tional inefficiency. The net result of these problems in 1983 was anadditional and avoidable cost burden of at least US$13 million, or aboutUS$77 per tonne of product imported by the LPRC. The key issues in thesector are, then, how best to improve the efficiency of petroleum pro-curement and supply to the wholesale market, and whether to completelydismantle or to mothball the refinery. Of even more immediate concern isthe need to secure for the LPRC sufficient liquidity to procure productwhen required and in the desired quantities. By February 1984 the com-pany's effective reserves had fallen so low that it had to reduce cargosizes to make ends meet against rising costs. LPRC's solvency isthreatened both by the ongoing inability of the Liberian ElectricityCorporation to fully pay for products suppLied, and by its own ineffi-ciency. The most important of the measures nroposed by the mission toresolve these problems are as follows:

iv -
(a) dissolve the LPRC and form a Liberian Petroleum Supply Companywith the sole objective of importing and wholesaling petroleumproducts. As part of this re-arrangement all present refinerycost centers should be closed, staff retrenched, salable assetsreaLised, and a clear determination made of the current finan-ciaL and legal obligations of the LPRC.
(b) procure the services of an experienced oil industry company tomanage under contract the new supply company, to train Liberianstaff to operate the company within three years, and to expe-dite the liquidation of LPRC assets and the re-employment ofstaff qualified and suitable to serve the new company. Staffemployed in petroleum supply should be reduced from 480 to amaximum of 85 in the process.
(c) dismantle the refinery to the extent of its saLable components,rent or sell office facilities, and move the site of the petro-leum depot to the Water Front area in the port of Monrovia.
(d) Upgrade the storage at the Water Front area as well as off-loading and other handling facilities to promote efficient andcost-effective operations in the new location. This willrequire an investment of about US$7.5 million which must beprepared by an immediate engineering design and costing study.
Power Subsector
4. Power supply to the Monrovia power system (MPS) fell at almost22 per annum between 1980 and 1984. Throughout this period losses havebeen about 35% of generation (20% unbilled consumption and 15X technicallosses). Since only about 70X of electricity officially sold is paidfor, this means that payment is received for less than half of the elec-tricity generated. Tariffs are at least 50X higher than the presentcosts of production and the long run marginal costs of supply. Untilrecently the LEC was able to remain solvent because of the large differ-ence between the cost of supply and tariffs, which were raised as re-quired. Now the LEC is faced with stricter te-ms of credit, higher costsof production due to the growing use of gas turbines, and a furthertariff increase is unlikely to be acceptable to the Government. Duringthe 1984 dry season a major fuel oil fired engine generator set failedand, as with the previous dry season, supply was at best intermittent.LEC chose to meet supply with gas turbines which have direct costs ofproduction well above the tariff level, instead of negotiating additionalsupply from the Bong Mine (see para 3.3) of low cost fuel oil firedgeneration, or rehabilitating its lower cost diesel generators. Demandis forecast to grow at about 0.2% per annum over the next decade andsubsequently the need for major new generating capacity is limited tosecuring supply at the present level, although an excellent opportunityexists for the suppLy of additional hydropower to the Bong Mine in returnfor thermal generation in the dry season and for sale on commercialterms. The most pressing problems are the theft of power and the failure
-v-
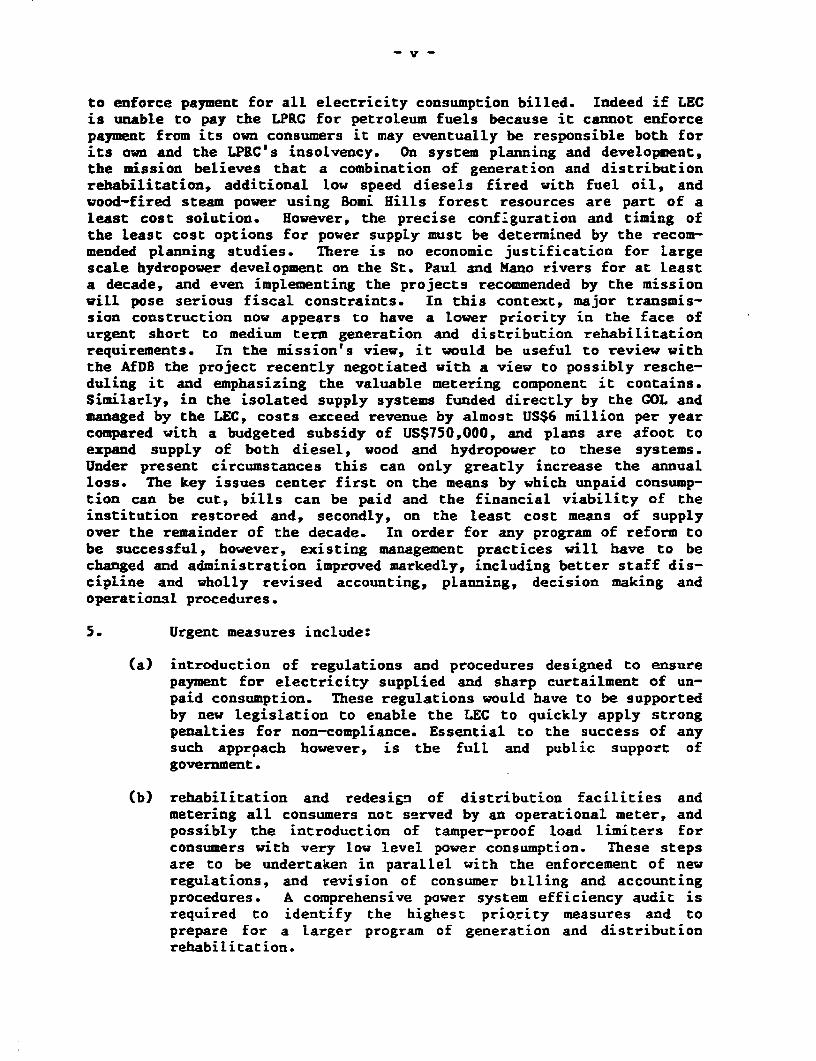
to enforce payment for all electricity consumption billed. Indeed if LECis unable to pay the LPRC for petroleum fuels because it cannot enforcepayment from its own consumers it may eventually be responsible both forits own and the LPRC's insolvency. On system planning and development,the mission believes that a combination of generation and distributionrehabilitation, additional low speed diesels fired with fuel oil, andwood-fired steam power using Bomi Hills forest resources are part of aleast cost solution. However, the precise conf_guration and timing ofthe Least cost options for power suppLy must be determined by the recom-mended planning studies. There is no economic justification for LargescaLe hydropower development on the St. Paul and Mano rivers for at leasta decade, and even implementing the projects recommended by the missionwill pose serious fiscal constraints. In this context, major transmis-sion construction now appears to have a lower priority in the face ofurgent short to medium term generation and distribution rehabilitationrequirements. In the mission's view, it would be useful to review withthe AfDB the project recently negotiated with a view to possibly resche-duling it and emphasizing the valuable metering component it contains.Similarly, in the isolated supply systems funded directLy by the GOL andmanaged by the LEC, costs exceed revenue by almost US$6 million per yearcompared with a budgeted subsidy of US$750,000, and plans are afoot toexpand supply of both diesel, wood and hydropower to these systems.Under present circumstances this can only greatly increase the annualloss. The key issues center first on the means by which unpaid consump-tion can be cut, bills can be paid and the financial viability of theinstitution restored and, secondly, on the least cost means of supplyover the remainder of the decade. In order for any program of reform tobe successful, however, existing management practices will have to bechanged and administration improved markedly, including better staff dis-cipLine and wholly revised accounting, planning, decision making andoperational procedures.
5. Urgent measures include:
(a) introduction of regulations and procedures designed to ensurepayment for electricity supplied and sharp curtailment of un-paid consumption. These regulations would have to be supportedby new legislation to enable the LEC to quickLy apply strongpenalties for non-compliance. Essential to the success of anysuch approach however, is the full and public support ofgovernment.
(b) rehabilitation and redesign of distribution facilities andmetering all consumers not served by an operational meter, andpossibly the introduction of tamper-proof load limiters forconsumers with very low level power consumption. These stepsare to be undertaken in parallel with the enforcement of newreguLations, and revision of consumer billing and accountingprocedures. A comprehensive power system efficiency audit isrequired to identify the highest priority measures and toprepare for a larger program of generation and distributionrehabilitation.

- vi. -
(c) management of the LEC for a period of three years under an ex-ternal management contract on a "fee plus" performance relatedbasis. The contractor concerned would be specifically chargedwith implementing the reforms outlined herein, training staffto replace them in their management role in the near term, andreducing costs, including those for staff. The contractorwould also assume respbnsibility for revising consumer billingand accounting procedures, and implementing metering and con-sumer level distribution rehabilitation programs.
(d) negotiation of an extended contract with the Bong Mining Com-pany for the supply of thermal power during the 1985 dry seasonto reduce reliance on high cost LEC thermal generation.
On the cost and source of power supply to rural towns:
(e) The average variable cost of production is 27C/kWh and thereceipts average 4centslkWh, which led to a loss of US$5.3million in the last financial year. This loss will growrapidly to US$8 million per year if planned diesel installa-tions proceed. Consequently, no additional capacity of anykind should be installed until the tariff is set at 15e/kWh inthe first instance, and metering and billing arrangements aresuch that all consumers pay for supply at this level. In thelonger term tariffs need to be raised to at least cover vari-able costs. If demand persists under these revised tariffs, awood-fired steam plant appears justified in some supply centresand the interconnection of Gbarnga with the Monrovia PowerSystem should be evaluated.
Household Energy
Woodfuel Resources
6. Liberia has forest cover of some kind over more than 80% of itslandscape and in gross terms the annual production of fuel quality bio-mass substantially exceeds demand. However, woodfuel demand is localisedand concentrated particularly in Monrovia, the largest urban center,which is now growing at 5-6% per year. In Monrovia, charcoal now domi-nates the household energy market and hence, with the low efficiency ofconversion from wood to charcoal, the demand for fuelwood in the hinter-land has grown rapidly in the past decade at the expense of nearbyforests. By 1993, the demand for fuelwood is expected to be one-thirdhigher than at present, suggesting that the pace of deforestation willquicken and that the price of woodfuels may rise in real terms as fire-wood and charcoal is transported from further and further afield. Thus,in contrast to the superficial impression that woodfuels are abundant,localized shortages may appear and it is now important to take stock ofexisting and accessible forest resources and to devise a strategy for

- vii -
least cost supply to the household and commercial/industrial woodfuelmarket in the longer term. Perhaps the most important and economicallyattractive source of woodfuels for Monrovia and other urban areas isrubber plantations. Although rubber wood already supplies a portion ofthe Monrovia market for charcoal and firewood, the sustainable yield ofrubber wood from retired rubber trees exceeds the annual demand for wood-fuels into the 1990's and the cash received by smallholders from sellingtheir senile rubber trees can contribute substantially to replanting.
Charcoal Production
7. Firewood and charcoal production and supply is generally man-aged by a large number of smalLholders and entrepreneurs and, despite theconstraints of traditional technology and poor transport infrastructure,the market is supplied adequately and efficiently. The role of govern-ment in woodfuels supply shouLd therefore be in support of the privatesector by providing incentives to use the most economic woodfuel re-sources and to upgrade the efficiency of conversion from wood to char-coal. For example, the carbonisation of retired rubber trees should bepromoted as an integral part of the rehabilitation of the smallholderrubber industry. Similarly, more efficient metal kilns and charcoalstoves offer some prospect of reducing pressure on the remaining closedcanopy native forests within reach of the major urban areas. Finally,with the economic prospects for pulpwood production fading, a case can bemade for evaluating the managed exploitation of the designated Stateforest areas for the production of charcoal for export to countries inthe West African region such as Mauritania, now suffering from defores-tation and desertification.
8. Specific measures arising from the above include:
(a) a resource inventory of smallholder and concession plantationsidentifying the location and quantity of rubber tree woodavailable now and each year over the next decade at least.
(b) expansion of the demonstration project for low cost metal kilnsand the establishment of a credit facility for their supply tosmallholders prepared to exploit retired rubber trees, residuesfrom organised forest clearing and other wastes for charcoalproduction.
(c) mounting a trial shipment of charcoal to Senegal or Mauritaniaas part of a feasibility study to identify logistical problemsand the costs and benefits of the prospective trade.
(d) production and demonstration of improved charcoal stoves fromelsewhere in Africa (for example, Kenya).
9. Other household energy options which appear attractive includethe use of solar water heating and the introduction of a range of moreefficient kerosene stoves. Although both technological improvements

- viii -
offer considerable financial benefits to the indir' lual consumer eventheir widespread adoption would only generate small economic benefit tothe economy in comparison with other options identified here for reformin energy production and supply. Hence, for the time being, Governmentassistance should be limited to modest promotion.
Industrial Energy
10. The manufacturing sector in Liberia is small and unlikely toexpand significantly in the foreseeable future. Individual factoriesappear to have adjusted their energy consumption well to high prices anduncertain supplies. There are no outstanding cases for substitution ofoil by fuelwood as residual fuel oil is already widely used for heat andsteam raising. The enclave sector managers have also implemented manyimportant fuel economy measures in recent years. The two biggest rubberproducers have installed wood-fired boilers and the Bong Mine has fine-tuned process heat and thermal power production. There is, however, anexceLlent economic prospect of substituting fuel oil with fueLwood iniron ore drying at the Bong Mine. The Bong Mine initiated this proposalin 1983 but was unable to attract acceptable tenders for fuelwood supply.The mission was able to define the costs and logistics of fuelwood supplyto the mine and found that annual fuel oil import costs can be reduced byabout US$1.3 million and the BMC can save US$1 million per year usingalready existing but unutilized plantation timber resources. The keyconstraint to the implementation of this fuel substitution option is thatthe Bong Mining Company, faced with the present depressed market for itsore, is unwilling to offer a purchase contract of longer than one year ata time. Avenues should be investigated by which this investment barriermay be overcome including:
(a) a precise definition of the investment required by an entre-preneur supplying fuelwood and by Bong Mining Company, and
(b) the provision by the GOL of risk capital of the order ofUS$500,000 providing a one-year sales contract can be securedwith Bong Mine by the local fuelvood supplier concerned.
Energy Pricing
11. Energy prices in Liberia are characterised by being, cn thewhole, cons,derably higher than the economic costs of production orsupply. For electricity supplied to the MPS, if consumer billing andutility management reforms proposed by the mission are implemented, itshould be possible to reduce tariffs in real terms in the 1986 wetseason. Petroleum products are retailed at 2-3.5 times their borderprices, hence the main pricing consideration is the extent to which gaso-line and diesel taxes are used to generate government revenue. Govern-ment and concession prices for diesel and fuel oil are very close toborder prices and there is a case for slightly increasing the price whichLPRC charges LEC for these products. The matter of serious underpricingof the electricity produced in the isolated power systems supplyingsmaller towns has been taken up earLier in para 5.
- ix -
Institutional Arrangements
12. Energy policy and planning is weak in Liberia, partly as a re-sult of a shortage of staff and experience in the Department of Energy(DOE), and partly because of the isolation of its parent ministry - theMinistry of Lands, Mines and Energy - from the mainstream of decision-making in the Government. No energy sector investment program is pro-duced and hence there is no policy framework for the development of thesector. The existing vehicle for policy dialogue in the sector is theNational Energy Committee (NEC). This body has advisory powers only, andalthough it has served a useful role initially in raising awareness inGovernment of the gravity of the energy problem, and later as a forum forthe ORNL/GOL energy assessment, it is now time to make a transition to awell staffed and equipped full-time energy policy and planning agencyclosely associated with the highest levels of Government decision making.The major energy parastatals - the Liberian Electricity Authority and theLiberian Petroleum Refining Company - make their plans without meaningfulconsultation with each other or the DOE, and promote them to theMinistries of Finance, of Economic Affairs and Planning, and the Head ofState, limiting critical review. Similarly, the Government is unable toadequately monitor the performance of its energy companies because itsdirectors lack both management experience and familiarity with energysector business. The main recommendations here include:
(a) the formation of an energy policy and planning division withinthe DOE separate from any functions of the former Bureau ofHydrocarbons and dissolution of the NEC.
(b) the formulation of administrative procedures which would estab-lish for this division a close advisory reLationship with theEconomic and Financial Management Committee of the GOL.
(c) representation of the head of the energy planning division orthe Director of Energy on the boards of the LEC and the LPRC orits successor.
(d) the provision of at least three full-time high level profes-sionals for the energy planning division plus support staff andtrainees and finance for at least four man-years of trainingper year.
Energy Sector Investment
13. Investment projects totalling US$122 million (Table 5.4), whichinclude about US$80 million in foreign costs, are regarded as economi-cally justified by the mission for the 1984/1993 period. However, thereare such serious short- to medium-term fiscal constraints on public sec-tor investment that this will almost certainly mean that a smallerprogram of high priority investments will have to be adopted. A list ofthe higher priority inwestments is provided in Table 5.3 amounting toUS$72 million. Those in this priority category are urgent and need to be

implemented without deLay. Those in the higher priority category areindicative projects still to be precisely defined by engineering designand costing studies and Least cost planning studies. About 80Z of thisinvestment is required in the power subsector. This reduced programavwerages US$7 million per year compared with a maximum resource availa-bility for public sector investment in the next few years of US$100million p.a., although major investment is believed to be required earlyin the program. The major constraints on public sector investment gener-ally appear to be the provision of the local funds component of majorprojects. Both the LEC and the LPRC could generate sufficient localfunds and a substantial proportion of the foreign funds required tofinance their investment programs provided proposed reforms are made intheir operations. Yet it seems unlikely that significant new donor fundswill flow to the energy sector unless the energy parastatals demonstratea capability to reform, and to restore their own financial viability.
Priority Actions
14. The following are the highest priority activities proposedwithin each subsector, with the likely cost and duration in brackets:
Petroleum
(a) Design, costing and priority ranking in terms of benefit tooperational cost and efficiency of investments required totransfer the petroleum depot from the refinery to the WaterFront area, and to rehabilitate and reconfigure storage andhandling facilities ($200,000, three months).
(b) Procurement of management services to establish and operate theproposed new Petroleum Supply Company for three years and toliquidate the assets of the LPRC ($600,000 per year, six monthsto establish).
Power
(a) Power system efficiency audit to define the investments econo-mically justified in distribution and generation rehabilitationand to review the serviceability of all thermal generatingplant ($75,000, four months).
(b) Procurement of management services to manage and implementreforms in the LEC, including supervision of remetering, dis-tribution rehabilitation, re-organisation of accounting, estab-lishment of effective management information and decision-making systems and high-level management training and develop-ment ($500,000 per year, six months to establish).
(c) Bong Mine-LEC power exchange capacity review to determine thepresent level at which power can be sent in both directions,and the transformer capacity, protection gear and other

xi -
facilities required to facilitate transfer up to 40MW ($30,000,two months).
HaLsehold Energy
(a) Rubberwood and other forest energy resource inventory withinreach of Monrovia and other urban centers (US$100,000, sixmonths).
(b) Expansion of demonstration project for extensive field trialsof simplified metal charcoal kilns (US$80,000, six months).
(c) Charcoal export feasibility study which would also define theprospect of managing the Cape Mount State forests as a sustain-able charcoal resource (US$100,000, six months).
Industry
(a) BMC fuelwood supply and conversion pre-investment analysis(US$50,000, three months).

I. ERGY AND THE ECONY OF LIBERIA
Country Background
1.1 The area of Liberia is 112,000 square kilometers, more thanhalf of which is covered by natural forest. At the end of 1982 thepopulation was estimated to be about two million, with 35% classified asurban. However, the first census since 1974 was completed recentLy andmay reveal a somewhat different demography. The economy is divided intotwo significant and quite discrete sectors, an enclave sector consistingof mining, forestry and rubber concessions dominated by multinationalcompanies, and a subsistence agriculture sector. The latter supportsmore than 60% of the population, and all agricultural activities employclose to 80% of the work force. Industry and the service sector employ7Z and 14% of the work force, respectively. Unemployment is estimated tobe about 15Z of the potential work force and perhaps as high as 301 inthe urban areas. The enclave sectors are the main source of foreignexchange hence the global demand for iron ore, and to a lesser extentrubber and timber, largely determines the economic performance of themodern sector. Iron ore mining alone accounts for about one-third ofCDP, yet the links between this and other sectors are weak, resulting inuneven distribution of the benefits of their produ=tion, and localizedinfrastructure deveLopment. The estimated average per capita GNP in 1981was US$520, whereas the enclave sector produced a per capita CDP ofUS$1,620, and the entire modern sector, US$780. These are in contrastwith a per capita GDP of US$160 per year for the traditional sector.
Trends in Economic Performance
1.2 During the 1960s and early 1970s, the Liberian economy recordedhigh growth rates in CDP, 6% and 4Z per annum, respectiveLy. Thisimpressive performance was due to increasing output and unit value fromiron ore and rubber concessions and indirectly to an improvement in theterms of trade. This period came to an end in the mid-1970s as the priceof oil rose, the demand for iron ore and rabber declined precipitously,and the cost of mining operations escalated. The impact of these adverseglobal trends was exacerbated by poor management of the public sectorwhere the number of unprofitable parastatal entities mushroomed. Between1974 and 1979, GDP growth fell to an average of only 1Z per annum. Signsof economic recovery in 1978 and 1979 turned out to be illusory; growthwas partially the result of only a brief upturn in iron ore, rubber andtimber prices. Also, economic activity was temporarily stimulated by alarge injection of capital for construction of OAU conference facilitieswhich yielded little more in the medium term than an enduring debt ser-vice problem. On top of a declining external demand for enclave product,a revolution occurred in 1980 causing social disruption and ushering in aperiod of inappropriate policies, especially in fiscal management; a

- 2 -
trend that persisted until recently. GDP in the modern sector declinedby an average of 5.6% per annum between 1980 and 1982, compared with 1.1%per annum since 1976, 1/ as indicated in Table 1.1. In contrast to theearly 1970s, the terms of trade also deteriorated, falling by 24.5Zbetween 1978 and 1982. Finally, the balance of payments has deterioratedduring recent years due largely to the ongoing flight of capital. Thecapital account surplus, which was over US$135 million in 1978 (20X ofmonetary GDP), fell to US$6.1 million by 1981 and has been negativesince, illustrating the devastating nature of capital flight folLowingthe rice riots of 1979 and the coup of 1980. On the other hand, thecurrent account deficit narrowed from US$158 million (23.6% of CDP) toUS$44.6 million (6.2% of GDP) between 1978 and 1982.
Energy and the Economy
1.3 Trends in economic performance and the consumption of modernenergy forms over the last 8 years are shown in Table 1.1, and the costof imported petroleum is compared with total imports and exports inTable 1.2. For the most part, the direction of change in these indicesis parallel, with petroleum consumption falling more sharply than CDP,which reflects the relative petroleum intensity of the volatile enclaveeconomy. There is also a close relationship between trends in electric-ity consumption and GDP - a matter discussed again when reviewing thepower subsector in detail (see Chapter III).
1.4 It is evident that, like most other developing countries,Tiberia felt the impact of the oil price rises of 1979-80. The propor-tion of total export earnings spent on petroleum imports rose from alittle over 102 in the mid-1970s to about 25% in the early 1980s. NotonLy is the impact of oil imports on the balance of payments every bit assevere in Liberia as in many other African economies, but because theforeign exchange for the procurement of petroleum products had to comefrom the public sector, the impact of oil procurement on Governmentfiscal and external balance of payments was disastrous. Indeed,financing petroleum imports, together with debt service, have been themost important elements in the Government's external payments problems.Until 1982, cr-de oil was imported by the government and processed at thegovernment-owned petroleum refinery. The prima facie reason for theclosure of this refinery in January of 1983 was the Government's inabi-lity to service the oil facility financed by a consortium of foreignbanks for crude oil procurement. Since that time the country's refinedproduct needs have been satisfied by imports arranged through the former
1/ No accurate estimates of traditional sector GDP have been availablesince 1979. However, assuming that this subsector has been growingat about the same rate as the population, the cumulative decline intotal GDP becween 1980 and 1982 would be about 3.3% per annum.
refinery company and various enclave sector mulcinationals. Oil importsthrough the Government-owned LPRC are still constrained by a shortage ofdomestic revenue and foreign exchange. Indeed, in general, the importcapacity of the public sector is determined by domestic revenue genera-tion, foreign exchange availability or foreign credit established withoverseas banks. As foreign exchange and foreign credit have been con-strained over the past four years, there has been extreme difficulty inmeeting scheduled oil payments. The deterioration in the public sectordomestic financial resources and balance of payments have seriouslyundermined fiscal viability and overall confidence in the economy.
Indices of Change in the Energy Economy
1.5 The Liberian energy economy has been devolving since th late1970s if development in this context is defined as an increasing percapita consumption of modern fuels, i.e., petroleum and electricity.Petroleum consumption declined at more than ten times and electricityconsumption fourfold the rate of decline in modern sector CDP since theend of the 1970s; in per capita terms the rate of decline is evensharper. However, it is likely that the bulk of the population, thesubsistence sector, is relatively little affected by the vicissitudes ofthe enclave sector and its repercussions for urban-industrial produc-tivity and petroleum supply. There is practically no rural villageelectrification and the only petroleum consumption for most households isthe occasional use of kerosene lamps. In the macroeconomic context, de-clining petroleum consumption is now being reinforced by declining over-all imports and, together with real decreases in unit costs for petroleumproducts, should ensure that the burden of petroleum import costs on thebalance of payments is not further increased.
The Present Pattern of Energy Consumption
1.6 An energy balance for Liberia for 1983 is presented in Annex 1.The gross supply of energy to the economy is estimated at 1.3 milliontoe, and final consumption after conversion losses at 0.9 million toe.The pattern of final energy consumption is summarized in Table 1.3 below.Biomass fuels comprise 69% of final consumption, compared with 23% forpetroleum and 8Z for electricity. Almost 8% of final supply is met withcharcoal within the biomass fuel component, and directed almost exclu-siveLy to the urban household market. On a sectoral basis, householdsdominate consumption albeit comprised largely of woodfuels. Mining andtransport consume 10% and 162 of total final energy supply, accountingfor the great majority of petroleum consumption outside of electricitygeneration for public supply, whereas the government, conmercial andestate agriculture sectors consume less than 3% between them.

Table 1,1: TREN0S IN GOP AND MOOERN ENERGYCONSL'PTION, 1976-83
AverageAnnualGrowth
1976 1977 1978 1979 1980 1981 1982 1983 Rate (W)
GOP at factor costUSS million (1971 prices) 357.2 354.2 368.2 384.4 366.2 350.1 328.5 307.1 -2.18
Traditional GDP econ. 73.5 77.2 77.2 78 S. 80 82.4 / 84.9 / 87.7 a/ 2.56Total GOP f.c. (1971 prices) 430,7 431,4 445.4 462.4 446,2 432,5 413.4 394.8 -1.25GOP at Current Market Prices 761.8 872.9 943.7 1067.6 1116.8 1055.4 1063.6 1046,9 4.65Popeilatlon (1000) 1,632 1,690 1,743 1,810 1,873 1,941 2,012 2,088 3.55Petroleum Consumption ('000) n.a. n,a. n,a. 602 609 472 438 422 -9,3Electricity (GWh) b/ 329 339 344 367 364 341 323 308 -0.9 C
Per CapitaGOP f.c. (1971 USS prices) 263,9 255.3 254.7 255.5 238,2 222.8 205.5 189.1 -4.90Petroleum Consumption(Kgoe/year) n.a. n.a. n,a. 333 325 243 218 202 -13.31
Electricity Consumption(kWh/year) 202 201 197 203 194 176 161 148 -4.50
a/ Estimates,;/ Public or LEC Supply only: Generation minus 15S allowance for non-technical losses.
Source: Bank staff and mission estimates and GOL.

Table 1.2: PETROLEUI IMPORTS, RE-EXPORTS,AND TOTAL MERCJWNDISE TRAME, 1976-82
(million S)
1976 1977 1978 1979 1980 1981 1982
Refined Petroelum
Products Crude Oil 53.1 68.7 84.6 103.2 152.1 129,6 94.1
Petroleum Re-exports - - - - - - -
Not Petroleum Imports 53.1 68,7 84.6 103.2 152.1 129.6 115.1
Total Merchandise Imports
CIF 399.2 463.5 480.8 506.5 533.9 477.4 428.4
Non-petroleum merchandise
Exports FOB 457.1 447.4 486.4 536.6 600.4 529.4 477.4
Net petroleum imports/
Total lmorts 13.3 14,7 17.6 20.4 28.4 27.1 26.9
Net petroleum Imports/
Total Exports 11.6 15.4 17.4 19.2 25.3 24.5 24.1
a/ Not considering aviation and marine bunkers as re-imports.
Source: Economic Survey, 1982, pp. 15,20. Annual Report, National Bank of
Liberia, 1982.
Table 1.3: FINAL ENERGY CONSUMPTION, 1983
('000 toe)
Fuelwood Charcoal Electricity Petroleum Total Share
Mining - - 53.1 44.8 95.3 10.7
Other Industry 4.4 _ 2.8 1.6 8.8 0.9Transport _ - - 147.6 147.6 16.1
Agriculture - - 1.9 5.7 7.6 0.8Households 556.2 69.5 9.0 4.5 639.2 69.7
Commerce/Government 12.0 4.2 16,2 1.8
Total 560.6 69,5 78.8 208.4 917.3 -Share (1) 61.1 7.6 8.6 22.7 100.0
Source: Annex 1.

-6-
1.7 In a regional context Liberia has one of the most energy inten-sive economies. Two very crude indices of energy intensity are providedin Table 1.4 for countries in the West African region for which eitherenergy sector assessments have been completed or are underway. Theseindices compare only the use ot modern fuels with total population andeconomic production, and they illustrate well the impact of the miningsector on Liberia's energy economy for it is this activity which distin-guishes Liberia from the other countries for which this comparison ismade. With resource constraints looming and demand projections showingpoor iron and steel prospects, iron ore production in Liberia is certainto decline steadily during the remainder of the century. Therefore, bythe mid to late 1990s, the energy intensity of economic production inLiberia will more closely resemble that of the other regionaL economies.
Table 1.4: ENERGY INTENSITIES OF SELECTEDREGIONAL COUNTRIES, 1981-82
Consumption of modern Consumption of modernGOP per Energy forms per Energy formsCapita capita per unit GOP
(USS) (toe/1,000 people (toe/million USS)per year)
Liberia 520 352 677Ivory Coast 1,200 155 123Mali 150 22 153Upper Volta 250 26 104Benin 380 33 88Togo 320 92 288Senegal 450 66 147
Source: World Bank and mission estimates.
Recent Trends in Power and Petroleum Consumption
1.8 In the first instance, electricity production in the miningsector is about two-thirds of all power generation in Liberia but hasbeen declining rapidly in the past three years. There is an exchangeagreement between the public sector supply and the mines which has aminimal net balance but which effectively reduces the mining sectorspetroleum-based power consumption during the wet season and reduces thecost of the public system's petroleum supply during the dry season (seeChapter III for details). However, excluding mining sales, demand by thepublic at large has been declining since 1980 (see Table 1.1 and Annex14). Within the public supply system almost half of the consumption is bygovernment and commerce and about 40% by households. The contribution ofparastatals to commercial demand for el.ectricity is not identified,

-7-
though it is undoubtedly significant since air-conditioning is the majorload, and these quasi-governmental institutions are numerous and havetheir offices largely within the Monrovia Power System supply zone.Despite the overall decline in sales, it is likely that government con-sumption of electricity, directly or indirectly, has grown substantiallyin line with the growth in Government and parastatal employees since therevolution in 1980. It is also noteworthy that only about half the powergenerated is paid for, implying that roughly 40Z of power actuallydelivered is regarded as being free. When taken together, these observa-tions make the progressive decline in electricity generation and salessince 1980 all the more remarkable. The trends in petroleum product con-sumption year by year over this same period are also indicated in Table1.5. These data show that the most uniform and sharp decline in consump-tion occurred in 1981, the year during which fuel oil consumption felldramatically, reflecting a decline in mining activity. By 1983 thedownward trend for fuels commonly used by the general public and businesscommunity - gasoline, diesel and kerosene - had bottomed out and a smallamount of growth in demand was occurring over a greatly reduced consump-tion base. This recent positive trend in petroleum fuel consumption maybe related to a small resurgence in rubber production in 1983.
Table '.5: RECENT CONSUMPTION TRENDS FOR PETROLEUM AND POWER
Average1980 1981 1982 1983 1979-83- Percentage
Power Sales by LEC -0.9 -6.3 -5.3 -4.2 -4.5
Petroleum Product SupplyLPG -4*9 -10.3 17.1 -2.4 0.6Gasol ine -7.0 -14.4 -2.5 -5.3 -8.0Avgas 0 6.0 -22.6 -2.4 -5.7Jet fuel -28.9 -11.1 0.9 3.6 -10.9Kerosene -8.5 -16.1 -31.7 3.6 -16.5Diesel Oi l -13.3 -21.9 -13.5 5.3 -12.8Fuel Oil 24.3 -26.4 -5.0 -16.9 -8.5
Source: Mission estimates, LPRC, LEC.
1.9 Petroleum end-use in 1983 is provided in Table 1.6. From asectoral perspective the majority of the petroleum fuels used directlyare consumed in transport. Excluding the aviation fuels, 60% of theinternal transport fuel consumption is in the form of gasoline for taxis,light utility vehicles and other forms of public transport centered onMonrovia. Mining is responsible for more than 20% of direct petroleumconsumption divided equally between diesel and fuel oil. Diesel use in

- 8 -
mining is mostly for ore extraction and transport, whereas fuel oil isused for drying ore for pelLetisation. However, when petroleum-fueledpower production is included, the mines become the dominant end-usesector for petroleum. Almost all the power supply to LANCO, the onlyother large iron ore mine, comes from this source. Petroleum fuel usedin mining has, nevertheless, been declining during the 1980s and isexpected to decline further, eventually ceasing in the early to mid-1990sas high grade accessible ore is exhausted. Petroleum is used to generateone-third of the public power supply, and combined with mines and otherindustry generation, is responsible for consumption of over half of totalpetroleum imports. During the next decade there is the opportunity tomarginally increase the share of indigenous hydropower but there will beno significant displacement of oil-fired power generation by hydropowerwithin the next ten years. The consumption of petroleum fuels in thehousehold, manufacturing and agriculture sectors is less than 6% of thetotal used directLy. In industry fuel oil, diesel, and some kerosene areused for heat and steam raising. The manufacturing sector does generateelectricity with diesel to support its operations during outages on thepublic power supply grid, and the lost profits and displaced investmentcapital in ensuring this back-up is sizeable. Upper income householdsused LPG as a back-up to electricity for cooking. However, since therefinery closed, all LPG has had to be imported at a much higher cost.The sharp increase in price and only intermittent supply has caused con-sumption to drop. If public power supply becomes reliable the latentdemand for LPG will also decline and future imports are likely to benegligible in the context of overall petroleum supply. Kerosene is animportant lighting source and is supplied from the Ivory Coast throughunrecorded channels as well as through the port of Monrovia. The demandfor kerosene lighting is largely outside of the urban economy and appearslittle influenced by more global economic trends. Petroleum consumptionin agriculture is mostly in rubber production, with much smaller quan-tities in rice, palm oil, cocoa and other cash crops. Rubber prices haveimproved and the industry is being rapidly revived and expanded inLiberia though with the major rubber factories converting to wood-firedsteam plant, there will be little increase in the direct use of petroleumproducts in the industry outside of transport and power production.
Future Energy Demand
1.10 The prospects for economic growth in Liberia are uncertain,indeed the demand forecasts made by the mission assume that the miningsector will continue to decline and that possibly mining could cease by1993 unless large investments are undertaken to develop new ore bodies;such investments are unlikely to materialize due to the secularly weakdemand for iron ore. Such a prospect would greatly reduce the base andlevel of economic activity and modify the pattern of energy consumptionin future. The energy balance projected for 1993 (Annex 2) is based onthe most likely evolution of iron ore production and the respective minesas best forecast by the Bank's industry Department during the course of

-9-
the energy assessment mission. The key assumptions are outlined in Annex17 and are the best estimates that can be made on the basis of avaiLableinformation on the global steel market. This forecast bears strongly onthe demand forecast for electricity and for petroleum products generally,and consequently bears strongly on the scale and nature of energy sectorinvestment during the next ten years. However, because the major con-sumer in the iron ore sector, BMC, is assumed to remain in productionthrough 1992, assumptions of better prospects for the mining sector donot alter the conclusions materially (BMC's energy demand is five timesthat of LAMCO; see Table 2.2). It is, therefore, quite important to em-phasize that even with a more optimistic view of enclave sector produc-tivity, little change is implied during the 1980s in the overall energydemand and hence in the sector investment program the mission hasdevised. Moreover, no account has been taken in the forecast provided,of the potential savings in fuel oil in the Bong Mine through the use offuelwood (see para. 4.29), which are greater than che entire consumptionfor the NIOC. Similarly, any success in having consumers pay for elec-tricity consumed will tend to depress demand further and this effect hasnot been strongly built into the power demand forecast as projected (only25% of unpaid demand is assumed lost if it must be paid for: Annex 17),and the full impact of this, too, would tend to offset any new demandthrough better-than-forecast performance in the enclave sector. However,as a result of the changes in the forecast of economic prospects and thesectoral composition of production, major shifts are likely to occur inthe fuel mix and the sectoral pattern of consumption over the 1983-84period, rather than in the aggregate level of energy consumption. Themore significant of these are presented in Table 1.7, which is a summaryof selected components of the energy balances for 1983 and 1993 providedin Annex 2.
Table 1.6: FINAL CONSLMPTION OF PETROLEUMPRODUCrS BY SECTOR, 1982
(toe per day)
Gaso- Diesel Fuel PercentageLPG line Avgas Jetfuel Kerosene Oil Oil Total Share
Mining - - - - - 23.0 21.8 44.8 21.5Other Industry - 1.2 - - 0.2 0.6 0.8 1.6 0.8Agriculture 1.2 4,5 - 5.7 2.7Households 0.3 - - - 4.2 - - 4.5 2.2Transport - 70.2 0.6 30.4 - 46.4 - 147.6 70.8Comnercial/Government 0.3 - - - 1.0 2.9 - 4.2 2.0
Total 0.6 71.4 0.6 30.4 5.4 77.4 22.6 208.4 -Share (S) 0.3 34.3 0.3 14.6 2.6 37.1 10.8 - 100.0
Power Production - - - - - 54.4 156.1 203.9 50.3
Total 0.6 71.4 0.6 30.4 5,4 131.8 178.7 418.9 -Share (W) 0.1 17.0 0.1 7.3 1.3 31.5 42.7 - 100.0
Note: Excludes Petroleum DeDot Use.
Source: Mission estimates, LPRC, LEC.

- 10 -
Changing Fuel Mix
1.11 For reasons aLready elaborated above, fuel oil consumption de-clines sharply over the next decade. The decline would be even greaterif an increase in fuel oil fired power generation for public power supplywere not projected. For the foreseeable future fuel oil is perhaps thecheapest source of power generation to meet dry season demand, and tomeet the heat and steam requirements of the manufacturing sector. Thedemand for diesel oil is projected to decline not only through the reduc-tion in mining activity, but because of the more extensive use of fueloil displacing it for power generation as the least cost generation op-tions are implemented. However, diesel oil is the prime fuel for thetransport of manufactured goods, agriculture and forest products, and thereduction in its demand for ore handling is somewhat tempered by thegrowing demand for transport generated by recovery in these activities.A slight expansion in hydropower is anticipated which will displaceprimarily fuel oil, but also diesel oil fired power generation. Thegreatest expansion in supply of any fuel is that anticipated for char-coal, for which demand is seen to be linked with urbanization, and whichwill remain cheaper than its competitors - LPG and kerosene - throughoutthe period. The market for kerosene is small and relatively insensitiveto fluctuations in modern sector performance, as kerosene is predomin-antly used for lighting in rural areas. On balance, the demand for bio-mass fuels will grow slightly faster than the rate of population growth,and their share of final energy consumption will move from 70% to 80%over the period: a most atypical transition that can be likened to adevolution of the energy economy which in most other developing countriesis undergoing a slow but certain transition away from biomass fuels withurbanization and industrialization. The fact that fuelwood resources cansustain this transition, with reasonable management, is in part why thetransition is likely to occur but can be regarded, nevertheless, a for-tuitous characteristic of Liberia's natural resource endowment. Thedecline in consumption forecast for the major petroleum fuels is largelythe result of the projected possible closure of some of the iron oremines. The forecast increase in public power supply of 0.2% p.a. is verylow in comparison with aLmost any other developing country, and againreflects the relatively unique circumstance anticipated of losing a majorsource of wage and salary income in the period. This strong negative im-pact, and the impact on demand of having more and more consumers experi-ence the true cost of their consumption by being forced to pay theirelectricity bills, is only counteracted by growing urbanization and theaccumulation of minimum need for electricity for Lighting, some cookingand other services.
1.12 Sectoral consumption patterns change with the possible loss ofmining and this counteracts any relative growth in transport energy usestimulated by the expansion of economic activity in commercial agricul-ture and forestry. The share of household energy use increases as dis-cussed above, though also as an outcome of the decLine in energy use inother sectors. The net effect of these sectoral and fuel mix changes isthat final energy use per capita shrinks and overall energy use expands

- II -
at less than the rate of population growth through 1993. How decliningoil imports will affect the balance of payments depends, obviously, onthe level of export earnings outside of mining, the price of oil, andmany other factors that cannot be predicted with any accuracy. However,it is clear that the pressure on forests is going to increase dramatic-ally with the annual consumption of wood fuels growing by over one-thirdwithin the decade, and with this demand increasingly concentrated aroundcities and towns. The consequent need for improved forest and fuelwoodresource management is elaborated later in this report.
Table 1.7: SIGNIFICANT FUTURE TRENDS INENERGY SUPPLY AND CONSUMPTION
PercentageChange
1983 1993 Per Year
Major Energ yFormsor Sources CGross Supply)Puel Oil COrO toe) 185.9 38.9 -16.6Diesel Oil ('000 toe) 131.9 76.5 -5.6Firewood ('000 tonnes) 1636.3 2168.7 2.9Charcoal ('000 tonnes) 97.7 158.9 5.0Hydropower (GCh) 283.4 305.9 0.8
Fuel Class (Gross Supgly)Electricity (GWh) -'(public supply) 307.7 302.6 -0.2
Petroleum ('000 toe) 407.2 256.8 -4.7Biomass ('000 twe) 2,488.1 3,558.7 3.6
End-Use Sectors (Final use)Mining 000 toe) 95.3 0.0 n.a.Transport ('000 toe) 147.6 175.2 1.7Households ('000 toe) 639.4 866.9 3.1Agriculture ('000 toe) 7.6 11.0 3.8
Overall Energy Consumption (final use)Per caplta per yearAll Energy forms (kgoe) 438.1 367.9 -1.8Electricity (LEC Supply; kWh) 147.4 102.4 -3.7Petroleum (Kgoe) 99.8 66.6 -4.1
Total Energy ('000 toe) 914.7 1091.4 1.8
a/ Generation less 15% for non-technical losses.Source: Annexes 1 and 2.
Energy Pricing
1.13 The prices of petroleum fuels and electricity on the fonroviaPower System (MPS) are for the most part above the economic costs of

- 12 -
supply. Electricity pricing issues are discussed in detail in ChapterIII (paras. 3.28-3.33) though, briefly, the current tariff for the HPS isa uniform 15 cents/kWh, and the estimated LRMC is a little more than 9cents/kWh for low voltage consumers. Early in 1984 the SRMC for some ofthe thermal generation was above this tariff level, though measures havebeen proposed by the mission which would avoid this in the forthcomingdry seasons when thermal power is required at the margin. The maintariff issues for the MPS are financie.1 rather than economic and have todo with the rate of retirement of the LEC's short term debt, the size ofwhich depends, in turn, on the extent to which present outstandings haveto be regarded as bad debts. The mission has projected LEC's financialperformance under certain assumptions and shown that there is adequatescope for quite steep debt service over the next few years providingmetering, billing and other reforms are implemented (see para 3.19, andAnnex 15). In the GOL's isolated supply systems, revenues provide forless than one-sixth of the SRMC and urgent tariff reform is requiredprior to any further investment in power supply to these areas. A seriesof steps towards levying a more realistic cost-based tariff are providedby the mission in Chapter III (para. 3.33). The issues in petroleumpricing are more akin to those in respect of power on the MPS.
1.14 Petroleum prices and costs for supply to Monrovia are providedin Table 1.8. Border prices to bulk and retail consumers are estimatedin Annex 3, and the build-up of ex-depot prices from the Liberian Petro-leum Refining Corporation (LPRC) is provided in Annex 4. At the retaillevel, prices for gasoline and diesel oil are between 2.6 and 3.3 timesthe economic cost of supply, whereas fuel oil supplied to the manufactur-ing sector in Monrovia is about 2.3 times economic costs. Prices to con-cessions, on the other hand, range from being slightly below the borderprice in the case of fuel oil, to double this level in the case of gaso-line. Concession supply includes that to the Liberian Electricity Corpo-ration (LEC) which, in 1984, was evenly balanced between fueL oil anddiesel such that, on average, the economic price was being paid. In thefuture, as fuel oil becomes the dominant source of thermal power supplyto the public grid, the transfer price between the LPRC and the LECshould reflect full economic costs. Currently this is a rather academicconsideration as the LEC does not pay for the greater part of the oilsupplied by the LPRC. Similarly, concession holders, or the multina-tional companies operating the iron ore, timber and rubber enclaves, areincreasingly supplying their own product, especially fuel oil, hence theonly concern need be the level of cost recovery by the LPRC for the useof its product handling and storage facilities. The mission examined thecharge now levied on the Bong Mine for this purpose ($0.65/bbl) and foundit to be a fair reflection of economic costs incurred. A substantialpart of the ex-depot price for petroleum products is excise duty and,additionally for gasoLine only, a contribution to a "stabilization fund"established by the GOL to finance the debt built up in the Public Sectorthrough delinquency in payment between government departments and para-statals. The Level of excise tax and the stabilisation fund tax is amatter of fiscal policy about which there is ongoing dialogue between theCOL, the IMF and the World Bank. The mission's only observation is that,

- 13 -
unless the LEC greatly reduces unpaid power consumption, and both it andthe LPRC reduce their own excessive operating costs, these fiscalmeasures will not in themselves be adequate to resolve the cycling publicdebt problem. Therefore, the mission urges the COL to enforce the mea-sures outlined in the following chapters which are designed to radicallycut costs, improve operating efficiency, and increase cash flow to bothparastatals.
Table 1.8: PETROLEUM PRICES AND COSTS, MONROVIA, LIBERIA,FIRST QUARTER, 1984
(US dollars)
Ex-depot Retail Concession EstimatePrice Price Price Economic Cost-------- per US gallon -B- Bulk - Retail
Gasoline (Premium) 2.81 3.00 1.89 0.84 0.90Kerosene (Power) 2.33 2.55 1.4' 0.85 0.90Oiesel Oil 2.16 2.35 0.87 0.84 0.90Fuel Oi1 1.67 n.a. 0.68 0,72 n.a.Liquified Petroleum 1.75 2.00 n.a. n,a, n.a.Gas (per kg) (per kg)
Source: Oil Companies, LPRC and mission estimates, Annexes 3 and 4.n.a. = not available/applicable.
1.15 The firewood, fuelwood and charcoal markets are in privatehands and there is fair price competition. Some apparent anomalies inwoodfuels pricing are discussed in Chapter IV whereby prices for firewoodvary considerably across the Monrovia urban area and between Monrovia andits immediate hinterland. However, by and large, the market is operatingwell and supply of these fuels is efficient. Prospects have also beenidentified by the mission for reducing the economic cost of woodfuel pro-duction and exploitation of the natural forest resource by increasing theinformation available to entrepreneurs regarding opportunities to gainaccess to suitable fuelwood, and through offering incentives of creditand other facilities for the use of the least cost resources.

- 14 -
II. PETROLEUN
Background
2.1 The main issues in the petroleum sector are concerned with op-tions for the efficient procurement of refined petroleum products and thefate of the now dormant Liberian refinery. These issues embrace, inturn, the need to resolve serious financial problems threatening the con-tinuity of petroleum supply and the need to greatly streamline adminis-trative arrangements for importing and wholesaling petroleum as part of awider cost reduction program. In order to define a least cost practicalsolution to these problems the mission reviewed in detail the operationsof the Liberian Petroleum Refining Company (LPRC) and examined the physi-cal condition of the refinery and petroleum handling and storage faci-lities. Similarly, in order to better understand Liberia's petroleumprocurement options the mission examined relevant international petroleumproduct markets in the context of projected local demand. This chapterpresents the integration of these analyses of short and longer termissues and options in an attempt to define a strategy to reduce the con-straint imposed by high petroleum costs on Liberia's economic develop-ment.
Petroleum Resources
2.2 There are no known hydrocarbon reserves in Liberia. Potentialpetroleum resources have been identified in small sedentary basins on-shore and in the extension of thiLs sedimentary sequence offshore. In1971, four offshore wells were sunk, all of which proved to be dry,though there were hydrocarbon shows in many of the geological sequencesdrilled. Nevertheless, in line with the interests of the oil companiesconcerned in the global oil market -' che day, these concessions wereabandoned. In 1980, the Bank extended a US$5 million loan to Liberia forpetroleum exploration promotion, including a 2,500 km seismic program inthe offshore prospective zone. The outcome of this project has so farbeen an exploration production agreement between the GOL and Amoco Inter-national which is currently undertaking additional seismic work and pre-paring to drill the first of the four exploratory wells to which it iscommitted. It is obvious that the profile of Liberian energy policy willchange dramatically if economic reserves are established, though even ifthey were discovered this year there is unlikely to be an effect on thecountry's energy supply prior to the 1990s.
Petroleum Product Demand
2.3 The most important factor determining Liberia's petroleum con-sumption pattern is the performance of the mining sector, which accountedfor about 49% of petroleum demand in 1983. The 30% decline in petroleum

- 15 -
product consumption since 1980 has been due mainly to reduced iron oreproduction (Table 2.1). There has been a fall in demand for each productbetween 1979 and 1983; however, some recovery was experienced in jet fueland diesel oil demand in 1983 (see Table 1.5). The pattern of petroleumproduct consumption in Liberia is summarized in Table 2.1. Since 1981,the reduction in petroleum consumption has been in proportion to the de-cline in GDP, with the energy intensity of the modern sector of the eco-nomy remaining virtually sLatic over this period.
Table 2.1: DEVELOPMENT OF PETROLEUM PRODUCTS CONSUMPTION, 1979-83(Mtoe)
1979 1980 1981 1982 1983
LPG 0.6 0.5 0.5 0.6 0.6 a'Motor GasoLine 97.5 90.7 77.6 75.6 71.7Aviation Gasoline 0.7 0.7 0.7 0.6 0.6Kerosene 10.0 9.1 7.7 5.2 5.4 -Jet Fuel 46.0 32.7 29.1 29.3 30.4Cas Oil b// 212.1 183.0 143.0 123.7 131.9Fuel Oil b 234.0 289.5 213.0 202.4 180.9
Total -/ 600.9 606.2 471.6 437.4 421.5
a/ Including estimated quantitites of unrecorded consumption.b/ Includes bunkers on historical basis.c/ Includes refinery fuel on historical basis but excludes the use as
part of LPRC depot operation. Excludes also minor quantities ofnaphtha available when refinery operated, but believed to have beenmainly exported.
Source: Mission estimates, LPRC.
2.4 Projections of Liberia's petroleum requirements over the nextten years have been made on a sectoral basis. These projections arebased on a number of major assumptions regarding future economic growth,forecast iron ore production (see Annex 17), and the overall demand forelectricity through 1993. The macroeconomic assumptions applied are thatpopulation growth will continue to average 3.5% per year, with urbaniza-tion of the population proceeding at about 5.8%, the major proportion ofwhich will be concentrated in Monrovia. GDP is projected to increase at3.2% per year between 1983 and 1985, to decline sharply in 1987, 1988 and1993, but otherwise to grow at 3.4-3.5% per annum. The mining sector'sprojected fuel requirements are summarized in Table 2.2. Petroleum prod-uct demand in 1993 is expected to be 165 Mte lower than that of 1983.Almost 90% of this decline will be due to the fall in fuel oil demand(Table 2.3). Iron ore production is expected to increase slightLy in1985, followed by a reduction in output under the scenario applied as

- 16 -
mining activity falls off at the NIOC and LAMCO mines. The BMC mine isexpected to continue its operation untiL 1992, requiring about 103 Mtoeper year toward the end of the period. The forecast for consumption byfueL type provided in Table 2.3 shows a drastic fall in the proportion ofheavy fuel oil, from about 45% to 152 of petroleum consumption between1988 and 1993, while over the same period gasoline demand climbs fromabout 21Z to 35%, and middle distillates increase from about 31% to 49Xof the total. The very sharp decrease in demand projected for petroLeumproducts between 1984 and 1993 greatly influences petroleum supplyoptions.
Supply of Petroleum
2.5 Up to December 1982, most of the country's petroleum require-ments were met by processing imported crude oil at the Monrovia refinery.The refinery, which was built in 1968 by Sun Oil Corporation, had a sus-tainable throughput of 13,500 barreLs per day. It was operated until1976, when a major fire disrupted operations. The GOL bought the refin-ery from Sun Oil in 1978 and formed the Liberian Petroleum Refining Cor-poration (LPRC) as a public sector corporation to operate the refinerywith the technical and management assistance of a 15-man expatriate teamprovided under a 5-year management contract by Lummus Operating Asso-ciates (LOA) of New Jersey. Since then it has been operated at up to10,000 bbls/day. In December 1982, the refinery was closed following thecollapse of crude oil procurement arrangements (see para. 2.15). Atpresent the LPRC is responsible for all aspects of petroleum supply, withtwo exceptions: (a) the major concessions are permitted direct imports ifthe LPRC price exceeds the "fair world market prices" and (b) the majordistributors and concessions (iron ore and rubber) are allowed to importproducts when the LPRC is unable to supply their requirements. From thebeginning of 1983 alL of Liberia's petroleum product requirements weremet by imports from the spot market. Most purchases were made at thelast possibLe moment due to inadequate procurement planning and diffi-culty in arranging foreign exchange to establish the required credit. Asa result LPRC was regarded often as a distress buyer and frequently paidwell above world market prices. Nevertheless, LPRC retained its virtualmonopoly on the import of petroleum products throughout most of 1983.Because the LPRC could not adequately meet the enclave sector petroLeumdemand the companies concernei 1-egan importing products directly, oftenutilizing their own port facilities. The LPRC charges a handling fee forproducts procured by other companies which are received through its portand storage facilities. In November 1983, LPRC's monopoly on productimports was lifted and all end-users were permitted to import petroleumfuel for their own business operations, although at the same time theLPRC issued a set of guidelines governing the import of products byothers which were not conducive to their participation. Less restric-tive guidelines were subsequently agreed to by the GOL but had not beenreleased by February, 1984.

- 17 -
Table 2.2: MINING SECTOR FUEL REQUIREMENTS('000 toe)
1983 1985 1988 1992
BMC 155.3 161.9 146.6 146.6LAMCO 30.2 35.2 15.3 -NIOC 10.0 11.0 - -
Total 195.5 208.1 161.9 146.6
a/ This is for total iron ore production of 14.6, 15.5 and 7.5 MMterespectively for the years 1983, 1985, 1988 and 1992.
Source: Mission Estimates.
Table 2.3: COUNTRYWIDE PETROLEUM DEMAND FORECAST
----- 1985 -- - ----1988----- ----- 1993…Mtoe X Mtoe X Mtoe Z
LPG 0.5 0.1 0.3 0.1 0.1 0.1Gasoline 76.8 18.2 80.9 20.9 89.6 35.0AvGas 0.7 0.2 0.8 0.2 0.9 0.3Kerosene 5.8 1.4 6.9 1.8 7.8 3.0Jet Fuel 30.4 7.2 36.3 9.4 42.4 16.6Diesel Oil 129.2 30.6 88.4 22.9 76.5 29.9Fuel Oil 178.8 42.4 172.6 44.6 38.9 15.1
Total toe 422.1 100.0 386.21 100.0 256.2 100.0
bbls/day 7,893 7,227 4,800
Source: Mission Estimates.
Port Facilities
2.6 Existing port and product handling facilities are limited. Theproducts terminal can only accept tankers up to about 30,000 DWT with adraft limitation of 32 feet, and 50,000 DWT on a part-laden basis with anoverall length restriction of 700 feet. The existing product jetty isused to receive petroleum products into the Water Front storage tanks(previously owned by Mobil/Texaco), and from there they are transferredvia a four mile pipeline to the refinery product tank-farm from wherethey are shipped to the market by truck. The product jetty is undersizedand it has been so damaged by collisions that it is unsafe. There are
- 18 -
three product lines to and from the terminals to the jetty. Products areusually brought in by multi-compartment tankers of up to 30,000 DWT capa-city and unloaded by ship's pumps to the terminal's receiving storagetanks in the Freeport waterfront of Monrovia, not far from the productimport jetty. The terminals were under lease to LPRC until mid-1983,when LPRC bought them from Texaco. Following the refinery's closure inDecember 1982 about 90% of Liberia's petroleum requirements were importedthrough LPRC's terminal and distribution facilities at the port ofMonrovia and the refinery site. The remaining products were purchasedand imported directly by LAMCO using its own port and storage facilitiesat Buchanan. The total product supplies to Liberia in 1983 averagedabout 8,000 barrels per day (Annex 5 shows the purchase and sales patternfor major users and sectors).
2.7 Products for retail sale within Liberia leave the refinery bytank trucks. These are filled at a 4-bay loading rack located inside therefinery area. Products supplied to the two major consumers, BMC andLEC, are usually delivered from the terminals by pipeline and by rail-road. There is also a small truck-loading rack at the Texaco terminalwhich is not currently in use.
2.8 Of the total products handled at LPRC facilities in 1983, only48% were actually purchased by LPRC, while an additional 44% were pur-chased directly by BMC and the remainder, consisting of jet fuel, wereimported by BP/Mobil and supplied to international airlines. About 70Xof LPRC's petroleum product imports were suppLied to private consumersthrough distribuLor's retail outlets, and 30% were supplied to majorconsumers, the most significant being the Liberian Electricity Corpora-tion (LEC) which was supplied at 'concession' prices (see Table 1.8).Petroleum product consumption in Liberia is spread fairly evenly through-out the year (Annex 6). Diesel oil and fuel oil off-take requirementsare somewhat lower during the rainy season when LEC depends mainly onhydroelectricity. Historical data on the seasonaL pattern of fuel con-sumption in Liberia are quite adequate for forward planning of productpurchases.
Procurement Arrangemer .S
2.9 While LPRC is the principal importer of petroleum products inLiberia, its organizational structure remains that of a refining institu-tion. Indeed, LPRC's management anticipated r'..luming -refining operationsuntil early in 1984, when it began to identify with its new function ofimporting and wholesaleing refined products. Since refining ceased, noattempt has been made to develop expertise specific to product procure-ment. During February 1984, the product procurement function was per-formed by marketing and refinery production managers who had littleexperience in these functions and lacked the specific knowledge of theinternational oil industry required to maximize LPRC's purchasing effi-ciency. For example, LPRC has so far been unable to ensure that its

- 19 -
potential suppliers have an adequate capital base and are able to meettheir commitments. Usually the "lowest bidder" is the only criterion forchoice of suppLier and this approach makes LPRC vulnerable to criticaldislocation of supplies, particularly since it has to operate with mini-mum stocks. Moreover, in the event of default or deficient product spe-cification, the LPRC is poorly placed to seek adequate compensation.
Product Purchasing Performance
2.10 The LPRC procures ga.;oline and diesel oil at intervals of abouta month. The gasoline requirement is around 5,000 tonnes per monththroughout the year, whereas diesel oil consumption is 10,000 te/monthduring the dry season and half of this during the wet season (June-November). Fuel oil is procured in amounts varying between 5,000 and10,000 tonnes under separate tenders as the need arises. Jet fuel andkerosene is purchased in 2,000 tonne parcels in monthly tenders alongwith the gasoline and diesel oil. The mission reviewed all LPRC's 1983product purchases for its own account which included 60.5 Mte gasoline,79.1 Mte diesel oil, 18.1 Mte fuel oil and 5.7 Mte jet/kerosene, cotal-ling 163.4 Mte. The LPRC oDerate- on an extremely tight time schedule,allowing potential suppliers only one week to respond to its invitationsto tender. This limits the ability of suppliers to offer reasonableprices for they usually experience difficulty in locating comparativelysmaLl quantities of product which meet Liberian specifications, in parti-cular, high sulphur diesel oil (1.0% maximum) and high lead content motorgasoLine (2.91 gns/US gallon). The short lead time for procurement alsoprevents suppliers from optimizing shipping schedules by combining move-ments to two or more locations in West Africa to reduce the high freightpremia which result from part cargoes deLivered to Liberia. The refer-ence prices applied here for products delivered to Monrovia are the week-ly averages of the main Platts spot market quotations for Rotterdam andMediterranean cargoes two to three weeks prior ro discharge. Freightcosts for product shipments from these markets are based on prevailingspot market tanker rates for vessels of around 30/35,000 DWT, the predom-inant tanker sizes used for product shipments to Monrovia. In addition,due weight is given to the fact that LPRC can accept only part cargoes invessels of this size and freight premia of up to 20% (US$2/tonne) abovethe spot market level were added for a single port discharge. A compa-rison of the prices actually paid by LPRC for its main product purchasesin 1983 is suunmarized in Table 2.4 below (detailed data are supplied inAnnex 7).
2.11 It can be seen that in 1983, for most of its purchases of gaso-line (94Z) and gas oil (98%), LPRC paid premia which averaged $14 to $15per tonne above the level of the international spot market, while for 6%of its gasoLine and 2% of its diesel oil purchases, LPRC paid extraor-dinary premia of $276/tonne and $333/tonne, respectively. In 1983, theaverage premium paid by LPRC was about $30/tonne for gasoline and$22/tonne for diesel oil. The cost to Liberia of inefficient procurementof gasoline and diesel oil was about US$3.6 million in 1983. It is no-table that the purchasing performance of LPRC showed a marked improvement

- 20 -
through the year. If the local distress purchases are excluded, theaverage premium paid by LPRC falls from almost $30/tonne for both gaso-line and diesel oil in the first quarter to $6-7/tonne by the thirdquarter of 1983. Moreover, LPRC was able to obtain diesel oil in thefourth quarter on a single cargo price estimated at $6/tonne below theassessed international C&F price.
Table 2.4: PREMIA PAID BY LPRC ON 1983 IMPORTS
Motor Gasoline Gas OilMetric Tonnes Average Premia Metric Tonnes Average Premia
($/tonnes) ($1tonnes)
Main Purchases
First Q 1983 11,106 29.4 29,540 29.8
Second Q 1983 19,504 15.4 19,443 10.0
Third Q 1983 15,417 7.2 19,418 5.8
Fourth Q 1983 10,842 6.2 8,929 (6.0) bi
Subtotal 56,869 14.1 77,330 14.7
Local Purchases a/
First Q 1983 2,183 424.1 1,814 333.0
Fourth Q 1983 1,485 56.0 -
TotaL Year 1983 60,537 30.0 79,144 22.0
a/ Small parcels each of around 1,000 tonnes shipped from Freetown(Sierra Leone) and Abidjan (Ivory Coast).
b/ Represents a discount on the assessed C&F international price.
Other Components of the Landed Price
2.12 In addition to the C&F costs, LPRC incurs a number of othercosts in landing product. These are summarized in Table 2.5 and amountto US$16-20 per tonne, or the equivalent of about 7% of the C&F cost.Certain of these costs are imposed by the government, for example, theNational Port Authority (NPA) and consular fees, and are somewhat uniqueto Liberia. Those costs, which are generally incurred in the oil indus-try, include cargo insurance, cargo inspection fees, cargo losses, andappear to be in broad alignment with international market levels. How-ever, demurrage costs couLd be reduced with better procurement planningand more efficient operational practices, and the cost for Letters ofCredit (LC) are substantially higher than oil industry experience and, infact, higher than LC cost for other commodities imported in Liberia.With the exception of demurrage and cargo losses, most of the otherpurchasing experses do not require foreign exchange.

- 21 -
Table 2.5: LPRC's OTHER PURCHASING COSTS(S/tonne)
Gasoline Cas Oil
Cargo Insurance a/ 0.58 0.48Letter of Credit bI 11.25 9.38NPA Fees - Whar age c/ 1.30 1.30Consular Fees d 4.51 3.76Cargo Inspectfgn Fees e 0.08 0.08Cargo Lossea _ 1.10 0.91Demurrage A 0.40 0.40Total 19.22 16.31
at 0.175Z of 110% of the C&F cost. The reason the C&F value isincreased by 10% for the calculation of the cargo insuranceis unclear.
b/ 3.75% of the C&F cost.cl Wharfage charge paid to the National Port Authority for the
use of a facility in reception and delivery of cargo.d/ 1.5Z if the C&F cost payable as a tax to the government but
in practice offset against payments outstanding on governmentoil purchases from LPRC.
el A rate of 8 cents/tonne paid to cargo surveyors at Monrovia../ At the loss factor of 0.365X of the C&F cost as agreed
between LPRC and the "concessionary companies."tI Costs arising through failure to receive cargo within agreed
laytime at the average amount incurred by LPRC during firsthalf 1983.
Final Cost of Petroleum Supply at the Depot
2.13 Although the costs of petroleum landed at the port are alreadyconsiderably higher than expected because of higher than necessary FOBprices, shipment costs, LC costs, and all handling charges indexed to thelanded price combined only add about 13 cents per gallon, or US$43 pertonne, to the final cost whereas the LPRC estimates the total of itsother costs (including its "direct/indirect" costs category) to be 40cents per US gallon, or $132 per metric tonne weighted average over andabove the CIF price for 1983 purchases. These costs are extraordinary byinternational standards, so the mission devoted considerable effort dur-ing fieldwork reviewing LPRC's accounts to better understand the originof these costs and determine a fair cost to undertake this business inLiberia. The results of this review are summarized in Table 2.6 below.

- 22 -
Table 2.6: SIMPLIFIED COMPARISON OF COSTS OF PETROLEUM PROOUCTS
IMPORT AND SUPPLY BEFORE AND AFTER PROPOSED
REFORMS, BASED ON 1983 IMPORT VOLUMES
Total Landed Cost Other Costs Depot Total Cost Per
(C&F) To Import Costs Average tonne
Million US dollars D- -- - MSS --
Estimates of
Actual Costs:
As reviewed
by mission 46.0 2.8 10.5 59.3 363
As estimated
by LPRC 46.0 -- 20.9--- 66.9 409
Estimate of Costs
following Proposed
Reforms 42.3 1.8 2.5 46.6 285
Source: LPRC and mission estimates.
The LPRC accounts are in some disarray so that the data presented herecan only be rega& ded as indicative. However, the contrast which emergesbetween the costs of the present operation and those which should legiti-mately be experienced in receiving, storing and delivering product to thetruck loading rack is dramatic. In order to make this cost comparisonthe 1983 LPRC purchases of 163,400 tonnes of product with the same mix offuels was taken in both cases and it was assumed for the reform casethat: (a) product was landed at estimated international prices; (b) LCcharges were 2% of CaF costs; and (c) aLl the proposed reductions instaff and other cost centers outlined in the chapter were made. Theminimum saving to accrue from these measures is almost US$13 million peryear though this figure is derived from extrapolation of the July state-ment of accounts, which was the only set of monthly accounts available tothe mission. The LPRC's estimate of their costs computes to a muchhigher savings potential of about US$20 million per year. The differencebetween these estimates is less important than the fact that, even incomparison with the Government's recurrent budget, substantial savingsare to be made from reform of petroleum supply and handling arrangements.Although some of the sources of savings have been discussed, or will bepursued in the remainder of this chapter, it is clear that the majorsource of unnecessary costs is the continued operation of the refinery inevery way except actually refining crude. A full refinery staff, includ-ing shift workers, is still employed and many services are provided tosupport them, including transportation and a range of consumables. In-deed, refinery staff have been actively engaged in the installation of

- 23 -
new heat exchange equipment, a crude desalter and pumps. Recommendationsregarding the closure of these cost centres are made in the conclusion tothose sections dealing with the future of the refinery and future insti-tutional arrangements (see paras. 2.26 and 2.27).
Short Term Measures
2.14 Some of the problems encountered in procurement of petroleumproducts can be resolved quickly. The mission recommends the followingmeasures, preferably through the aegis of a management services contract(see para 2.21).
(a) employment of an international purchasing expert with activetrading experience in international petroleum product marketsin the Atlantic Basin area and, if possible, with knowledge ofthe logistics of suppLy to West Africa;
(b) employment of an accountant and financial specialist in thefield of petroleum product procurement and distribution whosemain task would be to completeLy revise the LPRC financial andproduct accounting system;
(c) adoption of an efficient product purchasing strategy andpolicy:
(i) potential suppliers should be notified of Liberia's require-ments at least six weeks in advance of scheduled deliverydates. In order not to pre-empt purchasing options for thelonger term, term purchases should be for three to sixmonths and would have to be available at a discount to spotprices;
(ii) prospective oil suppliers should be limited to those withestablished Bona Fides, offering satisfactory bank guaran-tees, including major oil companies, refineries, state-ownedsuppliers of oil exporting countries, and reputable oiltraders and brokers. Large refineries in West Africa shouldalso be considered.
Financing of Petroleum Imports
2.15 From March 1979 until the refinery closed, LPRC imported crudeoil from Saudi Arabia under a term contract with Petromin. These importswere financed by a revolving letter of credit facility arranged by theNational Housing and Savings Bank of Liberia (NHSBL) in association witha syndicate of 25 international banks. The facility, originally for amaximum of US$75 million, was reduced in 1981 to US$50 million and closedin mid 1982 because NHSBL was unable to accomplish a US$10 millionscheduled repayment on behalf of LPRC due to a lack of offshore
- 24 -
reserves. The termrsupply contract with Petromin was subsequently sus-pended, and during the remainder of 1982 LPRC bought three cargoes ofcrude oil on the spot market before switching at the end of 1982 to im-porting refined products. Currently LPRC's books indicate US$26 millionoutstanding to the syndicate.
2.16 During the first half of 1983 LPRC arranged oil purchases with-out secured credit financing -- a factor which contributed to the highcost of product imports. A new arrangement for financing oil purchaseswas introduced in mid-1983 through Citibank, which was rot involved inthe previous syndicate facility. Citibank provides secured creditfinancing for the majority of LPRC's oil imports, and in return has soleaccess to 5% of the foreign exchange earnings of the iron ore producers.In addition to the provisions of confirmed irrevocable LC's, Citibankrequests of LPRC 100% cash collateral in local funds on the date that LCis opened, and charges for the LC a fee of 3.75% which, on average, hasamounted to an additional cost of $10/tonne for imported products. It isnoteworthy that LC costs for international oil purchases are normallybetween 0.025% and 0.25% of the C&F cost depending on the status of thepurchaser, though a premium can be anticipated for countries experiencingshortages of foreign exchange. Given the dedication of the considerableforeign exchange resources by GOL to Citibank, and the above mentionedcollateral arrangements, there is a prima facie case for renegotiation ofLC charges to a much lower proportion of C&F costs.
2.17 While the Citibank arrangement has significantly improvedLPRC's financial credibility as an oil buyer in the international market,its financiaL situation is still deteriorating, and measures to reducecosts and improve liquidity are urgently required. Indeed, during the1984 dry season, when LEC's demand for oil-fired power generation was atits peak and LEC was unable to pay fully for its oil off-takes, poorliquidity became the LPRC's most pressing problem for it was unable toprovide the local funds necessary to procure products in the requiredshipment size. This problem necessarily preoccupies the LPRC managementand has a debilitating effect on the institution's performance. Asidefrom the unusually high operating costs, premia, and the other chargesnoted above, LPRC frequently encounters probLems of default and long termcreditors, and has accounts receivable of between US$50-$70 million, ofwhich 50% and 30% is owed by LEC and the Government, respectively, andthe remaining 20% is owed by 33 private wholesalers.
Distribution Costs
2.18 Currently the transport of products from the refinery gate toretail distributors is carried out by the Liberian private sector. Theretail distribution at pump stations is also in private hands. Bothfunctions appear to be performed crudely but efficiently. The transportand distribution charges are 10.5% above the wholesale price for theMonrovia region and as high as 16% of the refinery gate price in the moreremote parts of the country. Since this is normally the most cumbersomepart of product supply, requiring efficient administration, the mission

- 25 -
is impressed that the business is being conducted so well and hence seesno reason for change.
Private Sector Role in Product Supply
2.19 From 1968, when the refinery was built, until 1983, the re-finery operator, whether Sun Oil or LPRC, has had a monopoly on oil im-port, refining, and wholesaling. In November 1983, guidelines wereissued which permitted any major consumer to import for their own use.Presently all the product storage facilities in Monrovia are owned byLPRC, with the exception of the BMC 48 Mbbl fuel oil tank, and the down-stream distribution outlets are also privately owned. Therefore, for theprivate sector to conduct the petroleum procurement and distributionbusiness on its own terms without the use of LPRC facilities would re-quire substantial investment. With the possible exception of Mobil,which retains distribution outlets in Liberia, there appears to be Littleinterest among oil companies to invest in product storage and handlingfacilities locally. Indeed, the majors have been divesting themselves ofany significant petroleum supply facilities in Liberia in recent years.BP and Agip are selling their distribution systems to Mobil which hasalready consolidated its retail outlets to a few key sites in Monrovia.Shell is selling its distribution system to Petro Chemical Industries(PCI), a parastatal, and Texaco is reportedly discussing the sale of itsdistribution facilities to LPRC. The prevalent view among internationaloil companies appears to be that any renewed capital investment inLiberia in the area of petroleum import and distribution would be limitedto small amounts for which they would be assured a quick and guaranteedpayback. For example, one oil company representative in Monrovia indi-cated interest on behalf of his company for widespread involvement in thesubsector in return for monopoly control and a government guaranteedprofit margin. Moreover, the limited size of the Liberian market islikely to constitute a major deterrent for the state-owned entities ofthose oil exporting countries which may be prepared to consider foreigndownstream ventures, if only because of their own limited availability ofexperienced personnel. In addition, private oil companies are unlikelyto be interested in fuel oil transactions limited to the mining companiesand the Liberian Electricity Corporation. Therefore, the prospects fornew private sector investment in petroleum supply facilities are limited.
2.20 Nevertheless, private sector participation in product procure-ment and depot management is conceivable and would have a number of im-mediate benefits, such as reduction in premia, lower LC costs, increasedsecurity of supply, the establishment of sound financial management prac-tices, and the provision of urgently needed expertise. The savings anti-cipated from the reduced premia and LC costs alone are estimated to atleast US$3.6 million and US$0.9 million per year, respectively. There-fore, the mission regards private sector participation in petroleumprocurement and depot management as vital and urges the COL to give thematter very high priority.

- 26 -
Options for Private Sector Involvement
2.21 Various options exist for invoLvement of the private sector inLiberia's petroleum industry. These range from long term (3-5 year) mo-nopoly concession to short term service contracts under which experts areprovided to the LPRC (or its successor) to perform specific functions.In line with the mission's recommendation that the LPRC be dissolved andreplaced by a new Liberian Petroleum Supply Company, it seems appropri-ate, as a first step, to invite tenders for a management contract fromoil companies or other firms with the necessary experience in inter-national product purchasing and supply. In the short term it is prefer-able to give considerable authority to the contractor as the reformsrequired are sweeping and the benefit to the country of a rapid transi-tion is substantial. The present management of the LPRC is both encum-bered by the legacy of litigation and poor financial management of therefinery and inexperienced in the business of product procurement anddepot management. However, arrangements should be made to protect thecareers of current dedicated top managers at the LPRC and to ensure thata transition is made to Liberian management by the end of the managementservices contract. The present top managers can also play an importantrole in liquidation proceedings for the LPRC as well as working closelywith the management team gaining the experience to manage the new supplycompany. Thus, the management services contract should also includeprovision for specialized training and on-the-job experience in similaroperations elsewhere. The advantages of such a management contractinclude:
(a) the use of tried and efficient operating procedures based onexperience and similar conditions in other parts of the worldas well as West Africa;
(b) continuity of sound management practices which can be main-tained irrespective of changes in key personnel; and
(c) establishing the new Liberian Petroleum Supply Company on afirm footing with experienced and competent management.
The cost of a management contract is obviously dependant on its precisestructure and the number of staff to be provided. It is proposed thatthe team be composed initially of three persons, one acting as GeneralManager, one as procurement specialist, and one as financial manager.The rost is estimated to be a maximum of $600,000 per year. Thisarrangement can only be effective if it has adequate support at the veryhighest levels of Government.
Product Storage Capacity
2.22 Even though there is ample oil storage capacity in Monroviathis is not all suitabLe for refined products. In the refinery area
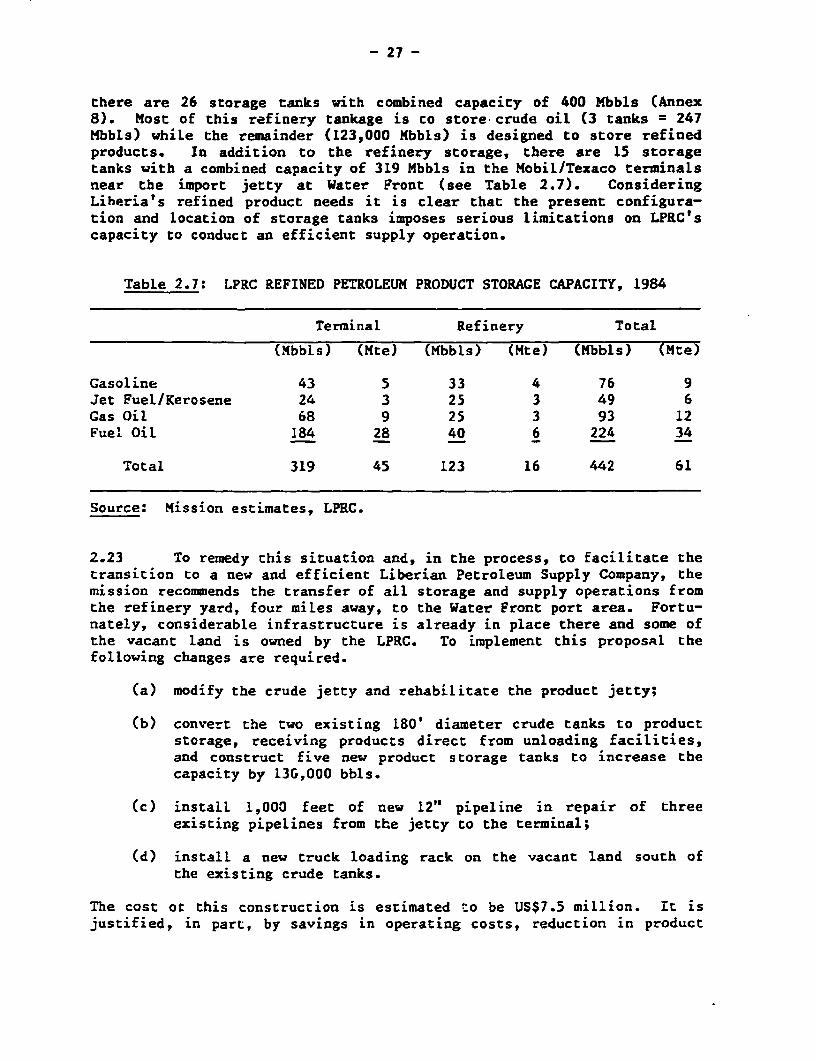
- 27 -
there are 26 storage tanks with combined capacity of 400 Mbbls (Annex8). Most of this refinery tankage is co store crude oil (3 tanks = 247Mbbls) whiLe the remainder (123,000 Mbbls) is designed to store refinedproducts. In addition to the refinery storage, there are 15 storagetanks with a combined capacity of 319 Mbbls in the Mobil/Texaco terminalsnear the import jetty at Water Front (see Table 2.7). ConsideringLiheria's refined product needs it is clear that the present configura-tion and location of storage tanks imposes serious limitations on LPRC'scapacity to conduct an efficient supply operation.
Table 2.7: LPRC REFINED PETROLEUM PRODUCT STORAGE CAPACITY, 1984
Terminal Refinery Total
(Mbbls) (Mte) (Mbbls) (Mte) (Mbbls) (Mte)
Gasoline 43 5 33 4 76 9Jet Fuel/Kerosene 24 3 25 3 49 6Gas Oil 68 9 25 3 93 12Fuel Oil 184 28 40 6 224 34
Total 319 45 123 16 442 61
Source: Mission estimates, LPRC.
2.23 To remedy this situation and, in the process, to facilitate thetransition to a new and efficient Liberian Petroleum Supply Company, themission recommends the transfer of aLl storage and supply operations fromthe refinery yard, four miles away, to the Water Front port area. Fortu-nately, considerable infrastructure is already in place there and some ofthe vacant land is owned by the LPRC. To implement this proposal thefollowing changes are required.
(a) modify the crude jetty and rehabilitate the product jetty;
(b) convert the two existing 180' diameter crude tanks to productstorage, receiving products direct from unloading facilities,and construct five new product storage tanks to increase thecapacity by 13G,000 bbls.
(c) install 1,000 feet of new 12" pipeline in repair of threeexisting pipelines from the jetty to the terminal;
(d) instalL a new truck loading rack on the vacant land south ofthe existing crude tanks.
The cost ot this construction is estimated to be US$7.5 million. It isjustified, in part, by savings in operating costs, reduction in product

- 28 -
losses, fewer demurrage penalties, and increased security of supply. Thepotential savings from reduced product losses alone could be US$2.3 mil-lion annually based on a 75Z reduction to 1% from the present 4Z loss ofproduct landed. The operating costs reduction is estimated to be aboutUS$2 million. Apart from the US$4.3 million potential savings per year,it is clear from the present condition of the equipment that some majorexpenditures will have to be undertaken in order to maintain the importflow.
Parcel Size Limitations
2.24 The parcel size in which products are delivered is effectivelylimited to 5,000-10,000 tonnes by the storage capacity at the terminalbecause of the time required to allow the product to settle in the tankto facilitate cargo measurement, and by limited pumping capacity totransfer products by pipeline from the receiving terminal to the refineryfour miles away. These limitations on parcel sizes have implications forpurchase costs and would be alleviated by the proposed terminal storageinvestments. LPRC should seek to maximize the parcel size of deliveriesin order to optimize purchase prices and freight costs. To achieve thisobjective at present, stocks at the terminal have to be rundown to virtu-ally zero on the day of reception. On these occasions, stocks arelimited to those which can be held at the refinery.
Prospects for Oil Refining in Liberia
2.25 To evaluate the economics of refining in Liberia, variouscrudes, products, and freight cost forecasts were considered (see Annex9). It is concLuded that with continuing surpluses of refining capacityin the OPEC and Atlantic areas refinery margins and processing fees willremain low. Even though there might be an increase in these costs ofabout $1.10/bbl between 1983 and 1990, which would provide an additionaLmargin of US$2.2 million per year to the Monrovia refinery, based onLiberia's anticipated product mix this will not lead to profitablerefining in Liberia for which the estimated loss is over US$5 million peryear. The data provided indicate that international refinery marginswould have to increase from $2.68/bbl to $4.40/bbl by 1993 for theLiberian refinery just to break even. In addition, the mission estimatesthe cost to re-commission the refinery -- with essential efficiency up-grading included - as US$11 million exclusive of crude stocks. In thepresent fiscal climate this capital requirement is prohibitive even if anoptimistic view were allowed of future operating costs and margins.Thus, on the basis of the present outlook, and Liberia's rapidly declin-ing Liquid fuel demand, the mission sees no prospect for a viablerefining operation in Liberia within the next 10 years, and stronglyendorses the GOL's decision to permanently close the Monrovia refinery.This raises the question of the future of the refinery facilities. Twooptions exist: mothballing or dismantling. Since mothballing the faci-lity and reactivating it after 10 years is estimated to cost as much as

- 29 -
US$21 million (see details in Annex 10) with no apparent prospect of areturn on the investment, while scrapping will generate about US$1.5million cash within the next year, the mission recommends that therefinery be dismantled forthwith. Care should be taken to maximize thereturns on salable assets such as new equipment and vehicles by placingthem in storage or otherwise preserving and protecting them pending theirsale. The liquidation of refinery assets should be coordinated with thetransfer of operations to the Water Front location, and the transforma-tion of the LPRC to a petroleum supply company as discussed below.
InstitutionaL Issues and Options
2.26 The mission's review of the management of the petroleum sub-sector has led to the recommendations in para. 2.21 from which it isevident that major restructuring is required of the corporate vehicle forpetroleum supply. Being established only to import and refine crude oil,the LPRC lacks both the orientation and the expertise to manage its newfunctions as a product importer. Moreover, it is burdened by seriousoverstaffing, with a payroll exceeding 480 people. Making due allowancefor Liberian conditions the staff required for present operations areabout 120 and with the refinery dismantled should not exceed 85. Similaroperations elsewhere employ about 50 people. An outline of presentstaffing and the mission's estimates of future staffing requirements isprovided in Annex 11. In addition, there is a legacy of many complicatedlegal and financial problems related to the previous refining activitieswhich preoccupies the LPRC management and limits their capacity to dealwith their present day-to-day responsibilities. It is in view of theabove, and in line with previous recommendations that the mission recom-mends major institutional restructuring of the petroleum subsector by:
(a) liquidating the LPRC, clarifying its objectives, debtors andcreditors, and appointing a commissioner to finalize itsaffairs in the best interests of the State.
(b) Forming a Liberian Petroleum Supply Company (LPSC), with ob-jectives, legal framework, administrative structures and staffappropriate to the efficient procurement and supply of refinedpetroleum products. The management of this company should bevested with the management contractors proposed eLsewhere whowould also be responsible for establishing the new legal andcorporate entity, and effecting an orderly transition to itfrom the LPRC.
2.27 As an immediate step in the direction outlined here the missionrecommends a series of cost reduction measures which were also outlinedin an aide-memoire left with the GOL at the time of the assessment mis-sion. These include:

- 30 -
(a) reduction in LPRC staff from '30 to 120 with a further reduc-tion to a maximum of 85 as the refinery is dismantled;
(b) reduction in other major and unnecessary cost centres such asstaff vehicles and hired buses.
Petroleum Investment and Technical Assistance Requirements
2.28 The mission's recommendation regarding the transfer of o'era-tions to the Water Front terminal locati.n and the establishment of amanagement contract for petroleum supply requires a total investment ofabout US$10 million between 1984 and 1987. More precise information onthe cost of refurbishing and upgrading petroleum handling and storagefacilities will be generated by the required engineering design and cost-ing studies, whereas the precise cost of the management contract, and theexpertise included, will not be known until final bids are negotiated.The foreign exchange component of the investment program outlined inTable 2.8 is estimated to be between 70-80X. There is no doubt that theLPRC, or its successor, can substantially finance the investment programwith surpluses generated by efficient operation under the existing petro-leum price structure. The proposed management contract should quicklytransform the present precarious financial situation of the LPRC into oneof significant resource generation with the important proviso that,simuLtaneously, the LEC and other government and parastatal consumersbegin to pay in full at the time of billing.
Table 2.8: PETROLEUM SECTOR INVESTMENT PROCRAM('000 US$)
1984 1985 1986 1987 Total
1. Management Contract(including procurementand accounting expertise) 80 600 600 600a/ 1,880
2. Capital InvestmentEngineering designand cost studies 200 200
Construction andRehabilitation ofFree Port Terminaland Jetties 1,270 3,750 2,480 7,500
Total 80 1,890 4,350 3,080 9,580
a/ Three years in first instance, extended for five years in all.Source: Mission estimates.

- 31 -
III. ELECTUICITY
Introduction
3.1 Liberia has abundant power resources in the form of hydropowerand biomasp and it is conceivable that petroleum exploration now in pro-gress may add to the existing choices. However, the main issues in thepower sector have more to do with the sustained financial viability ofthe power utility and its technical capability to serve the presentdemand than with the choice between major new indigenous power resources.Of course, there are choices to be made regarding the scale, timing andsource of new generation, and these are addressed fully here, but thesense of urgency that necessarily applies to resolving the power uti-lity's impending financial crisis, and to alleviating persistent andprolonged power outages in the dry season, relegates medium and longerterm issues to a lower priority. Consequently this chapter analyses day-to-day administrative and operational problems at some length. Problemsof unpaid use of power, non-payment of bills rendered, and inadequatemetering and billing procedures and accounting have been studied andcrash programs of rehabilitation proposed. It has been necessary, in anycase, to understand these problems fully as the demand for power inLiberia is highly elastic due to the large number of consumers who eitherdo not pay at all, or who are billed for less than their actual consump-tion. Load forecasts derived with this in mind are quite different fromthose projecting demand based on historical trends in generation. Hencethe elaboration of short term issues and options sets the framework forevaluation of medium to long term choices regarding transmission anddistribution design and development, electricity pricing, co-operationwith the enclave sector, and generation expansion planning.
Institutional Arrangements
3.2 Electricity is generated under the authority of the LiberianElectricity Corporation (LECJ - a statutory corporation in which theGovernment of Liberia is the sole shareholder. The corporation wasestablished by legislation in July, 1973, as a subsidiary of the PublicUtilities Authority, but became autonomous when the Authority was dis-solved in February, 1976. There is no legislation relating to the LEC ofthe type normally associated with a public utility whereby purpose, func-tions, rights, obligations and service standards are defined. Theabsence of a clear right under law for the LEC to penalise for misappro-priation of its goods and services has proven to be a significant defi-ciency. The LEC is nominally responsible for public electricity supplythroughout Liberia, though the great majority of its staff and otherresources are dedicated to the Monrovia Power System (MPS). There arenine small isolated power systems operated for the government by an orga-nization loosely integrated with the LEC in that it occupies the same

- 32 -
premises and reports ultimately to the General Manager of the LEC. How-ever, its budget is supplied directly by government and its staff, in-cluding all technical personnel, are government employees. The LEC doesnot charge an overhead fee to the government for the use of its premisesand management services, There is also a substantial self-containedgeneration capacity operated by the enclave sector and many small privateindustries, businesses and the like maintain their own generation faci-lities either as a back-up to public supply or as their main powersource. Finally, there is an important power exchange agreement betweenthe Bong Mining Company and the LEC which will be discussed below.
The Power System
3.3 The population served by public power supply is estimated to beabout 150,000, or about AZ of the popuLation, whereas the population re-siding within supply areas is of the order of 400,000. Average percapita consumption in 1983 was about 148 kWh/person which is high byregional standards. The distribution of installed capacity by type isprovided in Table 3.1. LEC has almost half the total installed generat-ing capacity, including 94% of the hydropower capacity in Liberia. Themining sector has 43% of the installed capacity, other major industries4Z, and the COL's rural system represents 4% of the total. The scheduleof LEC's generating pLant is provided in Annex 12, and that for theisolated rural systems in Annex 13. Hydropower comprises only 18% ofgenerating capacity, which is dominated by fuel oil-fired low speed (150-160 rpm) diesels. The main power plants are marked on the accompanyingmap, which indicates that power supply is concentrated in the south-western coastal zone. Actual power production data are not available forall of the enclave sector and from private generation. Moreover, thedata gathered for selected companies and activities are limited to recentyears. An estimate of total power generation in 1983 is provided inTable 3.2. Approximately 1,040 CWh were produced in 1983, with themining sector contributing 60%, LEC about 35% and the small publicisolated systems and other private sources generating about 3Z each.Hydropower comprised 26%, and heavy fuel oil generation 65% of the total,with gas turbines and medium and high speed diesels producing about 5Xeach. Liberia is one of the few countries in the world where low speeddiesels operating on fuel oil supply the majority of electricitygenerated. Historical trends in generation are available only for themain grid. These data are presented for 1970 through 1983 in Annex 14,and a summary is provided in Tible 3.3. Whereas generation for the mainpower system has grown at a rate of 2.1% since 1970, sales have grown byonly 1.2% per arnum. This reflects perhaps the most serious problemfacing the Liberian public power system: steadily growing and nowextraordinarily high losses. Since 1970, losses as a proportion of totalgeneration have grown at about 5% per year, and are reported in two waysin Table 3.3; as a proportion of total generation, and as an estimate ofthe losses on the system excluding the component of supply made at highvoltage to the BMC, which is the estimated loss on the pubLic power

- 33 -
system (referred to as 'real' losses). LEC's generation has fallensteadily since 1979 at an average rate of 4.5% per annum, and overallsupply to the Monrovia Power System (MPS) has declined by 1.8% perannum. Throughout this period real losses have remained at an average of35Z of generation. Similarly, sales to the public have fallen by 1.7%per annum presumably under the influence of the changing politicalcircumstances in 1980 and the global recession following the 1979/80 oilprice rises. On the other hand, sales to the Bong Nine, though only lOZof generation, have increased by over 12Z from the beginning of theperiod. The decline in saLes is surprising considering that so manypeople do not pay for their electricity and it can only be concluded thatthe cost of using more power, i.e., the cost of additional appliances andlights, is a significant deterrent for most of the consumers concerned.The table also indicates that BMC has supplied power to the grid since1981, and that this supply had increased five-fold by 1983. This supplyis the result of an exchange agreement between LEC and BMC in April 1981in terms of which for every 1.3 units LEC supplies BMC -- with outputsurplus to LEC's requirements in the wet season - BMC supplies LEC 1.0units in the dry season. This agreement is highly desirable to bothparties and has been successfully operated to date. The possibleexpansion of this co-operation is discussed below as one alternative inmeeting future demand on the MPS (see para 3.22).
Table 3.1: INSTALLED CAPACITY OF ELECTRICAL GENERATING PLANTIN LIBERIA, 1983 (MW)
Hydro- Diesel oil-fired plant Fuel-oil Firedpower Gas Turbines Diesel Diesel Plant Total I
I, Public Power SysteusLEC 64.0 68.4 12.3 42.0 186.7 49GOL IsolatedGenerating Systems 16.5 al 16.5 4
II. Private Power Systems(a) Mining Sector
BMC g5*0LAMCO 63.0NIOC 8.0 -Subtotal 166,0 43
(b) Refinery (LPRC) 2.4(c) Firestone Rubber 4.0 2.0(d) Other 8.0Ž'
Subtotal 16.4 4
Total 68.0 68.4 41.2 208.0 385.6Percent 17.6 17.7 10.7 54.0 100
a/ 4.5 MW not yet in service but included here.b6 Estimates based on mission and ORNLlUGOL opServations
Source: Mission observations and ORNI/GOL assessment.

Table 3.2: ESTIMATED POWER GENERATION IN LIBERIA, 1983 (GWh)
Dlesel-oll Fired Plant Fuel-oil Fired PlantHydro- Gas- Medlum to High Speed Low-Speed
Public Power Systems power Turbines Diesel Engines Diesel Engines Total Percent
LEC 262,3 47.0 5.5 47.2 362,0 34,8GOL Isolat2V GeneratingSystems - 26.9 26,9 2,6
Private Power SystemsMining Jector
BM bt S 02,1LAMCO co 98,7
- NIOC cl 17.5
Subtotal 618.3 59,5
Refinery d 3.2Flrestgqe Rubber 19,6 2,4Other - 7.0
Subtotal 32,2 3,1
Total 281,9 47,0 45.0 665.5 1039.4Percent 27.1 4.5 4.3 - 64.1 100.0
a/ Estimates are for 1982-83.i/ Extrapolated from actual records for Jan-Sept, 1983, Note that 3 GWh of this production Is with
dlesel oil as part of normal start-up operations.cl Based on LPRC 1983 Import records and personal communicatlon with LAMCO. Note that 37.9 GWh of
LAMCO, and possibly all of NIOC generatlon was to be produced with diesel rather than fuel oll In1983, and Is taken up In this way In the energy balance (Annex 1).
d/ Assumed at 10% plant factor on total Installed capacity.I/ The proportion of power generation which was produced from diesel oll In low speed engines as
opposed to medium/high speed diesel engines Is 105.
Source; Mission Review and ORNL/GOL energy assessment.
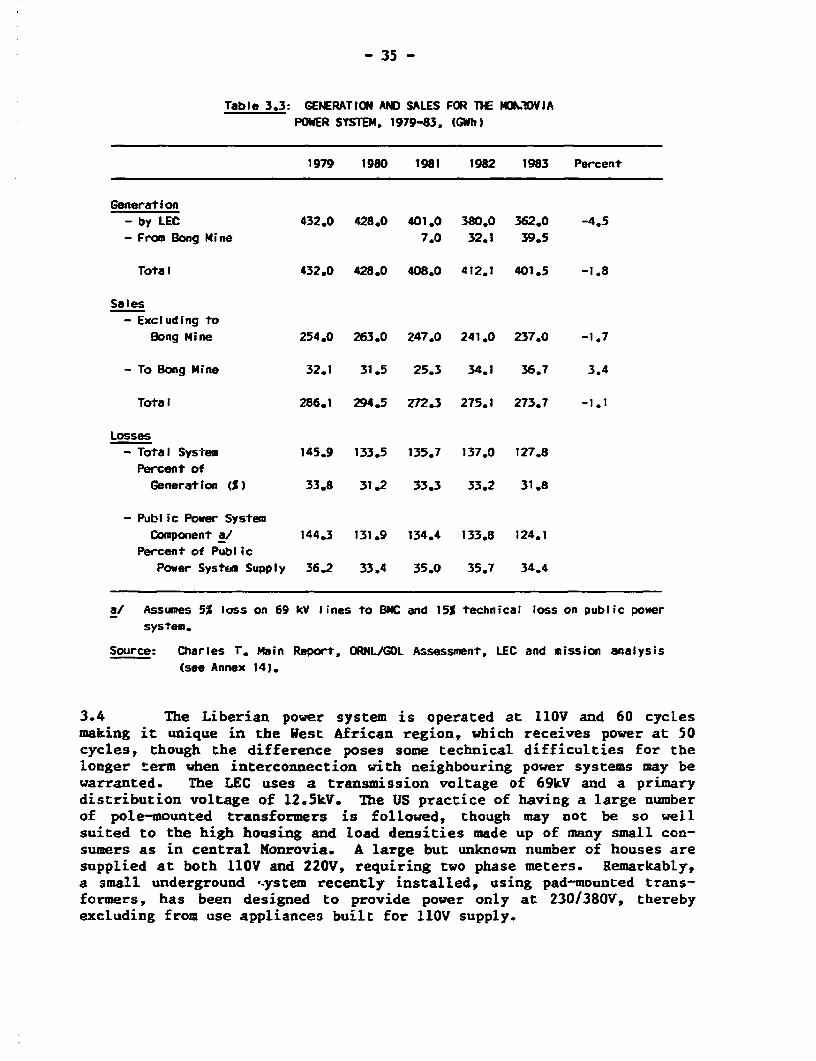
- 35 -
Table 3.3: GENERATION AND SALES FOR THE MOLOVIA
POWER SYSTEM, 1979-83, (GVh)
1979 1980 1981 1982 1983 Percent
Generation- by LEC 432.0 428.0 401.0 380.0 362.0 -4.5
- From Bong Mine 7.0 32.1 39.5
Total 432.0 428.0 408.0 412.1 401.5 -1.8
Sales
- Excluding to
Bong Mine 254.0 263.0 247.0 241.0 237.0 -1.7
- To Bong Mine 32.1 31.5 25.3 34.1 36.7 3.4
Total 286.1 294.5 272.3 275.1 273.7 -1.1
Losses- Total System 145.9 133.5 135.7 137.0 127.8
Percent ofGeneration (S) 33.8 31.2 33.3 33.2 31.8
- Public Power SystemComponent a/ 144.3 131.9 134.4 133.8 124.1
Percent of Public
Power System Supply 36.2 33.4 35.0 35.7 34.4
a/ Assumes 5% loss on 69 kV lines to BMC and 15% technical loss on public power
system.
Source: Charles rT Main Report, ORNL/GOL Assessment, LEC and mission analysis
(see Annex 14).
3.4 The Liberian power system is operated at 11OV and 60 cycles
making it unique in the West African region, which receives power at 50
cycles, though the difference poses some technical difficulties for the
longer term when interconnection with neighbouring power systems may be
warranted. The LEC uses a transmission voltage of 69kV and a primary
distribution voltage of 12.5kV. The US practice of having a large number
of pole-mounted transformers is followed, though may not be so well
suited to the high housing and load densities made up of many small con-
sumers as in central Monrovia. A large but unknown number of houses are
supplied at both llOV and 220V, requiring two phase meters. Remarkably,a small underground .ystem recently installed, using pad-mounted trans-formers, has been designed to provide power only at 230/380V, thereby
excluding from use appliances built for IlOV supply.

- 36 -
Short Term Problems
3.5 The LEC is currently plagued with problems of liquidity and in-ability to meet demand during the dry season. These problems necessarilypreoccupy the management and technical staff and have a debilitatingeffect on the organization to cope adequately both with planning of anykind and with routine operations and maintenance. Without solving theseproblems the long term viability of the organization is seriously indoubt. When demand cannot be met it is not only the credibility and thefinances of the LEC that are affected but economic production in thesupply region, too. One minor consequence of prolonged outages is theneed for private back-up generation. In the first few months of 1984this was costing manufacturers in Monrovia alone an additional $100,000.However, when for similar economies it has been possible to quantify theeconomic loss due to supply disruptions, estimates of about $1/kWh notsupplied have been common. Therefore, the mission believes that thehighest priority should be given to measures for establishing full yearround supply and restoring the LEC's financial viability.
Current Financial Status
3.6 LEC levies a uniform tariff of 15 cents/kWh, though the missionestimates the cost of supply in 1983 to be 9.7 cents/kWh, including in-terest and depreciation. Under normal circumstances this differentialbetween cost and tariff would generate a substantial surplus. However,based on the unaudited income and expenditure statement for 1982/83, theLEC incurred a loss of $2.7 M (see Annex 15). The projected accumulatedloss for 1983/84 is $4.8 M, though it could be higher still for it is un-clear how fuel expenditure brought forward from 1982/83 has been treated,and the additional cost of fuel due to failure in hydropower supply hasnot been taken into account. The mission also had difficulty determininghow much of the consumer outstandings were indeed collectable, and whatinfluence bad debts would have on profit and loss when ultimately acknow-ledged. As of November, 1983, outstandings amounted to $43 million, rep-resenting some 14 months of sales. Of this Government, Public Corpora-tions and street lighting billings were US$4.7 million, US$7.5 millionand US$3.6 million respectively, leaving US$27.2 million outstanding fromthe general public. On the other hand, the LEC owed the LPRC about US$17million for fuel purchases, a sum which includes the cost of fuel con-sumed by the isolated generating stations, despite the fact that they areowned and funded directly by government. Interest charges on the LPRCcomponent of the LEC debt now amount to $300,000 per month.
Liquidity
3.7 In early 1984, the LEC was faced with a severe liquidity prob-lem and it was not clear that the situation would be readily resolved.Credit to government corporations is now being reduced as part of a widerprogram of fiscal control, giving LEC less flexibility than it previouslyenjoyed. LEC's liquidity is normally a function of the seasonal natureof hydropower supply, such that during the wet season when hydropower

- 37 -
generation meets almost all of the demand, the cost of sales is very low,and cash surpluses are generated. The reverse occurs in the dry seasonwhen oil-fired generation is required and the cost of fuel purchases,added to other operational expenses, can exceed monthly income. Up until1984 the LPRC was able to finance LEC's fuel purchases during the peak ofthe dry season, gradually becoming a major creditor, without jeopardizingits own financial viability. Now LPRC is suffering severe liquidityproblems of its own, which are compounded by the sudden increase in thelevel and cost of the LEC dry season petroleum fuel requirement. Due tothe serious damage of one of the newest fuel oil fired slow speed dieselunits in February 1984, and to minimal useable flow in the St. Paul Riverat the Mt. Coffee hydropower plant, the substantial deficit in powersupply has to be met by very inefficient diesel oil-fired gas turbines.The LEC's fuel costs were about US$1.5 million in February and March, andwere anticipated to be US$2.7 million if full supply were restored withthe use of gas turbines. However, the maximum monthly payment the LEChad been able to make was $700,000.
Non-Technical Losses
3.8 LEC's financial problems stem fundamentally from non-paymentfor power consumed. Of every 100 units generated 15 are lost for tech-nical reasons; one is used "in-house", including free electricity foremployees; 20 are consumed but unaccounted for; 16 are billed but notpaid for; and 48 are billed and paid for. The records on consumption andconsumers are, however, in disarray and the data presented here are themission's best estimates drawn from a range of often contradictorysources within the LEC itself. The LEC has about 33,400 consumers on itsbooks, of which between 5000 and 7000 are "inactive" depending on whichrecord within the LEC is accepted as accurate. Of the total it isassumed that about 9000 are without meters, a result of either unrecordedconnection or connection of supply without a meter pending its installa-tion. As a result of unmetered legal supply, and tampered, hence faultyor inoperative meters, some 14,000 out of about 28,000 bills deliveredeach month are estimates of consumption, in many cases having very littlerelationship with actual consumption. Estimates of consumption by meterreaders are very frequently contested by consumers, often with goodreason and this, combined with the considerable inconvenience suffered inhaving bills reviewed, is the major source of consumer disrespect for theinstitution. In the mission's view, regardless of past failures, it isunrealistic to ignore these dire immediate financial and administrativeproblems and to proceed despite them to define further major investmentprograms. Accordingly, a number of urgent measures to address theseproblems are outlined below.
Reducing Non-Technical Losses
3.9 Unpaid use of power is widespread. Large commercial and smalldomestic consumers alike tamper with or remove meters and avail them-selves of services offered by appropriately skilled operators to ille-gally reconnect power supply disconnected for non-payment, or to pay less

- 38 -
than the the cost of actual consumption to a third party to maintainunpaid, or unbilled, supply. For example, disconnections numbered about29,000 in 1983: as many as there are consumers. Obviously, consumersdisconnected do not remain without electricity for long, yet the level ofoutstandings does not reflect major payments by delinquent consumers inthe course of their re-supply. These practices are encouraged by theabsence of effective controls, inappropriate administrative arrangementsfor metering and billing, and poor design of meters and distribution atthe consumer level.
3.10 LEC management has frequently and legitimately bemoaned theirlack of legislative power to impose significant and swift penalties forunpaid use of power, or for conspiring to extract power without payingfor it. Currently, the only resort the LEC has to the courts is throughcivil litigation. Whenever LEC proceeds against a consumer through thesechannels the action takes up to a year to be heard and the penalties, ifawarded, are minimal. The single most important measure now required toassist in the recovery of outstandings and to reduce theft of power isnew legislation to enable the LEC to swiftly impose major penalties onoffenders. It is the mission's view that without the co-operation of thegovernment and the courts at the highest levels the success of otheradministrative and technical measures proposed here is doubtful. Onemeans by which new powers of enforcement may be applied is described inAnnex 16, which outlines a set of draft regulations and procedures forcollection of outstandings, re-connection and metering. These regula-tions are only indicative of the kind of changes required; hence, somefine-tuning may be necessary. For example, it is most important not toalienate the honest consumer who pays regularly.
3.11 The administrative arrangements for accounting and data pro-cessing can be greatly improved. The Commercial Department handles allmetering and billing as well as disconnection and reconnection, therebyexposing itself to collusion and corruption. The records of the DataProcessing Unit and the Commercial Department frequently do not agree.For example, data processing does not distinguish between a debtor, aninactive consumer and an active paying consumer, and even its recordsvary greatly from one day to the next. Furthermore, the CommercialDepartment has no direct access to computer terminals and printers,hence, even if the record was appropriately organized, it takes severaldays to respond to a request, such as in the case of a consumer query,when the information should be available on-line. The organization ofmetering and billing needs to be completely revamped to be compatiblewith an environment in which there is no reliable mail or telephonesystem. The mission has identified a set of near term objectives andmatching procedures and regulations which would have the effect of re-ducing the invitation to corruption, ensuring payment for service, andrestoring consumer confidence in the metering and billing process. Thesehave been forwarded to the government and are summarised in Annex 16.Key modifications to existing practices embodied in, or required by,these proposed regulations and conditions of service are as follows:

- 39 -
(a) Use of Computers: terminals and printers should be supplied tothe Commercial Department, facilitating direct and immediateaccess to consumer records; cash registers should have directinput to the consumer records; and the capacity for rejectionof a consumer billing if it falls outside of preset norms forthat consumer should be re-activated.
(b) Meter Reading: bills should be made out and left at the pre-mises for all bills up to a certain agreed limit in value;bills specifying the last reading and payment details could beprepared in sequence of meter reading route in advance and thecopies returned for verification by computer after the billing;there should be a totally independent random sample check madeof billings, including field visits, by the Energy MonitoringUnit.
(c) Disconnection and Reconnection: should be separated from theCommercial Department and placed under the Distribution depart-ment until the commercial department is totally re-organizedand the appropriate checks and balances are in place.
Cd) Surcharges and Security Deposits: surcharges should be leviedfor late payment; substantial security deposits should be re-quired of frequently delinquent consumers; interest should bepaid on such deposits.
Privatization
3.12 Privatization of a component of the metering and billing systemshould be considered as one means of increasing collection and reducingillegal consumption. Under the arrangement envisaged a private companywould contract to read the meters, prepare bills, make collections andnotify and monitor follow-up on disconnection and reconnection, workingon a fee plus percentage of the collections basis. The interface betweenthe LEC and such a company, and the necessary checks and balances, wouldhave to be designed carefully, though the mission recommends a pilotoperation.
Reducing Technical Losses
3.13 The design and construction of the distribution system influ-ences both technical and non-technical losses. While this section dealsprimarily with the former it is noteworthy that the present design facil-itates uncontracted extraction of power, and this should be explicitlyrecognized in any redesign. For example, overhead services terminatingon buildings are rarely mounted at sufficient height to minimize inter-ference and there is no means of disconnecting services at the pole with-out removing the entire service drop. The distribution system suffersfrom poor conductoring, overloaded transformers and poor connections.There is evidence of poor power factors and, of course, there is a con-fusion in design codes with the simultaneous introduction of llOV, 220V

- 40 -
and 380V supplies, with both overhead and underground distribution. Themission therefore recommends the following measures:
(a) Meters: the design and installation of secure tamper-proofmeters. These could be possibly lockable and weather protectedwith a window to permit counters to be read without having toopen the enclosure, although numerous options should be evalu-ated. This exercise to be integrated with the implementationof the metering component of the AfDB transmission loan andcould be completed within three years.
(b) Unmetered Supply: a review. of the prospects for tamper-proofload limiter moderated supply without the use of meters forvery low level consumption, and the use of a flat monthly fee.For example, for consumers in the range of 0-10 kWh/month,using power only for lighting.
(c) Distribution: a thorough review of the distribution system toensure that transformers are suitably placed and loaded, re-placing faulty poles, conductors and service drops, and fittingline taps in the many places where conductors are merelytwisted together.
'd) Design criteria: establishment of new distribution design cri-teria consistent with the need to reduce both technical andnon-technical losses.
Implementation
3.14 Both (a) and (b) can be achieved in the course of a power sys-tem efficiency audit and follow-up. The mission believes that such anaudit is of the highest priority and accordingly offered to have the workundertaken at no c:ost to the LEC within four months as part of the jointUNDP/World Bank Energy Sector Management Assistance Program. The outcomeof the study would include a project proposal for financiers and donors.However, there is much that can be undertaken immediately to improve theefficiency of energy transfer in the distribution system and to mitigateillegal extraction of power. The mission found the Distribution Depart-ment to be the best administered and technically most sound of the LECdepartments, though it is quite unable to accept the additional responsi-bility of remetering and rehabilitating the consumer level distributionsystem. The mission therefore recommends the procurement of skilled andexperienced expatriate services to help the existing staff implement therequired program of rehabilitation, and to establish the operational pro-cedures and staff units to implement the measures arising from theimpending power system effiency audit. This project should include therevision of consumer billing and accounting, establishment of therequired checks and balances to frustrate corrupt practices, and regis-tration of all supply points and new meter instalLations arising fromimplementation of the rehabilitation program. At least two engineers andan accountant cum EDP specialist will be required for an iLitial contract

- 41 -
period of one year. This project is a candidate for technical assistancethough if necessary it should be financed by the LEC to avoid delay inits implementation. Alternatively, these services could be incorporatedinto a management services contract for the LEC as a whole (see para3.36-3.37).
3.15 The economic benefits of distribution rehabilitation are likelyto be substantial, though without the benefit of a thorough audit theycan only be crudely estimated. The mission accepts the estimates made byothers that energy losses between the busbar and the consumer are of theorder of 15% of gross generation. Technical losses for the compact MPSshould not exceed 10-12%. It is beLieved that for an investment ofseveral million dollars, comprised substantially of local skilled labourinputs, savings of, say, 3% of energy sent out, or 10 CWh costing$500,000 per year in fuel alone, can be achieved.
Efficient Use of Electricity
3.16 There is ample opportunity for the government acting unilater-ally to reduce substantial energy wastage and expenditure in its own andits parastatals' operations and in public services. Such measures aredoubly important when the LEC is not paid by government for its consump-tion, and when services to economically productive sectors are beingcurtailed due to overall supply constraints. Two prospects for savingsstand out: air-conditioning and street lighting. Government offices arecharacterized by window air-conditioners running full-time in rooms withwindows open and in locations where ceiling fans could provide thermalcomfort at a fraction of the cost. A recent ORNL study indicated thatsavings through insulation and sealing of offices would probably be fewas air-conditioners had to operate at full load in any case. However, itwas clear that theLr cooling effect is often minimal and that the powerconsumed is wasted. Government consumes 14% of public power supplies andthe commercial sector, which incLudes the many parastatals, 38%. Assum-ing air-conditioning comprises 70% of government consumption and thatparastatals are responsible for 40% of commercial consumption and havethe same end-use pattern, air conditioning in government and parastataloffices consumes about 20% of public po'ier supply, amounting to 45-50GWh/year. Even a reduction of one quarter of this amount means financialsavings of about US$2 million/yr and a reduction of 3% of power sales.The mission recommends -- complete survey of air-conditioning units andloads in the public sector leading to z. plan for a significant reductionin window air-conditioners, and the introduction of ceiling fans, andbuilding modifications for shading, cross ventilation and similarmeasures. An incentive-based system should be devised for rewardingbuilding energy managers for reductions in office energy use in thecontext of conservation guidelines issued as a result of the proposedreview. In addition, an important code of enforceable minimum energystandards should be devised and applied for all cooling appliances, in-cluding air-conditioners and refrigeration equipment.
- 42 -
3.17 Street lighting in the Monrovia area is poorly organized andmaintained. Many lights are on day and night, and lights are operatingin areas remote from any conceivable need. Finally, where there is aneed, lighting is energy intensive in relation to new high efficiencytechnology. Street lighting is not normally a candidate for significantsavings though this appears to be contradicted in Liberia where it repre-sents 23% of the Government's debt to the LEC now amounting to US$15.6million. The mission recommends a complete review of street lightingwith a view to reduction and rationalization. Poles and lighting fix-tures in use on roads in areas remote from population centers should bedismounted and stored and the circuits feeding them de-activated. Thefirst stage of this review can be incorporated in the power efficiencyaudit study (para. 3.14).
Electricity Demand Projections
3.18 During the past three years several consulting engineeringfirms have produced load forecasts for the Monrovia Power System. Allhave been based on historical records of doubtful accuracy and haveassumed a relatively prosperous economy during the 1980s. None seriouslyconsidered the prospect of collapse for the iron-ore enclave sector andits serious economic repercussions. As a result, highly optimisticforecasts of growth have been promoted and the impression cultivated thatmajor new hydropower generating facilities are required to serve a bur-geoning demand. Charles T. Main derived growth rates of from 7% to10.75%, Sofrelec from 3.3% to 5% and the AfDB adopted LEC's projection of5%. Only the ORNL team included sensitivities in their demand forecastsconsidering the very low growth scenarios that now appear likely. Themission's forecast has been made with the benefit of both a better esti-mate of generation and saLes for 1981-83 inclusive, and a revised WorldBank projection of economic growth in the light of the very depressedmarket for iron ore. The data presented in Table 3.3 and Annex 14 showdeclining sales since the change of government in 1980, and they show aclearcut relationship between GDP growth and electricity sales for thetime series available. The mission's load projection is based on anintegration of GDP projections and certain critical assumptions aboutreform and financial recovery within the LEC. These assumptions, whichare listed in Annex 16, include improvements in payment, reduction inunpaid use of power, improved maintenance of thermal plant, an expandingexchange/supply arrangement with the BMC (and use of its facilities afterthe mine closes) and a tariff reduction in the wet season from 1986 on-wards. Although a considerabLe reduction in losses is anticipated, some15 GWh of non-technical losses remain after 1986 and the reduced demanddue to having to pay for what is now a free good is conservatively esti-mated at 25%. Mine sales increase as losses are reduced, and the tariffreductions in 1986 soften the impact of closure of the LAMCO mine. Theresulting generation and sales projection is summarised in Table 3.4 withadditional detail in Annexes 18 and 19. Sales are projected to increaseby 2.8Z per annum and LEC generation by 1.4% averaged over the period1984-2003, and 3.0% and 1.2% respectively over the 1984-93 period.Losses on the public component of the MPS are projected to decrease to

- 43 -
about 17.5% from about 34% within the next ten years and to stay at thatlevel thereafter. In this projection the household and commercial sectorconsumption grows relative to the industrial and government sectors, suchthat the former between them consume 83Z of power sold by 1993, excludingmining sales.
Financial Projections
3.19 Projections of income and expenditure through the 1985/86 fis-cal year have been made reflecting the above generation and sales fore-cast, including the projected fuel mix for the LEC generation, and theanticipated reduction in losses to flow from the recommended technical,administrative and policy changes. Under the assumptions applied, LEC'scurrent growing annual loss is transformed into a substantial annualprofit within three years, enabling self-financing of major generatingplant along with reductions in tariff to reflect a long run marginal costsubstantially lower than the present tariff (see para 3.36). The extentto which the present tariff remains in real terms depends on the termsapplied to retire the present short term debt to the LPRC and corres-ponding agreements with debtors in the public sector. However, it isobvious that far from being the institution now threatening the financialstability of the public sector, the LEC can become the lead agency inrestoring financial stability. This transformation will require, aboveall else, a completely revitalised and determined management backed by anequally determined government providing the legislative tooLs to clampdown on unpaid for use of power.
Ceneration Needs and Options
3.20 A review of the generation and sales projections (Table 3.4)and the schedule of LEC plant (Annex 12) indicate superficially thatthere is sufficient installed capacity to meet peak demand and almost allenergy required for the remainder of the decade at least. Certainlyhydropower capacity is adequate to meet almost 90% of the peak demandduring the wet season; thus for the foreseeable future there need beconcern only about the adequacy and cost of power supply during the dryseason. However, plant availability for dry season generation is poorand it is not clear how much of the installed capacity can be regarded asfirm in the medium term. Assuming that the recently failed GVM/ASEA 13MWslow speed diesel plant will be repaired; that 9MW of medium speed dieselcapacity will become avaiLable after maintenance; that BMC provides 12MWfirm during the dry season; and that the Mt. Coffee hydropower plantproduces 1OMW firm during the dry season; then there will be no more than8MW of peak capacity to be met with gas turbines. If the Mt. Coffeehydropower output falls to zero, as has happened this year, the gas tur-bine requirement to meet peak capacity will be about 18 MW. This peakload can be met by two of the gas turbines, leaving a third to contributesystem reserve capacity. If gas turbine use is to be minimised or thegas turbines are retired, the requirement for new capacity during the
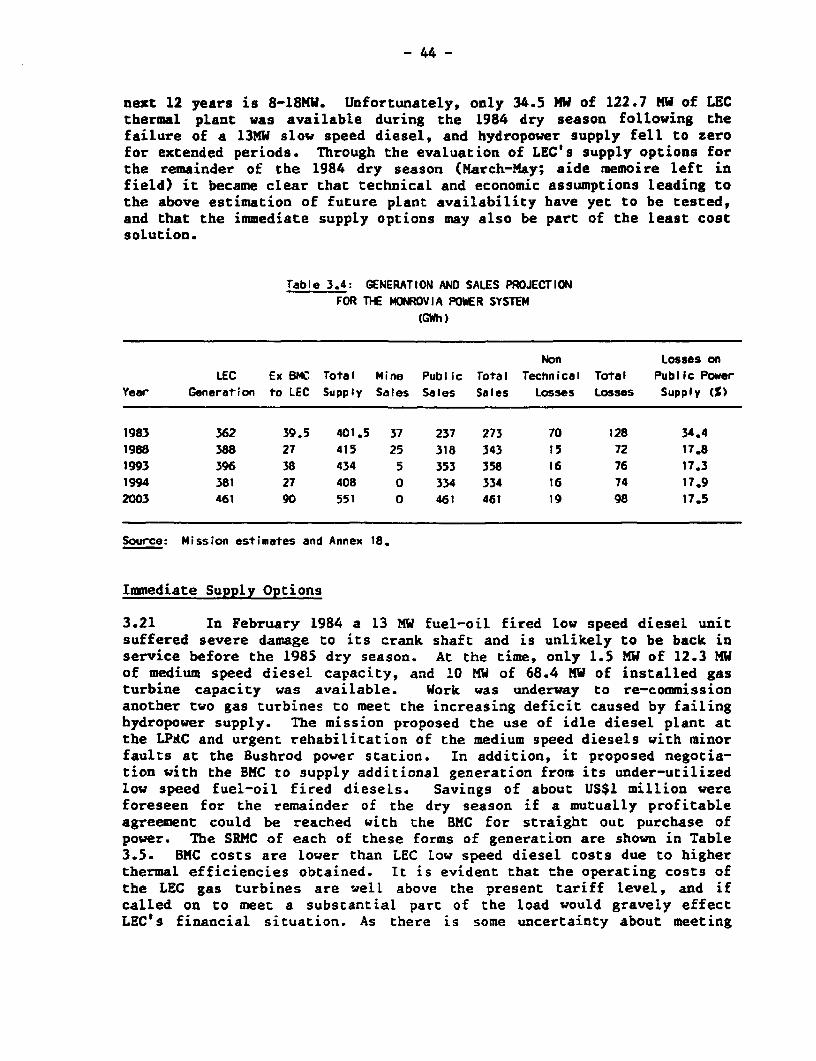
- 44 -
next 12 years is 8-18MW. Unfortunately, only 34.5 MW of 122.7 MW of LECthermal plant was available during the 1984 dry season following thefailure of a 13MW slow speed diesel, and hydropower supply fell to zerofor extended periods. Through the evaluation of LEC's supply options forthe remainder of the 1984 dry season (March-May; aide memoire left infield) it became clear that technical and economic assumptions leading tothe above estimation of future pLant availability have yet to be tested,and that the immediate supply options may also be part of the least costsolution.
Table 3.4: GENERATION AND SALES PROJECTIONFOR THE MONROVIA POWER SYSTEM
(GWh)
Non Losses onLEC Ex BMG Total Mine Public Total Technical Total Public Power
Year Generation to LEC Supply Sales Sales Sales Losses Losses Supply W5
1983 362 39.5 401.5 37 237 273 70 128 34.41988 388 27 415 25 318 343 15 72 17.81993 396 38 434 5 353 358 16 76 17.31994 381 27 408 0 334 334 16 74 17.92003 461 90 551 0 461 461 19 98 17.5
Source: Mission estimates and Annex 18.
Immediate Supply Options
3.21 In February 1984 a 13 MW fuel-oil fired low speed diesel unitsuffered severe damage to its crank shaft and is unlikely to be back inservice before the 1985 dry season. At the time, only 1.5 MW of 12.3 MWof medium speed dieseL capacity, and 10 MW of 68.4 MW of installed gasturbine capacity was available. Work was underway to re-commissionanother two gas turbines to meet the increasing deficit caused by failinghydropower supply. The mission proposed the use of idle diesel pLant atthe LPiLC and urgent rehabilitation of the medium speed diesels with minorfaults at the Bushrod power station. In addition, it proposed negotia-tion with the BMC to supply additional generation from its under-utilizedlow speed fuel-oil fired dieseLs. Savings of about US$1 million wereforeseen for the remainder of the dry season if a mutually profitableagreement could be reached with the BMC for straight out purchase ofpower. The SRMC of each of these forms of generation are shown in Table3.5. BMC costs are lower than LEC low speed diesel costs due to higherthermal efficiencies obtained. It is evident that the operating costs ofthe LEC gas turbines are well above the present tariff level, and ifcalled on to meet a substantial part of the load would gravely effectLEC's financial situation. As there is some uncertainty about meeting
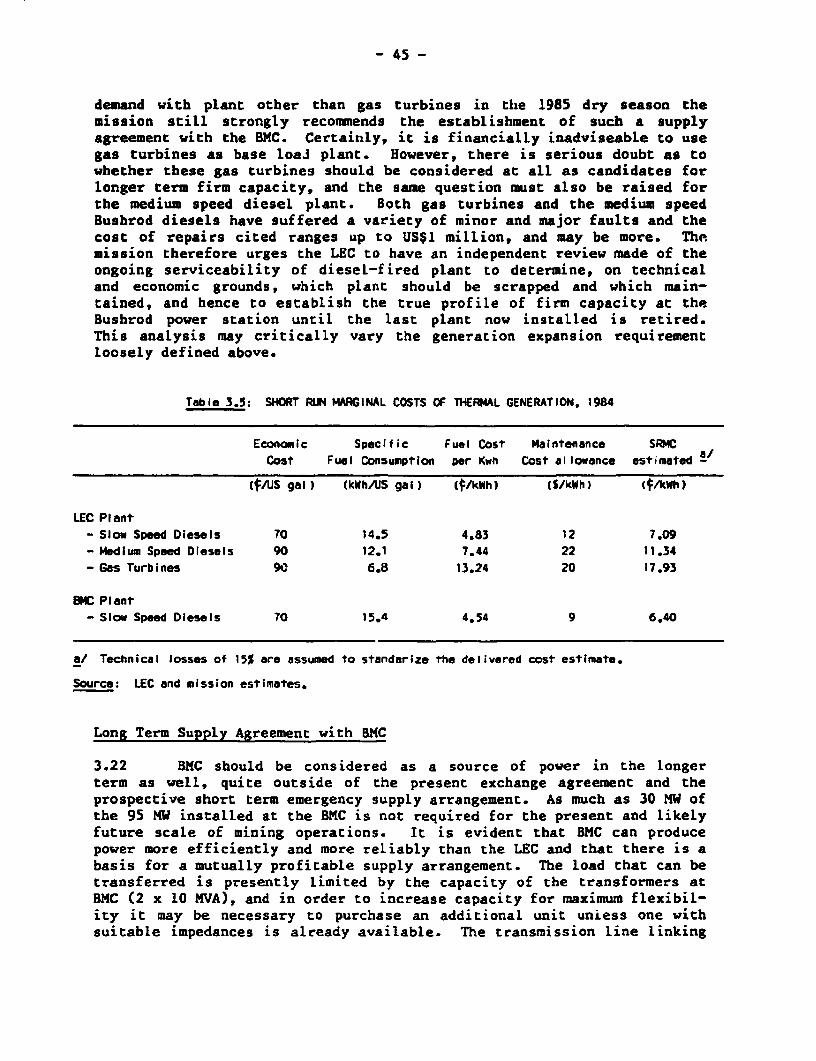
- 45 -
demand with plant other than gas turbines in tlhe 1985 dry season themission still strongly recommends the establishment of such a supplyagreement with the BMC. Certainly, it is financially inadviseable to usegas turbines as base loaJ plant. However, there is serious doubt as towhether these gas turbines should be considered at all as candidates forlonger term firm capacity, and the same question must also be raised forthe medium speed diesel plant. Both gas turbines and the medium speedBushrod diesels have suffered a variety of minor and major faults and thecost of repairs cited ranges up to US$1 million, and may be more. Themission therefore urges the LEC to have an independent review made of theongoing serviceability of diesel-fired plant to determine, on technicaland economic grounds, which plant should be scrapped and which main-tained, and hence to establish the true profile of firm capacity at theBushrod power station until the last plant now instaLled is retired.This analysis may critically vary the generation expansion requirementloosely defined above.
Table 3.5: SHORT RUN MARGINAL COSTS OF THERMAL GENERATION, 1984
Economic Specific Fuel Cost Maintenance SRMCCost Fuel Consumption per Kwh Cost allowance estimated
Cj/US gal) (kWh/US gal) (¢/kWhi (S/kWh) (fJkWh)
LEC Plant- Slow Speed Diesels 70 14.5 4.83 12 7.09- Mdium Speed Diesels 90 12.1 7.44 22 11.34- Gas Turbines 9N' 6.8 13.24 20 17.93
BNC Plant- Slow Speed Diesels 70 15.4 4.54 9 6.40
a/ Technical losses of 15% are assumed to standarize the delivered cost estimate.
Source: LEC and mission estimates.
Long Term Supply Agreement with BMC
3.22 BMC should be considered as a source of power in the longerterm as well, quite outside of the present exchange agreement and theprospective short term emergency supply arrangement. As much as 30 MW ofthe 95 MW installed at the BMC is not required for the present and likelyfuture scale of mining operations. It is evident that BMC can producepower more efficiently and more reliably than the LEC and that there is abasis for a mutually profitable supply arrangement. The load that can betransferred is presently limited by the capacity of the transformers atBMC (2 x 10 MVA), and in order to increase capacity for maximum flexibil-ity it may be necessary to purchase an additional unit uniess one withsuitable impedances is already available. The transmission line linking

- 46 -
BMC with Mount Coffee is believed to have a capacity of 40 MW, though itis reported to be in poor condition. The mission recommends that discus-sions with the BMC on the prospects of a long term supply agreement beginas soon as possible, and in addition to the proposals made here for shortterm emergency supply. There must also be a study of the condition ofthe line and the transformer capacity as well as load flow and shortcircuit studies to determine the requirements to have BMC supply as muchas 30 MW of peak demand, and for LEC to supply as much hydropower to BMCas is available now or in the future. Therefore, acceptable arrangementswill have to be made for both parties to operate in parallel. At presentboth systems operate electrically isolated from each other. Even withinBMC two non-synchronous systems are in operation in order to limit faultcapacity. This results in lack of flexibility and less effective use ofavailable hydropower capacity. A synopsis of the required study of thetwo systems is provided in Annex 20. Since BMC is most sensitive to be-ing exposed to faults generated by LEC's operation it will be necessaryfor this study to be conducted with the BMC's knowledge and scrutiny ifthe outcome is to prove acceptable.
Fuel Oil Fired Diesels
3.23 Obviously one option for future power supply is the expansionof the slow speed diesels under LEC management. The present CVN/ASEAplant is not operated up to its reported design capability in terms ofoutput or thermal efficiency and this poses questions both as to thechoice of plant and the maintenance capability of LEC staff. Even so,the SREMC being achieved is about 7C/kWh sold or 60% of the cost of LEC'smedium speed diesels. The mission estimates the full cost of productionfrom the more thermally efficient slow speed diesels now available as7.34c/kWh (see notes in Annex 21). Given the problems evident in main-taiing the existing very large slow speed engines, and the reports fromLEC staff that there may be serious problems brewing with misalignmentdue to foundation shifts, smaller, possibly medium speed, machines shouldbe considered in any future aquisition and the main contractor should infuture be responsible for foundation design and for supervision of itsconstruction.
Wood-fired Steam Power Generation
3.24 The mission undertook a detailed review of the economic pros-pect of wood-fired power generation for the MPS. Following a review withthe assistance of the FDA of the fuelvood resources within reach of themain grid, an excellent site was located for a wood fired steam plant inthe Bomi Hills about 45 kms from Monrovia and 3 kms from a 69 kV line.Four separate supply areas totalling 8,363 ha were delineated includingabout 4,000 ha of existing short rotation plantations, state and privateforest and farmland which, with proper management and replanting, couldyield 110,000 te fuelwood annually. With a likely plant factor of 56.5%,arising from base load generation during the dry season, this fuel sourcecould supply a 15 MW power plant generating 72.3 CWh/year. An outline ofthe resource costs and proposed fuelwood supply strategy, technical

- 47 -
parameters, plant costs and related economic analyses is provided inAnnex 22. The total cost of production is estimated to be 6.7c/kWh atthe busbar. The delivered cost of this power is estimated conservativelyat 8.1/kWh sold which may be compared t. the unit costs from a slowspeed fuel-oil fired diesel with the same plant factor of 7.34c/kWh. Onthe one hand, there is no escalation in the price of fuel oil included inthis cost comparison and conversely no shadow value has been applied toreflect the economic benefit of wood as an indigenous and potentiallyrenewable fuel. Hence, the 10X additional cost of the wood-fired powergeneration cannot be regarded as significant in economic terms and, forthe purpose of this comparison, wood-fired generation should be regardedas a serious candidate for power supply during the dry season shouldadditional generating facilities be required in the near term. On theother hand, for the time being at least, fitLencial and management factorsweigh heavily against the wood power option. The costs assumed for fuel-wood harvesting, and for plantation establishment and maintenance arebased on cost data applicable to a conservatively run private sectorfuelwood supply operation, yet are half those experienced to date by theFDA in establishing the Cape Mount industrial plantations i.e., about$4000/ha. Similarly, the mission does not believe that the LEC can re-alistically be expected to operate and maintain a generation system whichis totally new to it at the same time as rebuilding its capability tomaintain its already deteriorated generating equipment. The missionbelieves, therefore, that the only prospect in the near term for wood-fired power, regardless of its economic viability, is under private sec-tor management, selling to the LEC at the busbar for an acceptable profitunder a long term sales contract. Allowing for a 20% real rate of returnon investment as an incentive for private sector participation the effec-tive selling price delivered to Monrovia would be about lle/kWh, which isstill an acceptable price under the present tariff. In the present eco-nomic climate of Liberia, and with the LEC's P"i2or financial situation, itseems unlikely that an entrepreneur can be attracted to invest US$19 mil-lion in, and to operate, a power station in return for a long term salescontract. However, as LEC's financial viability improves a privatelyowned and operated wood-fired power station will become a seriousprospect.
Coal as a Power Source
3.25 Liberia has no known coal reserves; hence, coal would have tobe imported for power generation. Coal is not at present imported forany other industry so arrangements would have to be established with ex-porters, along with coal handling facilities at the port and the site ofa power station. Only a cursory review of this option is necessary toindicate that it is impractical and uneconomic for the foreseeablefuture. First, the operation of a major steam power plant poses the sameoperational difficulty for the LEC as a wood-fired steam power plant andwould have to attract the same private sector participation to be tech-nically viable in the short to medium term. Secondly, the costs of poaergenerated from coal are prohibitive at the scale of generation that maybe required. The mission's review of costs, which is compiled from

- 48 -
recent Bank experience of export, shipping, handling, capital and oper-ating costs is provided in Annex 23. The average cost is estimated to be10.9C/kWh sold, which is 35Y and 49X higher than wood and fuel oil dieselgeneration, respectively.
Table 3.6: HYDROPOWER RESOURCES OF LIBERIA
Annual Energy ProductionResource and Project Installed Capacity Firm Average
(Mw) (GWh)
St. Paul RiverC.T. Main ProposalsVia Storage Project
(60 m height) 132 389 680SP-2 Project Downstream
of via project 214 955 1,331SP-IB Project, Downstream
of SP-2 120 630 844Expansion of Mt. Coffee
Powerhouse 80
Stanley-HARZA(Preliminary reviem stage'
Via Storage Dam /(A0 m height) _60 na.
Mt. Coffee Expansion 34 - 130(additional)
Mano RiverSofrelec proposal b/- Mano Hydro Scheme 180 - 595 795
a/ Would increase firm capacity of Mt. Coffee plant fr.am 10 MW (assumed) to 30MW.
b/ Half of this, or 90 MW, would be dedicated to Liberia.
Source: Sofrelec, C.T. Main, Stanley-Harza, LEC.
Hydropower
3.26 Since 1980 several large feasibility studies have been com-pleted on major hydropower projeccs in Liberia. These studies havereviewed and specified the least cost options for the development ofhydropower on the Mano and St. Paul Rivers. Table 3.6 lists the projectsidentified and their costs. The 14ano River project is sponsored by theMano River Union, a joint organization of Liberia, Sierra Leone andGuinea, and offers 90 MW (half of 180 MW installed) for Liberia for atotal power component investment exceeding US$360 million ($1981) with alead time of nine years from engineering design to commissioning. In1982, a U.S. consulting engineering firm proposed the development of 546MW of hydropower capacity on che St. Paul River costing US$1.461 billion

- 49 -
(,t.1982) in four stages with commissioning between 1989 and 2007. Thesmallest first stage development possible from these proposals wasLiberia's share of the Mano River project costing at least US$200 mil-lion. During 1983 LEC recognized that it would not be able to procurefinancing on this scale and proceeded to have American consulting engin-eers (Stanley/Harza) evaluate a scaled down first stage development ofthe St. Paul river comprised of a low dam on its Via River tributory, andaugmented capacity in the Mt. Coffee generating station. This impound-ment would increase the firm capacity of the Mt. Coffee plant by about 20MW and increase firm energy by upto 60 GWh/year. If two additional 17 MWunits were installed at Mt. Coffee according to existing design provi-sions, there would be an additional 130 GWh in secondary energy produc-tion. However, it is clear from the mission's load forecast that thereis, no justification for hydropower development on a large scale thisdecade, although the feasibility study completed does lay essentialgroundwork for determining the costs and benefits of augmenting supplyfrom Mt. Coffee in line with near term needs and potential markets.While the mission is very doubtful that even the scaled down Via storageproposed is part of the least cost solution for power supply within thenext decade, it is prudent to await the outcome of this study beforecommitting finally to the generation expansion plans proposed here.
Upgrading the Mt. Coffee Hydropower Station
3.27 The Mt. Coffee plant can be upgraded by modernising the turbinerunners and possibly also rewinding the generators, and by adding newturbines for which intake gates and excavations l"ive already been pro-vided. These modifications are not mutually exclusive and could formpart of a staged program of enhancement of both energy and capacity. Inthe first instance there is evidence from recent studies that turbinesdesigned in the 1960s and earlier can be upgraded with new computer de-signed runners to increase efficiency by 2-4X, and energy production by10-15Z. The Mt. Coffee plant is in this category and preliminary esti-mates of the costs received by the mission show attractive returns oninvestment. However, the technical capacity for enhancement is verymachine specific and a study is required to confirm that the anticipatedbenefits apply and to define the actual energy and capacity incrementsthat can be expected for the Mt. Coffee plant. The mission recommendsthat this prospect be reviewed as part of the power system efficiencyaudit. While the addition of another 17 MW turbine will not contributefirm capacity or energy during the dry season without the addition of theVia storage, and cannot be seen as an alternative to oither specific dryseason options, the addition offers a means of reducing fuel imports byreplacing fuel oil generation at the Bong Mine, and the prospect of alucrative business for the LEC. The additional supply of power to themine may require improvement in 69kV transmission line, and increasedtransformer capacity though at a small cost in relation to the turbine.In order to evaluate this prospect the mission made the following assump-tions:

- 50 -
(a) expenditure of US$19 million for a 17 MW machine installed overtwo years from 1986.
(b) additional annual output of 60 GWh and 70 GWh.
(c) half of the additional output utilised in 1994 - the year afterthe BMC closes - and the remainder utilised progressively overthe next five years.
(d) fuel oil savings of 5c/kWh - about the current fuel cost ofoperating fuel oil-burning thermal plant.
Ce) 25 year life.
With fuel savings as the only benefit, the project generates 12.5% and14% ERR for each energy production level, respectively. The return oninvestment would increase substantially if a storage system is built upriver fairly early in the project life.
Conclusions and Recommendations on Generation Expansion
3.28 In the first instance the mission has only been able to esti-mate the true firm capacity at the Bushrod Power Station, and has noadvance impression of the incremental capacity and energy production pos-sible from the rehabilitation of distribution and generation facilities.Therefore, the assumptions made here regarding available capacity uponwhich the need for new generation capacity has been based need to betested by:
(a) an early and comprehensive power system efficiency audit, and
(b) a complete review of the technical and economic availability ofthermal power plant.
T.hese studies should be combined and undertaken as a matter of urgency aspart of the technical assistance already offered by the Bank under theEnergy Sector Management Assistance Program. The following conclusionsand recomendations reflect an optimistic view of present and future firmcapacity of currently installed plant. They are that:
(a) the least cost solution to meet generation needs for theremainder of the decade is to establish a supply agreement forup to 30 MW peak from BMC's underutilised slow speed fuel oilfired diesel plant.
(b) if the BMC cannot supply any or all the required capacity, oneor two 9MW heavy Juty diesels should be procured as soon aspossible.
(c) an additional 17 MW unit at the Mt. Coffee plant is desirableimmediately after a contract of sale for the additional energyoutput is established with the BMC.

- 51 -
(d) if when BMC closes (assumed to be the early 1990s) its dieselplant is unserviceable and/or LEC is unable to take over itsoperation, wood-fired steam power and additional slow speeddiesel plant appear now to be the main alternatives for dryseason power supply.
Generation and Transmission Planning Studies
3.29 It is clear from the many assumpticns made in formulating theabove proposed generation expansion plan that the size and timing of newgeneration investments is uncertain, being influenced by the outcome ofother urgent studies the mission has recommended for existing thermalplant and distribution and generation rehabilitation, and the response tomeasures to enforce payment for electricity consumed, among other vari-ables. Hence, the precise form of a power subsector program must bedefined by a rigorous least cost expansion planning study immediateLyfollowing the above-mentioned studies and the finalization of theStanley-Harza report. The study should also include transmission expan-sion planning because of the major transmission projects nearing imple-mentation and which, in the mission's view, are of questionable priority(para. 3.31). Such plans would also facilitate a decision on the con-tractual relationships between the BMC and the LEC, allocate priority tothe many distribution and generation/rehabilitation projects that arecertain to be identified, and define the priority and design of themission's proposals for transmission expansion. The power subsectorinvestment plan proposed by the mission (para. 3.40) is therefore tenta-tive for the period 1984-87 in that although the level of funding re-quired is unlikely to be significantly different the precise form of theinvestments will very likely change.
Hydrology
3.30 The complete failure of hydropower production from the Mt.Coffee plant is not an unusual occurence and yet the generation facilityis regarded as having a firm output of 8-10MW. For a run-of-riverscheme, failure to produce any power at all, even for a very short timemeans that there is no firm power supply and 100% back-up is required.For several years in the early seventies, and again in 1983, there wereperiods of weeks at a time during which production was zero. Again,during the course of the mission production was entirely discontinuous,with either 4-5MW of output supplied for two or three hours a day, or noproduction at all. Indications from the hydrological record are that the1985 dry season could follow the same pattern. First, the mission re-commends that for planning purposes LEC regard the firm output as zero,and instruct consulting engineers accordingly. Second, the originalassignment of 8-10 MW firm must have been based either on a misinterpre-tation of the hydrological record or planning guidelines, or the hydro-logy has changed. With this uncertainty, the mission recommends that thehydrology of the St. Paul river be re-interpreted with the benefit ofrecent data, including the record of actual production from the Mt.Coffee plant, and a revised set of probabilities published for thepurposes of hydropower design and analysis.

- 52 -
Transmission Expansion
3.31 Two major transmission expansion programs are now underway.The "third extension project", financed by KfW, is almost complete, andthe second, which is financed by the AfDB, has just been finalised and isabout to start. This project involves the expenditure of US$23 million,most of it on a new 48 km 69 kV line to the airport at Robertsfield and a65 km line to Robertsport, both with lattice tower construction. Theairport (i.e., Robertsfield) transmission project includes a double cir-cuit lattice tower with 2 km of underground 69 kV cable and a new indoorsubstation in open country. The Robertsport line will interconnect only500 kW of demand, and it is unclear whether the Load will grow or declineas, on the one hand, there have been frequent interruptions in supplyfrom the isolated diesel plant and, on the other, the average tariffcharged is only 4C¢kWh compared with the l5C/kWh that should be chargedwhen the load is connected to the MPS. There must be serious doubt as towhether the load will reach 1.5 MW as anticipated in project documenta-tion if the full cost of supply is paid by consumers. The airport line isin poor condition in parts, though this does not necessitate an entirelynew line for such a small load. Instead, that part of the line which isinaccessible in the wet season needs to be relocated and some polesreplaced. The mission recommends an urgent review be undertaken inliaison with the AfDB of the benefits of proceeding with these transmis-sion projects as now defined in the light of the urgent requirement forrehabilitation of the distribution and parts of the generation system.
3.32 Energy losses are likely to increase with the addition of theproposed transmission lines, whereas upgrading the 12.5 kV line to Tototato 69 kV would decrease losses and facilitate, in due course, the inter-connection of Gbarnga, the largest and possibly firmest of the isolatedgenerating system loads. It should be possible to carry several mega-watts on a 69 kV line to Cbarnga even though the distance from Monroviais about 200 km. However, just as with the other major transmission pro-jects, it is essential to establish that a firm economic load exists atthe economic cost of supply before embarking on construction. This meansthe implementation and enforcement of reasonable metering, billing andcollection procedures in these systems just as proposed for the MPS (seepara 3.10).
Isolated Supply Systems
3.33 The LEC provides top management services for the GOL isolatedgenerating systems which are all small towns remote from the MPS. Thelist of nine generating stations and their consumer, generation, salesand fuel consumption data for 1982/83 are provided in Table 3.7 and thecharacteristics of the generating plant are provided in Annex 24. Allcenters are supplied with diesel generation and most plant is second-hand. An additional 5.9 MW of diesel generators was bought in 1978 withsets ranging from 87 kW to 1000 kW, though these have yet to be
- 53 -
installed. The data presented here and the balance sheet for theisolated supply centers indicates that average thermal efficiency isabout 25Z, leading to an annual consumption of 2.6 MM US gaLlons ofdiesel oil. The variable costs of production for the supply of 27 GWhwere US$6.3 million, or 23.3 cents/kWh generated, or 27 cents/kWh sold,compared with revenues of $937,000 or 3.5 cents/kWh. In effect, thegovernment budgeted an operating subsidy of $750,000 and experienced asubsidy (loss) of US$5.3 million. The main reason for the loss is thatas few as 15Z of consumers per center are metered and, in the absence ofmeters, pay a flat fee of only $10.00/month regardless of the level oftheir consumption. A simple load projection for the isolated centerscombined is presented in Table 3.8. By 1993 the load will have reached49 GWh and implies the installation of all the diesels now in storage bythe end of 1985 as planned. The GOL is planning a US$36 million RuralElectrification Development Project, yet there is no plan for upgradingthe tariff, metering or collection system. If the load grows as it isprojected to without any of these financial and management reforms theannual loss, or subsidy, will grow to US$8 million. First, the presentloss cannot be afforded, and is difficult to justify on social or eco-nomic grounds. While the GOL may consider there to be sociaL or poLi-tical grounds for subsidizing very low income consumers in rural areas,the great bulk of the consumption appears to be by relatively high incomeconsumers. On the other hand, the annual financial loss appears to be alarge proportion of anticipated uncommitted annual development expendi-ture and yet no clear-cut Government decision is being made to expendthese scarce financial resources in this way. In summary, the missionrecommends that:
(a) the tariff be increased to cover at least the variable costs ofproduction over the next three years (about 27 cents/kWh),starting with an immediate increase to the level of the tariffon the MPS of 15 cents/kWh.
(b) meters be installed for all consumers as soon as possible andthat meter reading and billing systems be upgraded and enforcedin line with proposals made here for the MPS. In addition,load limiters may be appropriate for very low level consump-tion, accompanied by a flat charge.
(c) that until the above measures have been implemented no newconnections and no new generating plant should be instaLled,including any alternative wood-fuelled or hydropower supplysystem.
(d) in the event that these measures are implemented, and consumershave experienced close to the full cost of their consumption,demand forecasts should again be made on which to plan andeconomically justify the addition of new conventional or aLter-native generation systems.

- 54 -
Table 3.7: CHARACTERISTICS OF ISOLATED GENERATING SYSTEMS,LIBERIA, 1982-83
Number of Installee Peak Electricity FuelLocation Consumers Capacity Demand Generated Consumption
(kW) (kW) (GWh) ('000 US gal)
Harper 1,058 1,300 1,200 4.2 402Gbarnga 1,050 4,580 a/ 1,500 6.0 576Greenville 1,000 1,000 900 3.9 368Voinjama 700 1,300 1,000 2.9 271Zwedra 640 1,300 580 3.0 288Sanniwelli 524 950 800 3.2 299Kolba City 245 285 240 1.2 106Bellafanai 100 333 100 1.0 92Robertsport 320 505 450 1.5 143
Total 5,637 11,553 26.9 2,545
a/ Gbarnga has 2x2.5 MW units out of service. The remaining unit has an effective capa-city of 589 kW.
Source: LEC
Table 3.8: LOAD PROJECTION FOR ISOLATED GENERATINGSTATIONS, LIBERIA, 1984-93
Installed Load Electricity FuelYear Capacity Factor Generation Consumption
(MW) (M) {GWh) ('000 US gal)
1983 11.5 26.8 27.0 2,6001984 12.2 ; 28.6 30.6 2,9601985 16.3 - 28.7 40.9 3,9601986 15.8 30.2 41.8 4,040 b/1987 15.3 31.9 42.8 4,1301988 14.8 33.6 43.6 4,2201989 14.4 35.4 44.6 4,3101990 13.9 37.3 45.6 4,4101991 13,5 39.3 46.5 4,5001992 13.2 41.0 47.5 4,6001993 12.9 42.9 48.5 4,700
a/ All 5.9 MW of diesel units now in storage to be in service by end of1985.
b/ After new capacity is in service, net increase in generation, hence infuel consumption, is 2.2% per year. Gross increase in generation of5% was projected by LEC, however equipment derating and retirement,plus poor fuel supply logistics will limit growth.
Source: Mission est.o.ates.

- 55 -
Alternative Energy Supply for Isolated Power Generation
3.34 The mission reviewed the technical and economic prospects foralternative sources of power in the isolated generation systems. The GOLis considering a combination of wood gasification and wood steam drivengeneration, and small hydropower. Although the mission has concludedthat until there are major reforms in tariff, metering, and billing inthese systems there should be no investment in generation of any kind, 2/it is useful for the longer term to report the findings of its evaluationof the alternatives cited. The mission undertook detailed analyses ofits own in respect of the woody biomass power supply options as well asreviewing a recent report of a German consulting engineering group forthe GOL which sought to identify an investment program for power supplyfrom alternative indigenous energy sources for each of the nine isolatedpower systems. The mission also visited and reviewed the costs of pro-duction for a recentLy installed 1200 kW wood-fired steam plant in SierraLeone, and reviewed design parameters with the manufacturer in WestGermany. In addition, the mission benefited considerabLy from the richdata base being assembled on installed and operating costs of woodfuelgasifiers as part of the World Bank/UNDP global gasifier monitoring pro-gram. A summary of the technical and economic parameters and the result-ing cost analyses is provided in Annex 25. Up to about 700 kW, itappears that wood gasification is marginally cheaper than wood-steampower. However, it is evident that at above 700 kW, a wood-fired steamplant will become a lower cost alternative than wood gasification giventhat the costs for che former have been reduced considerably in this sizerange in the last three years with new design and packaging concepts.However, the comparison is at best superficial as gasification is notproven as a commercially transferable technology for developing coun-tries. Production costs indicated for a wood-fired steam plant in therange of 500-1000 kW - a likely size for a future isolated power systemin Liberia -- are about 17-22C/kWh, compared with diesel costs on theorder of 25-40C/kWh. The mission concludes that, for the time being,there is no economic or technical justification for proceeding with woodgasification power systems in Liberia. Similarly, despite its promise asan economic alternative, wood-fired steam generation should not befurther evaluated until the financial management, and the operations andmaintenance of the isolated systems improve, and demand is stable at theeconomic cost of diesel generation.
2/ An exception could be an independent enterprise venture which wouldhave to introduce such reforms to be viable.

- 56 -
Electricity Pricing
Short Run Marginal Cost of Hydropower
3.35 The short run marginal costs of supply from thermal plant werepresented in discussing the least cost option for supply during the 1984and 1985 dry season (para. 3.22). By comparison with hydropower gener-ation at the Mt. Coffee plant the estimation of thermal SRMC's isstraightforward, hence there is merit in establishing the short run costsof hydropower prior to examining LRMC's and reviewing an overall pricingpolicy for the power subsector. Superficially, with hydropower supplysurplus to the public system requirements during the wet season, the SRMCof hydropower would appear to be very low. However, because of the ex-change agreement with the BMC, the surplus effectively replaces LEC fueloil diesel generation that would otherwise have to be produced during thedry season. Since the energy exchange is metered at the terminals of thetransformers near BMC's generating station, LEC incurs the transmissionloss in both directions. Assuming that the loss between Mt. Coffee andBMC is 5%, and that supply from BMC replaces output from the fuel oilplant at LEC, every 1.3 x 1.05 kWh of hydropower is worth 6.02C/kWh atthe BMC terminals or with a 15% transmission loss 7.09 cents (from Table3.5) at LEC's consumers terminals. The SRMC of hydropower is, therefore,5.19C/kWh during those periods when LEC supplies BMC. During peak hourswhen hydropower generation is at the limit of plant output, the SRHC isequivalent to the marginal cost of generation from slow speed diesels, or7.09C/kWh. Now, whiLe gas turbines are in use at the margin of supply,the SRMC of hydropower is 13.lc/kWh. If it is not possible to supply anyfurther hydropower to BMC then the marginal cost reflects the actual costof production, which is as low as 0.5C/kWh.
Long Run Marginal Costs
3.36 The generation expansion plan proposed assumes expansion ofhydropower supply from the Mt. Coffee plant, and additional slow speeddiesel engines fired with fuel oil. It is expedient to define the LRMCsimply as the average incremental costs of production for the pattern inwhich the various plant are anticipated to be utilized. Transmission anddistribution costs are the average rather than marginal costs due to thelumpiness of the transmission and distribution investments. The resulteof these computations are provided in Table 3.9 and notes on the para-meters used in the cost analysis are provided in Annex 26. The long runmarginal cost estimate for low voLtage consumers is 9.33C/kWh, althoughit is important to note that these LRMC's do not take into account non-technical losses or LEC's very substantial overheads, both of which areassumed to be reduced to acceptable levels in the short to medium term.
Tariffs
3.37 The official tariff for all electricity supplied by the LEC is15c/kWh, comprised of a flat rate of lOC/kWh and a fuel surcharge of

- 57 -
SC/kWh. This rate has been charged since October, 1982. Clearly, thistariff is substantially above the LRMC's for all classes of consumption,though there can be no reduction in tariff as long as LEC's losses are sohigh. In consideration of LEC's financial situation, projections weremade showing the prospect of handsome profits within the next four yearsfollowing implementation of a number of essential measures, even despitea tariff reduction in the wet season of 1986. The seasonal differencesin LRMC are substantial and will become more so if an additional 17 MWhydropower unit is installed at Mt. Coffee. In the process of tariffreform this difference should be recognized. Nevertheless, it is clearthat for the next three years at least financial considerations willoverride economic considerations; hence, the mission's recommendations onpricing are:
(a) that no change be made in the interim to the LEC tariff, butthat the GOL tariff for the isolated supply systems be broughtup to the LEC level immediately, and stepped up to the variablecosts of production over the next three years.
(b) that a full tariff study be made before the 1986 wet season toexamine the prospects for tariff reform with the benefit ofhindsight in regard to the success or otherwise of loss reduc-tion and management initiatives proposed by the mission.
Table 3.9: LONG RUN MARGINAL COST ESTIMATES,MONROVIA POWER SYSTEM, LIBERIA
(U.S. cents)
F-uel oil FixedPrice Build-up Diesels Hydropower Average a/
Busbar LRMC 9.30 3.92 6.96Transmission Costs 0.93 a/ 0.61Cost Delivered toPrimary Voltage (69 kV) 10.23 4.53 7.75
Primary Distribution Costs 10.93 0.61Cost Delivered to HighVoltage Consumers (12.5 kV) 11.26 5.14 8.54
Low Voltage Distribution Costs 0.93 0.61Cost Delivered to lowvoltage consumers (110/220V) 12.09 5.75 9.33
a/ Assuming 43.5% hydropower and 56.5% diesels (Annex 18).Source: Mission estimates, Annex 26.
It will be appropriate to pay particular attention to the following cur-rent deficiencies in tariff form and structure at that time:
1. the application of minimum monthly charges.2. provision of a discount for high voltage consumers.

- 58 -
3. reduced rates, possibly with load limiters instead of metersfcr lights only supply.
4. provision of incentives for major consumers to use wet seasonsupply who can accept interruptable supply in the dry seasondue to their own back-up plant.
5. penalties for poor load factors.
Other ancillary service charges need to reflect their true cost, and somereform has been proposed in the recommendations already forwarded to thegovernment regarding the means for rapidly increasing the proportion ofpaying consumers and reducing non-technical losses (see Annex 16).
Management Issues
3.38 In looking at LEC's operations, the mission observed that theLEC offices and administration needed to be reorganized, filing andrecord keeping was either unsystematic or non-existant and data oftencontradictory. Office layout requires better planning, and there isnegligibLe office security. According to its own standards, the LECcurrently is overstaffed and the efficiency level low. Since 1979 saleshave dropped, while the number of employees has increased by 30%, and thepayroll has almost doubled in nominal terms. The target set by the LECin 1979 of one employee per 35-40 customers, which translates to a needfor between 700 and 800 staff, is a reasonable initial objective. Thus,there should be scope for a reduction in staff of 400-500 over the nexttwo years. Internal re-organization and a manpower and training needsassessment should be carried out in parallel. A security system in theoffices, allowing only those people with official business to enter theoffice building, also should be introduced.
3.39 The absence of an effective management information system makesit difficult, if not impossible, for top management to make rational de-cisions about the allocation of resources. This is well illustrated ingeneration maintenance where the least economical thermal plant was beingrehabilitated to meet the shortfall in supply in the 1984 dry seasonwhile much less expensive plant with mostly minor operating faults wasbeing ignored. There is no maintenance scheduling system, and onlylimited operational data on which to make a least cost decision. Simi-larly, system planning is rudimentary, and for the most part is not doneat all. Options for generation and transmission expansion are selectedand defined in an ad hoc manner and demand projections are inadequatelybased and, in consequence, frequently overestimated. There is an urgentneed for a better management information system, both for planning andbudgeting, and for monitoring the results of policy, pricing and adminis-trative measures designed. Similarly, with the reconstitution of theboard it is vital that short, medium and long term goals which fully re-flect needed reform and rehabilitation, be defined as a framework forformulating work programmes and timelines. This is a formidable task,however, and the mission does not believe that, along with already diffi-cult problems, the present senior LEC staff can be expected to cope.This raises the question of management services in general, as already in

- 59 -
this report special intervention has been proposed for implementation ofdistribution rehabilitation programs, for modifying consumer billing andaccounting procedures, and for the development of a management informa-tion system. The mission is of the opinion that all of these tasks needto be coordinated under one management services contract and sees onlytwo choices:
(a) an extensive contract covering the provision of all top manage-ment posts, including General Manager, Commercial Manager,Chief Engineer and Systems Planner, or
(b) a limited responsibility contract with engineering, accounting,and planning expertise deputised to the General Manager as aspecial task force.
The mission recommends the adoption of the former, as the experience inthe LEC of contracting senior expertise without significant authority,wide responsibility and clear cut accountability has been very poor. Therecord for the last decade shows that immediate improvements are gradual-ly eroded by pervasive disorganisation and lack of discipline. The pre-sent LEC management has inherited a system which is vmry difficult toimprove without fundamental change, and the suggestic. that these changesshould be attempted by an outside contractor is no reflection on theintegrity or dedication of the present Ceneral Manager who has only re-cently been appointed. Indeed, it is essential that, in undertaking acomprehensive management services contract, provision is made for thepresent managers to participate in the implementation of reforms and toundertake special training in the form of short courses and on-the-jobtraining elsewhere in anticipation of managing the company at the end ofthe contract period. To ensure continuity and to provide security fordedicated top managers in the present administration some use could bemade of executive director positions and similar arrangements. A con-tract may have to be negotiated on a fee plus incentive basis for it willbe difficult otherwise to attract appropriately skilled and experiencedindividuals.
Subsector Investment and Technical Assistance Requirements
3.40 The recommendations made here for system rehabilitation and ex-pansion, pre-investment work, studies and contract expertise have far-reaching implications for investment programming and the use of availabletechnical assistance and donor support. The expenditure proposed isidentified in Table 3.10 year by year for the 1984-93 period. This is anindicative "desirable" investment program and will need to be augmentedand revised as reviews of distribution, transmission and generation sys-tems analysis are completed as proposed and investment costs are betterdefined by detailed engineering design and costing analyses. The econc-mically justified capital investment appears to be US$103 million for thedecade, with about half of that required during the next four years. The

- 60 -
foreign exchange component of this investment and studies program isUS$83 million. Assumptions have been made here regarding the existingtransmission expansion program which are at variance with the presentprogram defined and agreed for AfDB funding. The major components ofthis program are either scaled down or delayed, and it is Implied thatthe funds are used instead for urgently required distribution and geners-tion rehabilitation work. The investment program outlined in Tabie 3.10includes projects of varying priority. Faced with severe limitations onforeign exchange and ongoing shortages of local finds, a "minimun" in-vestment program would appear at this stage to exclude both the Mt.Coffee 17 MW unit addition and associated works, and the transmissionextension and upgrading for Totota and Gbarnga. The investment in theRobertsklert transmission line appears to the mission to be of even lowerpriority, though it is already funded under the AfDB loan and is regardedhere as committed but delayed subject to the above proposeddiscussions. The remaining projects are, in one form or another, indis-pensible if supply is to be maintained and the LEC is to become finan-cially viable, though their precise form is to be determined by Leastcost planning studies, subsequent to the Stanley-Harza and other prefeas-ibility studies. This translates into an absolute minimum investmentprogram of US$70 million for the decade with a foreign exchange componentof US$50 million. The LEC is quite capable of generating under itspresent tariff the additional US$20-25 million of local funds requiredfor the desired, or the minimum, *nvestment program, as well as servicingthis new debt and retiring old debt, providing the proposed short termreforms and rehabilitation programnes are undertaken.

Table 3.10: POWER SECTOR INVESTMENT PROGRAM, LIBERIA, 1984-93
1984 1985 1986 1987 1988 1989 1990 1991 1992 1993 TotalCapital InvestmentsGenerationHydro-turbinegenerator upgeadtinR 1.85 1.85 3.70
Slow-speed diesels (18 MW) 4.05 4.05 4.05 4.05 16420Mt. Coffee addition (17 MW) 9.50 9.50 19.00Rural diesel installationand rehabilitation 0.50 0.50 0.50 0.50 0.25 0.25 0.25 0.25 3.00
Wood-fired power ordiesel power (15-20 MW) 4.75 9.50 4.75 19.00
Wood-fired power forisolated centres (2 MW) 0.75 0.75 0.75 0.75 3.00
Diesel/Gas Turbine Rehab. 0.5 0.5 0.5 1.50Subtotal 0.5 6.40 16.40 14.05 4.55 1.25 1.00 5.75 10.50 5.00 65.40
Distribution/TransmissionMeters 0.2 0.30 0.30 0.30 0.10 0.10 0.10 1.40Distribution rehabilitation 0.2 0.50 1.00 1.00 1.00 0.50 0.50 0.10 0.10 0.10 5.00BMC-LEC exchangecapacity and paralleling 0.50 0.50 1.00
Totota 69 kV line 2.00 3.00 3.00 8.00Totota Gbarnga 69 kV 1.00 3.00 6.00 10.00Rural distribution 0.10 0.10 0.10 0.10 0.10 0.10 0.10 0.10 0.10 0.90Robertsfield 69 kV 1.00 2.00 3.00Robertsport 69 kV 2.00 4.00 2.00 8.00
Subtotal 0.4 1.90 5.90 4.90 5.20 5.70 10.70 2.20 0.20 0.20 37.30Pre-Investment Studiesand ContractsMetering billing crew 0.1 0.25 0.25 0.25 0.85Management Contract 0.25 0.50 0.5 0.50 0.50 0.25 2.50Power System Efficiencyand bMC exchange studies 0.1 0.05 0.15Tariff/Generation andTransmission PlanningStudies 0.10 0.10 0.10 0.10 0.10 0.40
Subtotal 0.20 0.65 0.85 0.75 0.50 0.50 0.35 0.10 3.90Total 1.10 8.95 22.65 19.70 10.25 7.45 12.05 8.05 10.70 5.20 106.60

- 62 -
IV. HOUSEHOLD AND ENERGY
Introduction
Household Energy
4.1 Although Liberia has extensive forest cover, the majority ofits people use woodfuels for cooking and the extent to which this prac-tice is assured in the long term is not well understood. On the onehand, despite an abundant supply of firewood to most of the rural popula-tion, with growing urbanisation localised shortages in the supply of goodquality woody fuels may be developing. On the other hand, in comparisonwith neighbouring countries, Liberia's forest resources are rich, andhave even been considered as a source of charcoal for the urban marketsof Sub-sahelian zone countries, such as in Mauritania and Senegal. Themain concerl3 in the household subsector are, therefore, whether woodfuels will continue to be available at a reasonable price to the rapidlygrowing urban population, and whether there are any realistic prospectsfor charcoal exports from Liberia to other countries in the West Africaregion. Another legitimate, though relatively minor, issue to be exam-ined ,riefly is the supply of petroleum fuels for household cooking.With the cessation in 1983 of petroleum refining in Liberia, the supplyof LPG and kerosene became erratic, causing shortages and sharp priceincreases.
The Pattern of Household Energy Use
4.2 Household energy consumption is about 70% of total final energyuse in the Liberian economy. About 98% of this consumption is primarilyfor cooking and the majority of the remainder is for lighting and cooling(air-conditioning and refrigeration). Roughly three quarters of house-hold energy use occurs in rural areas even though 35% of the populationis urban-dwelling. This is accounted for both by more efficient energyuse in the urban areas through tha greater use of modern energy forms,and by the rural popuLation's acce:ss to an abundance of firewood in theprocess of clearing forests for shifting agriculture. Although the usualdichotomy applies whereby the majority of modern fuels are supplied tourban areas and rural areas predominantly consume woodfuels, Liberia ischaracterised by having more than half of its kerosene consumption inrural villages and communities. It is also noteworthy that charcoal isdisplacing firewood in urban areas well in advance of severe fuelwoodshortages in the immediate hinterland of the cities. Charcoal is used,at least occasionally, even by the highest income groups in Liberiansociety.
4.3 The composition of household energy consumption is provided inthe following table.

- 63 -
Table 4.0: HOUSEHOLD ENERGY CONSUMPTION, 1983('000 toe of final energy use)
Fuel Cooking Lighting Total Percent
Firewood 556.2 - 556.2 87Charcoal 69.5 - 69.5 11Kerosene 1.0 4.4 5.4 1Electricity 1.8 7.2 9.0 1LiquefiedPetroleum Gas 0.3 - 0.3 Negligible
Total 628.8 11.6 640.40(Z) 98.0 2.0 100
Woodfuels comprise 98% of total household fuel consumption on the basisof final energy use, and of this charcoal comprises 11%. However, by themethods traditionally empLoyed for charcoal production in Liberia, about9 tonnes of air dried wood are required to make one tonne of charcoal,hence on the basis of primary energy use charcoal comprises at least 35Zof total woodfuel consumption. As urbanisation proceeds the share whichcharcoal makes of total woolfuel consumption will increase. Given theprojection of Limited growth in the Liberian economy it is unlikely thatthe share of modern fuels in the household market will increase notice-ably during the next decade.
Comparative Economy of Household Fuels
4.4 Since the capital city of Monrovia is the focal point of thecash economy, and the largest urban centre, it is appropriate to concen-trate largely on the prices and costs of fuels currently traded in thatmarketplace. These data are provided in Table 4.1. The efficiency ofhousehold cooking devices is a critical variable in determining the rela-tive economy of these fuels. 3/ The most expensive cooking fuel is LPG,due entirely to the closure of the refinery which, up until January of1983, adequately supplied market demand. Now LPG is brought either bysea, in bottles in containers, or by road from the towns bordering theIvory Coast where it is produced in the refinery there. It is generally
3/ The efficiency data applied here are based in the case of charcoalon measurements by the mission of the stove type in common use, andfor other stoves are derived from recent laboratory and fieldtesting for the Energy Department of the Bank. It is important tonote, however, that efficiency at a point in the stove's powerrating is not necessarily a guide to its overall fuel economy in thecourse of cooking for the local diet.

- 64 -
recognised that demand exceeds supply for this fuel, even at the currenthigh price, because of the flexibility it offers high income households,and restauranteurs, in backing up presently intermittent electricitysupply. Kerosene appears to be the next most expensive fuel when pur-chased in tiny quantities from street vendors. However, this kerosene isdestined largely for the special market of lighting charcoal fires, andis unlikely to be displaced in this role by another fuel even at theseprices (often amounting to $6-81US gallon, for a market of about onemillion liters per year). Electricity is more expensive at presenttariffs and short run marginaL costs than kerosene purchased from servicestations assuming, of course, that the consumer is actually paying (seeChapter III). In the long run the marginal cost of electricity shouldfall to a level about 70Z above the long run economic cost of kerosene.In the current marketplace it is clear that woodfuels are cheaper thantheir modern competitors and, remarkably, that charcoal is cheaper thanfirewood in most of the city's marketplaces. Based on interviews withtraders, wholesaLers and retailers, the market appears to be respondingto the comparative price advantage of charcoal as firewood sales in citycentre markets have been declining sharply in recent years. This is lesstrue of the suburban markets, though given the relative abundance ofrubber tree wood within 50 miles of the city this feature is worthy offurther examination.
4.5 Additional detail on the present market prices of both firewoodand charcoal is provided in Annexes 27/28. These annexes indicate con-siderable variation in the retail price of botb fuels within the cityalthough, from the sampling of markets undertaken by the mission, thelowest prices for charcoal were, with. one minor exception, 15-20% belowthose for firewood, and charcoal was conmonly haLf the price of firewood.In general, consumers do not appear to discriminate carefully betweenmarkets on the basis of price, or to recognise the enormous variations inweight between bags of charcoal due to wide variation in basic density ofthe original wood feedstock. The former observation can be explained bythe consumer's lack of mobility within the city which has very manylocalized markets, whereas the latter quite likely derives from retailingwithout weighing scales but in standard packages (the rice bag). Thereis a preference for so-called "bush" wood charcoal over the softer andfaster burning rubber wood charcoal. This preference is unwittinglyreinforced by the weight of a standard rice bag of rubber-wood charcoalbeing 20-40% below that of denser bush-wood charcoals (especially "iron-wood" Lophira sp. charcoal). It remains surprising, however, that fire-wood is being sold in about 10 kg bundles within 40 miles of Monrovia forabout $25/te, or half to one quarter the price prevailing in city mar-kets. Moreover, rubber-tree wood is being delivered to bakeries fromabout 70 km from the city for about US$40 per tonne, which constitutes acheaper fuel than the cheapest charcoal on the market. Despite theseapparent market anomalies the mission was generally impressed with theefficiency of the private sector supply system and sees no justificationfor government participation in this component of the woodfuel market.On the other hand there is a role for government in identifying the fuel-wood resource anu in providing incentives for its efficient exploita-tion. These matters are discussed below.

- 65 -
Table 4.1: COMPARATIVE COST OF HOUSEHOLD ENERGY FORMS IN MONROVIA, LIBERIA,FIRST QUARTER, 1984
ConversionCost Per Energy Value Cost per Efficiency Cost of EnergyUnit Sold Specified Unit Energy (PHU a/) Utilized
(MJ/Unit) (C/lMJ) (S (C/lMJ)
ElectricityPresent tariff 15 deAWh 3.6 MJAkWh 4.17 65 6.41Present averagecost (1983) 9.7 d/kWh 2.69 4.15SRMC (est.) 18 e£AWh 5.00 8.69LRMC (est.) 9.3 d/kWh 2.58 3.97
KeroseneOfficial retail price S2.35 per 139 MJ/ 1.69 35 4.83
US gallon US gallon 45 3.76Street stalls (for S1.OD/760 ml. 3.59 50 3.38
lighting charcoal) bottle (min.) 10.25Long Run Cost, 1993 S1.13 per 0.81 2.31
US gallon CIF
Liquefied Petroleum GasEconomic cost ofdelivery by privatesector (e.g. FirestoneCo. ex. Freeport, USA) S2.60 per kg 50 MJ/kg 5.20 45 11.56Retail Price (if
available) S2.00 per kg 4.00 8.89
CharcoalRetail prices l0C per 29.7 0.75 24 3.12(see Annex 28) 0.45 kg tav)
heap. 30 2.50(S222/te)$2.50 per sack 0.48 2.00of 9.5-21.0 kg(S143/te, av) 30 1.60
FirewoodRetail prices
Inner City 11-1.50/bundleof 11-21 kg. 17.3 0.52 13 4.0(S85/te, av)
Suburbs S1.35 per 27 kg 0.29 2.2(see Annex 27) bundles
10d per 1.4-1.8 0.36 2.8kg bundles
af PHU = Percentage of heat utilized.
Source: Mission estimates and measurements.

- 66 -
Woodfuel Supply and Demand
Present Woodfuel Resources
4.6 Not only is Liberia more heavily forested than most othercountries in the West Africa region but it is thought by some to be moreheavily forested now than several hundred years ago when population issaid to have been greater than at present. High forest with closedcanopy is nevertheless on the decline again and it is necessary to re-flect on the implications of this current trend for the energy sector.The forest resources of Liberia are summarised in Annex 29, with support-ing data on rubber tree and plantation timber resources in Annexes 30/31.Tree cover of some form extends over about 80% of the land area althoughvirgin forest covers only about 16%, and logged over forests about 4.4%.The great majority of tree cover remaining is forest fallow, defined asareas of generally low standing biomass, previously cleared, and nowsubject to shifting agriculture but with sizeable areas of commercialtimber where forest cover has not been too severely disrupted. The meanannual increme nt of the current growing stock is estimated here to beabout 21 MM m , although in computing this estimate it was assumed thatmost of the high density forest cover has minimal net annual primary pro-duction. Instead, the forest fallow, which is constantly regeneratingfrom a sub-climax state, is more highly productive. Indeed the nationalrubber tree crop of 160,000 ha is responsible for about 9% of the incre-mental forest biomass annually. Due to its accessibility to urbanmarkets this crop can be regarded as a major fuelwood resource. However,with such extensive forest cover, the mean annual increment of woody bio-mass is not a particularly relevant measure of how well the present andforecast demand for woodfuels can be sustained. Since the woodfuels gen-erated in the process of harvesting commercial timber (necessarily con-stituting only part of the boles of trees) is at least as much again, theannual coupe provides an alternative approximation for the sustainablewoodfuel yield from accessible native forest resources. By including theexploitable portion of forest fallow the commercial forest cover can beestimai-ed at 3.9 MM ha, enabling an a nnual coupe of commercial timber ona 40 year rotation of about 2.0 MM m . Wo%3dfuel quality residues shouldbe about double this volume, or 4.0 MM m . Combined with the annualwoody biomass productio3 of rubber tree and timber plantations, the totalbecomes about 6.6 MM m . These quite different, and admittedly crude,estimates of annual sustainable wood'ael production take no account ofthe depletion of growing stock in the process of developing land foragriculture, or for urban and industrial development. Deforestation is,however, a significant and ongoing process in Liberia and the wood other-wise wasted in this process must be included in the woodfuel supplyequation.
4.7 Deforestation i- occurring mostly through clearing for uplandrice production and, according to the FAO, is responsible for the loss ofabout 65,000 ha of high forest each year, half of which is closed forest.Total forest clearing for smaLlholder upland rice growing is about

- 67 -
180,000 ha per year, and generates about 23 MM m3 of wood waste annually.An additional 5000 ha of low lying forest is cleared each year for swampand irrigated rice culture, and some 3000 ha for a combination of urban-ization, timber plantations and commercial agriculture, giving rise to anadditional million cubic metres or so of potential fuelwood. ihe currentrate of biomass loss through forest clearing is about 24 HM m per year.These estimates of annual production of forest biomass, and of the bio-mass destroyed through forest clearing, must now be compared with esti-mates of present and future woodfuel consumption.
National Woodfuel Demand
4.8 An estimaLe of the 1983-1993 fuetwood demand for householdcooking is provided in Annex 32. The 1983 household consumption forfirewood and charcoal combined was estimated to be about 4.2 MM m3, andis forecast to grow to 5.9 MM m3 in 1993. The commercial/industrialconsumption of fueLwood for heat and steam raising in 1983 was in therange of 30-35000 m3 , or less than 1Z of household demand. While theindustrial demand for fuelwood should grow, it is unlikely to exceed 2%of the. 1993 demand and can be regarded as negLigible by comparison.Therefore, the projected annual consumption of woodfueLs during the nextdecade is lower than any estimate of the sustainable yield of forestbiomass assuming preservation of the existing forest cover. On the otherhand the current rate of deforestation, amounting to about 2% of theclosed high forest annually (see Annex 29), generates roughly four timesthe projected 1993 annual fuelwood demand in wood waste. From these datait can be safely concluded that there is no impending national crisis ofvoodfuel supply. However, a national overview quite often obscuresserious regional deficiencies due frequently to the concentrated demandof large urban areas. For that reason the supply-demand relationshipbetween Monrovia and its hinterland has been examined in some detail.
Supply and Demand of Woodfuels to Monrovia
4.9 Data on the pattern and level of consumption of woodfuels toMonrovia have been gathered by the Department of Energy in Liberia aspart of the joint Oak Ridge National Laboratory/Government of Liberia(ORNL/GOL) energy assessment begun in 1982. The mission has acceptedmuch of the statistical overview of household energy use that arises fromthe ORNL/GOL sample surveys of Monrovia households although, on the basisof a review of the survey met:iodology, and from observations of householdcooking behaviour during ths mission, lower estimates of firewood con-sumption have been assumed here. The above-mentioned surveys produced anestimate of firewood consumption based on recall by interviewees of 3.6kg/person/day. The GOL has accepted that this fig.re may be erroneous,hence the Bank mission has adopted a figure of about 2 kg/person/day.This more conservative estimate of firewood consumption obviously has theeffect of reducing estimates of demand on fuelwood resources inMonrovia's hinterland, presenting a less constrained view of futuresupply than might actually be the case. Therefore, the mission recom-nends that a detailed longitudinal study of a relativeLy small number of
- 68 -
generalLy representative households, say 40-50 in all, be subjected to acareful weighed input survey in each season to provide a more solid database for future woodfuels supply planning.
4.10 The mission's estimate of woodfuel demand for the city ofMonrovia from 1983 to 1993 is provided in Annex 33. It is estimated thatin 1983 about 50,000 te of charcoal and 90,000 te of firewood and resi-dues or woody scrap was consumed in the city. This translates into343,000 tonnes of wood equivelant (i.e. air dry wood, 252 moisture con-tent on a wet basis-mcwb), and in turn, allowing for Iome supply of woodyfuels within the city, to a demand of about 530,000 m (sv). This derandis expected to grow with the city's population to over 900,000 m in1993. Currently about one third of this volume is rubberwood from plan-tations within perhaps 50 miles of the city. Host of the firewood isrubberwood and most of the charcoal is produced from native forest tim-bers, with the denser hardwoods strongly favored by producers. The mis-sion surveyed markets in November and in February, ar,d found rubberwoodcharcoal to constitute about 20Z of the supply in the dry season and over301 in the wet season (the latter from sampling inner city markets only).This resource selection implies clearfelling about 600 ha of rubber plan-tations (retired trees), and about 3,500 ha of closed high foresc annu-ally at the current demand level. Utilizati n of the natural forestresource by charcoalers is poor; perhaps 100 mg of 250 m3 /ha, or 40Z ofstanding biomass, is converted to charcoal under the present method ofcarbonization. Once dried the larger logs remaining become difficult tocut, even with a chainsaw, and they either rot away or are burnt to makeway for agricalture. With this pattern of use the natural forest within50 miles radius of Monrovia is all but depleted, and it is now common forcharcoal to be brought 70 miles or more from Grand Bassa and Cape MountCounties. The current trend implies the loss of the equivalent of anadditional 50,000 ha of closed canopy forest over the next decade. Thistrend has serious implications for economic supply of commercial timberto the urban-industrial market, and for the supply of presently acces-sible export quality timber. Similarly, if the present trend continuesunabated, there may be significant real increases in the cost of charcoalfor domestic consumption over the next decade. The first recommendationarising from these observations is to upgrade the record of "he rate ofdepletion of forest cover in the hinterland of Monrovia in order to for-mulate and support required forest management poLicies. However, thereare several near term options for more efficient utilisation of existingwoodfuel resources that deserve immediate attention. The first of theseis increased utilisation of retired rubber trees.
Rubber as an Energy Crop
4.11 An estimate of the standing crop of rubber trees is provided inArmex 30. In 1983 the "national" rubber tree plantation was about162,000 ha with one-third in large plantations, mostly under expatriatemanagement, and two-thirds under small-holder plots averaging about 12ha. Smallholder plots are more densely planted and when mature havesubstantially higher stocking rates than large plantations. The FDA
- 69 -
measured the volume, planting density and basal area of smalL-holderplots for the mission, and th Ise data indicate an average standing bio-mass at maturity of 330 m /ha. The estimated annual incrementilproduction of woody biomass in the national plantation is 1.9 M m .However, we are concerned here with that part of crop that is readilyaccessible to Monrovia. The FDA used aerial photographs from 1979 toassess for the mission the area of smallholder rubber plots within a 50mile radius of Monrovia plus that alongside major highways out of thecity for 100 miles. This area was approximately 23,500 ha in 1979,compared with a total smallliolder rubber crop assessed by the Bank atthat time of 111,000 ha. A'1 of the concession rubber plantations can beregarded in this context as accessible, giving a total of about 75,000 hathat appear to be available for exploitation as a fueL source. With acrop of even age distribution the average annual woodfuel csupe of thisarea of mixed plantation and smallholder plots is 760,000 m . If it isassumed that the average age of the crop is 17 years, and that there areadequate incentives to replant retired trees the annual coupe from the"accessible" crop through 1993 will be abo3ut 1.2 MM mi. This voLume maybe compared with the estimated 175,000 m now consumed as charcoal andfirewood by households in Monrovia, plus industrial consumption for fueland timber. It is not known precisely how much rubber tree wood issupplied to other urban and industrial markets, though using the Fire-stone company's own consumption as a guide to the internal consumption ofthe rubber industry, and with some preliminary estimates of fuelwood usebv the manufacturing sector, it is unlikely to exceed a further 125,000-m , giving a total of about 300,000 m , or about 25% of the accessibleresource. This finding has significent implications both for the rubberindustry and for the protection of native forest resources.
4.12 First, if full use were made of senile rubber trees as fuelwoodthe pressure of woodfuel scavenging on the natural forest could be almostentirely removed. Currently, consumption of woodfuels other than fromrubber trees is only 40Z of the volume of rubber tree wood estimated hereto be available, and the total rubber tree wood available remains inexcess of the Monrovia demand well into the 1990s. Second, it can bedemonstrated that the commercial exploitation of retired rubber trees forfirewood and charcoal production can at least partly finance the rehabi-litation of the smallholder rubber industry. However, because of con-sumer preference for charcoal produced from dense high forest species thetransition to a rubberwood dominated fuelwood supply will be difficult,though it is encouraging that supply from this source is already signi-ficant. In fact, the contractual arrangements already negotiated betweencharcoalers and rubber growers are highly beneficial to both parties, andthe economic benefits cf this activity strongly favour the provisior. ofgovernment assistance to facilitate its expansion.
The Economics of Rubber Tree Wood Charcoal Production
4.13 It has been r;oted (para 4.10) that charcoal made from rubbertrees comprises between 15Z and 30% of the charcoal supply to Monrovia.Private entrepreneurs pay smallholder rubber growers a dollar per tree

- 70 -
for each tree harvested and carbonised. The FDA surveyed smallholderplots for the mission and established that the average numbes of treesner hectare was 495 and the volume per tree averaged 0.67 m . 4/ Thereturn to the grower is not only in the form of this cash, but throughsaving the cost of poisoning, clearing and burning the old rubber treesin the process of replanting. The Bank/GOL smallholder rubber projectidentifies the costs of replanting as $2,270/ha (non-discounted) 5/ overthe seven years to first tapping. The first year costs are $823/ha.Charcoalers pay one dollar per tree to growers for the right to makecharcoal from senile rubber trees. In clearing the trees for carbonisa-tion the charcoalers reduce the cost of replanting by a further $321/ha(1983 dollars: costs of poisoning and clearfelling). This benefit andthe cash payment amounts to $816/ha which is almost the entire first yearcost of replanting, and greater than 35Z of the costs of establishmentand maintenance through to production. Incentives to exploit the woodfuel potential of the rubber crop are also reflected in the comparativeeconomics of charcoal production. Table 4.2 summarises the economic andfinancial costs of charcoal production by traditional means for bothrubber and native forest woods. While the financial incentives for char-coal producers favour the carbonization of forest wood, with returns tolabour of about $1.60/day, compared with $1.40/day for charcoalers pro-ducing rubber tree charcoal. the economic costs of producing rubber woodcharcoal are only marginally higher than the costs of producing charcoalfrom forest wood. These data reflect the "in-forest" costs only.Because rubber plantations are closer to the market the cost of deliveryper bag will be lower on average than for forest charcoal, giving theeconomic advantage at the margin to rubber tree charcoal production.With the use of modern metal kilns for charcoal production, the economicbenefits accruing from the use of rubber trees as the fuelwood are verysubstantially greater than from the exploitation of natural forests (seepara 4.20).
4/ Planting density ranges from 333-906 per ha. The range of volume ofindividual trees is 0.54-0.83 m .
5/ To arrive at this 1983 cost estimate, the 1980 costs provided havebeen inflated by 20% except for labor which remains at $2/day.Source: Liberia Rubber Development Project, Fu1l Technical Report,November 1980, WAPD, World Bantk.
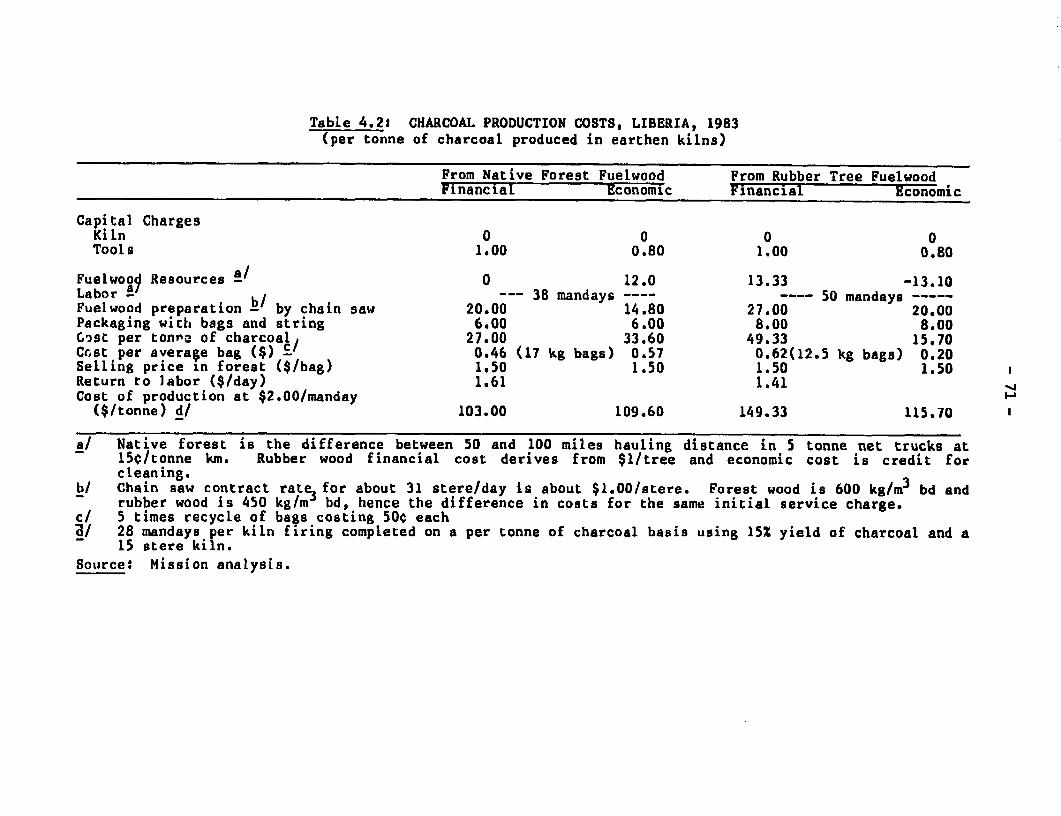
Table 4.2: CHARCOAL PRODUCTION COSTS, LIBERIA, 1983(per tonne of charcoal produced in earthen kilns)
From Native Forest Fuelwood From Rubber Tree FuelwoodFinancial Economic Financial Economic
Capital ChargesKiln 0 0 0 0Tools 1.00 0.80 1.00 0.80
Fuelwoo9 Resources al 0 12.0 13.33 -13.10Labor a / --- 38 mandays ---- 50 mandays-Fuelwood preparation b by chain saw 20.00 14.80 27.00 20.00Packaging wicth begs and string 6.00 6.00 8.00 8.00£rst per tonre of charcoal, 27.00 33.60 49.33 15.70Cost per averape bag (M) E 0.46 (17 kg bags) 0.57 0.62(12.5 kg bags) 0.20Selling price in forest ($/bag) 1.50 1.50 1.50 1.50Return to labor ($/day) 1.61 1.41Cost of production at $2.00/manday i($/tonne) d/ 103.00 109.60 149.33 115.70
a/ Native forest is the difference between 50 and 100 miles hauling distance in 5 tonne net trucks at150/tonne km. Rubber wood financial cost derives from $l/tree and economic cost is credit forcleaning.
bl Chain saw contract rats for about 31 stere/day is about $1.00/stere. Forest wood is 600 kg/rn bd andrubber wood is 450 kg/m bd, hence the difference in costs for the same initial service charge.
c/ 5 times recycle of bags costing 50f eachU/ 28 mandays per kiln firing completed on a per tonne of charcoal basis using 15X yield of charcoal and a
15 stere kiln.Source: Mission analysis.

- 72 -
Policy Implications and Recommendations
4.14 The mission has several recommendations arising from this re-view of supply prospects:
(a) Resource Inventory. The above analysis is based on assumptionswhich must be verified with accurate up-to-date information onthe status of the rubber tree resource. The mission thereforerecommends that a comprehensive survey of the rubber tree cropbe undertaken as soon as possible. This survey should estab-lish the present area under rubber trees in both the concessionand the smallholder sector, along with the age and estimatedremainirg commercial life by specific location for each hold-ing. The objective of the survey is to provide detailed infor-mation on the availability of fuelwood from retired rubbertrees on an annual basis through the next decade.
(b) Publication and Promotion of Resources Available. The GOLshould use the information gained through the above resourceinventory to advertise and promote the use of rubber trees forcharcoal production in cooperation with smallholders. Arrange-ments should also be made with the management of the Largeplantation sector to allow the areas being cleared to be con-tracted to charcoalers on the same basis. In both instancesthe role of the government is to provide information for entre-preneurs seeking information on growers prepared to contractfor the carbonisation of their retired trees.
Cc) Credit Facility for Modern Kilns and Equipment. The missionalso recommends the establishment of a small credit facilityfor charcoalers utilising the rubber tree resource as a resultof a successful negotiation with a grower. The facility wouldbe used for purchase of metal kilns and associated tools to im-prove the overall efficiency of charcoal production and henceto enhance resource recovery. The economics of metal kilnasversus traditional earthen kilns are examined below (para.4.17).
Other Woodfuel Resource Management Options
4.15 Significant -aste of fuel quality biomass is occuring in log-ging operations, sawmilling and in clearing for roads, infrastructure andtimber plantation development. For example, in 1984 it is anticipatedthat about 300 ha will be clearfelled in the Cape Mount Industrial Plan-tation area for the establishment of additional Pinus planrations. Theusable residues of this clearing should be at least 6,000 m , equivalentto 660 te of charcoal using traditional kilns. The mission recommendsthat these wastes be systematically identified and promoted to charcoalentrepreneurs in the manner proposed here for the retired rubber trees.Similarly, the use of these resources should be encouraged by the exten-sion of credit for modern kilns and tools to charcoalers agreeing tocarbonise these wastes.

- 73 -
4.16 The commercial future of pLantations already established andproposed is in doubt. The existing plantations in the Bomi Hills andCape Mount areas cover about 5000 ha, and were established largely for anexport pulpwood industry that no longer appears viable. Some of thesoftwood species planted are not well suited for the production of char-coaL, although most should produce charcoal about the same quality asrubber wood Eucalypt and Gmelina sp. coppice, and could begin to beharvested for woodfuels. The investment in these plantations can beregarded as a sunk cost and the charge to exploit the resource should bemerely to cover the management of the coppice rotation and fertilioers.These costs need to be identified though they are unlikely to exceed $300per hectare which is about the royalty that could be recovered from char-coalers using the precedent already set by the privase sector in the car-bonisation of retired rubber trees (assuming 200 m per ha recoverablevolume). The economic benefit of substituting the use of these planta-tions for further clearfelling of native forest must be added to thedirect cash receipts negotiated. These benefits are estimated at $12/techarcoal or $260/ha of plantation based on the marginal cost of addi-tional transportation to deliver charcoal produced in forests at an addi-tional 50 miles from the Monrovia market. The mission does not regardreplanting costs as a valid approximation for the economic cost of de-forestation in Liberia where forest resources are relatively abundant;however, there may be other, more accurate measures of the economic bene-fits of forest preservation.
4.17 The Cape Mount forests of 46,000 ha now reserved for plantationdevelopment must also be regarded as a potential resource for a managedwoodfuels production programme. This forest is within 80 miles ofMonrovia and has reasonable road cccess. In the very least charcoalproduction should be integrated with clearing and planting operationsusing the system of promotion and incentives proposed for senile rubbertrees and the other woodfuel resources identified. One possible form ofexploitation of this forest resource is for the production of charcoalfor export. The economic viability of this option is discussed below(para. 4.21); however, the sustainable yield of this forest on a 25 yearrotation is at least 25,000 te of charcoal/year, amounting to half theannual charcoal consumption of Monrovia per year, and representing asubstantial expc-t volume in the context of regional markets. Althoughthe costs of road access may prove prohibitive, the mission recommendsthat a preliminary feasibility study be conducted on the least costmethod of forest management to yield high density charcoal on a sustain-able basis from a long term rotation of the native forest. This optionshould be compared with clearing and replanting with fast growing shortrotation fuelwood species. Ideally, selected carbonisation of non-com-mercial species and specimens should result in increased production andvalue of commer:ial timber. The study wuuld identify the economic cost offeedstock for Lharcoal production as an input to the evaluation of amanaged program o5 charcoal production for export.

- 74 -
The Charcoal Industry
4.18 The charcoal industry is almost entirely a private sector acti-vity and appears to serve the market very efficiently. Although char-coaling is done by a Liberian version of the above-ground earthen kiln,and energy losses in conversion are high, the industry commonly useschain saws to prepare wood for carbonisation, and the system of transpor-tation and marketing is well organized. The industry appears to be com-prised of a large number of small production units, some full time andothers casually producing charcoal as the need for cash arises. Theseproducers are served by chainsaw contractors who work for a daily feeplus petrol. It is evident from the fee structure reported that both thechainsaw contractor and the charcoalers obtain a reasonable return ontheir investment. The most capital intensive link in the supply chain istransportation to the market on behalf of producers or buyers. Thedealers and truckers are the biggest units in the trade. Truckers and/orbuyers offer to deliver charcoal to the city for a fee related partly todistance from the market or to buy and resell on their own account. Fivetonne trucks are commonly seen pLying this trade. Trucks deliver char-coal either to a wholesale, or directly to a retail market. There is nomonopoly in the trade; hence, very many arrangements for buying and sel-ling apply. It is common to see up to ten tonnes of charcoal under tar-paulins or pLastic in informal marketplaces throughout the city. Re-tailers, commonly women, sell charcoal at these locations either in baglots or broken down into about one pound weight heaps.
4.19 An estimate of the price build-up in the charcoal industry isprovided in Annex 34. The ex-forest price is clearly negotiable and isas low as $1.00/bag at 70 miles from the market. Other costs vary on thearrangements applying with dealers and retailers, reflecting competitionin the market. Retail mark-ups appear to vary between 15 cents and 75cents/bag, though through observing the retail trade it is obvious thatmargins are improved by repacking heavy bags to gain an extra bag forevery four or so, and that substantial margins are gained by breakingbags down into 0.4-0.5 kg heaps where the effective retail price per bagis as much as $3.90, and the margins increase up to about $2.40/bag.
Improved Charcoaling Efficiency
4.20 Charcoal production by traditional methods is probably no morethan 15% efficient (22% energy conversion efficiency). 6/ A modifiedversion of the portable metal kiln - the ghana kiln - appears to be themost suitable alternative to the Liberian earthen kiln. This kiln offersa conversion efficiency of 25% which is 60% greater than the earthenkiln. Its management is easier and the charcoal produced is of uniformly
6/ The measure of efficiency in charcoaling is the proportion of char-coal produced tc the oven dry weight of the wood charge.

- 75 -
high quality. The kiln capacity is 6.5 steres, compared with at least 15steres for the traditional kiln. Due to higher efficiency and mucbreduced charcoaling times, the rate of production is about three timesthat for earthen kilns. In effect, a three man charcoaling team beingsupplied by a chain saw contractor using three metal kilns will producefrom native forest timbers about 110 te charcoal annually as opposed to amaximum of 40 te from two 15-stere earthen kilns. The costs of charcoalproduction with this kiln are provided for both rubber wood and forestspecies in Table 4.3. The financial costs of production with the metalkiLn are about 40Z of those with earthen kilns assuming a daily wage forlabourers of $2.00. Providing adequate credit were available to pro-ducers to purchase metal kiLns, the incentives to utilise them are sub-stantial. The maximum cost of three metal kiLns is $3000, and the anti-cipated life is five years. The improvement in economic benefits ofutilizing these metal kilns is about the same as for financial benefitsthough it is noteworthy that the economic costs of production of rubbertree charcoaL are greatly reduced, confirming rubber trees as the leastcost source of charcoal. The mission therefore recommends expansion ofthe demonstration project for the modified metal kilns, with a certainnumber donated to charcoal entrepreneurs, and establishment of a sourceof credit for their purchase in line with the recommendations above toprovide incentives for the carbonization of fuelwood resources with thelowest opportunity cost. The Partners for Eroductivity project shouldserve as the basis for the expanded program.
The Prospect for Exporting Charcoal
4.21 The Cape Mount forest resources now delineated for the devel-opment of industrial pulpwood plantations could possibly yield 25,000 teor more of charcoal per year over a long period and this may offer a re-source base for a charcoal export trade. An estimate of the export priceof charcoal is provided in Table 4.4. With the assumptions applied inthe cost estimates, the CIF price in Senegal or Mauritania ports isbetween $150-$175!te. The most critical assumptions in this estimate arethat the exporter owns and operates the transport to Liberian ports andthat shippers will charge per unit weight and not volume. The latterassumption is vital to the viatility of the trade as charcoal has a maxi-mum bulk density of 300 kg/mr in bags, hence charging by volume wouldresult in a shipping cost of $150-$200/te. There are precedents fromother parts of the world for charging charcoal shipping on a weightbasis, though this is clearly a matter for negotiation. This cost andpricing estimate also assumes that the trader has sufficient capital toinvest in trucks, and preferably his own metal kilns and forest-basedcharcoaling gangs, and that he has adequate working capital to establishthe trade. Capital requirements will be on the order of $300,000-400,000to initiate a 5000 te/year trade, depending largely on how the trade isstructured, and the efficiency of transportation. The mission under-stands that charcoal prices are on the order of $200/te plus in the mainports of Mauritania, suggesting that adequate margins may exist for atrader at the retail end. The mission therefore recommends that a de-tailed study of the costs and logistics of this trade be undertaken, and

- 76 -
that this study include the provision of risk capital for trial shipmentsto the preferred target markets.
Table 4.3: CHARCOAL PR1DOUCTION COSTS IN LIBERIA USING IMPROVED METAL KILNS(per tonne of charcoal produced in metal kilns)
From Native Forest Fuelwood From Rubber Tree FuelwoodFinancial Economic Financial Economic
Capital ChargesKiln a/ 6.10 4.30 8.40 5.80tools 1.00 0.80 1.00 0.80
Fuelwood ResourceCosts b/ 0 12.00 13.33 -13.10Labor c/ -- 6 man days - 8 mandays ---
Fuelwood Preparation d/by Chain saw 12.00 12.00 16.00 16.00
Packaging with Bags and String e/ 6.00 6.00 8.00 8.00
Cost per tonne tS) 25.10 35.10 47.73 17.50Cost per average bag (S) 0.43 0.60 0.60 0.22
(17 kg bags) (12.5 kg bags)Selling price in forest (S/bag) i.50 1.50 1.50 1.50Return to Labor ($/day# 10.52 (8.85) 9.28 (12.81)
Cost of Production at32.00/man-day (S/tonne) 37.10 47.10 63.73 29.50
a/ Financial cost of a "Ghana" metal kiln is 51,O0 and the economic cost 5750. Life is5 years and discount rate for capital recovery is 10%. Volume is 6.5 steres, yield is25% and firings are 80 per year. Rubber wood is 450 kg/mr bd; Forest species are 600
3kg/r bd.b/ as per Table 4.2.c/ Labor is based on one man/kiln/day with two kiln operations.d/ as per Table 4.2.e/ as per Table 4.2.

Table 4.4: POSSIBLE CHARCOAL EXPORT PRICE STRUCTURE, LIBERIA(USS)
Per Bag(of 17.5 kg ave) Per Tonne Coment
Contract Price ex-forest in CapeMount or Grand Bassa Countries S0.63-1,0 S37.15-57.14 - Ranging from production cost with
metal kilns (see Table 4.3) tocurrent lowest ex-forest price.
Economic cost of delivery to portsof Monrovia 0.25 14.25 - Could be lower. Cost is full cost of
owning and operating 10 tonne netcapacity trucks.
Net Cost of Bags 0,20 10.80 - Assumes about 3 returns or ricebags. Multiwalled, one-way, Icardboard bags may be desirable. 14
'.4
Port storage and loading charges 0,20 10.80 - estimate only. I
FOB cost 1.61-1,65 73.00-92.99
Possible trader markup (20% ofhighest FOB cost) 0,33 18.57 - depends on cost of establishing and
operating the trade.
FOB price 1.61-1,98 91.57-111.56
Shipping Cost 0.88 50.0 - Assumes shipping on weight basis In500 + tonne shipments
Insurance 0.04 2.50 - estimate only
Port Handling Costs Foreign Port 0t18 10.00 - estimate only.
CIF price S2.71-3.08 5154.07-174,06

- 78 -
Modifying Demand for Household Cooking Fuels
4.22 The majority of cooking is done on open fires either using thetraditionaL "three-stone" method of pot support, or metal pot stands ofvarious designs. However, most of this type of cooking takes place inruraL areas where there is an abundant fuel supply and no financialincentive to economise on fuel use. With urbanisation there is a sharptransition to charcoal cooking and hence to the use of charcoal stoves.Of course, charcoal is traded for cash and at current prices there maywell be incentives to reduce the amount of fuel required for dailycooking. The mission concentrated its review of cooking efficiency,therefore, on potential improvements in the fuel economy of charcoalstoves. Stoves of Liberian design in common use were tested in alaboratory using locally aquired aLuminum pots of typical dimensions.These tests revealed an average efficiency of heat utilisation of 24%,quite similar to charcoal stoves of traditional design in other Africancountries. This need not indicate a prospect of improving the overallfuel economy of cooking with charcoal for this will depend on the manage-ment of the charcoal fire throughout a typical cooking cycle. However,observations of cooking behaviour by the mission suggest that significantimprovements in fuel economy can flow from the use of stoves designed notonly to effect a greater transfer of energy at a certain power output butto reduce the size of the charcoal charge by reducing the size of thefirebox. The present stoves permit a Large amount of charcoal to beinstalled at the beginning of cooking, and the same amount seems to beloaded by housewives almost regardless of the cooking task. Certainly nounburnt charcoal is removed at the end of the cooking cycLe. The costsavings anticipated from cooking with improved stoves are quantified inTable 4.5, which indicates that a 20-30% reduction in cooking costs ispossible if efficiency data are indicative of ultimate fuel savings. Themission therefore recommends the trial of charcoal stoves known to havehigher efficiency and which are now available elsewhere (e.g., Kenya), toestablish both consumer preferences and the actual fuel economy of theseand the local stoves in the course of normal cooking cycles.
4.23 The next most common household cooking fuel in the cash economyis kerosene. The great majority of kerosene stoves in use are theChinese single wick type which have an efficiency of about 40% when new,though wick maintenance is difficult and is usually neglected, givingrise to efficiencies of 30% or less. The most recent models of Indianmultiple wick stoves such as the Ashok 10 wick stove yield efficienciesof 45-50% and have easier wick setting and maintenance procedures. Simi-larly, kerosene pressure stoves of the Swedish and Korean variety haveefficiencies in the range of 50-57%. Based on che ratio of efficienciesestablished, the anticipated reduction in the cost of kerosene cooking isabout 25-35% (see Table 4.5) with improved stoves. The mission recom-mends that traders be encouraged to import multiple wick and pressuretype kerosene stoves of high efficiencv for which reliable test dataalready exist. The government should promote these stoves to importersand then advertise their advantages when the choice is available to theconsumer.

Table 4.5: COST OF COOKING IN LIBERIA WITH PRESENT AND IMPROVED STOVES
Total CostCost of Fuel Annual Cost Annual Fuel of serviceper unit Cost per Conversion Capital Cost including use per unit energy
Fuel and Stove Type sold unit energy Efficiency of Stove malntenance b/ Stove c/ utilized(#/MJ) (PHU a/) (S)
CharcoalLiberian traditionaldesign 2,50/ 0,48 24 2.00 1.15 890 kg 2.00
sack of (2 yr life)17.5 kg (av.)
Kenya Jlko orThailand bucket type 30 4.0 1.60 743 kg 1.60
(3 yr life)35 1.37
KeroseneCurrent models sold inLiberia (Chinese singlewick type) 2,35/US 1.69 35 33,50 21,30 497 litres 4,95
gallon (2 yr life$20+M)
Indian Multiple wickType 48 17.00 d/ 11.80 362 litres 3.61
(2 yr lifeS20#M)
Swedish or Koreanpressure (primus) type 54 45.00 e/ 18.00 321 litres 3.28
(2 yr life,no wIck)
a/ Conversion efficlencies or percentage of heat utilized (PHU) are based on mission and Eindhoven Stove GroupMeasurements, Kenya charcoal Jiko has been measured at up to 36% PHU by ITOG.
b/ Discount rate Is 10% for capital recovery,c/ Family of five, 350 day per year service.d/ Price based on same markup over Asian market prices observed for Chinese wick stove in Monrovia,e/ Retail price In Holland, though similar stoves of German and Soviet manufacture sell for S9-S20 In equally distant
markets.
Source: Mission estimates; Eindhoven Stove Group for World Bank.

- 80 -
Kerosene and LPG Supplies
4.24 Since the cessation of refining in January of 1983 there havebeen occasional shortages in the supply of kerosene and particular diffi-culty in procuring LPG. The latter is desired almost entirely as insur-ance against power outages, which have been frequent and which are widelyanticipated to continue into the next dry season (Jan-Apr. 1985). TheLPG market is so small that lower cost supply is unlikely even if thepresent demand grows to one of primary use rather than just to back upelectricity. Nevertheless, Senegal is reported to be offering LPC supplyin bottles at reasonable prices from its refinery, hence the LPRC shouldinvestigate imports from that source. Kerosene will remain an importantenergy source for lighting even if its use for household cooking is con-strained by supply and relative price. Price and supply constraintsappear to apply only to Monrovia and its immediate hinterland. Outsideof this region kerosene from the Ivory Coast, amounting to perhaps 6-8MM1 per year, is at least 20% cheaper, though the trade is unrecorded.This supply appears to be secure and will presumably be maintained at amargin below the cost of the competing source from Monrovia, althoughthere may be some lag time in making up for substantial short term defi-ciencies in supply to Monrovia, should they arise. The mission believesthat this informal supply arrangement is desirable, and recommends onlythat an attempt be made to quantify the volume of the trade at the borderbetween the two countries.
Solar Water Heating
4.25 Superficially, the prospects for solar water heating appeargood. Power tariffs are at 15 cents/kWh, and the SRMC of electricityduring the dry season is 18 cents/kWh and usually solar water heating canbe justified at and above 8 cents/kWh. However, the market in Monroviais a maximum of 4,000 households, each of which consumes 150 kWh or moreper month for electric water heating. The economic benefits of servingthis market are substantial in that as much as 5 MW of peak capacity maybe utilised by water heating, and capacity is now severely limitedSimilarly, for the private consumer the payback on a 200 litre, 2.2 msolar collector costing $800 installed is less than four years, and thesecurity of service compared to the current reliability of power supplyis excellent. Despite these prospective benefits the mission is unableto recommend that the LEC finance and manage a retrofitting program forthe households concerned. For the t.'me being, the LEC is unable to en-force payment, to satisfy the consumer that it is charging only for theamount consumed, and to adequately organize its own accounts. Hence con-sumers will have to perceive the benefits of solar water heating forthemselves, and find the required initial capital. The mission suggestseither that the GOL promote to householders the benefits of their owninvestment in solar systems, and ensure duty free access for solar waterheating systems, or that an alternative vehicle for credit be establishedto enable householders to overcome the first cost barrier. For economic

- 81 -
reasons, it is desirable to limit the demand for installed capacity onthe LEC power system by ensuring that electrical back-up on solar systemsis limited to 1kW, and that electrical supply is manually initiated andthermostatically terminated. This may be achieved by a tax or importduty fixed per unit of kW of back-up.
Industry
4.26 In the industrial sector the mission reviewed prospects for imrprovements in the efficiency of energy use in manufacturing and for tbhosubstitution of woodfuels and direct solar radiation for petroleum fuelsin heat and steam raising. In addition a review was made of the economicviability of supplying the Bong Mine with fuelwood as a substitute for asignificant proportion of the fuel oil currently used to dry iron ore forexport. Visits were made by mission specialists to the most energy in-tensive manufacturing plants in Monrovia, to the Bong Mines, and to therepresentatives of the major rubber producers. The Bong Mine is the mostenergy intensive industrial undertaking in Liberia and had, by the end of1983, completed most of the financially justifiable measures to improveprocess energy efficiency. Similarly, almost all of the obvious andfinancially attractive measures to save fuel in the manufacturing sectorhave either recently been implemented or are committed. The mission con-cluded that there is little additional scope for further substitution ofdiesel and fuel oil or electricity with fuelwood in the manufacturingsector. However, there is an important economic prospect to substitutefuel oil with fuelwood at the Bong Mine and this option is discussedfurther below.
Energy Efficiency in Manufacturing
4.27 The brewery represents a good example of recent initiatives toimprove energy efficiency in the manufacturing sector. Just throughgeneral belt-tightening it has reduced its electricity consumption by 24%on an annual basis during the last year. In addition, by installing anew heavy fuel oil-fired boiler, the brewery not only saved the differen-tial in price over diesel but it reduced its overall oil use in steam-raising by about 32%. Similarly, the Firestone Company has reduced itselectricity consumption by 12% by reconfiguring its process with the useof steam for the preparation of rubber concentrate. Hotels are candi-dates for energy conservation, though currently with low occupationrates, major investment in new equipment for improving energy efficiencyis out of the question. Only relatively small efficiency improvementsare possible without capital investment. In summary, for fuels otherthan electricity the economic prospects for major gains in energy effi-ciency appear poor, and the mission believes that further attention bythe government in this area is not of high priority.

- 82 -
Interfuel Substitution in the Manufacturing Sector
4.28 There has been a surprising amount of interfuel substitutionundertaken in the past two years motivated by the increasing price ofpetroleum products. Among the major rubber producers, both Firestone andGuthrie have converted their electric or diesel rubber processing plantto wood-fired steam boilers using retired rubber trees from their ownclearing and replanting program. Firestone's 11,000 Lb/hr steam boilerconsumed 35 ce wood per day until March 1984 and is now consuming 50te/day to provide for 24 hour operation of the processing plant. Simi-larly, five of the city's eight bakeries are operating on wood fromretired rubber trees. The mission examined the prospect for large scaleindustrial solar water heating plant both in the manufacturing and hotelindustries anid found that investment here would show only marginal eco-nomic returns, and would be financially unattractive. For example, theJohn F Kennedy hospital is being refurbished with heavy fuel oil burningboilers which is the least cost option for low grade heat production atpresent fuel oil prices considering the boiler investment is a sunkcost. The largest serviceable hotel in Liberia, the Ducor Palace, usessteam boilers rather than electricity for water heating and althoughthese could be suppLemented with solar water heating the occupation rateis tow and the investment requirements substantial. The major power loadin hotels is for air-conditioning and this subject is dealt with inChapter III. For the estimated 800 beds of hotel capacity in honroviaconversion to solar water heating would provide a net savings of 27.5-55 MW hr per month, or $50,000-100,000 per year compared with an invest-ment of the order of $500,000. The mission believes that investment inlarge scale solar water heating is a very low priority in the context ofother energy sector investment needs. As noted above there has been amost desirable substitution of diesel with fuel oil in steam raising inlocal industry and commerce. However, one anomaly that deserves atten-tion is the use of about 300,000 liters of kerosene per year as a boilerfuel by the local soft drink bottLer. Contrary to the impression held byplant management, the mission finds that kerosene can be replaced oydiesel in the existing boilers without difficulty, resulting in an imme-diate saving of about 10% in fuel costs at current ex-depot prices.Moreover, fuel oil could be used with only minor investment in fuelhandling systems and a further cost saving of 30Z would accrue. Thus,the mission recommends that the Department of Energy promote this benefitto the industry concerned. Finally, the mission reviewed the prospect ofusing rice husks to displace diesel in rice drying at small rice mills.It was found that, of the 32 mills in operation, 29 are very small andbuy rice already sun-dried by growers. The remainder use diesel driersbut have a throughput of only 3 tonnes of rice per day on average, makinginvestment in rice hull burners at present uneconomic.
4.29 In 1983 the Bong Mine Company (BMC) advertised a request forproposal for the supply of 100te of wood per day yearround. The responseto this proposal was poor, with prohibitive delivered prices beingoffered. In discussion with the BMC it became clear that neither thecompany nor Liberian entrepreneurs fully understand the use of wood as a

- 83 -
fuel or the economics of its supply from a forest resource. Since theBMC had initiated the proposal due to the increasing proportion thatimported fuel made of its cost of production and, moreover, had satisfieditself through combustion trials that fuelwood could be integrated suc-cessfully with the fuel oil combustion system, there was a prima faciecase to re-evaluate this option with the benefit of more accurate costdata. The BMC imported about 25000te of fuel oil just for drying ironore in its pellet mill during 1983. The minimum delivered cost of thisoil was $188/te, amounting to US$4.7 million/year. Currently BMC paysfor this oil with foreign exchange earned offshore as payment for itsore. This foreign exchange is not available to the government; hence,any conversion of fuel oil to local fuelwood as a source of heat fordrying ore will result in a net increase in the supply of funds to theeconomy. The absolute size of the oil bill for this end-use is signif-icant in the national context, making the evaluation of this option forinterfuel substitution all the more important.
4.30 The quantity of wood tendered was 36500 te annuaLly, which isthe equivalent of 12500 te of fuel oil (at 14.3 MJ/kg wood of 25Z mcwb)or half gf the fueL oil used in the drying proces. This computes to55,000 m of wood at a basic density of 500 kg/m oven dry. In theprocess of analysing in detail the economic prospect of a wood-firedpower supply to the Monrovia grid the mission established the costs toharvest and deliver wood from the available resources. The annualrequirement the BMC have notified can readily be met from the existing4000ha of predominantly, Gmelina sp. plantations in the Bomi Hills (seeAnnex 31). The mission's estimate of the cost of harvesting and deliver-ing Gmelina wood to the roadside is $7.42/1m(sv). Regrettably, the BongMine is on the other side of the St. Paul River from the plantations andthere is no bridge in that region. This means a total transport distanicefrom the plantations to the mine of 160 km. There are also abundantrubber tree resources in the region of the mine that will have to be con-sidered in any final proposal for fuelwood supply, but for the purposesof this evaluation the mission has chosen to assume that only the mostremote and certain supply source is available. World Bank staff haveestimated transport costs for all classes of roads and vehicles, includ-ing depreciation, at 6 to 7 cents per tonne kilometre for the class ofroad that would be traversed to supply this fuel. The maximum costs arethose applicable to heavy trucks utilizing largely earthen roads, andthese are about 9 cents/te.km. The mission applied 12.5 cents/te.km. asa conservative estimate of the cost structure, including return oncapital for a private trucker, in analysing the delivered cost of fuel-wood. A fee of $2.50/te max. is included in the "ex-forest" costs toprovide FDA with funds for plantation maintenance. A stumpage fee is notapplicable as the resource has no opportunity cost. This FDA charge isalmost the same on a per tonne basis as that negotiated between rubberproducers and charcoalers. The delivered cost of fuelwood thus computesto about $30/te. This must be compared with the breakeven cost with fueloil.

- 84 -
4.31 In their trials of fuelwood combustion in the existing burners,BMC engineers noted about 10-15Z loss in combustion efficiency for thewood component. Allowing for this the breakeven cost of fuelwood de-livered to the mine with fuel oil on an energy equivelant basis is$51/te. Making allowance for comminution, handling and storage costsestimated at $5Jm3, the breakeven cost at the point of combustion appearsto be about $48/te. In order for the trade to be profitable to an entre-preneur, a suitable margin over full economic costs will be necessary.At $5/te the delivered cost becomes $35/te or about 60% of the breakevencost. If this price were achieved the BMC would save US$l million peryear, and Liberia would see, in effect, the repatriation of about US$1.3million per year. There is considerable evidence that these cost esti-mates reflect the actual experience of costs for a trade of this naturein Liberia today. First, in the past year Firestone Co. has been re-questing tenders for the delivery of 35-50 te/day of rubberwood frombulldozed retired plantations for its steam boiler. The current winningtender was for $9/te delivered over about 15 km. A local contractor hadsupplied the company up until March for $14/te. The implied transportcomponent of these delivered costs is very cLose to our estimate ofeconomic cost. Second, eytrepreneurs supply Monrovia bakeries with woodin small trucks (about lOm loads) from over 70 km for about $40/te.
Risks and Logistics
4.32 The BMC have so far refused to consider a supply contract ofmore than a year's duration for fuetwood. However, the initial capitalrequirements of an entrepreneur to undertake this business is at least$750,000 for supply at the level of 36,000 tonnes per year. It is incon-ceivable that an entrepreneur will take up the supply contract withoutthe security of a longer term supply contract. Clearly, some form ofrisk capital is required to alleviate the risk that the BMC will closewithin five years of the start of fuelwood supply. The mission believesthat the economic benefits of this fuel oil substitution program arepotentially so significant that a detailed feasibility study should beundertaken as a matter of priority. This study would identify the fullcosts to BMC, the capital required by an entrepreneur, the least costfuelwood resource, the Logistics of supply, the economic and financialbenefits likely to apply to all parties, and possible arrangements toalleviate unreasonable risk to the private sector participants. It maybe desirable, for example, to initiate the business on a smalLer scale.The study could be completed for about $40,000 by the end of 1984.

- 85 -
V. INVESTMENT, INSTITUTIONAL ARRANCENKETS AND NANPOIMR
Energy Sector Investment
5.1 Since the early 1970s Liberia's Public Sector Investment Pro-gram has been about 10-15% of GDP and energy sector investment has beenaround 3-5% of that. Energy sector investment has been almost synonymouswith power sector investment, although it is clear that there have beeninvestments in the refinery by the COL through the LPRC after 1978 thathave not been recorded as part of public sector investment. Table 5.1summarises energy investment as a proportion of public investment since1976 and projected in 1983 through 1987. Public sector investment plan-ning was initiated on a four-year plan basis in 1976 with the first planin 1976180, and the second plan made initially for 1981/82-1984/85 butrevised due to resource shortages and generally declining economic pro-duction to extend for six years covering the 1981/82-1986/87 period.There is no energy sector investment planning per se but rather a com-pilation of plans proposed by parastatals and others by the Ministry ofPlanning and Economic Affairs. The mission has, therefore, compiled theGOL energy sector investment from various line items in other developmentexpenditure categories. The lack of investment programming by a focalpoint for energy planning within the administration, such as an energyplanning unit, is a serious deficiency which must be rectified if abalanced and rational energy sector investment program is to be preparedand implemented. In the first two years of this period, 1981/83, theshare of energy in total public sector investment was about 202 becauseof the installation of major power generation pLant and considerableinvestments in petroleum exploration, product storage and refinery equip-ment. The COL's revised public sector investment program calls for aninvestment of US$1.1 billion over the six years concerned, with US$903million to be spent between 1983 and 1987. Of this, energy sector in-vestments comprise about 3.6% amounting to about US$39 million. Table5.2 outlines the pattern of energy sector expenditure made and proposedin this present plan period. For the remainder of the plan, investmentis 98% for power sector development, both in the MPS and in isolatedpower systems. This investment plan may be contrasted both in specificdetail and in scale with what the mission is proposing subsequent to theenergy assessment.
Table 5.1: OVERVIEW OF ENERGY INVESTMENTIN THE PUBLIC SECTOR, 1976-1987
1976/80 1981/83 1983/87
Total public sector investment 583 198 903Estimated average X of CDP 15.0 9.4 -Energy investment, actual and proposed 22.2 39.7 39.3Energy investment as % of pubLic
investment program 3.8 20.0 3.6
Source: COL and mission estimates.

- 86 -
Table 5.2: AVERAGE ANNUAL COMPONENT OF PUBLIC INVESTMENT PROGRAMBY SUBSECTOR, 1981-1987, ACTUAL AND PROJECTED
CUSS million)
GOL World Bank EnergyActual Progr6m --- Assessment MWsslon
A. Electric Power 1981/82 1983/87 % 1983/87 % 1984/93 51. Monrovia Power System 16.2 6.8 69 11.0 7t.6 9.6 79
2. Isolated Power System 0.1 2.9 29 0.4 2.6 0.7 6
B. Petroleum
1. Refinery/Petroleum 2.0 - - 1.6 17.1 0.8 6
Storage and Handling
2. Exploration 1.5 - - - -
C. Household and Industrial Energy - - - 0.3 1.8 0.5 4
D. Technical Assistance 0.2 0.2 2 1.0 6.9 0.6 5
Total 20.0 9.9 100 14.3 100.0 12.2 100
x of Public Investment
Program 20.0 4.3 5.9 10-15
Source: GOL and mission estimates.
Revised Energy Sector Investment Program
5.2 The mission's recommended energy sector investment program is
contained in Annex 35 and provides a year-by-year breakdown of investment
by subsector for both capitaL investment and technical assistance. These
investments are summarised in Table 5.2, which compares in average annual
terms the mission's investment program with that proposed by the GOL over
the period 1983/84-1986/87, and further compares investment in the short
term with that for the entire 1984/93 period. The mission sees the need
for 40X higher energy sector investment in the short term and a$%out 20%
higher on an average annual basis over the longer term above that pro-
posed by the GOL. GeneraLly, the GOL program excludes investment re-
quirements in petroleum supply, and in the household and industriaL
energy subsectors, whereas the mission has identified important invest-
ments in these areas. In addition, the GOL plan largely ignores tech-nical assistance to the energy sector in the form of pre-investment work
and the supply of skilled manpower. Despite the identification of a more
diverse investment program, the mission proposes substantially higher
investment in the power sector in absolute terms over the next three to
four years. Here again, the mission's proposals reflect an urgent need to
invest in rehabilitation of the MPS, and a recommendation not to invest

- 87 -
further in power supply to small towni until major tariff, metering andbilling reforms are installed and enforced (see 3.33). The GOL programimplies a share of about 4X and the mission's program 6% of the publicsector investment program target for the extended plan period specifiedby the COL to the Donors Round Table meeting in October 1983. Thisinvestment target equates to about US$180 million a year, whereas it isunlikely in present economic circumstances that a public sector invest-ment program of more than US$100 million per year will be possible. Thisimplies energy sector investment of between 10-15Z of public sectorinvestment over the next decade. Although this Level of investment isentirely desirable there are priorities within the program for the use ofinevitably scarce resources.
Investment Priorities
5.3 A list of the top priority and high priority energy sector in-vestments is provided in Table 5.3. This list is intended to assist theCOL in determining which of the many proposals for investment and tech-nical assistance to begin under the pressure of extreme competition fordevelopment funds. A total of $18.5 million in projects, pre-investmentwork and management contracts is required urgently, and will further de-fine and prepare for an additional set of high priority investments ten-tativeLy estimated at US$54 million. The foreign exchange requirementfor this component of the investment program is approximateLy US$60 mil-lion. This raises the question of the source of funds to finance, at aminimum, the priority components of the energy sector investment program.
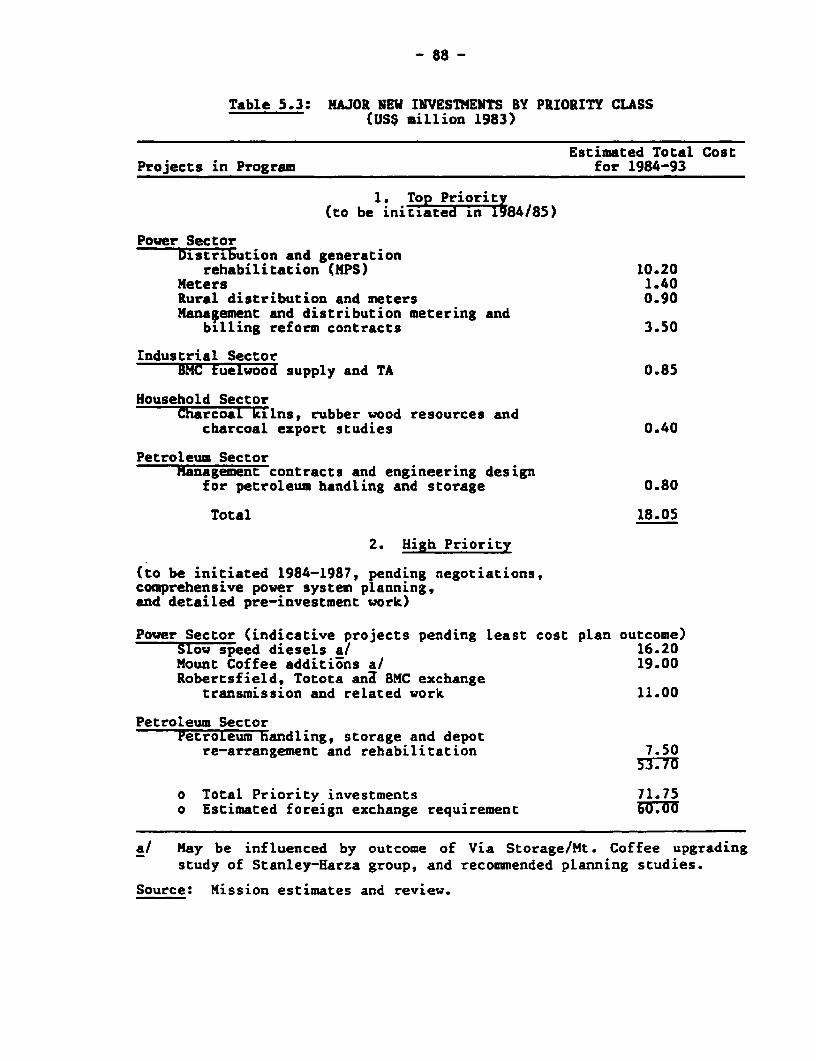
- 88 -
Table 5.3: MAJOR NEW INVESTMENTS BY PRIORITY CLASS(US$ miLlion 1983)
Estimated Total CostProjects in Program for 1984-93
1. Top Priorit(to be ini'tiated n 84/85)
Power SectorDistribution and generation
rehabilitation (MPS) 10.20Meters 1.40Rural distribution and meters 0.90Mana*ement and distribution metering and
billing reform contracts 3.50
Industrial SectorBMC fuel1ood supply and TA 0.85
Household SectorCharcoa1 kilns. rubber wood resources and
charcoal export studies 0.40
Petroleum SectorManagement contracts and engineering design
for petroleum handling and storage 0.80
Total 18.05
2. High Priority
(to be initiated 1984-1987, pending negotiations,comprehensive power system planning,and detailed pre-investment work)
Power Sector (indicative projects pending least cost plan outcome)Slow speed diesels a/ 16.20Mount Coffee additions a/ 19.00Robertsfield, Totota anl BMC exchange
transmission and related work 11.00
Petroleum SectorPetroLeum handling, storage and depot
re-arrangement and rehabilitation 7.50
o Total Priority investments 71.75o Estimated foreign exchange requirement 60.00
a/ May be influenced by outcome of Via Storage/Mt. Coffee upgradingstudy of Stanley-Harza group, and recomended planning studies.
Source: Mission estimates and review.

- 89 -
Source of Funds
5.4 The proposed energy sector investment program is comprisedmostly of power and petroleum supply projects and technical assistance.Historically both West German and OPEC/Saudi Fund grant or soft loanmonies have been supplied for power projects, and the World Bank has alsobeen a major power sector financier. Currently the AfDB has approvedalmost US$20 million for LEC tranmission projects, as discussed in para3.31. It is reasonable to expect an ongoing interest from most of thesefinanciers. USAID have also indicated an interest in funding small ruralelectrification projects and have funded a small village level micro-hydro plant currently under construction. USAID are also committedthrough 1985 to support their own energy assessment initiative, but itappears unlikely that major new sources of grant assistance will beforthcoming for energy sector projects in the near future. Assuming thatthe AfDB is prepared to consider some re-allocation of funds within therecently signed loan with the LEC, there is a shortfaLl of about US$40million in foreign exchange for projects that should be financed withinfour years. It is most unlikely that these funds can be supplied totallyfrom grant and soft loan sources and there is strict and essential con-trol on the rate at which new commercial debt is subscribed. In effect,if the energy sector investment program is to be implemented it will haveto be substantially financed from internal revenue. This is completelyconceivable given the highly advantageous position of both the LEC andthe LPRC of monopoly control and with their energy prices well above eco-nomic costs. It will be recalled that by 1986 the LEC can turn a profitexceeding US$8 million annually, and that the LPRC can cut its annualcosts of supply by at least US$10 million with relatively straightforwardreductions in costs and improvements in management practice. In anycase, without some significant improvement in the financial performanceof both major energy parastatals, donors and multilateral aid agencieswill look askance at funding large new projects. This perspective onfinancing the energy sector development budget strongly reinforces thepolicy measures proposed by the government with respect to reform withinthe LEC and the LPRC, and makes it clear that the GOL's key, and perhapsonly, means of undertaking the required energy investment program is tohelp itself in order to get help from others.
Energy Planning, Institutions and Manpower Needs
Institutional Arrangments
5.5 Manpower, institutional and planning issues specific to thepetroleum and power subsectors have been addressed and recommendationsmade where appropriate in Chapters II and III respectively. This sectionreviews the existing arrangements for energy policy and planning withinthe government and for the energy sector as a whole. The GOL implicitlyrecognized the importance of an integrated approach to energy sector man-agement and development in 1981 when it established the National Energy

- 90 -
Committee (NEC) as a high level body comprised of Ministers and heads ofenergy sector parastatals under the chairmanship of the Minister forLands, Mines and Energy. However, the NEC was not accorded any realdecision-making powers or significant administrative resources and soonafter its original members delegated their responsibilities to lowerlevel staff. Similarly, in October 1981, the statute of the Ministry ofLands, Mines and Energy was amended by decree of the Head of State toestablish a Department of Energy within the Ministry, and more recentlythe head of this department has been made an Assistant Minister. There isno mandate governing liaison between the NEC and the LEC, LPRC and otherenergy related agencies in respect of reviewing their investment plans,pricing proposals or corporate policies, hence, for the most part the NECand the DOE is bypassed by the management of the implementing agencies.Until recently the Ministry of Lands, Mines and Energy was not repre-sented on the boards of the energy parastatals, although in December 1983the Minister has been made Chairman of the Board of the LPRC. Finally,during the course of the last year, day to day management of the economyhas been vested with the Economic and Financial Management Committee(EPMC); a body which includes the Minister of Planning and EconomicAffairs, the Minister of Defence, and key departmental heads, under theChairmanship of the Minister for Finance though, despite the pivotalimportaDce of the petroleum and power sector performance to the economy,neither the Minister of LME nor the Assistant Minister for Energy isrepresented. In effect, then, the NEC and the DOE are isolated from themainstream of decision-making and authority in the GOL and are, as aresult, quite ineffective.
Energy Planning
5.6 Despite its lack of real authority the NEC, with the DOE asdefacto secretariat, made impressive attempts to develop a more compre-hensive understanding of issues and options in the energy sector during1982 and 1983 in the context of the GOL/ORNL energy assessment (phase 1)supported financially by USAID. A valuable set of historical data and adescription of the then operating conditions of each subsector of theenergy economy was developed with the enthusiastic co-operation of com-petent mid-level staff from a number of departments and authorities. Inthe same process valuable reviews were made of plans in the petroleum andpower sectors in the context of independent demand forecasts. Althoughthis effort had not cuLminated in sector wide investment plans andpolicies, considerable groundwork had been laid for some of the moresearching analyses that this mission has been able to undertake, and thecapability of GOL staff to contribute to energy planning has been welldemonstrated. However, largely because of the lack of clear mandates andweak links with real authority in the GOL the NEC has become merely aforum for occasional discussions, and enthusiasm among previous partici-pants to contribute to it further time and resources has waned. Themission regards the NEC as having served a valuable role in bringing tothe attention of Government the importance of energy to economic develop-ment and in raising critical issues of subsector mismanagement. However,the required transition to a fully fledged permanent energy policy and

- 91 -
planning administration should be completed. The mission therefore re-commends that the Department of Energy be greatly strengthened and theNEC be dissolved. Presently the responsibilities of the Department ofEnergy are confused with those of the Bureau of Hydrocarbons, which inmany respects can be regarded as its predecessor. The responsibility ofthe Bureau is to ensure thorough evaluation of the potential for economicdevelopment of petroleum in Liberia; a matter requiring skilled technicalinputs, and one not to be conftsed with overall energy sector policy andplanning coordination. The mission therefore recommends the formation ofan energy policy and planning division within the DOE quite separate fromthe Bureau of Hydrocarbons.
Role of an Energy Policy and Planning Division
5.7 The energy policy and planning function should not be confusedwith implementation. Even pilot projects in areas in which there islittle experience in Liberia should be made the responsibility of imple-menting agencies which can be other government departments, parastatalsor the private sector. Although the specific functions of an energyplanning administration will vary, the general obligations include thefollowing, which should become the main activities of the proposedLiberian energy policy and planning division:
(a) Prepare and maintain an energy sector investment program for arolling ten year period with projects, programs and technicalassistance requirements ranked in terms of priority, andspecify the policy, planning and pricing requirements for theimpLementation of this program.
(b) define and routinely update an energy resource inventory foruse by the major production subsectors, and assist them indefining the Least cost source of energy supply.
(c) maintain adequate records on economic and financial prices andcosts throughout the energy economy and advise the governmenton the adequacy and impact of prices applied and their policyimplications.
(d) provide assistance to the planning departments of the energyparastatals in identifying future markets and demand trends,especially where these may be altered as a result of governmentintervention, through prospective major projects or throughchanges in global demand for major export commodities.
(e) assist the government as the shareholder in the energy para-statals in defining and monitoring the objectives and perfor-mance of each, and in reviewing subsector plans and majorproject proposals.
(f) work closely with the Ministry of Planning and Economic Affairsin order to define the relative economic benefit and priority

- 92 -
of energy sector investments and technical assistance in theoverall public sector investment program.
Prerequisites for Effectiveness
5.8 To undertake these activities requires close and cooperativeliaison between the energy planning division and the management of energyparastatals. The mission believes that this cooperation can only realis-tically be achieved if the work of the division is of high quality and ifthe parastatals believe that it is in their interests to communicatetheir problems frankly and openly. These conditions are only Likely toprevail if the energy planning division has real authority by virtue ofbeing closely linked with the government's decision-making apparatus.The mission therefore recommends that the energy planning division beregarded explicitly as an advisory body to the EFMC, as well as to theMinister of LIE, and that the head of the energy planning division bemade a member of the boards of the LEC and LPRC. With the Minister'spermission the energy planning division should provide a regular briefingon the performance of the energy economy with respect to certain welldefined objectives concerning the implementation of agreed policies,projects and programs of the implementing agencies.
Policies and Plans
5.9 The ORNL/GOL ongoing energy assessment and this UNDP/World Bankenergy assessment provide the analytical basis and, to a large extent,the specific policies and projects of a precise prioricised energy sectorinvestment program and, with matching objectives, plans and programs forenergy sector management and development. Therefore the mission urgesthe COL to integrate these inputs into an agreed energy sector plan assoon as possible as the first stage of a dynamic annualised energy plan-ning process and the basis of ongoing dialogue within the GOL and betweenthe GOL and donors.
Manpower Needs
5.10 The DOE is poorly staffeq and has minimal administrative andlogistical support in comparison with the importance of its task. USAIDhas provided considerable assistance in the form of a resident energyadvisor and back-up consultancy services, though there are effectivelyonly two additionaL professional staff including the Assistant Minister.The mission believes there is a need for at least three full-time profes-sional staff other than the head of the DOE all with some economic skillsbut with technical training to match the priority areas for energy sectorassistance and investment; namely, power, petroleum and household energy(forestry and biomass fuel conversion). It is essential that the staffof the energy planning division be experienced and well trained for theywilL be expected to gain the respect of the energy parastatal management,and to provide high quality advice to the top level of decision making inthe government. At the same time, the planning capability of both theLEC and LPRC is expected to improve greatLy through the recommended

- 93 -
management service contracts. The mission believes that for the fore-seeable future some portion of the staff will have to be contract expa-triates provided under various technical assistance arrangements and,accordingly, that there must be very strong emphasis on trainingLiberians for these responsibilities. The actual registered professionalstaff of the energy planning division should therefore be at least sevento allow for those in full time training both in-service in the energysubsector agencies and in higher education and short courses.
Technical Assistance
5.11 The USAID technical assistance program is budgeted to continuethrough September of 1985. It is desirable that this or a similar pro-gram of support be extended for several more years and that adequate re-sources are provided for manpower training and development. The missionrecommends that expatriate support be extended to at least two full-timeprofessionals, and that efforts be made to recruit both retired andjunior professionals through the relevant volunteer agencies. There isalso a minimum requirement of four man-years of training per year, in-cluding the higher education, short course and on the job trainingprograms.

Table 5.4: ENERGY SECTOR INVESTMENT PROGRAM: 1984-1993(USS million)
1984 1985 1986 1987 1988 1989 1990 1991 1992 1993 Total %
1. Capital InvestmentA. Power Supply
Generation 0.50 6.40 16.40 14.05 4.55 1,25 1.00 5.75 10.50 5.00 65.40DlstrlbutlonlTransmisslon 0.40 1.90 5.90 4.90 5.20 5.70 10.70 2.20 0.20 0.20 37.30
Subtotal 0.90 8.30 22.3 18.95 9.75 6.95 11.70 7.95 10.70 5.20 102,70 85
B. Petroleum SupplyPort, storage and depotrehabIlItation 1,27 3.75 2.48 7.50 6
C. Household Sub-SectorFuelwood to BMC 0.30 0.50 0.8 I
D. Household Sub-SectorCharcoal klIns 0,10 0.10 0.50 0.25 1Solar water heatIng 1,0 1.0 1.0 1.0 4.00 to
Subtotal 0,10 0,10 0.05 1.0 1.0 1.0 1.0 4,25 3
2, Technical AssistanceA. Power 0.2 0.55 0,85 0.50 0.50 0,35 0.10
8, Petroleum- Management contracts 0,08 1.00 1,00 1,00- Petroleum handlIng & depot
design 0.20
C. IndustryIndustrial fuelwood 0.05
D. Households- Charcoal production/Import 0,15 0.10- Rubber wood resources 0.15- Household cooking 0,03 0.10- Solar water heating 0,07
Subtotal 0,28 2.13 2.05 0,92 0,50 0.50 0.35 0,10 5.80 5
Total 1,18 12,11 25,70 22.40 11,25 8.45 13.05 9.05 10.70 5.20 122.08 100
Source: Mission estimates, Tables 2.8 and 3.10.

Annex 1
ENERGY BALANCE, 1983(103 TOE)
Indiganous importedFuetwood Hydro Charcoal Electricity LPG Gasoline AVGAS Jetfuei Kerosene Diesel Fuel Oil Total Total
Gross Supply 852.4 71.9 0.6 71.7 0.6 30.4 5.4 131.9 180.9 421.5 1331.5
1.1 Production 852.4 71.91.2 Imports 0.6 77.3 - 36.2 3,2 142.8 172.3 432.4
1.3 Stock Changes - (5.6) 0.6 (5.8) 2.2 (10.9) 8.6 10.9
C.ulverbion2.1 Petroleum Depot Use (093) (0.1) (2.2)2.2 Chdrcoal Productlon (69.5) 69.52.3 Electricity Production - (7119) 282.4 (54.4) (156.1)2.4 Conversion Losses (222.3) 192.5 VI2.5 Electricity Losses (11.1)
Net Supply 560.6 69.5 78.8 0.6 71.4 0.6 30.4 5.4 77.4 22.6 208.4 917.3
Domestic Consumption4.1 Mining 53.1 23.0 21.8 95.34.2 Other Industry b/ 4.4 2.8 0.2 0.6 0.8 8.84.3 Agriculture 1.9 1.2 4.54.4 Households 556.2 69.5 9.0 0.3 4.2 639.2
4.5 Iransport 70,2 0.6 30.4 46.4 147.6
4 .6 CoxmercIal/Government 12.0 0.3 1.0 2.9 16.2
Source: Mission estimates

Annex 2
ENERGY BALANCE, 1993(103 x TOE)
Indigenous ImportedFuelwood Hydro Cnarcoal Electricity LPG Gasoline AVGAS Jetfuel Kerosene Diesel Fuel Oil Total Total
Gross Supply 1219.2 77,6 0.2 89.6 0.9 42.4 7.8 76.5 38.9 256.8 1553.11.1 Production 1219,2 77.6 0.2 89.6 0.9 42.4 7.8 76.5 38.9 256.81.2 Imports 0,2 89.6 0.9 42.4 7.8 76.5 38.9 256.8
1.3 Stock Changes
conversion2.1 Petroleum Depot Use (093) (0.9) (2.1) (3.3)
2.2 Charcoal Production (11311) 113.12.3 Electricity Production (77.6) 132,9 (20.3) (35.0) (0.0) U
2,4 Conversion Losses (363,1) (88.7) (451.8) Oh
2,5 Electricity Losses (6.6) (6.6)
Net Supply 743,0 113.1 37.6 0.2 89.3 0.9 42.4 7.8 55.3 1.8 197.7 1091.4
Domestic Consumption4.1 Mining - -
4.2 Other Industry 10.2 3,5 0.4 1.8 15.9
4.3 Agriculture 1.9 1.8 7.3 11.0
4.4 Households 732.8 113.1 14,3 0,2 6.5 866.94,5 Transport 87,5 0.9 42.4 44.4 175.24.6 CommercIal/Government 17,9 1.3 3.2 22.4
Source: Mission estimates.

- 97 -
Annex 3
BORDER PRICE BUILD-UP FOR LIBERIA, FIRST QUARTER, 1984
Conponent Diesel Oil Gasoline Fuel Oil Kerosene Unit Cost
- (5/tonne)
(cents per US gallon) Basisas above
Landed Price per tonne 252 283 188 265Build-up
cents/US gallon C&F 79.00 78.00 67.00 79.00Wharfage 0.41 0.36 0.46 0.39 S1.30/teOn-shore handling costs
Jetty and Pipeline toStore-storage 0.36 0.36 0.36 0.36 15 cents/bbl
Storage charges 0.60 0.60 0.60 0.60 25 cents/bbICommon Pipeline 0.13 0.13 0.13 0.13 5.254/bblDemurrage charges 0.36 0.36 0.36 0.36 15 cents/bblBrokerage fee
(renegotiated) 1.58 1.56 1.34 1.58 2% of C&FOcean and terminal losses 0.24 0.39 0.20 0.24 0.3% non-volatile,
0.5% volatileWorking Capital 1.58 1.56 1.34 1.58 1 month, 2%/monthInsurance 0.08 0.08 0.07 0.08 0.1% CBF value
Depot Changes(LPRC) 0.60 0.60 0.60 0.60 25 cents/bbl
Wholesale cost 83.94 84.00 72.46 84.94
Delivery to retail andretailing costs 5.69 5.69 5.69 5.69 1.5 cents/litre
Retail cost 89.63 89.69 78.15 90.03
Note: US gall/te 319 358 281 335bbIs/te 7.60 8.53 6.67 7.99
Source: Mission estimates and LRPC.

- 98 -
Annex 4
EX-DEPOT PRICE BUILD-UP: EXAMPLES OF GASOLINE,DIESEL OIL AND FUEL OIL
(US$)
Component Gasoline Diesel Oil Fuel Oil
C&F Cost 0.78 0.79 0.67Excise duty 1.25 0.30 0.29Cost Stabilization Fund 0.50 - -
LPRC Costs 0.40 0.40 0.40
Total Cost a/ 2.93 1.49 1.36
LPRC Margin -0.12 0.67 0.31
Ex-Depot Price 2.81 2.16 1.67
a/ As supplied by LPRC.
Source: LPRC and mission estimates.

- 99 -
Annex 5
L13ERIA - 1983 PURCHASE/SALES PATTERN
('000 bbls)
Motor Aviation Jet Gas Fuel
LPG Gasoline Gasoline Kerosene Fuel Oil Oil Asphalt Total
Purchases by
LPRC - 516 - - 43 590 12- - 1,269
LAMCO - 11 - - - 200 65 - 276
[MC - - - - - 184 993 - 1,177BP/Mobil - - - 204 - - - 204
Total - 527 - - 247 974 1,178 - 2,926
Deliveries/
Sales to
LAMM0 - II 0 0 0 200 65 - 276iMC - - - - - 116 959 - 1,075
NIOC - - - - - 73 - - 73Firestone - - - - - 28 - - 28
LEC - - - - - 183 103 - 286
Retail ., 478 a/ 4 15 207 289 b/ 20 2 1,015
Total 489 4 15 207 889 b/ 1.147 b/ 2 2,753
a/ Of which 6 sold to Mobil and Texaco.
b/ Excludes bunkers. Includes use by LPRC. Difference between purchases and sales
also attributable to stock changes.
c/ Actual usage in Liberia is higher as a result of unrecorded imports.
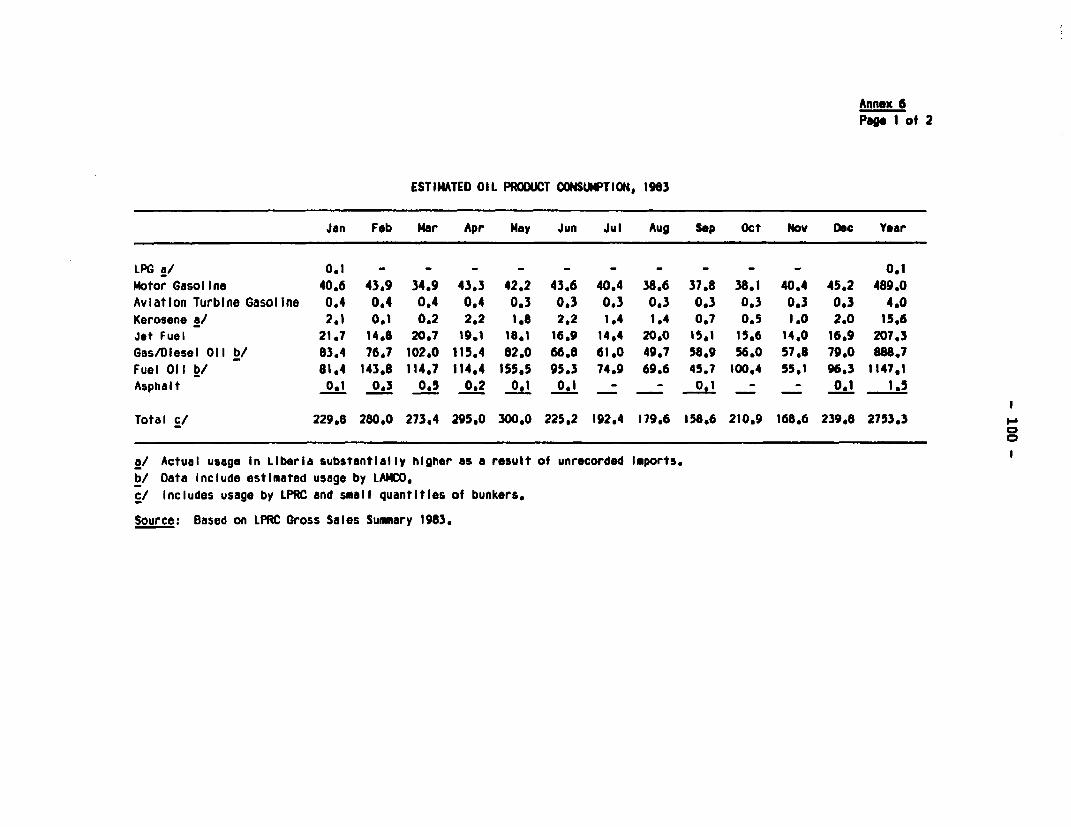
Annex 6Page 1 of 2
ESTIMATED OIL PRODUCT OONSUMPTION, 1983
Jan Fob Mar Apr May Jun Jul Aug Sep Oct Nov Dec Year
LPG 0.1 -a/0.1Motor Gasollne 40.6 43,9 34.9 43,3 42.2 43.6 40.4 38.6 37.8 38.1 40.4 45.2 489.0Aviation Turbine Gasollne 0,4 0.4 0.4 0.4 0.3 0,3 0.3 . 0. 03 0.3 0.3 4.0Kerosene a/ 2.1 0.1 0.2 2.2 1.8 2,2 1.4 1.4 0.7 0.5 1.0 2.0 15,6Jet Fuel 21.7 14,8 20,7 19.1 18.1 16,9 14,4 20,0 15,1 IS,6 14,0 16,9 207,3Gas/Diesel Oil b/ 83.4 76.7 102.0 115.4 82.0 66.8 61.0 49.7 58.9 56.0 57.8 79.0 888.7Fuel Ol b/ 81.4 143.8 114.7 114,4 155.5 95.3 74.9 69.6 45.7 100.4 55*1 96.3 1147,1Asphalt 0,1 0.3 0.5 0,2 o0l 0,1 _ - 0.1 1, 5
Total cl 229,8 280.0 273N 4 295,0 300,0 225,2 192,4 179.6 158.6 210.9 168.6 239.8 2753,3o
a/ Actual usage In Liberia substantially higher as a result of unrecorded Imports.b/ Data Include estimated usage by LANCO,c/ Includes usage by LPRC and small quantities of bunkers.
Source: Based on LPRC Gross Sales Sumary 1983.

Annex 6Page 2 of 2
LPRC - DEVELOPMENT OF OIL STOCKS, 1963
Gasoline Kerosene/Jet Fuel Gas Oil Fuel Oils s s s
End Month Storage Days' End Month Storage Days' End Month Storage Day5' End Month Storage Days'Stocks Capacity Supply Stocks Capacity Supply Stocks Capacity Supply Stocks Capacity Supply
('000 bbis) (a) (b) ('000 bbis) (a) (b) ('000 bbls) (a) (b) ('000 bbis) (a) (b)
January 4.8 6 3 10,6 21 20 2.8 3 1 137.4 56 2SFebruary 19.1 24 17 17.4 34 26 37,9 39 14 50.9 22 14March 4.9 6 3 II. 23 16 24.7 25 7 130.0 SS 36April 21,3 26 16 23,5 45 37 31,2 32 iS 22.6 10 4May 37.0 46 25 20,7 40 32 43,6 44 26 36,0 15 12June 46,0 57 35 16,7 32 33 55,5 57 39 60,0 25 27July 18.8 23 IS 15.9 31 23 33,5 34 32 128.7 54 63 aAugust 52.5 65 42 10,3 20 19 114,6 117 82 61,7 26 47September 15.2 19 12 11.9 23 23 110.8 113 88 :54.0 65 51October 36.7 45 29 12.7 25 25 84.6 86 63 S5.5 23 34November 38.5 47 26 36.6 71 60 43.7 45 22 138.8 59 48December 43.4 54 32 31.1 60 44 58.1 59 27 169.1 72 70
a/ t nominal LiRC storage capacity including Intermediate and finished storage.b/ End month stocks calculated in terms of days supply on basis LPRC sales (oxluding own use) In following month.
Source; LPRC Monthly Soles Su-ales,

Annex 7Page 1 of 2
GASOLINE PRICES PAID BY LPRC COMPARED TO INTERNATIONAL SPOT MARKET LEVELS, 1983
Motor Gasoline S/metric tonDelivered Cargo Platt's Spot Spot Assessed C&F Price Premia PaidLiberia (tonnes) Quotation (a) Freight (b) Market Price (c) Paid by LPRC by LPRC
International cargoes:
Jan 8 2,501 283.5 8.5 292.0 321.5 29.5Feb 6 2,7501 282.5 8.0 290.5 319.25 28.75Feb 23 3,838 266.5 8.0 274.5 315.0 40.5Mar 30 2,017 250.5 9.0 259.5 268.5 9.0Apr 3 6,821 260.0 9.5 269.5 291.5 22.0May 14 2,084 300.0 10.0 310.0 314.0 4.0May 29 4,500 287.5 10.0 297.5 316.5 19.0Jun 10 1,099 291.0 9.5 300.5 312.5 12.0Jun 24 5,000 293.5 9.5 303.0 311.5 8.5Jly 27 1,500 292.0 8.0 300.0 309.0 9.0Aug 7 3,000 293.0 8.5 301.5 309.0 7.5Aug 28 5,632 295.0 8.5 303.5 307.0 3.5Sep 30 5,285 284.5 8.5 293.0 303.5 10.5 0
Nov 11 3,091 278.0 9.0 287.0 289.5 2.5 N
Nov 11 2,000 278.0 9.0 287.0 288.0 1.0Dec 12 5 751 269.5 8.5 278.0 288.0 10.0Sub-total 5 TI IZT
Local Cargoes:
Jan 3 987 283.5 8.5 292.0 678.0 386Feb 2 894 282.5 8.0 290.5 745.5 455Mar 22 302 254.0 8.5 262.0 719.0 457Oct 7 1,485 274.5 8.5 283.0 339.0 56Sub-toLal 3,668 m77Grand Totals 60,537 30
a/ Averages means quotations for barges fob Rotterdam and cargoes fob Italy during the week two tothree weeks before delivery, i.e. at the time of loading.
b/ For 30,000 dwt clean products tanker for single voyage to Liberia from Europe (average of freightfrom Rotterdam and Italy).
ct Spot fob price plus indicated freight.

Annex 7Page 2 of 2
DIESEL PRICIS PAID BY LPRC COMPARED TO INTERNAATiONAL SPOT MARKET LEVELSp 1983
Diesel Oil $/metric tonDelivered Cargo Platt's Spot Spot Assessed C&F Actual CVF Price Premia PaidLiberia (tonnes) Quotation (a) Freight (b) Market Price (c) Paid by LPRC by LPRC
International cargoes:
Jan 8 9,026 287.5 8.5 296.0 318.25 22.25Feb 23 11,545 241.5 8.0 249.5 297.5 48.0Mar 20 89969 234.0 9.0 243.0 257.0 14.0May 14 4,997 245.0 10.0 255.0 259.5 4.5May 29 5,997 235.0 10.0 245.0 254.0 9.0Jun 10 4,390 238.0 9.5 247.5 262.0 14.5Jun 24 4,059 241.0 9.5 250.5 264.0 13.5Jly 24 3,107 239.5 8.0 247.5 260.0 12.5Aug 7 3,600 243.0 8.5 251.5 260.0 8.5Aug 28 5,770 250.0 8.5 258.5 256.3 (2.2)Sep 8 1,675 248.5 8.5 257.0 265.0 8.0Sep 28 3,666 248.5 8.5 257.0 265.0 8.0 HOct 2 1,600 248.5 8.5 257.0 265.0 8.0Dec 18 8,929 247.5 8.5 256.0 250.0 (6.0)
Sub-total 77,330 14.7
Local Cargoes:Feb 7 1,113 260.0 8.0 268.0 585.0 317.0Mar 22 701 234.5 8.0 242.5 601.0 358.5
Sub-total 1,814 333.0
Grand totals 79,144 22.0
a/ Averages mean quotations for barges fob RoLterdam and cargoes Fob Italy during the week two toLhree weeks before delivery, i.e. aL the time of loading.
b/ For 30t000 dwt cLean products tanker for single voyage to Liberia from Europe (average of freightfrom Rotterdam and Italy).
c/ Spot price plus indicated freight.

- 104 -
Annex 8
MAIN LPRC TANKAGE
Refinery Number Total CAP (Net) Type
(bols )
Crude Oil 3 247,000 CRUnifiner charge (1) 1 19,100 CRPlatform charge 1 2,700 FRHydrotreater (1) 1 7,900 CRLPG 2 1,000 CYLCasoline 6 32,700 FRKerosene/Jet Fuel 6 24,800 CRDiesel Oil 4 26,500 CRFuel Oil 2 38,200 CR
Total 26 400,000
MOBIL TERMINALGasoline (2) 1 9,700 FRKerosene 1 9,700 CRDiesel Oil 2 24,200 CRFuel Oil 3 70,000 CR
Total 8 113,600
TEXACO TERMINALGasoline 2 33,700 DR & CRKerosene (3) 1 4,900 CRDiasel Fuel 2 42,400 CRFuel Oil 2 204,000 CR
Total 1 185,000
Notes: (1) Out of service 3/83 for roof repair.(2) Used for 100 Octane Avgas, by Mobil.(3) Second kerosene tank (No. 3) out of service
Source: LPRC

- 105 -
Annex 9Page 1 of 6
ECONOMICS OF REFINING IN LIBERIA IN 1988 AND 1993
Basis of calculation:
1. Forecasts of future Liberian product demand, crude prices,European product prices and appropriate ocean freight rates as suppliedby consuLtants to the assessment mission. The highest forecast forproduct demand is used to indicate the most favourable refining outlook(since the result is, in any case, negative).
2. All calculations in constant (1983) U.S. dollars.
3. Ex-refinery product value assumed to be at import parity, withproduct at spot prices FOB Milazzo.
4. Miscellaneous import charges (consular fees, throughputcharges, inspection fees, etc.) assumed to be equivalent for crude andproduct imports, and not included in the calculation. These chargestotal 4-52 of CIF vlaue and differences will have a minor effect on therefinery economics.
5. LPG and asphalt volumes are small and are included at keroseneand fuel oil prices respectively. In fact they are likely to fetchhigher prices, but in each case have specific higher production andhandling costs and require individual study if and when refiningoperations commence.
6. Refinery fuel assumed to be 5% vol. Fuel oil equivalent oncrude charged. This could be reduced following specific efficiencyimprovements.
7. European price of fuel oil to Liberian specification (1500seconds Redwood I) calcuLated as 92Z high sulfur Bunker C, 8% Gas Oil.
8. Refinery produces all demand except Aviation Gasoline.
Forecast Data
1. Liberian Product Consumption - see Tables in Chapters I and II.
2. Crude and Product Prices: (1983 constant dollars) - SpotMarket.
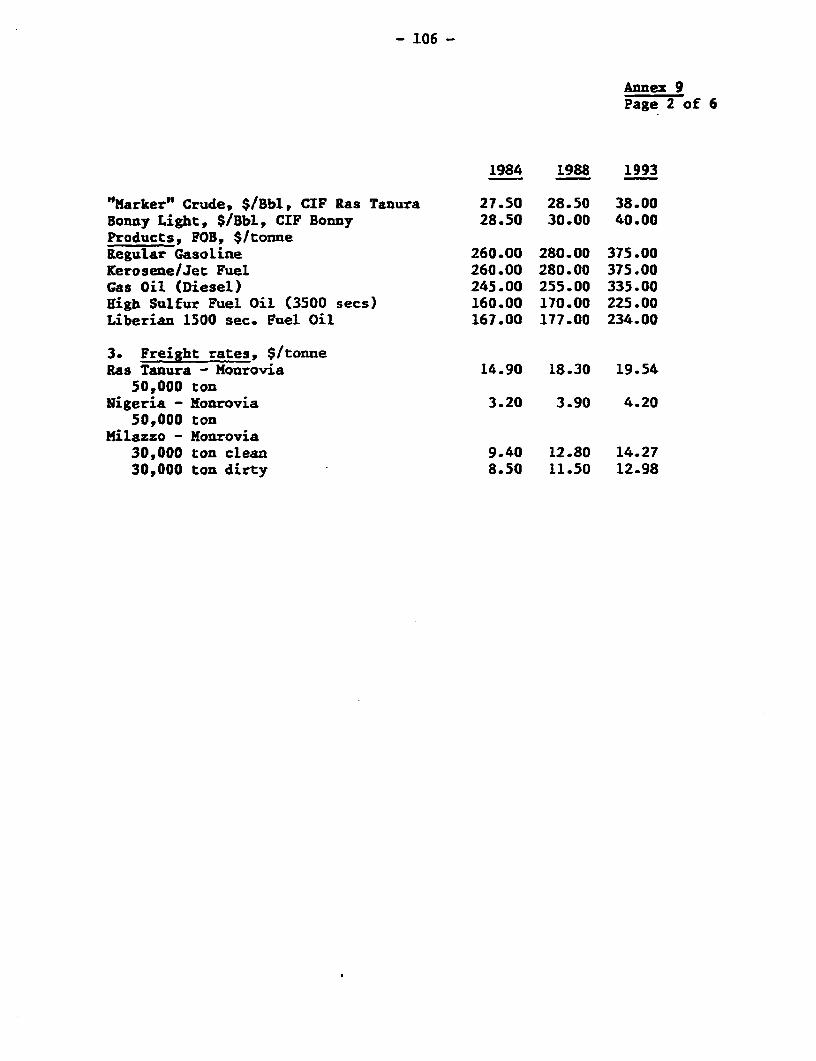
- 106 -
Annex 9Page 2 of 6
1984 1988 1993
"Marker" Crude, $/Bbl, CIF Ras Tanura 27.50 28.50 38.00Bonny Light, $/Bbl, CIF Bonny 28.50 30.00 40.00Products, FOB, $/tonneRegular Gasoline 260.00 280.00 375.00Kerosene/Jet Fuel 260.00 280.00 375.00Gas Oil (Diesel) 245.00 255.00 335.00High Sulfur Fuel Oil (3500 secs) 160.00 170.00 225.00Liberian 1500 sec. Fuel Oil 167.00 177.00 234.00
3. Freight rates, $/tonneRas Tanura - Monrovia 14.90 18.30 19.54
50,000 tonNigeria - Monrovia 3.20 3.90 4.20
50,000 tonMilazzo - Monrovia
30,000 ton clean 9.40 12.80 14.2730,000 ton dirty 8.50 11.50 12.98

- 107 -
Annez 9Page 3 of 6
1988 REFINERY ECONOMICS
(l) Arabian Light Crude
Fuel OilLPG Mogas Kero/Jet Gas Oil & Asphalt Total
Estimated Demand.m Bbi 2 552 295 603 1,180 2,632B/D 5 1512 8a8 1,652 3,234 7,211S vol. on crude 0.1 21.0 11.2 22.9 44.8 100.0
Import Cost, FOBS/tonne FOB Milazzo 280 280 255 177
Bbl/tonne 12.4 8.6 7.9 7.5 6.7
S/BbI 32.56 35.44 34.00 26.42
Freight CostMilazzo - Monrovia,
30,000 ton tanker,S/tonne 12.80 12.80 12.80 11.50
S/Bbl 1.49 1.62 1.71 1.72
Import Cost, CIF5/Bbi 23.60' 34.05 37.06 35.71 28.14
US S million/year 0.05 18.79 10.93 21.53 33.21 84.51
Crude Oil Required:Saudi Arabian Light 2770 Bbl/year (includes 5% refinery fuel)
Price FOB Ras Tanura 38.50 S/blFreight S/tonne 18.30
Bbl/tonne 7.35Freight SfBbl 2.49
Crude Price, CIF Monrovia, S/Bbl 30.99Crude cost, US million S/year -5.84
Gross Margin, US million S/year (1.33)Operating Costs - Refining Only 7.20Refining Profit (Loss) US million S/yr (8.53)
Note: No significant balancing imports/exports should be required for this case. ArabianLight yields approximately 45% 650 plus residual with 3.1% sulfur, and 36% middledistillate in the 300 - 650 F range. Refinery fuel Is taken as 5% volume on crude.
* Equivalent to kerosene op a weight basis.

- 108 -
Annex 9Page 4 of 6
(ii) Forcados, Nigerian Crude (29.7' API)
Several of the Nigerian crudes have been considered forLiberia. Freight cost from Nigeria is low, but quality problems for ahydroskiuming refinery have been identified, i.e. the 24-39'C pour pointsof atmospheric residues from Bonny crudes. Forcados is considered below.Distillation yields on Forcados would meet Liberian 1988 demand withoutbalancing imports. Quality is not fully analysed and could be a problem.
Crude oil required, m Bbl/year 2770Crude cost, FOB Forcados, $/BbL 29.00
Freight, $/tonne 3.90Bbl/tonne 7.17Freight 0.54
Crude Price, CIF Monrovia, $/Bbl 29.54Crude Cost US million $/year 81.83
Gross Nargin, mm $/year (84.51-81.83) 2.68
Operating Costs: Refining only 7.20
Refining Profit (Loss) US million $/year (4.52)
Notes:1. From the above it may be calculated that the crude price wouldhave to fall by $1.72/Bbl with no change in product costs, to break even.2. No provision is made in this calculation to provide a return onthe capital investment required to rehabilitate the refinery.3. FOB price of Forcados crude assumed to be $1/Bbl below BonnyLight, which is the current differential.4. There would be no incentive to install visbreaking or othercracking to meet domestic demand; export options are expected to be un-attractive due to local surpluses of refining capacity.
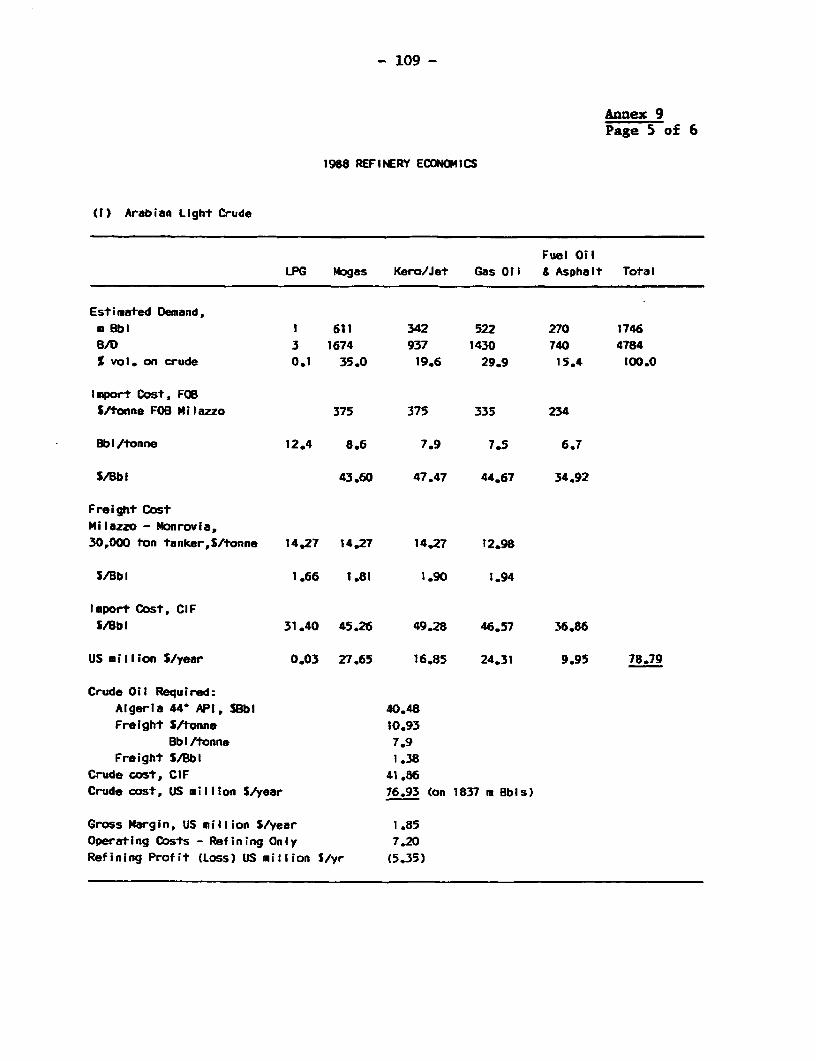
- 109 -
Annex 9Page 5 of 6
1988 REFINERY ECONOMICS
ti) Arabian Light Crude
Fuel Oil
LPG Mogas Kero/Jet Gas Oil & Asphalt Total
Estimated Demand,
m ObI 1 611 342 522 270 1746
B/D 3 1674 937 1430 740 4784% vol. on crude 0.1 35.0 19.6 29.9 15.4 100.0
Import Cost, FOB
S/tonne FOB Milazzo 375 375 335 W
Bbi/tonne 12.4 8.6 7.9 7.5 6.7
S/Bbl 43.60 47.47 44,67 34.92
Freight Cost
Milazzo - Monrovia,
30,000 ton tanker,S/tonne 14.27 14.27 14.27 12,98
S/BbI 1,66 1.81 1.90 1.94
Import Cost, CIFS/Bbl 31.40 45.26 49.28 46.57 36.86
US million S/year 0.03 27.65 16.85 24.31 9.95 78.79
Crude Oil Required:
Algeria 44- API, SBbI 40.48
Freight S/tonne 10.93
Bbl/tonne 7.9
Freight SJBbi 1.38
Crude cost, CIF 41.86Crude cost, US million S/year 76.93 (on 1837 m 8bis)
Gross Margin, US million S/year 1.85Operating Costs - Refining Only 7.20Refining Profit (Loss) US million S/yr (5.35)

- 110 -
Annex 9Page 6 of 6
Effect of Energy Efficiency Imgrovewents
Estimated Capital Cost: $8.0 million
Estimated Savings: Fuel reduced from 5X to 3Z on crude
i.e. 21 on 4800 B/D - 35,040 Bbls/year
Valued at $41.68/Bbl - 1.46 million/year
These savings could justify the capital investment in the refinery ifoperating, but would not significantly improve the basic refinery eco-nomics.
- 111 -
Annex 10Page 1 of 3
REFINING OPTIONS
"Mothballing" the Refinery
The mission strongly recommends scrapping of the refinery, notmothballing. However, mothballing has been commenced by LPRC, accordingto general procedures, the mission has reviewed these procedures and itscomments are as folLows:
1. The procedure lacks definition and specification of protectivematerials to be used. ParticuLarly for externaL protection, protectivegreases formulated for such services should be used.
2. The procedure provides for blanketting only vessels with inertgas. It is recommended that all equipment be dried and filled with inertgas - nitrogen - and a small purge and positive pressure be maintained atall times. This will protect all equipment from internal corrosion.Connecting pipework valves may all be left open and the units blinded atbattery limits. This will in effect simplify the mothballing procedureand could eliminate the need to pull at heat exchanger bundles.
3. It is recommended that alL flow, temperature and pressuretransmitters and pressure relief valves be removed and stored in a drystorage area. Pneumatic lines also be purged with nitrogen.
4. Motors should similarly be removed and kept in dry storage.
5. Treatment of the cooling water circuit is not included in theprocedure. It is recommended that a corrosion inhibitor be added tocirculated water, and the water system completely shut in, other than forpressure relief.
6. It is highly probable that in Monrovia's climate, corrosionwill proceed rapidly beneath the insulation. Sedling of the insulationcover to prevent moisture ingress is difficult. Therefore, all insula-tion should be removed and the steel painted with suitable corrosion in-habiting primer (lead or chromate). Insulation would be replaced priorto re-startup. When the refinery was inspected in January 1982 byUniversal Oil Products Company, of Des Plaines, Illionis, it was observedthat most of the insulation was deteriorated and should have been renewedin any case.
The cost of LPRC's mothballing program was estimated at$500,000 by LPRC's technical manager. The mission estimates vary between$490,000 and $460,000, depending on whether the above recommendationswere adopted. To allow an adequate contingency, it is suggesced that$500,000 be accepted as the estimate of mothballing cost in 1984.

- 112 -
Annex 10Page 2 of 3
In subsequent years, it would be necessary to maintain a smallsecurity force (say 3 men per shift), a few painters for continuing paintmaintenace, plus technicaL and general supervision. The cost of thisservice, including materials and utilities required, is estimated ac$400,000/year.
Reactivating the Refinery
In the event that a change in economic conditions would favoura resumption of refining operations in the future, the following mainsteps would have to be taken:
1. Reverse the mothballing procedures, which involves removal ofprotective materials, replacement of motors and instruments, etc.
2. Inspection of all equipment and making good of any defici-encies;
3. Re-insulation of the entire plant;
4. Complete the installation of the desalter, new reformer comrpressors, and new overhead condensor structure;
5. Make those improvements necessary to bring the refinery up tomodern standards of efficiency, which are essential if the refinery is tobe competitive. Mainly, these measures include improvements to allheaters by addition of convection tube surface; installation of stackoxygen analyzers; recovery of crude tower gas for use as fuel; installa-tion of crude to tower overhead heat exchangers;
6. Purchase inventory of crude oil;
7. Purchase spare parts, chemicals, catalysts, maintenance materi-als;
8. Reactivate the refinery organization, i.e. hiring of employees,reestablishing offices, vehicles, etc.
The cost of the above work is estimated as follows:
$ Million
Reversal of mothballing procedures,replacement of instruments and motors,install desalter and compressors, etc. 1.5
Re-insulate entire plant(5Z of replacement cost) 1.5
New catalyst charges 0.4 a/

- 113 -
Annex 10Page 3 of 3
Purchase of vehicles, parts, supplies 1.0 b/
Purchase of crude inventory:120,000 Bbls at $30/Bbl 3.6 c/
Total, excluding efficiency improvements 8.0
Efficiency Improvements:
New crude/tower overhead exchanger,new convection sections in all heaters,recovery of crude gas, oxygen analyzers: 8.0
Total Investment $16.0 dl
a/ The catalyst was virtually new at refinery shutdown, however, re-placement cost is added as a contingency.
b/ Vehicles and parts are already purchased, however, condition cannotbe guaranteed in storage, hence full contingency is added.
cl Crude inventory fee would not be relevant if crude purchasingarrangement provided for example 90 day credit.
di If all contingencies are not required, reconmissioning is estimatedto require a minimum of $11 million.

- 114 -
Annex 11
LPRC STAFF DISTRIBUTION AND NUMBERS
1. Top Management and Front Office Support Staff 14
2. Marketing 14
3. Administration 46Motor PooL 44Security 64Public Relations 8
4. Accounting 43
5. Warehouse and Purchasing 29
6. Maintenance 11l
7. Operation 80Technical Services 29
Total LPRC Staff 482
LPRC STAFF - ESTIMATE OF MANPOERE NEEDS
Jetty Supervisor 1Jetty Operation, 3 per shift 12Tank Farm Shift Supervisors 4Tank Farm Operators. 3 per shift 12Loading Rack Operations (days) 2
Security, 3 per shift 12General Laborers 10Maintenance 20Management: General 1
Ops and Purchasing 2Lab and Technical 1Accounts 1Office 5
Laboratory 3
86

- 115 -
Annex 12
SCHEDULE OF INSTALLED AND AVAILABLE GENERATING PLANT
Tear of Capacities in NWPower Station Unit No. Construction Instatled Available
Mount Coffee (Hydro) 1 1964 15.0 15.02 1965 15.0 15.03 1972 17.0 17.04 1972 17.0 17.0
Bushrod (Gas Turbines) 1 1966 15.5 02 1969 14.7 10.03 1973 19.1 04 1973 19.1 0
Bushrod (Medium Diesels) 1 1961 2.0 02 1961 2.0 03 1963 2.75 04 1963 2.75 05 1963 2.75 1.5
Luke (Slow Speed Diesels) 1 1979 14.0 11.02 1980 14.0 12.03 1982 14.0 0
Total Lov Speed Diesels 42.0 23.0
Total (All Units) 186.65 98.5
Source: AfDB Appraisal Report, LEC, Site inspection.

- 116 -
Annex 13
STATISTICS ON THE NATURE AND PERFORMANCE OF GOVERNMENTISOLATED POWER SYSlEMS, 1982/83
Gallons Fuel kV Peak Deumand GWh
Location S of Customers Consumed Installed (dkW) Gonerated
Harper 1.058 402,168 1,300 1,200 4.20Gbarngs 1,050 576,000 4,560 a/ 1,500 6.00
Greenville 1,000 367,920 1,000 900 3.90
Volnjama 700 270,927 1,300 1,000 2.90
Zwedra 640 287,524 1,300 580 3.0
SanniquelIl 524 298,800 950 0a0 3.20
Kolba City 245 106,020 285 240 1.20
-hllefanal 100 92,292 333 150 1.00
RCbertspPort 320 143,100 505 450 1.50
5,637 2,544,100 11,553 6,770 26.90
(7,513-Gbornga)
a/ Gbernge has 2-2.5 NW units out of service. Remaining unit has effective
capacity of 539 kW.

Annex 14
HISTORICAL TRENDS IN SALES ANO GENERATION
Sales ------------------------ Salos Generated From Real True GDPResidential Commercial Industrial Government mines Excl. Mlnes Total Sales Outout FIC Total Sales Growth
Year OGh S Growth Wh S Growth G"h S Growth GWh I Growth G#h S Growth (h I Growth Wih S Growth GWh I Growth Wh 9 Loss Growth I
1970 79 40 13 31 72 165 255 277 16,91971 68 -13.9 43 7.5 21 lO0 22 -29 81 IT.5 160 -1.8 241 2.6 303 9.4 26,6 8.9 5.21972 59 -13.2 46 7.0 35 29.6 24 9.1 94 16.0 164 2.5 258 7,1 329 4.6 28.7 5.8 3.51975 66 1109 52 13.0 42 20.0 18 -25.0 93 -1,1 176 6.5 271 5.0 349 6.1 29,1 9,5 .1.1974 34 -16.2 56 7.7 42 0 16 -1i.t 99 6.5 166 -5,6 267 -1,5 366 4.9 55.9 4.6 3.61975 s0 -7.4 61 8.9 36 -14,3 16 0 65 -14.1 163 -3.0 £48 -7.1 356 -2,7 59.0 2.6 -3.41976 61 22,0 63 3.3 40 11.1 20 25.0 92 8,2 184 12.9 276 11,3 387 6.7 36,6 11.6 3.81977 75.5 24.1 754 19.7 43.4 B.5 23.0 15.0 71,6 -22.2 218 16.5 290 5,1 399 3,1 32,7 11.4 -0.11978 8654 12MS 75.7 0,7 44.3 2.1 21.1 -8.5 42.0 -41,3 227 4.1 269 -7.2 405 1,5 37,1 11.0 4.01979 90.8 6.3 94.4 24.4 45,0 1.6 23.8 12.8 32.1 -23.6 254 11.9 286 6,3 432 6.7 36.2 10.6 4.91980 68.0 -3,1 69.3 -5.4 51.3 14,0 34.3 44.1 31.5 -1.9 263 3.5 295 3,1 428 -0.9 33.4 -0.8 -4.71981 68.0 0 89.8 0,6 35 3 -31e2 33,6 -1.5 25.3 -19.7 247 -6.1 272 -7.8 401 -6.3 7.0 35.0 -3.9 -4.41902 86,1 -2.2 69,8 0,6 34.1 -3.4 34.8 3.0 34.1 34,6 241 -2.4 275 1.1 380 -5.2 32.1 35,6 -2.4 -6.71963 89.7 4.2 90 .6 9.1 22.5 -54.9 33.9 -2.6 36.7 7.0 237 -1.7 273 -0.7 362 -4.2 39.5 34,4 -1.7 -6.5
Sourcesi Charles T. Plln Rorto ORML Reort, LEC.
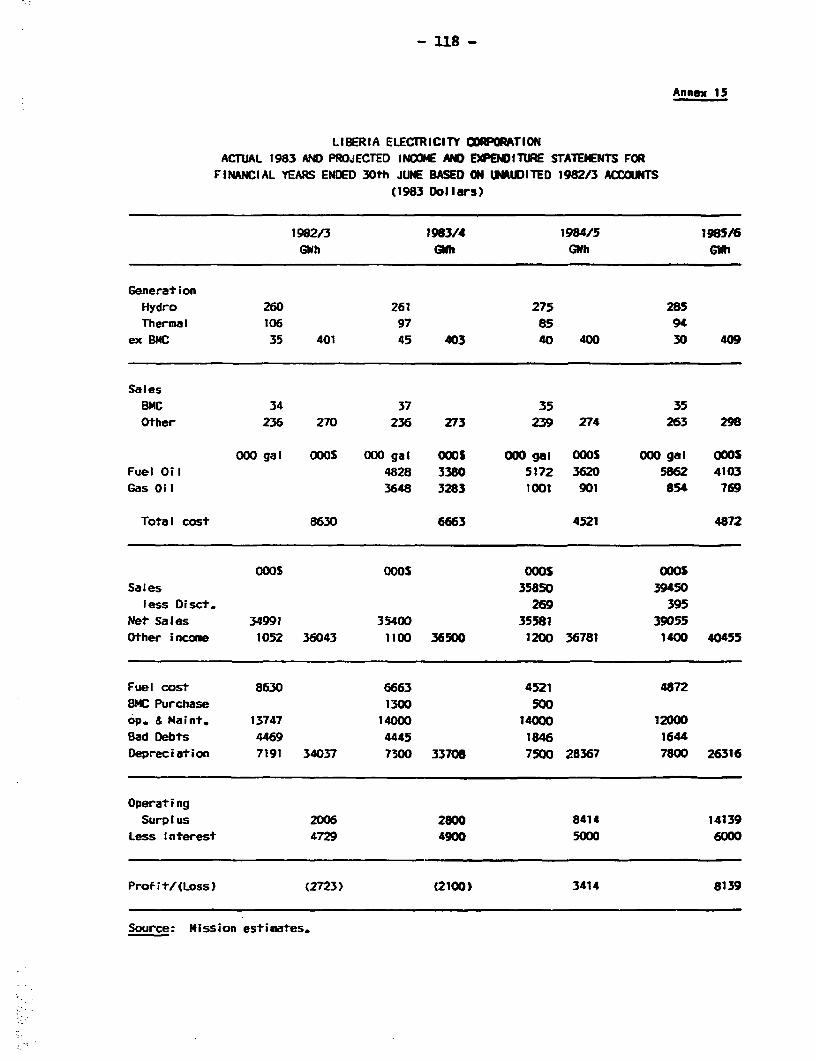
_ 11s -
Annex 15
LIBERIA ELECTRICITY CORPORATIONACTUAL 1983 AND PROJECTED INCOME AND EXPENDITURE STATElENTS FOR
FINANCIAL YEARS ENDED 30th JUNE BASED ON UNAUDITED 1982/3 ACCOUNTS(1983 Dollars)
1982/3 1983/4 1984/5 1985/6GWh Glh GWh GUh
GenerationHydro 260 261 275 285Thermal 106 97 85 94
ex BNC 35 401 45 403 40 400 30 409
SalesBMC 34 37 35 35Other 236 270 236 273 239 274 263 298
000 gal OOOS 000 gal 0005 000 gal OOOS 000 gal OO0SFuel Oil 4828 3380 5172 3620 5862 4103Gas Oil 3648 3283 1001 901 854 769
Total cost 8630 6663 4521 4872
ooos 0005 ooo0 ooosSales 35850 39450less Disct. 269 395
Net Sales 34991 35400 35581 39055Other income 1052 36043 1100 36500 1200 36781 1400 40455
Fuel cost 8630 6663 4521 4872BMC Purchase 1300 500op. & Maint. 13747 14000 14000 12000Bad Debts 4469 4445 1846 1644
Depreciation 7191 34037 730 33708 7500 28367 7800 26316
Operating
Surplus 2006 2800 8414 14139
Less Interest 4729 4900 5000 6000
Profit/(Loss) (2723) (2100) 3414 8139
Source: Mission estimates.
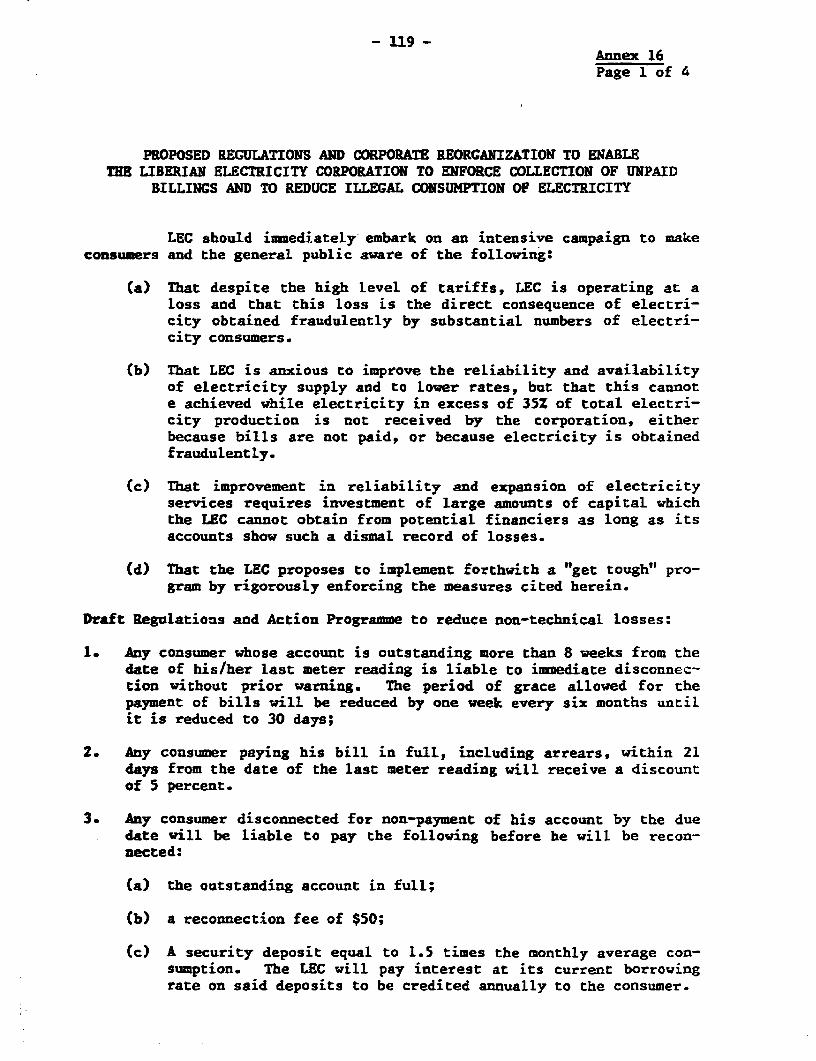
- 119 -Annex 16Page 1 of 4
PROPOSED REGULATIONS AND CORPORATE REORCANIZATION TO ENABLETEE LIBERIAN ELECTRICITY CORPORATION TO ENFORCE COLLECTION OF UNPAID
BILLINCS AND TO REDUCE ILLEGAL CONSUMPTION OF ELECTRICITY
LEC should immediateLy embark on an intensive campaign to makeconsumers and the general public aware of the following:
(a) That despite the high level of tariffs, LEC is operating at aloss and that this loss is the direct consequence of electri-city obtained fraudulently by substantial numbers of electri-city consumers.
tb) That LEC is anxious to improve the reliability and availabilityof electricity supply and to lower rates, but that this cannote achieved while electricity in excess of 35% of total electri-city production is not received by the corporation, eitherbecause bills are not paid, or because electricity is obtainedfraudulently.
-c) That improvement in reliability and expansion of electricityservices requires investment of large amounts of capital whichthe LEC cannot obtain from potential financiers as long as itsaccounts show such a dismal record of losses.
Cd) That the LEC proposes to implement forthwith a "get tough" pro-gram by rigorously enforcing the measures cited herein.
Draft Regulations and Action Programme to reduce non-technical losses:
1. Any consumer whose account is outstanding more than 8 weeks from thedate of his/her last meter reading is liable to immediate disconnec-tion without prior warning. The period of grace allowed for thepayment of bills will be reduced by one week every six months untilit is reduced to 30 days;
2. Any consumer paying his bill in full, incLuding arrears, within 21days from the date of the last meter reading will receive a discountof 5 percent.
3. Any consumer disconnected for non-payment of his account by the duedate will be liable to pay the following before he will be recon-nected:
(a) the outstanding account in full;
(b) a reconnection fee of $50;
Cc) A security deposit equal to 1.5 times the monthly average con-sumption. The LEC will pay interest at its current borrowingrate on said deposits to be credited annually to the consumer.

- 120 -Annex 16Page 2 of 4
4. Any person receiving electricity from the LEC through an unautho-rized unmetered connection, or a metered connection with an inopera-tive meter, will be given a period of grace of 14 days to apply foran authorized connection, and within this period will be liable topay the normal connection fee. In addition, such persons will beliable to pay to the corporation an surcharge of 50Z on the firstseven bills submitted as compensation for their previous illegalconsumption.
5. After the grace period any person found with an illegal connection,or a tampered meter, will be subject to immediate disconnection,legal action for recovery of damages by the Corporation, a connec-tion fee of $100 for a first offense and $250 for a subsequentoffense, and the lodging of a security deposit to be determined bythe corporation. The LEC shall be permitted to refuse to connectany premises where an illegal connection hs been found until suchtime as it receives adequate financial security and compensation.
6. The LEC will arrange for all meters to be sealed and a consumerwhose meter seal is broken may be regarded as having an illegalconnection.
The Need to Establish Credibility
The LEC will have to satisfy its consumers and the pubLic ofits bona fides and its desire to ensure that all customers receive equaland fair treatment. There appears to be an impression amongst the publicthat bills presented by the LEC are not based on the amount of electrcityconsumed, and that the amount of the bill does not reflect attempts madeby consumers to reduce their consumption. In this regard, the mission isconcerned that more than 14,000 bills sent out (half of the total!) arebased on an estimate of consumption and not on meter readings.
The mission therefore suggests that the following are amongdesireable steps to be taken to reassure customers:
1. It should be made abundantly clear to all LEC staff, particularlythose directly or indirectly concerned with meter reading, billingand connecting/disconnecting electricity supply, that the LECexpects to receive their total co-operation and loyalty. If thereis no such provision at present, that severe penalties (includinginstant dismassal) are prescribed by LEC for any of its employeesdiscovered to have participated in any way in attempts to defraundLEC or its customers.
2. Bills not based on actual meter readings should only be issued inexceptional cases, e.g., where the consumer does not have a meter,vhere the meter is not accessibLe, where the meter is clearlyfaulty, and so on.

- 121 -Annex 16Page 3 of 4
3. There should be a complete separation between meter reading, billingand collecting on the one hand, and disconnections on the other.The former should remain a function of the commercial department(CD), while the latter would more appropriately be part of the T&Ddepartment. The Energy Monitoring Unit (ENU), reporting directly tothe MD, could usefully verify actions taken and safeguard interestsof both the LEC and its customers.
4. Bills not based on actual meter readings should only be issued inexceptional cases, e.g., where the consumer does not have a meter,where the meter is not accessible, where the meter is clearlyfaulty, and so on.
5. There should be a complete separation between meter reading, billingand collecting on the one hand, and disconnections on the other.The former should remain a function of the commercial department(CD), while the latter
6. Customers should be made aware that:
a. Any consumer questioning the accuracy of his electricity metermay apply to have his meter tested on payment of a deposit of$30. Should the meter prove to be outside the LEC's accuracylimits (2Z either way), the meter will be repaired or replaced,and the consumers account will be credited with the amount ofthe deposit. If the meter is within the LEC's tolerancelimits, or shows signs of having been tampered with, thedeposit will be forfeited.
b. Any consumer wishing to question the accuracy of his bill maydo so in writing to the General Manager of the LEC within 10days of the time of the meter reading, giving details of thename and address, the account number, and the reading of themeter at the time the complaint is made. Such a complaint doesnot absolve the consumer from making payment of the previousaccount within the stipulated period of 6 weeks. Consumerswill be advised of the outcome of any investigation and willreceive an amended bill if their compLaint is found to bejustified. Where it is not possible to establish the correctmeter reading the LEC will charge on the basis of the averageconsumption during the previous three months.
7. The object of the substantially higher meter reading charge is todiscourage consumers who regard such requests for testing as a meansof avoiding being billed for some useage.
8. Complaints received from customers in respect of 4b. above should beprocessed in the first instance in the EMU which is already respons-ible for meter testing.

- 122 -Annex 16Page 4 of 4
9. Any instructions for connection or disconnection issued by the CD toT&D must be in writing with a copy to the EMU.
10. The mission is of the opinion that the present system of meter read-ing, billing and colLecting is not effective and would support anapplication by the LEC for technical assistance for its restructure.
11. Meter readers should be urged to report any illegal connections,since their failure to make reports can only be regarded as partici-pation in attempts to defraund the LEC.
12. Initially special arrangements may have to be made to cope with thehuge volume of illegal connections where there is acceptance by theconsumer concerned of the penalties and resupply arrangements listedabove. Any delay in connection should not be used as an excuse tocontinue in the interim with unmetered supply.
Government debt to LEC
Government accounts represents a substantial proportion ofoutstandings ($15 million by the end of 1983) and they have increased by$2.7 million over the preceeding 6 months. LEC should be allowed to off-set the amount it owes against the amounts owed to LEC, and governmentdepartments and agencies should be required to settle their subsequentaccount within the same periods laid down for other consumers.
There should be no free category of consumers within or outsideof the LEC. Accordingly all recipients of "free" electricity should bemetered and billed. If it is deemed essential to provide some benefit totop management by way of payment for electricity this should be in theform of a moderate cash grant, thereby enabling these staff to experiencethe true cost of their consumption just as is intended for consumers atlarge.
Need for Powerful Legislation
Legislation must be implemented as a matter of urgency to giveLEC powers to enforce the above-mentioned regulations.

- 123 - Annex 17Page 1 of 2
ASSUMPTIONS FOR ENERGY AND POWER SECTOR DEMAND FORECAST
A: Global Assumptions
1. GDP and electricity consumption trends on the Public componentof the Monrovia Power System have shown a close association over the pastdecade or so as documented in Appendix 3.3. Thus the future demand forelectricity on the MPS can be related to some extent to future GDPgrowth.
2. GDP growth in the modern sector is sharply influenced by theproductivity of the iron ore enclave sector. Several projections of ironore production, and of GDP growth were made by Bank staff during thefirst quarter of 1984. The most likely scenario for GDP growth and ironproduction is as follows, and is used for all energy sector demand fore-casts outside of traditional fuels.
GDP Growth Iron orerate, Constant Prod'n
Year 1982 Prices a/ mtpy
1982 -6.7 18.11983 -6.5 14.61984 2.5 14.81985 3.9 15.51986 1.8 15.01987 -1.2 13.01988 -11.0 7.51989 3.4 7.51990 3.4 7.51991 3.4 7.51992 3.4 7.51993 -29.0 0.01994 3.5 0.01995 3.5 0.0
a/ Excluding non-monetary GDP.
B. Specifc Assumptions: Monrovia Power System
1. The LEC will introduce measures by July, 1984 to ensure that:
(a) Consumers pay their bills within 60 days of each meter reading(a period that is graeually to be reduced to 30 days);
(b) Customers who do not pay their bills within the required periodare disconnected, and are not reconnected until aLl outstand-ings and fees for reconnection have been paid;

-124 - Annex 17Page 2 of 2
(c) Meters are installed at aLl points supplied by LEC;
(d) All meters and their connections (if exposed) are sealed;
Ce) Pending the installation of meters the premises of all un-metered consumers are inspected and their consumption assess-ment verified and/or adjusted;
(f) Illegal connections are effectively cut and the tenants and/orowners of the properties attempting illegal reconnection areprosecuted;
2. That this "get tough" policy receives complete GDL backing,particularLy in the form of legislation enabling LEC to proceed in lawagainst anyone defrauding the LEC or tampering with its meters or instal-lations.
3. That LEC continues its agreement with BMC, ensuring full utili-zation of hydro generating capacity and providing for additional supplyfrom BMC to LEC either by exchange of purchase inthe dry season;
4. That a tariff reduction is offered to consumers at the com-mencement of the 1986 wet season, by which time there should be a sub-stantial recovery in LEC's financial position;
5. That there is efficient maintenance of LEC's plant and an ade-quate level of spares is held available, so as to ensure that 'leastCost operating procedures are applied at all times. In particular LECshoudl avoid the use of the gas turbines, so as to keep them availablefor emergencies for as long as possible, and to minimize their high fuelcosts.
In addition, it is accepted that the "get tough" policy will not becomefully effective for some time, and that even after the end of 1986 15 GWhof non-technical losses cannot be recovered. 251 of consumption noweffectively free is assumed to be lost if it has to be paid for.

Annex 18LIBERIA ELECTRICITY CORPORATION - HISTORICAL AND PROJECTED SALES
(GWh)
Residentldi Comnmercial Industrial Government Total Mine Total Non-tech Technical Transfer Real Real Sales GOPYear Sales Sales Sales Sales ex Mine Sales Sales Losses Losses Losses Losses Growth Growth
- percent -
1982 86 86 34 35 241 34 275 77 56 3 35.6 -2,4 -6.71983 90 91 22 34 237 37 273 70 54 4 34.4 -1.7 -6.51984 91 92 23 33 239 35 274 67 55 4 33.8 -0.3 2.51985 102 104 24 33 263 35 298 47 55 4 28.0 1.3 3,91986 114 118 26 34 292 30 322 26 57 3 22.1 2.5 1.81987 123 126 27 34 310 25 333 I5 56 3 18.9 232 -1.21988 126 131 27 34 308 25 343 15 54 3 17.8 2.6 -11.01989 122 127 26 33 308 30 338 i5 53 3 18.1 -3,0 3,41990 128 135 25 33 321 23 344 IS 54 3 17.7 4,0 3,4 La1991 133 140 26 35 354 Is 349 15 55 3 17.5 3.9 3.41992 138 146 27 36 347 6 353 16 56 3 17,4 4,0 3,41993 142 150 25 36 353 5 356 16 57 3 17.3 1.7 -29,01994 135 141 23 35 334 0 334 16 56 2 17,9 -5.1 3.51995 139 140 24 35 338 0 338 16 56 2 17.8 1.2 3,51996 146 146 24 36 352 0 352 16 57 2 17.4 4.02000 171 171 28 40 410 0 410 18 67 3 17.2 Av. 3.92003 192 195 32 42 461 1 461 19 75 4 17.5 Av. 3.9
Source: Mission analyb5e,

Annex 19
LIBERIA ELECTRICITY CORPORATION - HISTORICAL AND PROJECTED GENERATION MIXAND FUEL CONSUMPTION
…---- Fuel Use ------------------Transfer Total Max, -------- Generation Mix ------- LuKe GTs Bushrod Total BMC
Year ex EIC Generation Demand. Hydro Luke GTs Bushrod Fuel Oil ------- Gas Oil ------- Fuel Oil
-------- GWh -------- mW ------------- GWh ------ …--- ------------- (000 US gallons) --------------
1982 32 380 72 276,3 62.8 31.9 5.9 5,331 4,691 488 5,179 2,1691983 39.5 362 70 262.3 47,2 49,0 5.5 3,255 7,206 454 7,660 2,6691984 45 355 70 260 69 22 4 4,828 3,235 413 3,648 3,0411985 40 364 71 280 75 4 5 5,172 588 413 1,001 2,703
1986 30 378 72 285 85 3 5 5,862 441 413 854 2,0271987 21 388 72 285 95 3 5 6,552 441 413 854 1,4191988 27 388 73 285 93 3 5 6,552 441 413 854 1,824
1989 26 383 72 285 90 3 5 6,207 441 413 854 1,757
1990 28 388 73 285 95 3 5 6,552 441 413 854 1,8921991 34 385 74 285 95 3 5 6,552 441 413 854 2,297
1992 35 393 75 285 100 3 5 6,897 441 413 854 2,3651993 38 396 76 285 108 3 0 7,448 441 441 2,5681994 27 381 71 278 100 3 0 6,897 441 441 1,8241995 28 384 71 281 100 3 0 6,897 441 441 1,892
1996 30 397 74 285 109 3 0 7,517 441 441 2,0272000 60 438 83 285 148 5 0 10,207 735 735 40512003 90 461 92 350 113 6 0 7,793 882 882 6,081

- 127 -
Annex 20
PARALLEL OPERATION OF BMC AND LEC SYSTEMS:
The Need For and the Requirements of a Feasibility Study
Electricity is supplied from LEC to BMC during the wet seasonfrom surplus hydro output, while BMC supplies LEC during the dry season.At no time, however, does BMC's generating plant operate in syncrony withLEC plant. Even within BMC's system there are two sections which areelectrically isolated at all times, apparently with extensive safetyinterlocks to prevent accidental connection. The need to have two separ-ate sections (increasing to three when LEC supplies to BMC) is probablythe result of using switchgear bought when the anticipated generatingccpaciLCy was much lower than at present. The present fault level withall generating plant in use is likely to be in excess of the breakingcapacity of the switchgear.
Since the supply from LEC arrives at BMC at the end of some 50km of 69 kV transmission line, it is possible that the increase in faultcapacity if LEC is synchronized even with part of BMC's plant is withinthe breaking capacity of the switchgear, but this is unlikely. It is inany case understandable that BMC does not wish to lose output as a resultof irregularities on the LEC system after having gone to so much troubleto avoid problems within their system.
The disadvantage of the present arrangement is that the amountof energy that can be transferred in either direction depends ultimatelyon the demand of that part of the system linked with the other at anyparticular time, and this can be varied only by switching in or out con-sumer groups, probably in fairly large blocks. Particularly at timeswhen LEC supplies BMC with surplus hydro capacity this inevitably resultsin a proportion of the hydro output being wasted.
The particular benefits of operating the LEC system in parallelwith one of the BMC sections are as follows:
(a) Increased operational flexibility and the ability to make themaximum possible use of hydro capacity, with a correspondingsaving in fuel oiL imports.
(b) BMC would be able to supply the small and reLatively shortperiod peak loads of LEC s demand in the wet season, elimin-ating the need to start up thermal machines to meet theseloads.
(c) It should be possible to minimize the number of thermal unitsin use at any time during the dry season.
It will be necessary to study the BMC and LEC systems with aview to determining the fault levels for all the plant items that may bein use at any one time, with LEC and part of BMC operating in parallel.Specifications are required for switchgear and protective relays (e.g.,under-frequency and/or under voltage) that will satisfy BMC's engineersthat in the event of a fault on either system the systems will be iso-lated before BMC's breakers are required to deal with a fault levelbeyond their capacity.

- 128 -
Annex 21
NOTES OF THE COST OF PRODUCTION FROM MODERNSLOW SPEED DIESELS
o Equipment type: 150-160 rpm diesel engineio Size range: order of 8-20MW now commercially availableo Main manufacturers: M.A.N., Sulzer, GVM/B&W.O Capital cost installed for large installations, 15-20 MW plus: $900.o Operating cost: $20 per kw per year.O FueL cost in Liberia: economic cost to concession and the LEC is
approximately 70 cents/US gallon for fuel oi, of 3000-3500 secs.redwood.
O FueL efficiency: 19.1 kWh/US gallon or 44.7% thermal efficiency atthe generation terminals for most recent models.
O Maintenance costs: $12 per MWh including lube oilo output in the Monrovia Power System at 56.5Z load factor is 8760 x
0.565 = 4949.4 kWh per kw of capacity per year.O In plant power consumption 1.5% of output.
This yields an average cost of 7.34 cents/kWh.
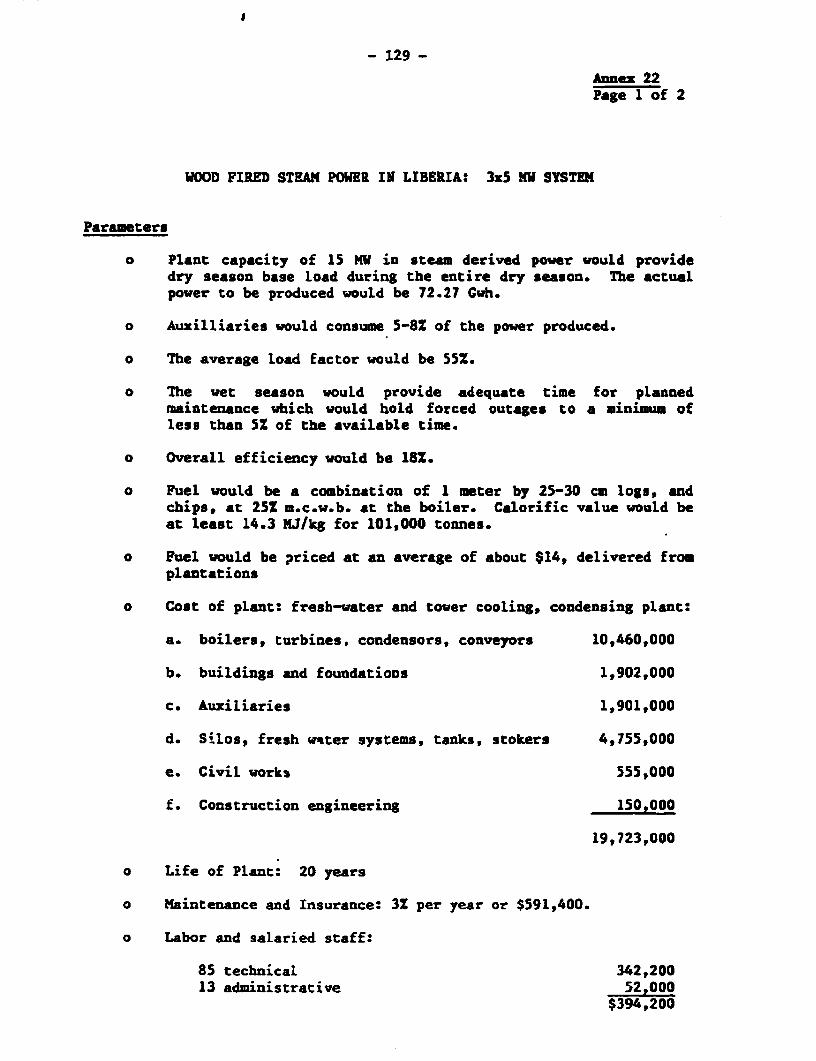
J
- 129 -
Annez 22Page 1 of 2
WOOD FIRED STEAM POWER IN LIBERIA: 35 MW SYSTEM
Parameters
o Plant capacity of 15 MW in steam derived power would providedry season base load during the entire dry season. The actualpower to be produced would be 72.27 Cwh.
o Auzilliaries would consume 5-8Z of the power produced.
o The average load factor would be 552.
o The wet season would provide adequate time for plannedmaintenance which would hold forced outages to a minimum ofless than 5% of the available time.
o Overall efficiency would be 18%.
o Fuel would be a combination of 1 meter by 25-30 cm logo, andchips, at 25Z m.c.w.b. at the boiler. Calorific value would beat least 14.3 NJ/kg for 101,000 tonnes.
o Fuel would be priced at an average of about $14, delivered fromplantations
o Cost of plant: fresb-water and tower cooling, condensing plant:
a. boilers, turbines, condensors, conveyors 10,460,000
b. buildings and foundations 1,902,000
c. Auxiliaries l,901,000
d. Silos, fresh wvter systems, tanks, stokers 4,755,000
e. Civil works 555,000
f. Construction engineering 150,000
19,723,000
o Life of Plant: 20 years
o Maintenance and Insurance: 32 per year or $591,400.
o Labor and salaried staff:
85 technical 342,20013 administrative 52,000
$394,200

- 130 -Annez 22Page 2 of 2
Cost of Production
$/Pa C/klh
a. Capital chargesDiscount rate - 10Z for 20 years 2,307,500 3.19
b. Operations and maintenanceMaintenance 394,200Labor 394,200Insurance 197,200
985,600 1.36
c. FueL110,000 tonnes at$13.92 per tonne 1,531,788 2.12
4,824,888 6.6l7C/kihat busbar

- 11 -
Annex 23
OPERATIONS COST OF COAL FIRED STEAM GENERATINGPLANT IN LIBERIA, PORT OF MONROVIA
o Basis: Coal price $45 (FOB) + $25 (Freight) + $15 handLing = $85per tonne
o Calorific value: 29 NJ/Kg.
O Efficiency: 25X, i.e., 2 kWh/kg (20 NW sets)
o Capital Cost: $1,400 per kw - 20 yrs e 12%
o Annualized cap. cost = $168 per kw p.a.operating costs: $30/kw p.a.
o Maintenance: $1(MNwhoutput: 8760 x 56.51 = 49 x 9 kWh/KW/annum
o Variable costs = 4.25 * 1.00 = 5.25 c/kWh
o Fixed costs: $198/kw p.a.
o Average cost per generated kWh @ 56.5% LF = 9.25 c/kWh
o Assuming in-house losses of 3Z.
o Ave-age cost per kWh sent out = 9.54cJkWh.
If efficiency is 20Z (e.g., with smaller units) the average cost per kWhbecomes 10.89c/Kwh.
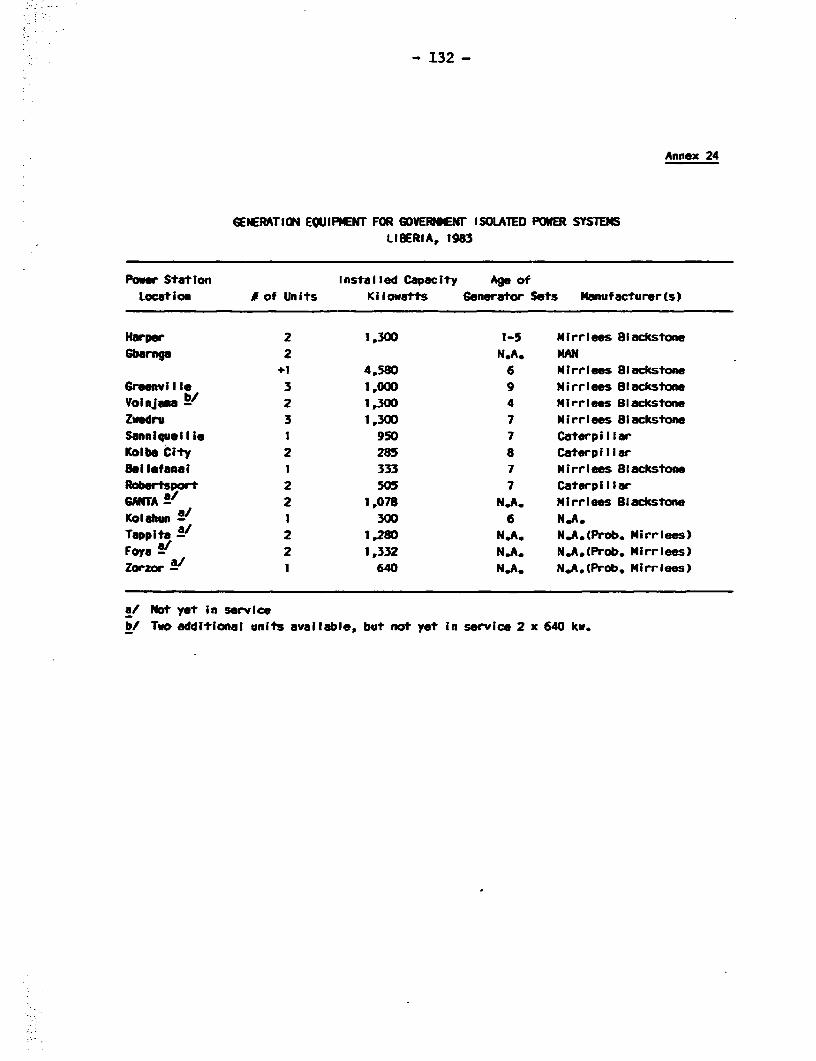
- 132 -
Annex 24
6ENERATION EQUIPMENT FOR GOVERIENr ISOLATED POWER SYSTEMSLIBERIA, 1983
Power Station Installed Capacity Age ofLocation U of Units Kilowatts Generator Sets Manufacturerts)
Harper 2 1,300 1-5 Mirrlees BlackstoneGbarnga 2 N.,A MAN
+1 4,580 6 MIrrlees BlackstoneGregeville 3 1,000 9 Mirrlees BlackstoneVoinuja ba 2 1,300 4 Mirrlnes BlackstoneZwedru 3 1,300 7 Mirrlees BlackstoneSanniquoilie 1 950 7 CaterpillarKolbe oCity 2 285 8 CaterpillarBellefanal 1 333 7 Mirrlees BlackstoneRobertsport 2 505 7 CaterpillarANITA a7 2 1,078 N.A. Mlrrlees 8lackstoneKolalbun S" 1 300 6 N,A.Tappita ' 2 1,280 N.A. N.A.(Prob. Mirrlees)Foya a/ 2 1,332 N.A. N.A,(Prob. Mirrlees)Zorzor a 1 640 N.A. N.A.(Prob. Mirrlees)
a! Not yet in servicebI Two additional units available, but not yet in service 2 x 640 kw.

- 133 -Annex 25Page I of 4
COMPARISON OF WOOD-STEAM vs. WOOD CASIFICATIONPOWER PLANTS 1/
Parameters Base Case, 500 kW:
o Capacity of 500 kw with single unit plants, i.e., singleboiler, singe turbogenerator, and singLe gasifier, singlediesel generator.
o Auxiliaries will consume 4-6X of gasifier plant output and 5-8Zof steam plant output.
O The plant load factor will be 551.
o Fuel will be delivered in meter length pieces to plant up to 30cm in diameter. The boiler will burn the pieces with nofurther processing. The gasifier will chip and dry the wood to201 mcwb.
O Fuel will be delivered to each plant at 501 mcwb at $44.65 pertonne.
o Additional cost for drying and chipping $2.15 per tonne
o Specific Wood Consumption
Steam plant, 3 kg/kWh; Gasification plant, 1.5 kglkWh
o Total Wood Consumption per year
Steam plant - 7227 tonnes; Casification plant - 3613 tonnes
o kWh's produced per year: 2,409,000 kWh
1/ Based primarily on data extracted from the report PrefeasibilityStudy on the Development of Power in the Liberian Rural Areas,DECON, November 1983, corrected and/or modified as needed.
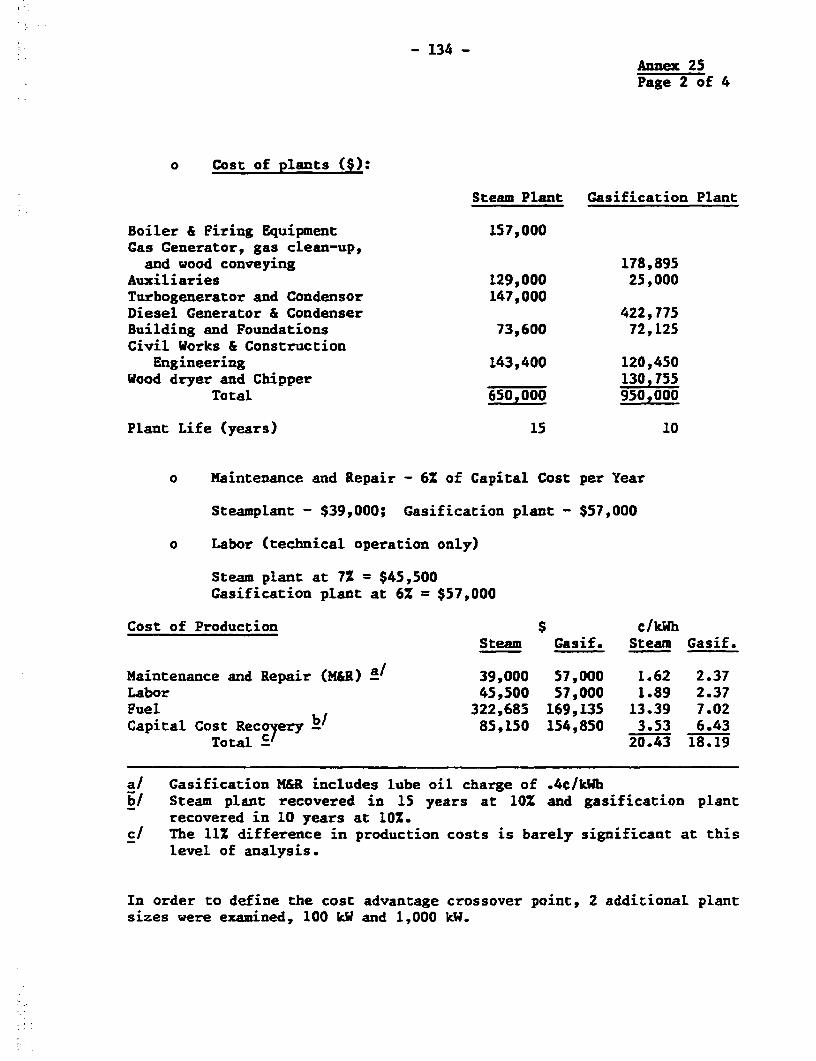
- 134 -
Annex 25Page 2 of 4
o Cost of plants ($):
Steam Plant Gasification Plant
Boiler & Firing Equipment 157,000Gas Generator, gas clean-up,and wood conveying 178,895
Auxiliaries 129,000 25,000Turbogenerator and Condensor 147,000Diesel Generator & Condenser 422,775Building and Foundations 73,600 72,125Civil Works & Construction
Engineering 143,400 120,450Wood dryer and Chipper 130,755
Total 650,000 950,000
Plant Life (years) 15 10
o Maintenance and Repair - 6% of Capital Cost per Year
Steamplant - $39,000; Gasification plant - $57,000
o Labor (technical operation only)
Steam plant at 7% = $45,500Gasification pLant at 6% = $57,000
Cost of Production $ c/kWhSteam Gasif. Steam Gasif.
Maintenance and Repair (M&R) a/ 39,000 57,000 1.62 2.37Labor 45,500 57,000 1.89 2.37Fuel 322,683 169,135 13.39 7.02Capital Cost Recoyery b/ 85,150 154,850 3.53 6.43
Total c 20.43 18.19
a/ Gasification M&R includes lube oil charge of .4e/kWhb/ Steam plant recovered in 15 years at 10% and gasification plant
recovered in 10 years at 10%.c/ The 11% difference in production costs is barely significant at this
level of analysis.
In order to define the cost advantage crossover point, 2 additional plantsizes were examined, 100 kW and 1,000 kW.

- 135 -Annex 25Page 3 of 4
For the 1,000 kV plant:
Changes in Parameters
o Steam Plant Capital Recovery stretched out to 20 years asper historical norms; gasification plant remains 10 years
o Efficiency of steam plant 15%; for gasification plant 24%
o kWh's produced annually by each 4,818,000
o Specific wood consumption of steam plant 2.25 kg/kWh
o All other assumptions the same, or based on the same valuesas for 500 kI plant comparison
o Cost of Plants C$)Steam Plant Gasification Plant1,200,000 1,90o,o0o
o Cost of ProductionGasifi- Gasifi-
Steam cation Steam cation(usT Tc/kWhT
Maintenance and Repair 72,000 114,000 1.49 2.37Labor 84,000 114,000 1.74 2.37Fuel 484,100 321,300 10.05 6.67Capital Cost Recovery 140,400 309,700 2.91 6.43
Total 16.19 17.84
For the 100 kW PlantChange in Parameters
o Steam plant capital recovery in 15 years; gasification plantrecovery in 10 years
o Efficiency of steam plant 6Z; for gasification plant 18%
o kWh's produced annually by each 481,800
o Specific Wood consumptionSteam plant - 6 kg/kWh
o Cost of Labor - 12% of Capital Cost
o Cost of Maintenance and Repair - 10% of Capital Cost
o All other assumptions are the same as, or based on, the samevalues used for the 500 kW plant comparison
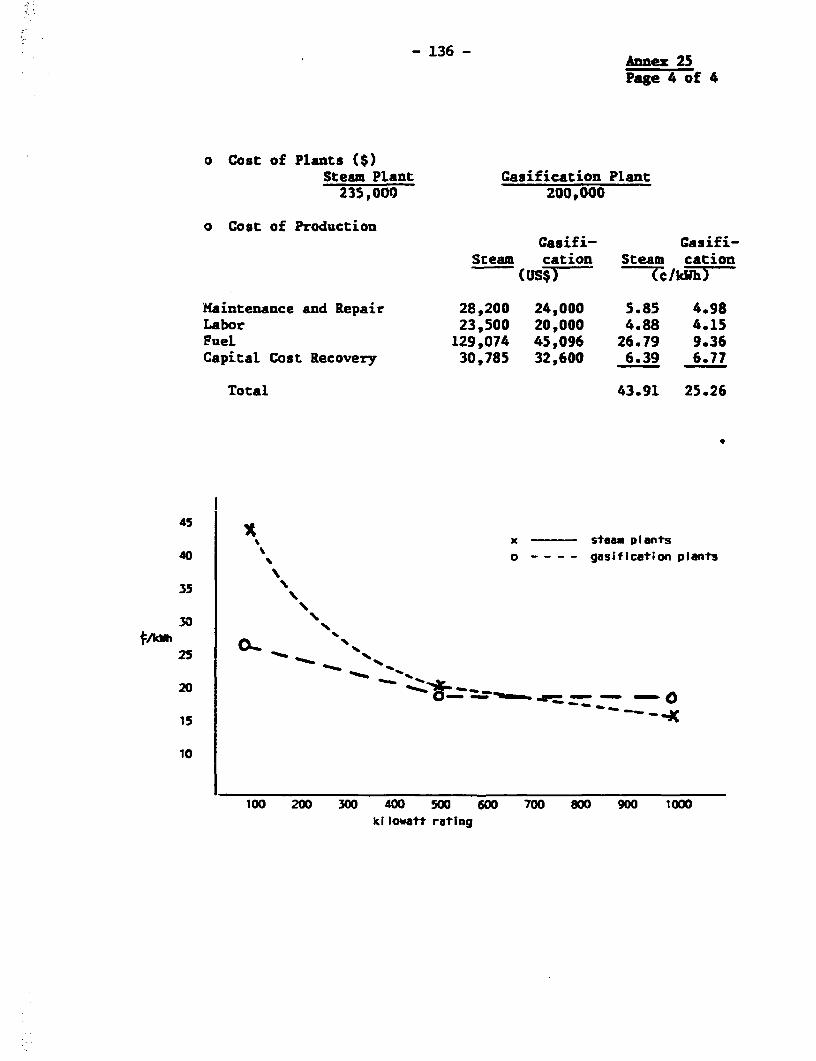
- 136 -Annez 25Page 4 of 4
o Cost of Plants ($)Steam Plant Gasification Plant235,000 200,000
o Cost of ProductionCasifi- Gasifi-
Steam cation Steam cation(US$F Tc/kWhT
Maintenance and Repair 28,200 24,000 5.85 4.98Labor 23,500 20,000 4.88 4.15FueL 129,074 45,O96 26.79 9.36Capital Cost Recovery 30,785 32,600 6.39 6.77
Total 43.91 25.26
45
x - Steam plants40 o - -- - gasification plants
35
30
25
: ~ ~ 0 \
20~~~ ~t -~ ~ * ---- 0_
15
10
100 200 300 400 500 600 700 800 900 1000kil owatt rating
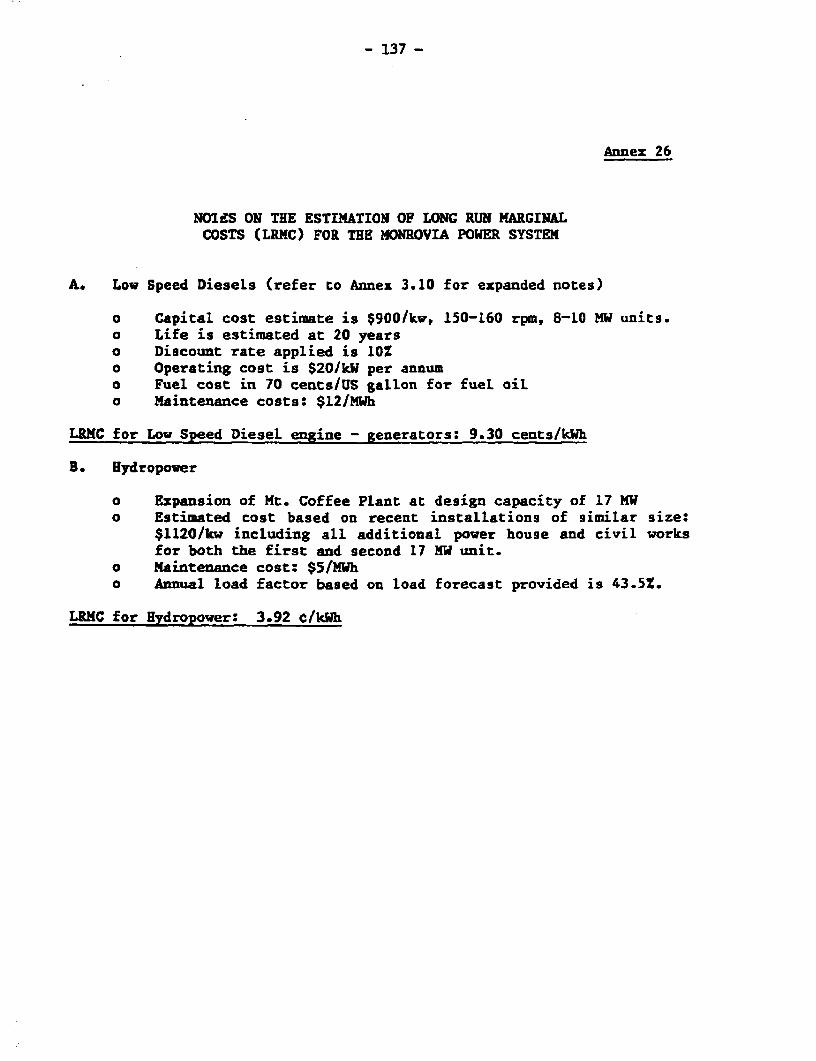
- 137 -
Annex 26
NOIlS ON THE ESTIMATION OF LONG RUN MARGINALCOSTS (LRMC) FOR THE MONROVIA POWER SYSTEM
A. Low Speed Diesels (refer to Annex 3.10 for expanded notes)
o Capital cost estimate is $900/kv, 150-160 rpm, 8-10 MW units.O Life is estimated at 20 yearso Discount rate applied is 10Xo Operating cost is $201kW per annumo . Fuel cost in 70 cents/US gallon for fueL oiLo Maintenance costs: $12/MWh
LRKC for Low Speed DieseL. engine - generators: 9.30 cents/kWh
B. Hydropower
o Expansion of Mt. Coffee Plant at design capacity of 17 MWo Estimated cost based on recent installations of similar size:
$1120/kw including all additional power house and civil worksfor both the first and second 17 NW unit.
o MaintenAnce cost: $5/MWho Annual load factor based on load forecast provided is 43.5%.
LRMC for Hydropower: 3.92 clkWh

- 138 -
Annex 27
FIREWOOD PRICES - LIBERIA, FEBRUARY, 1984
Weight of Price per Cooking COst of
Bundle a/ sold Bundle and Energy Price per efficiency energy
Place tonne Value unit energy (PHU) utilized
(12% mcwb ave.) (te) (MJ/kg) (f.MJ) % (t/1AJ
Monrovia City Markets 14-21 kg SI.50/bundle 17.3 b/ 0.50 13 3.9
Newport a Meringo St. ($85/te)
Benson/Center St. 11 kg S1.00 17.3 0.53 13 4.1
(591/te)
Ninth St., Sinkor 27 kg S1.35 17.3 0.29 13 2.2
(S50/te)
1.4-1.8 kg 10t 17.3 0.36 13 2.8
(563/te)
Small ad hoc stall 13 kg 50.50 17.3 0.22 1.7
inside inner city
settlements (538.50/te)
36 miles from Monrcvia
towards Gantar c/ 9.5-12.5 kg 25f 17.3 0.14 13 1.1(29/te)
158 miles from Monrovia
towards Gantar 8.7-11.0 kg 25f 17.3 0.15 13 1.2(S25/te)
a/ Samples of firewood bundles were weighed and the moisture content measured in each
marketplace.
b/ This is the lower heating value of wood ot 12% ncwb with an average energy value oven dry of
20 MJ/kg.
c/ Gantar is a town situated close to the Guinea border on the main highway of Liberia.
PHU = Percentage of heat utilized.
Source: Mission measurements.

!MnnexCHARCOAL PRICES - LIBERIA, FEBRUARY 1984
Form & Weight Price Per Cookingof Unit Unit and Energy Value Price per Efficiency Cost Per Unit of
Locatlon Purchased Per Tonne (as measured) Unit Energy (PHU) Heat Utilized(MJ/kg) (f/MJ) , (¶IAIJ)
Monrovia City MarketsNewport and Meringo St,Small retail Loose heap of 10 cents 29.7
parcel (common 0.4-0.5 kg (22.2t/hg) 0.75 24 3.12throughout) (0.45 kg av,)
Large retail parcel S2.50/bag"ironwood" 17-21.0 kg bags S131/to 29.7 0.44 24 1.84"rubberwood" 9.5-13 kg bags S222/te 0.75 24 3.12fother "bush" wood 13-17.5 kg bags $165/to 0.55 24 2.30
Ninth St. Sinkor (unknown "bush"species) 15 kg (av.) bags S2.25 29.7 0.51 24 2.13
Benson & Centre Sts. (unknown"bush" species) 18 kg (av.) bags S2.25 29.7 0.42 1.75
25 miles out of Monroviarubberwood 15 kg (av) bags 12.00/bag 29.7 0.45 24 1.87other "bush"$ wood 16.5 kg (av) bags $2.25/bag
51.33/te
Wholesale at ForestCharcoaling Site
Cape Mount & Bong Counties 16-21 kg S1.50/bag 29.7 0.33 1.33 bl50 miles av. haul (18.5 kg av.
or 54 bagsper tonne)
plus 30t/bag a/transport (097/te)
Grand Bassa 51.00 bag 0.26 1.10 b/plus 45f/bag a/
transport (578/te)
a/ At 32,2f/tonne km.b/ Price If delivered under contract to commercial/industrial consumers or for export.
PHV - Percentage of heat utilized; av. a average.
Source: Mission measurements at each marketplace, plus laboratory analysis of charcoal samples for the mission.
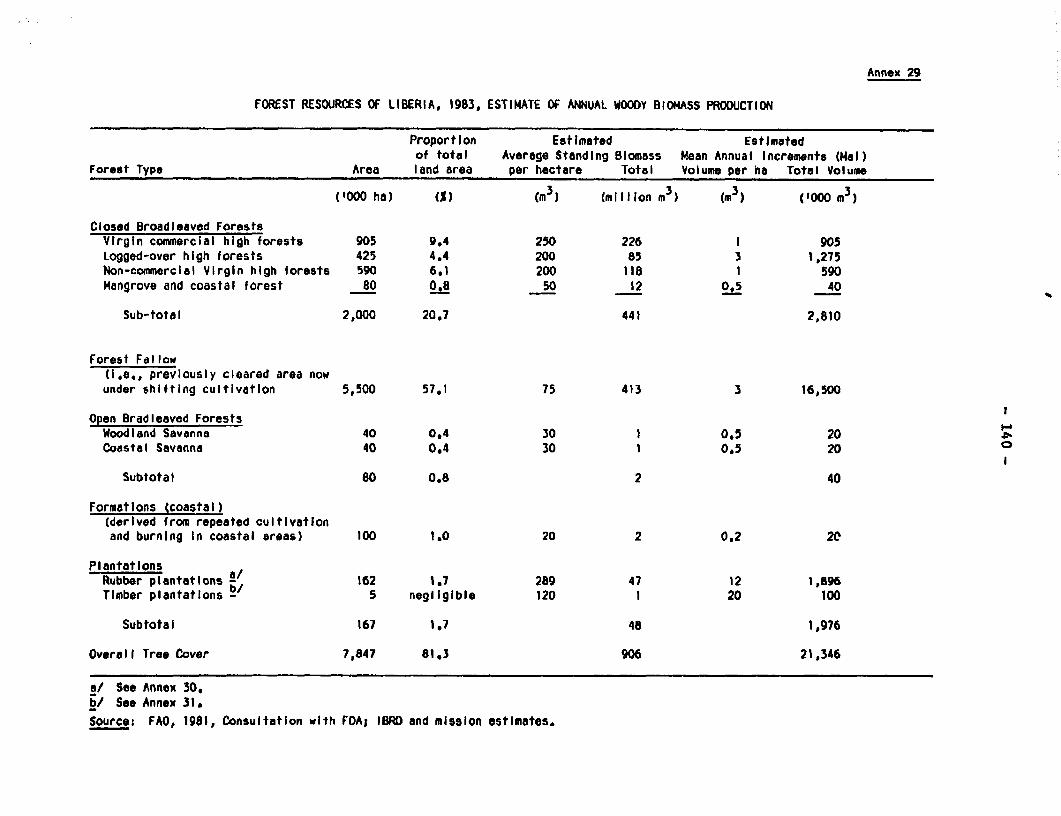
Annex 29
FOREST RESOURCES OF LIBERIA, 1983, ESTIMATE OF ANNUAL WOODY BIOMASS PRODUCTION
Proportion Estimated Estimatedof total Average Standing Blomass Mean Annual Increments (Mal)
Forest Type Area land area per hectare Total Volume per ha Total Volume
('000 ha) (m3) (million m3) (m3) ('000 m3
Closed Broadleaved ForestsVirgin commercial high forests 905 9.4 250 226 1 905Logged-over high forests 425 4,4 200 85 3 1,275Non-commercial Virgin high forests 590 6,1 200 118 1 590Mangrove and coastal forest 80 08 50 12 0.5 40
Sub-total 2,000 20.7 441 2,810
Forest Fallow(I,e., previously cleared area nowunder shifting cultivatlon 5,500 57.1 75 413 3 16,500
Open Bradleaved ForestsWoodland Savanna 40 0,4 30 1 0.5 20Coastal Savanna 40 0.4 30 1 0.5 20 0
Subtotal 80 0.8 2 40
Formations (coastal)(derived from repeated cultivationand burning In coastal areas) 100 1.0 20 2 0.2 20
PlantatlonsRubber plantatIons ab 162 1.7 289 47 12 1,896Timber plantatlonns - 5 negligible 120 1 20 100
Subtotal 167 1.7 48 1,976
Overall Tree Cover 7,847 81.3 906 21,346
a/ See Annex 30.b/ See Annex 31.
Source: FAO, 1981, Consultation wIth FOA; IBRD and mission estimate5.

- 141 -
Annex 30
ESTIMATED RUBBER TREE STAND IN LIBERIA, 1983
Estimated MeanTotal Area a/ Average Standing Bilomass - Annual Increment
(ha to 3nearest 100 ha) ('000 n ) (sv) ('000 a ) (sv)
LargePlantations 28,900 5,780FirestoneLAC/UnIroyal 9,900 1,980Guthrie 7,500 1,500Liberia 2,600 520Salolo 2,500 500
Subtotal 51,4W 10,280 411
S2IaI iholders plantations(average 12 ha farms) 111,000 b/ 36,630 1,465
Total 162,400 46,910 1,876
a/ Given ongoing cleaning and replanting these estimates are only indicative, throughadequate for establishing the energy resource Implications. Smaliholders will prob-ably reduce planting directly and hence biomass production over time.
b Area of seallholder rubber crop established in 1979 survey funded by the bank was114,250 ha. From "*is has been substracted 3,250 ha which Is the estimated area ofrubber trees clearfelled for woodfuels close to Monrovia between 1979 and 1964.
cl PlantatIons established by large compantes are assumed to have a standing volume atnaturity of 220 m3 based on mensuration data gathered in Papua New Guinea. The FDAsampled the smaliholder rubber farm standing biomass for the mission in March 1964,establishing an average volume of 330 3 per ha. Since negligible replanting ha takenplace in recent ears an average retrievable standing biomass of 200 . /ha for plan'tations and 330 n /ha for s5ailholders for these estimates.
d/ Assumes for this calculation an average economic life of 25 years and an even age dis-tribution which in practice Is quite lumpy scuh that the age of the prment crop Isheavily biased towards the top third of age classes.
Source: Firestone Co., IBRD-funded survey of 1979. FDA measurements for mission andmission estimates.

- 142 -
Annex 31
PLANTATION TIMBER RESOURCES IN LIBERIA1983
A. Bomi Hills Plantation Plantation Area (ha)
Smelina Arborea 1960
Eucalyptus sp 320
Pinus sp a/ 790
Others a/ 940
B. Cape Mount Plantation
Pinus sp 927
a/ Estimated.
Source: FDA and World Bank.
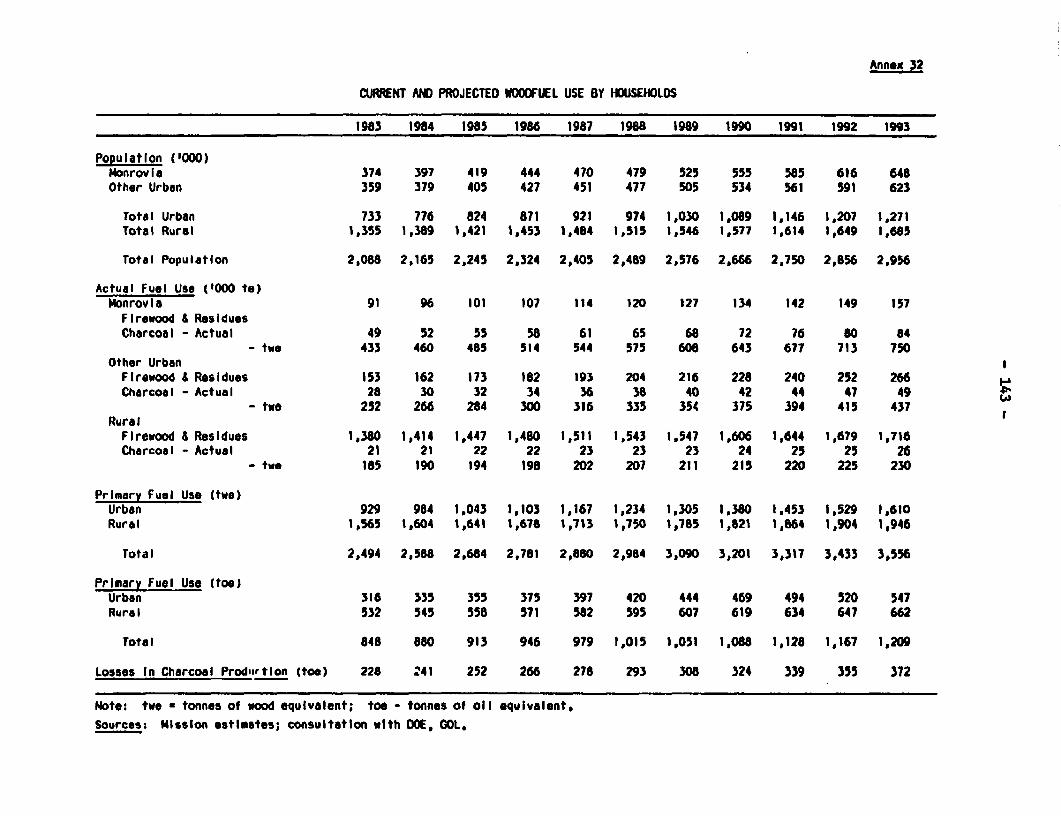
Annox 32
CU*NT AND PROJECTED WOOFUIEL USE BY HOUSEHOLDS
1983 1984 1985 1986 1987 1988 1989 1990 1991 1992 1993
Populatlon ('000)Monrovia 374 397 419 444 470 479 525 555 585 616 648Other Urban 359 379 405 427 451 477 505 534 561 591 623
Total Urban 733 776 824 871 921 974 1,030 1,089 1,146 1,207 1,271Total Rural 1,355 1,389 1,421 1,453 1,484 1,515 1,546 1,577 1,614 1,649 1,665
Total Populatlon 2,088 2,165 2,245 2,324 2,405 2,489 2,576 2,666 2,750 2,856 2,956
Actual Fuel Use ('000 te)Monrovia 91 96 101 107 114 120 127 134 142 149 157Firewood & ResiduesCharcoal - Actual 49 52 55 58 61 65 68 72 76 80 84
- two 433 460 485 514 544 575 608 643 677 713 750Other UrbanFirewood & Residues 153 162 173 182 193 204 216 228 240 252 266Charcoal -Actual 28 30 32 34 36 38 40 42 44 47 49
- two 252 266 284 300 316 335 354 375 394 415 437RuralFirewood & Residues 1,380 1,414 1,447 1,480 1,511 1,543 1,547 1,606 1,644 1,679 1,716Charcoal - Actual 21 21 22 22 23 23 23 24 25 25 26
- two 185 190 194 198 202 207 211 215 220 225 230
Primary Fuel Use (two)Urban 929 984 1,043 1,103 1,167 1,234 1,305 1,380 1,453 1,529 1,610Rural 1,565 1,604 1,641 1,678 1,713 1,750 1,785 1,821 1,864 1,904 1,946
Total 2,494 2,588 2,684 2,781 2,880 2,984 3,090 3,201 3,317 3,433 3,556
Primary Fuel Use (toe)Urban 316 335 355 375 397 420 444 469 494 520 547Rural 532 545 558 571 582 595 607 619 634 647 662
Total 848 880 913 946 979 1,015 1,051 1,088 1,128 1,167 1,209
Losses In Charcoal Prodoitlon (too) 228 241 252 266 278 293 308 324 339 355 372
Note: two * tonnes of wood equlvalent; toe - tonnes of oil equivalent,
Sources: Mission estimates; consultation wIth OOE, GOL,
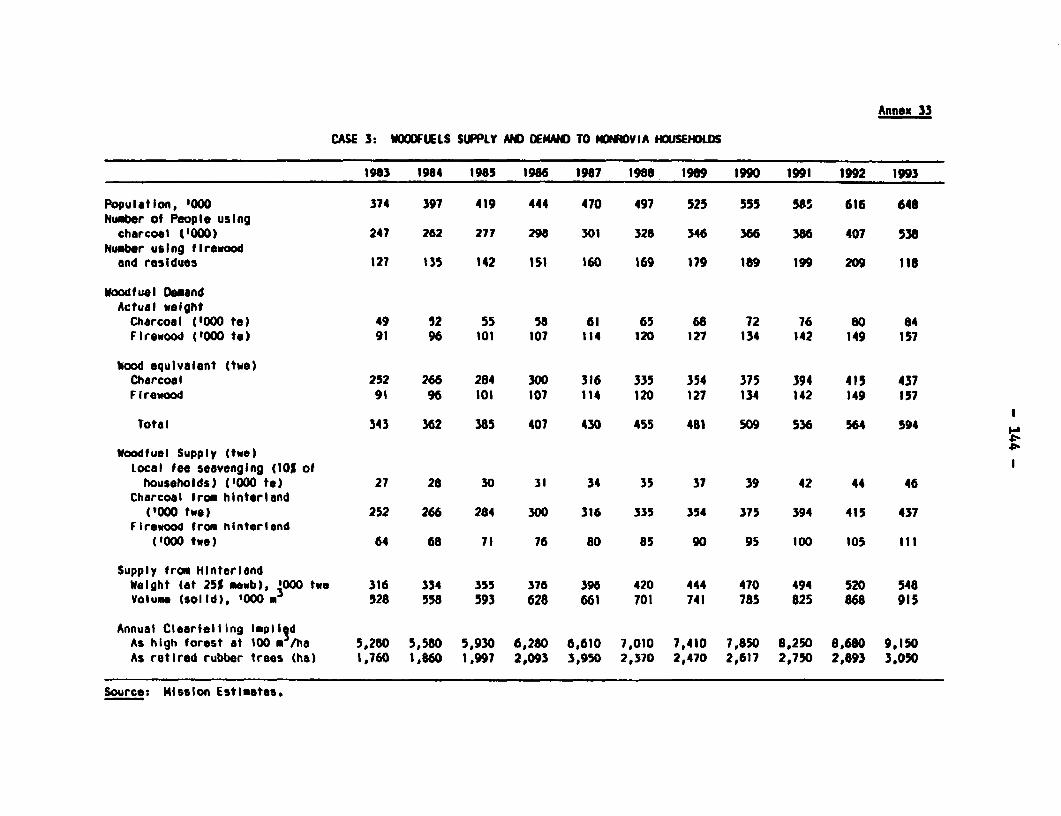
Annex 33
CASE 3: WOQOFUELS SUPPLY AND DEMAND TO MONREOVIA HOUSEHOLDS
1983 1984 1965 1966 19J7 1988 1989 1990 1991 1992 1993
Population, '000 374 397 419 444 470 497 525 555 595 616 648Number of People usingcharcoal ('000) 247 262 277 296 301 328 346 360 386 407 538
Number using firewoodand rosidues 127 135 142 151 160 169 179 189 199 209 116
Woodfuel DemandActual welghtCharcoal ('000 teo 49 52 55 58 61 65 68 72 76 80 84Firewood ('000 to) 91 96 101 107 114 120 127 134 142 149 157
Wood equivalent (two)Charcoal 252 266 284 300 316 335 354 375 394 415 437Firewood 91 96 101 107 114 120 127 134 142 149 157
Total 343 362 385 407 430 455 481 509 536 564 594
Woodfuel Supply (two)Local fee seavenging (10% ofhouseholds) ('000 to) 27 28 30 31 34 35 37 39 42 44 46
Charcoal from hinterland('000 two) 252 266 284 300 316 335 354 375 394 415 437
Firewood from hinterland('000 two) 64 68 71 76 50 85 90 95 100 105 III
Supply from HinterlandWeight (at 25% mewb), 000 two 316 334 355 376 396 420 444 470 494 520 548Volume (solid), 'O00 0C 528 558 593 628 661 701 741 785 825 868 915
Annual Clearfelling lmpil3dAs high forest at 100 m /ha 5,280 5,580 5,930 6,280 6,610 7.010 7,410 7,850 8,250 8,680 9,150As retired rubber trees (ha) 1,760 1,860 1,997 2,093 3,950 2,370 2,470 2,617 2,750 2,893 3.050
Source: Mission Estimates.

- 145 -
Annex 34
PRICE BUILD-UP FOR CHARCOAL IN LIBERIA, 1984
(per beg of 9-21 kg; avg 17.3 kg)
S Comments
Price in the Forest from the Charcoaler 1 00-1 .50 depending distance from the
m.3rket
Transport by trucker/buyer or 50-65 cents vzries with distance thoughcontract trucker negotiable
Economic cost of transport (17-25 cents] 50-75 miles for truck(World Bank, WATM) carrying 10 tonnes charcoal
with 57 bags/to.
Bulk Storage 0-10 cents delivered direct to most
retail outlets.
Handling from Bulk Storage to 0-10 cents doesn t apply whenretailers delivered direct to retail
outlets
Retail inarkup 15-75 cents if retailer incurs all
hani!ing and storage
charges, repacking of heavy
bags occurs so as to yield
a higher margin.
Retail Price in bags 2.25-2.50
Retail markup if sold in 0.45 kg lots 1.55-2.40
Retail price per bag equivalent for charcoal
sold in 0.45 kg lots 3.90
I = Not included In addition.
Source: Mission fieldwork.

Annex 35
ENERGY SECTOR INVESTMENT PROGRAM: 1984-1993(USS million)
1984 1985 1966 1987 1986 1969 1990 1991 1992 1993 Total %
1. Capital InvestmentA. Power Supply
Generation 0,50 6,40 16,40 14,05 4,55 1,25 1.00 5,75 10,50 5,00 65,40Distribution/Transmisslon 0.40 1.90 5.90 4.90 5.20 5.70 10,70 2.20 0.20 0.20 37.30
Subtotal 0.90 8.30 22.3 18,95 9,75 6,95 11,70 7.95 10,70 5,20 102,70 85
B, Petroleum SupplyPort, storage and depot
rehabilitation 1,27 3,75 2,48 7,50 6
8. Household Sub-SectorFuelwood to GNC 0.30 0,50 0.8 I
D. Household Sub-SectorCharco3l kilns 0.10 0.10 0.50 0,70Solar water heating 1.0 1.0 1.0 1.0 4,00
Subtotal 0.10 0.10 0.50 1.0 1.0 10 1.0 4,70 3
2. TechnIcal AssistanceA, Power 0.20 0.65 0,85 0,75 0.50 0.50 0.35 0,10 .0
S. Petroleum- Management contracts 0.08 0,.'0 0.60 0;60- Petroleum han"ilng & depot
design 0,20
C. IndustryIndustrial fuelwood 0.05
D. Households- Charcoal production/import 0,15 0.10- Rubberwood resources 0.15- Household cooking 0,03 0,10- Solar water heating 0,07
Subtotal 0.28 1,83 1,65 1.42 0.50 0.50 0.35 O,IP 6,68 S
TotI 1.18 11.80 28.30 23.35 11.25 8.45 135(5 9,05 10,70 5,20 122,33 100
Source; Mission estimates, Tables 2,8 and 3.10,

IBRD 12867R- \ ~10 9eB1_ N_
% e _d n,, _ ,;,F"1 y / \~~~ 7s _L. OWF A\.W. M#....._
.0f b"C AAI*
cm 7 n 6m Iw L
ar C 04 N T Y zerS G U I N E ~pAr ; m*&oL
dS~~~~~~~~~~~~~.w~ g 1 s.. s
SIERRA LEONE ofN._L 0 F A Agjmmj 6SC cm
S ~~~~~~~~~~~Oc... CPTH11coNUor-.
C Ol NTY r G U I NE A_ _ _ _ _ _ _
R AN E
^_2C OUN Y /ONGAIMBA
/ o \ X 8 v~~~I-
t$ > W < 4 f ~~~~~~~~~~~~~I V O R Y C O A S T
1*~ ~ ~ ~ ~ ~ ~ ~ ~~ ~~~~~~~~~~~~~~~~~~~~~L6
- - -RAYRA smjw RN 7AS { |/ < _
' ' - ''I7 "aiau '-n. :- 6o,' uP1d
- - -- -ac , -.u r w o R GED EH o-t -intinn ';paailUq S A ,I CO fiNi RIT Y
II~ ~ ~~~~;. ,,-i /\
- - :- : - X S I C O U N T Y--BERIN BERA -98
- °&@ ocan ' ;- : 1W A E R O A ' , @ ,
Ir- LT-m H;g ok
mocwrn ~ ~ ~ ~ ~ ~ ~ ~ ~ ~ ~ ~ ~ OVME 1984pwop O

IBRD 18368a 90 0~~~~~~~~~~~~~a j-
- 1'° ) 1l° - 1° L° 5 .----~~~~~~~~(~w-l~--.
SIERRA LEONE _
GUINEA ..80 8
o7 707-- ,J/ ? \ IVORY COAST
RollbertsDort
0A j/ *MONROVIA
* *~~~ Buchanon
\ 7(3 Budunon ..- :LIBERIA
\lver Cm
_50 \o \< eGreenville
- _
A TLA,,"T.'C H e
-40 4
30
LIBERIA
OFFSHORE PETROLEUM EXPLORATION
* WELL LOCATIONS
1O&; ISOBATHS
-2° ti3 SHELF BLOCK 2
SCOPE 8LOCK MILES 20 40 60 0
BLOCK BOUNDARIES KILOMETERS I I I I I0 20 40 60 80100 120
INTERNATIONALBOUNDARIES
110 10°0 0 8
JULY 1984

IBRD 18383
/ j, __ )
j 1 "' .2 9 II. LaSm
SIERRA LEONE r GUINEAr1 LISCO
.Jr A F R IC A
j ,,- F'EUZ r
' BELLE VELL* Mc6
a "'- ' '!
- i/ 1 -r (Q I V O R Y COASTLL APL YLLTAt L
.r ~ ~ ~ ~ ~ ~ t --~t ;cL,'u-'- iL. e
Dut MA :".MONROVIA TAPEA
AREA ~~~~~~C AREA ..
LIBERIA ca _ *,GENERATION AND TRANSMISSION
NETWORK- bitag6E Voing 6K Tlanrnuissonm Line
m TOl Seondary Centls with Die Power StalonAchm wlSiAro&
NIOC Notinal lIn Oe Compony ConcesuiotLMC Ubeiln Mining Company Concession
*MC log Miqing Company Concession
LAMCO Uibein Anuron Minng Company ConcessionLISCO Uberan inoand Steel Cpl Concession
bun INlnig Concession
---lcidi.-- ln"o it Soundarw- e
Atlo ntic Oc eaon ~ ,o as 5e 7? . -
a, n -30 rs l.e - fc U oo - r.Sn. c ts
JLAY 1984
