lfb distribution of county and municipal aid
TRANSCRIPT

8/7/2019 LFB Distribution of County and Municipal Aid
http://slidepdf.com/reader/full/lfb-distribution-of-county-and-municipal-aid 1/97
Legislative Fiscal BureauOne East Main, Suite 301 • Madison, WI 53703 • (608) 266-3847 • Fax: (608) 267-6873
March 15, 2011
TO: Members
Wisconsin Legislature
FROM: Bob Lang, Director
SUBJECT: Distribution of County and Municipal Aid Under the Governor's 2011-13 Budget
This memorandum provides information on provisions in the Governor’s 2011-13 biennial
budget bill (SB 27/AB 40) related to the county and municipal aid program. The bill would reduce
total funding for making calendar year 2012 payments by $96,000,000, and would establish
formulas for calculating reductions to individual local governments. Below is a description of these
formulas, as well as several sample calculations. The final section provides information on
estimates for individual counties and municipalities, which are shown in the attachment.
As noted, the bill would reduce funding by $96,000,000 in 2012-13 for making 2012payments under the county and municipal aid program, which would be a reduction of 11.6%
relative to total 2011 payments. Of this amount, payments to municipalities (towns, villages, and
cities) would be reduced by $59,500,000 (an 8.8% reduction) and payments to counties would be
reduced by $36,500,000 (a 24.1% reduction). The formula for determining aid reductions for
individual municipalities and counties is described in the following sections. For 2013 and
subsequent years, payments to individual counties and municipalities would be equal to the amount
each county and municipality received in 2012.
Municipal Aid Reduction Formula
For the purpose of determining aid reductions to individual municipalities, the bill would
establish five tiers, based on the following population ranges: (a) less than 2,500; (b) equal to or
greater than 2,500, but no greater than 10,000; (c) greater than 10,000, but no greater than 50,000;
(d) greater than 50,000, but no greater than 110,000; and (e) greater than 110,000.
For each municipality, the aid reduction formula, with certain exceptions, consists of two
components, one based upon population and the other based on equalized property value. The final

8/7/2019 LFB Distribution of County and Municipal Aid
http://slidepdf.com/reader/full/lfb-distribution-of-county-and-municipal-aid 2/97
Page 2
aid adjustments are also constrained by a maximum reduction factor that limits the aid loss to the
lesser of either 50% of the municipality's 2011 aid payment or an amount based on equalized
property value factor. These three components of the formula are described below.
Population-Based Aid Reduction
The population-based reduction factor is determined by multiplying population by a percapita formula constant and then multiplying the result by a coefficient index. The per capita
formula constant is established at a level such that the total reduction from all municipalities equals
$59,500,000. Using 2010 equalized value and Census population data, that formula constant is
approximately -$9.58 per capita. The coefficient index ranges from 0 to 1, depending upon where
an individual municipality's population falls within the population range of their tier. That is, for
municipalities at the bottom of the range for their tier, the coefficient would approach 0, for those in
the middle of the range, it would be around 0.5, and for those at the top of the range, it would
approach 1. Consequently, the total population-based reduction (formula constant X coefficient
index) will range from $0 to -$9.58 per capita. The exception to this formula is that the coefficient
is 1 for all municipalities in the top tier (the cities of Madison and Milwaukee), so the aid reduction
under this component for those municipalities would be -$9.58 per capita.
The specific formula for determining the population reduction component is as follows:
[Municipal Population (P)] multiplied by [Formula Constant
(-$9.58)] multiplied by [Coefficient Index], where the CoefficientIndex is established as follows:
Population Tier Coefficient Index
< 2,500 P
2,500
2,500 to 10,000 P - 2,5007,500
10,000 to 50,000 P - 10,00040,000
50,000 to 110,000 P - 50,00060,000
> 110,000 1
Property Value-Based Aid Reduction
Under the property value-based aid reduction formula component, a mill rate reduction
factor, which differs for each population tier, is multiplied by the municipality's equalized value.
The resulting reduction is added to the population-based reduction component. For municipalities
in the smallest population tier (population under 2,500), there is no property value-based reduction
component (in effect, a mill rate reduction factor of $0.00).

8/7/2019 LFB Distribution of County and Municipal Aid
http://slidepdf.com/reader/full/lfb-distribution-of-county-and-municipal-aid 3/97
Page 3
The specific formula for determining the property value-based aid reduction is as follows:
[Each $1,000 of Equalized Value] multiplied by [Mill RateReduction Factor], where the Mill Rate Reduction Factor is
established as follows:
Mill RatePopulation Tier Reduction Factor
< 2,500 $0.002,500 to 10,000 -$0.1010,000 to 50,000 -$0.1550,000 to 110,000 -$0.25> 110,000 -$0.30
Maximum Reduction Limits
The aid reduction for each municipality is limited to the lesser of 50% of the municipality's
2011 county and municipal aid payment or a maximum property value-based aid reduction, which
differs by tier.
The formula for determining the maximum aid reduction is as follows:
Lesser of: [50% of 2011 Aid Payment] or [(Each $1,000 of Equalized Value) multiplied by (Maximum Reduction Mill Rate
Factor)], where the Maximum Reduction Mill Rate Factor isestablished as follows:
Maximum ReductionPopulation Tier Mill Rate Factor
< 2,500 -$0.102,500 to 10,000 -$0.1510,000 to 50,000 -$0.2550,000 to 110,000 -$0.30> 110,000 -$0.35
Although the Department of Administration indicates that the intention was to limit the aid
payment reductions for all municipalities as shown in the previous formula, the bill, as drafted,could be interpreted to have only a mill rate reduction limit (no 50% of payment limit) for the
largest population tier. The attachment to this memorandum reflects the Department of
Administration's intent to utilize the lesser of both maximum reduction factors for all population
tiers.

8/7/2019 LFB Distribution of County and Municipal Aid
http://slidepdf.com/reader/full/lfb-distribution-of-county-and-municipal-aid 4/97
Page 4
County Aid Reduction Formula
For each county, the aid payment reduction is calculated by multiplying a per capita formula
constant by the county's population. This reduction is subject to a maximum reduction factor,
which is equal to the lesser of 50% of the county's 2011 county and municipal aid payment or -
$0.15 multiplied by each $1,000 of the county's equalized value. The formula constant is
established at a level such that the total reduction for all counties equals $36,500,000. Based on2010 Census population and equalized value data, the formula constant would be approximately -
$8.78 per capita.
Sample Calculations for Counties and Municipalities
This section provides sample calculations for counties and municipalities, to illustrate the
use of the bill's aid reduction formulas. The first example shows the aid reduction calculation for a
county. The next two examples shown are for municipalities for which the maximum reduction
factors would limit the total reduction to an amount below what the basic formula would otherwise
establish. The last example shows a municipality for which the basic formula reduction is less than
the maximum reduction.
Sample Calculation for Grant County
2010 Population: 51,208 County Formula Constant: -$8.77554
2010 Equalized Value: $2,802,563,500 2011 Aid Payment: $2,360,037
Maximum Reduction Factor: -$0.15 per $1,000 of value
Basic Formula Aid Reduction:
[(Population) X (Formula Constant) = Basic Formula Aid Reduction]
For Grant County,
51,208 X -$8.77554 = -$449,378
Maximum Reduction Adjustment:
[Lesser of (50% of 2011 Aid Payment) or ((Equalized Value/$1,000) X -$0.15)]
For Grant County,
50% of 2011 Aid payment: -0.5 X $2,306,037 = -$1,180,019, or($2,802,563,500/$1,000) X -$0.15 = -$420,385
Since -$420,385 is the lesser amount, this is the maximum aid reduction.
Final Reduction:
Since the formula reduction (-$449,378) exceeds the maximum reduction (-$420,385), the final aid
reduction is -$420,385.

8/7/2019 LFB Distribution of County and Municipal Aid
http://slidepdf.com/reader/full/lfb-distribution-of-county-and-municipal-aid 5/97
Page 5
Sample Calculation for the City of Milwaukee
2010 Census Population: 594,8332010 Equalized Value: $29,520,783,2002011 Aid Payment: $227,275,131
Population Tier Factors (>110,000):Coefficient Index: 1Mill Rate Reduction Factor: -$0.30 per $1,000 of valueMaximum Reduction Mill Rate Factor: -$0.35 per $1,000 of value
Population-Based Aid Reduction:
[(Population) X (Formula Constant) X (Coefficient Index) = Population-Based Aid Reduction]
For the City of Milwaukee,
594,833 X -$9.57941 X 1 = -$5,698,150
Property Value-Based Aid Reduction:
[(Equalized Value/$1,000) X (Mill Rate Reduction Factor) = Property Value-Based Reduction]
For the City of Milwaukee,
($29,520,783,200/$1,000) X -$0.30 = -$8,856,235
Total Reduction (prior to any maximum reduction adjustment):
[Population-Based Reduction + Property Value-Based Reduction]
For the City of Milwaukee,
(-$5,698,150) + (-$8,856,235) = -$14,554,385
Maximum Reduction Adjustment:
[Lesser of (50% of 2011 Aid Payment) or ((Equalized Value/$1,000) X -$0.35)]
For the City of Milwaukee,
50% of 2011 Aid Payment: -0.5 X $227,275,131 = -$113,637,566, or
($29,520,783,200/$1,000) X -$0.35 = -$10,332,274
Since -$10,332,274 is the lesser amount, this is the maximum aid reduction.
Final Reduction:
Since the formula reduction (-$14,554,385) exceeds the maximum reduction (-$10,332,274), the final aidreduction is -$10,332,274.

8/7/2019 LFB Distribution of County and Municipal Aid
http://slidepdf.com/reader/full/lfb-distribution-of-county-and-municipal-aid 6/97
Page 6
Sample Calculation for the Village of Lake Delton
2010 Census Population: 2,9142010 Equalized Value: $1,405,021,7002011 Aid Payment: $27,844
Population Tier Factors (2,500 to 10,000):Coefficient Index: [(2,914 - 2,500)/7,500] = 0.0552Mill Rate Reduction Factor: -$0.10 per $1,000 of valueMaximum Reduction Mill Rate Factor: -$0.15 per $1,000 of value
Population-Based Aid Reduction:
[(Population) X (Formula Constant) X (Coefficient Index) = Population-Based Aid Reduction]
For the Village of Lake Delton,
2,914 X -$9.57941 X 0.0552 = -$1,541
Property Value-Based Aid Reduction:
[(Equalized Value/$1,000) X (Mill Rate Reduction Factor) = Property Value-Based Reduction]
For the Village of Lake Delton,
($1,405,021,700/$1,000) X -$0.10 = -$140,502
Total Reduction (prior to any maximum reduction adjustment):
[Population-Based Reduction + Property Value-Based Reduction]
For the Village of Lake Delton,
(-$1,541) + (-$140,502) = -$142,043
Maximum Reduction Adjustment:
[Lesser of (50% of 2011 Aid Payment) or ((Equalized Value/$1,000) X -$0.15)]
For the Village of Lake Delton,
50% of 2011 Aid Payment: -0.5 X $27,844 = -$13,922, or($1,405,021,700/$1,000) X -$0.15 = -$210,753
Since -$13,922 is the lesser amount, this is the maximum aid reduction.
Final Reduction:
Since the formula reduction (-$142,043) exceeds the maximum reduction (-$13,922), the final aid reductionis -$13,922.

8/7/2019 LFB Distribution of County and Municipal Aid
http://slidepdf.com/reader/full/lfb-distribution-of-county-and-municipal-aid 7/97
Page 7
Sample Calculation for the City Superior
2010 Census Population: 27,2442010 Equalized Value: $1,654,068,8002011 Aid Payment: $7,937,747
Population Tier Factors (10,000 to 50,000):Coefficient Index: [(27,244 - 10,000)/40,000] = 0.4311Mill Rate Reduction Factor: -$0.15 per $1,000 of valueMaximum Reduction Mill Rate Factor: -$0.25 per $1,000 of value
Population-Based Aid Reduction:
[(Population) X (Formula Constant) X (Coefficient Index) = Population-Based Aid Reduction]
For the City of Superior,
27,244 X -$9.57941 X 0.4311 = -$112,509
Property Value-Based Aid Reduction:
[(Equalized Value/$1,000) X (Mill Rate Reduction Factor) = Property Value-Based Reduction]
For the City of Superior,
($1,654,068,800/$1,000) X -$0.15 = -$248,110
Total Reduction (prior to any maximum reduction adjustment):
[Population-Based Reduction + Property Value-Based Reduction]
For the City of Superior,
(-$112,509) + (-$248,110) = -$360,619
Maximum Reduction Adjustment:
[Lesser of (50% of 2011 Aid Payment) or ((Equalized Value/$1,000) X -$0.25)]
For the City of Superior,
50% of 2011 Aid Payment: -0.5 X $7,937,747 = -$3,968,873 or
($1,654,068,800/$1,000) X -$0.25 = -$413,517
Since -$413,517 is the lesser amount, this is the maximum aid reduction.
Final Reduction:
Since the formula reduction (-$360,619) does not exceed the maximum reduction (-$413,517), the final aidreduction is -$360,619.

8/7/2019 LFB Distribution of County and Municipal Aid
http://slidepdf.com/reader/full/lfb-distribution-of-county-and-municipal-aid 8/97
Page 8
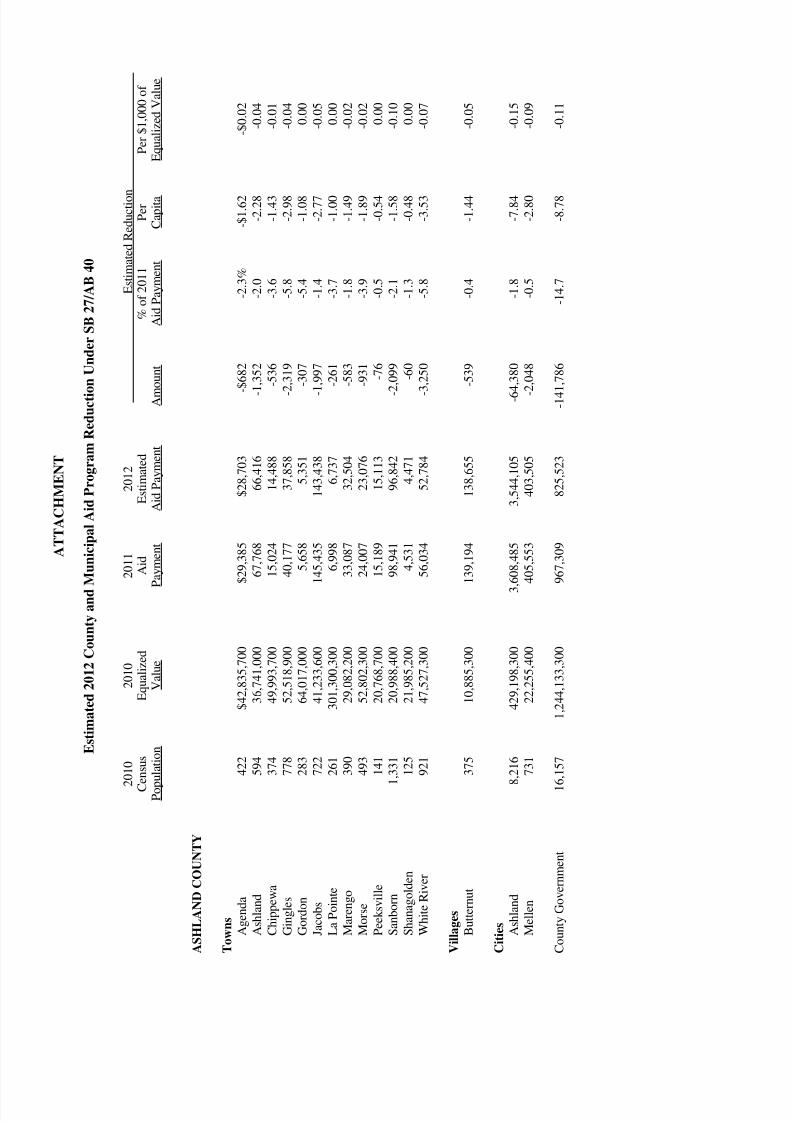
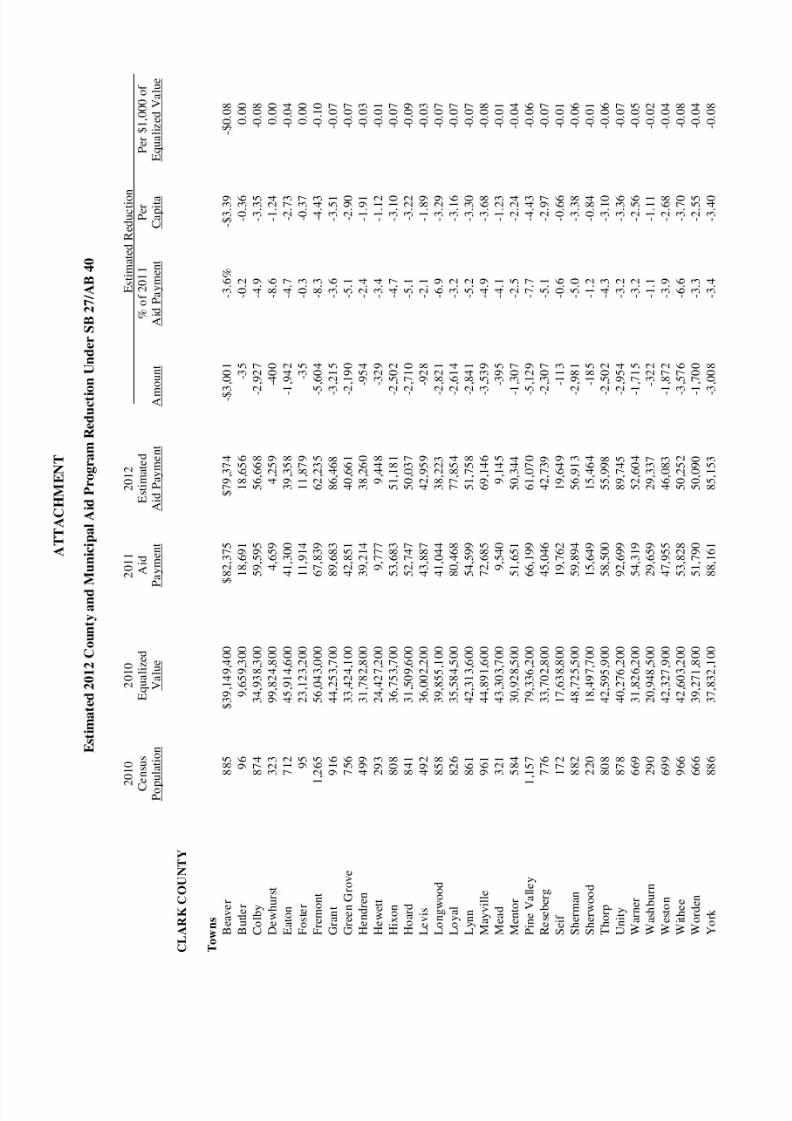
Description of the Attachment
The attachment to this memorandum provides an estimate of the aid reduction for each local
government, as well as three measures of the magnitude of the reduction. The following describes
each column of the printout. After the description of the printout columns, the next section
provides a table summarizing three measures of the aid reductions for municipalities by population
tier and a table showing those measures by type of government. The three measures of the aidreduction are described below for Columns 7, 8, and 9 of the printout.
Column 1: County and Municipality. The printout is arranged alphabetically by county.
Municipalities within each county are sorted by municipal type (town, village, and city) and then
arranged alphabetically. Municipalities within more than one county are reported in the county in
which a majority of their taxable value is located.
Column 2: 2010 Census Population. The population amounts shown are from the 2010
Census.
Column 3: 2010 Equalized Value. The total equalized value as determined by the
Department of Revenue for 2010.
Column 4: 2011 Aid Payment. These amounts are the 2011 entitlements under the county
and municipal aid program. They do not include any amounts received under the separate utility
aid or expenditure restraint programs. In addition, no adjustments have been made to reflect any
penalties incurred for exceeding the levy limit or the emergency services maintenance of effort
requirement.
Column 5: 2012 Estimated Aid Payment. These amounts reflect an estimate of 2012 aid
payments under provisions of the bill. Since the actual 2012 aid payments will be calculated using
2011 population and equalized value data, for many counties and municipalities the final figures
will differ from those shown in the attachment.
Column 6: Estimated Reduction, Amount. These amounts reflect the dollar amount of the
estimated aid reduction, relative to the 2011 aid entitlement.
Column 7: Estimated Reduction, Percent of 2011 Aid Payment. These amounts show the
estimated aid reduction, as a percentage of the 2011 aid entitlement.
Column 8: Estimated Reduction, Per Capita Amount. These amounts show the estimated
reduction on a per capita basis. That is, the dollar amount reduction divided by population.
Column 9: Estimated Reduction, Per $1,000 of Equalized Value. These amounts show the
estimated reduction in relation to the total property value. Conceptually, this figure reflects the
amount that each local government would have to increase its mill rate to replace the aid reduction,
holding taxable value constant. [It should be noted, however, that a separate provision of the bill

8/7/2019 LFB Distribution of County and Municipal Aid
http://slidepdf.com/reader/full/lfb-distribution-of-county-and-municipal-aid 9/97
Page 9
would, subject to certain exceptions, limit municipal property tax levy increases to 0.0% or the
percentage increase in new construction, whichever is greater, unless a referendum is passed to
exceed that limit.]
Summary Information on Aid Reductions
The following tables shows the total aid reduction by municipal population tier and by typeof government.
Measures of Estimated Reduction by Population Tier
Reduction Expressed asTotal Estimated % of 2011 Per Per $1,000 of
Population Tier Reduction Payment Capita Equalized Value
< 2,500 $5,990,596 -5.9% -$4.45 -$0.042,500 to 10,000 10,459,273 -11.3 -8.57 -0.0910,000 to 50,000 16,932,612 -12.2 -10.87 -0.1250,000 to 110,000 12,609,732 -11.4 -17.21 -0.27> 110,000 13,507,787 -5.8 -16.31 -0.26
All Municipalities $59,500,000 -8.8% -$10.46 -$0.12
Measures of Estimated Reduction by Government Type
Reduction Expressed asTotal Estimated % of 2011 Per Per $1,000 of
Population Tier Reduction Payment Capita Equalized Value
Towns $9,587,494 -19.0% -$5.78 -$0.05Villages 7,129,194 -10.6 -8.18 -0.09Cities 42,783,313 -7.6 -13.55 -0.19
All Municipalities $59,500,000 -8.8% -$10.46 -$0.12
All Counties $36,500,000 -24.1% -$6.42 -$0.07
Note: Aid reduction totals do not add due to rounding.
BL/JWD/sas
Attachment

8/7/2019 LFB Distribution of County and Municipal Aid
http://slidepdf.com/reader/full/lfb-distribution-of-county-and-municipal-aid 10/97

8/7/2019 LFB Distribution of County and Municipal Aid
http://slidepdf.com/reader/full/lfb-distribution-of-county-and-municipal-aid 11/97
ATTACHMENT
Estimated 2012 County and Municipal Aid Program Reductio
n Under SB 27/AB 40
2
010
2010
2011
2012
Estimated Reduction
Census
Equalized
Aid
Estimated
% of 2011
Per
Per $1,000 of
Pop
ulation
Value
Payment
Aid Payment
Am
ount
Aid Payment
Capita
Equalized Value
ADAMS COUNTY
Towns
Adams
1
,345
$134,273,800
$36,681
$29,749
-$6,932
-18.9%
-$5.15
-$0.05
Big Flats
1
,018
94,991,000
16,101
12,130
-3,971
-24.7
-3.90
-0.04
Colburn
223
41,767,300
6,149
5,958
-191
-3.1
-0.86
0.00
Dell Prairie
1
,590
171,256,400
21,459
11,772
-9,687
-45.1
-6.09
-0.06
Easton
1
,130
93,370,100
20,845
15,952
-4,893
-23.5
-4.33
-0.05
Jackson
1
,003
192,625,500
12,792
8,937
-3,855
-30.1
-3.84
-0.02
Leola
308
38,991,700
9,347
8,984
-363
-3.9
-1.18
-0.01
Lincoln
296
42,903,600
11,449
11,113
-336
-2.9
-1.14
-0.01
Monroe
398
99,820,900
5,777
5,170
-607
-10.5
-1.53
-0.01
New Chester
2
,254
91,273,900
90,940
81,813
-9,127
-10.0
-4.05
-0.10
New Haven
655
57,421,900
16,119
14,475
-1,644
-10.2
-2.51
-0.03
Preston
1
,393
143,955,400
20,581
13,146
-7,435
-36.1
-5.34
-0.05
Quincy
1
,163
215,079,800
18,100
12,917
-5,183
-28.6
-4.46
-0.02
Richfield
158
28,691,300
6,636
6,540
-96
-1.4
-0.61
0.00
Rome
2
,720
694,290,800
49,503
24,752
-24,751
-50.0
-9.10
-0.04
Springville
1,318
131,635,200
15,244
8,588
-6,656
-43.7
-5.05
-0.05
Strongs Prairie
1
,150
201,036,800
19,805
14,737
-5,068
-25.6
-4.41
-0.03
Villages
Friendship
725
31,169,400
160,321
158,307
-2,014
-1.3
-2.78
-0.06
Cities Adams
1
,967
84,683,100
615,251
606,783
-8,468
-1.4
-4.31
-0.10
County Government
20
,875
2,696,490,000
24,808
12,404
-12,404
-50.0
-0.59
0.00
8/7/2019 LFB Distribution of County and Municipal Aid
http://slidepdf.com/reader/full/lfb-distribution-of-county-and-municipal-aid 12/97
ATTACHMENT
Estimated 2012 County and Municipal Aid Program Reductio
n Under SB 27/AB 40
2
010
2010
2011
2012
Estimated Reduction
Census
Equalized
Aid
Estimated
% of 2011
Per
Per $1,000 of
Pop
ulation
Value
Payment
Aid Payment
Am
ount
Aid Payment
Capita
Equalized Value
ASHLAND COUNTY
Towns
Agenda
422
$42,835,700
$29,385
$28,703
-
$682
-2.3%
-$1.62
-$0.02
Ashland
594
36,741,000
67,768
66,416
-1,352
-2.0
-2.28
-0.04
Chippewa
374
49,993,700
15,024
14,488
-536
-3.6
-1.43
-0.01
Gingles
778
52,518,900
40,177
37,858
-2,319
-5.8
-2.98
-0.04
Gordon
283
64,017,000
5,658
5,351
-307
-5.4
-1.08
0.00
Jacobs
722
41,233,600
145,435
143,438
-1,997
-1.4
-2.77
-0.05
La Pointe
261
301,300,300
6,998
6,737
-261
-3.7
-1.00
0.00
Marengo
390
29,082,200
33,087
32,504
-583
-1.8
-1.49
-0.02
Morse
493
52,802,300
24,007
23,076
-931
-3.9
-1.89
-0.02
Peeksville
141
20,768,700
15,189
15,113
-76
-0.5
-0.54
0.00
Sanborn
1
,331
20,988,400
98,941
96,842
-2,099
-2.1
-1.58
-0.10
Shanagolden
125
21,985,200
4,531
4,471
-60
-1.3
-0.48
0.00
White River
921
47,527,300
56,034
52,784
-3,250
-5.8
-3.53
-0.07
Villages
Butternut
375
10,885,300
139,194
138,655
-539
-0.4
-1.44
-0.05
Cities Ashland
8
,216
429,198,300
3,608,485
3,544,105
-64,380
-1.8
-7.84
-0.15
Mellen
731
22,255,400
405,553
403,505
-2,048
-0.5
-2.80
-0.09
County Government
16
,157
1,244,133,300
967,309
825,523
-141,786
-14.7
-8.78
-0.11

8/7/2019 LFB Distribution of County and Municipal Aid
http://slidepdf.com/reader/full/lfb-distribution-of-county-and-municipal-aid 13/97
ATTACHMENT
Estimated 2012 County and Municipal Aid Program Reductio
n Under SB 27/AB 40
2
010
2010
2011
2012
Estimated Reduction
Census
Equalized
Aid
Estimated
% of 2011
Per
Per $1,000 of
Pop
ulation
Value
Payment
Aid Payment
Am
ount
Aid Payment
Capita
Equalized Value
BARRON COUNTY
Towns
Almena
858
$141,547,800
$14,009
$11,188
-$2,821
-20.1%
-$3.29
-$0.02
Arland
789
39,966,500
66,106
63,721
-2,385
-3.6
-3.02
-0.06
Barron
873
51,119,900
56,164
53,244
-2,920
-5.2
-3.34
-0.06
Bear Lake
659
78,448,200
10,834
9,170
-1,664
-15.4
-2.53
-0.02
Cedar Lake
948
279,644,400
14,263
10,819
-3,444
-24.1
-3.63
-0.01
Chetek
1
,644
256,731,900
27,251
16,895
-10,356
-38.0
-6.30
-0.04
Clinton
879
58,379,800
75,993
73,032
-2,961
-3.9
-3.37
-0.05
Crystal Lake
757
76,136,300
27,794
25,598
-2,196
-7.9
-2.90
-0.03
Cumberland
876
76,826,700
34,687
31,747
-2,940
-8.5
-3.36
-0.04
Dallas
574
37,322,000
36,537
35,275
-1,262
-3.5
-2.20
-0.03
Dovre
849
54,072,800
58,179
55,417
-2,762
-4.7
-3.25
-0.05
Doyle
453
43,635,000
29,691
28,905
-786
-2.6
-1.74
-0.02
Lakeland
975
139,740,000
19,666
16,023
-3,643
-18.5
-3.74
-0.03
Maple Grove
979
48,146,100
96,050
92,377
-3,673
-3.8
-3.75
-0.08
Maple Plain
803
185,848,300
10,762
8,291
-2,471
-23.0
-3.08
-0.01
Oak Grove
948
67,561,600
54,996
51,552
-3,444
-6.3
-3.63
-0.05
Prairie Farm
564
33,431,400
63,678
62,459
-1,219
-1.9
-2.16
-0.04
Prairie Lake
1
,532
166,950,300
28,866
19,873
-8,993
-31.2
-5.87
-0.05
Rice Lake
3
,041
215,470,700
85,309
61,661
-23,648
-27.7
-7.78
-0.11
Sioux Creek
655
43,443,400
76,548
74,904
-1,644
-2.1
-2.51
-0.04
Stanfold
719
52,637,300
45,756
43,775
-1,981
-4.3
-2.76
-0.04
Stanley
2
,546
178,391,100
87,405
69,416
-17,989
-20.6
-7.07
-0.10
Sumner
798
50,297,100
40,724
38,284
-2,440
-6.0
-3.06
-0.05
Turtle Lake
624
49,893,800
50,834
49,342
-1,492
-2.9
-2.39
-0.03
Vance Creek
669
42,346,800
91,288
89,573
-1,715
-1.9
-2.56
-0.04

8/7/2019 LFB Distribution of County and Municipal Aid
http://slidepdf.com/reader/full/lfb-distribution-of-county-and-municipal-aid 14/97
ATTACHMENT
Estimated 2012 County and Municipal Aid Program Reductio
n Under SB 27/AB 40
2
010
2010
2011
2012
Estimated Reduction
Census
Equalized
Aid
Estimated
% of 2011
Per
Per $1,000 of
Pop
ulation
Value
Payment
Aid Payment
Am
ount
Aid Payment
Capita
Equalized Value
BARRON COUNTY (continued
)
Villages
Almena
677
$27,556,600
$
195,104
$193,348
-$1,756
-0.9%
-$2.59
-$0.06
Cameron
1
,783
76,964,500
364,159
356,463
-7,696
-2.1
-4.32
-0.10
Dallas
409
13,799,500
90,744
90,103
-641
-0.7
-1.57
-0.05
Haugen
287
11,823,300
82,890
82,574
-316
-0.4
-1.10
-0.03
Prairie Farm
473
17,794,700
109,478
108,621
-857
-0.8
-1.81
-0.05
Turtle Lake *
1
,050
68,059,500
216,926
212,701
-4,225
-1.9
-4.02
-0.06
Cities Barron
3
,423
129,992,800
715,470
698,435
-17,035
-2.4
-4.98
-0.13
Chetek
2
,221
133,631,500
345,202
331,839
-13,363
-3.9
-6.02
-0.10
Cumberland
2
,170
158,283,400
508,615
492,787
-15,828
-3.1
-7.29
-0.10
Rice Lake
8
,438
594,336,800
1,791,041
1,701,890
-89,151
-5.0
-10.57
-0.15
County Government
45
,870
3,684,112,500
1,533,886
1,131,352
-402,534
-26.2
-8.78
-0.11
* This municipality is located in m
ore than one county. The amounts shown are for the entire municipality, as op
posed to the part of the municipality in this county.

8/7/2019 LFB Distribution of County and Municipal Aid
http://slidepdf.com/reader/full/lfb-distribution-of-county-and-municipal-aid 15/97
ATTACHMENT
Estimated 2012 County and Municipal Aid Program Reductio
n Under SB 27/AB 40
2
010
2010
2011
2012
Estimated Reduction
Census
Equalized
Aid
Estimated
% of 2011
Per
Per $1,000 of
Pop
ulation
Value
Payment
Aid Payment
Am
ount
Aid Payment
Capita
Equalized Value
BAYFIELD COUNTY
Towns
Barksdale
723
$69,064,500
$41,915
$39,912
-$2,003
-4.8%
-$2.77
-$0.03
Barnes
769
346,863,000
14,896
12,630
-2,266
-15.2
-2.95
-0.01
Bayfield
680
186,971,800
18,428
16,656
-1,772
-9.6
-2.61
-0.01
Bayview
487
88,453,200
7,924
7,015
-909
-11.5
-1.87
-0.01
Bell
263
108,267,400
6,815
6,550
-265
-3.9
-1.01
0.00
Cable
825
173,574,700
24,088
21,480
-2,608
-10.8
-3.16
-0.02
Clover
223
83,468,500
6,220
6,029
-191
-3.1
-0.86
0.00
Delta
273
88,449,800
6,439
6,153
-286
-4.4
-1.05
0.00
Drummond
463
184,643,300
12,839
12,018
-821
-6.4
-1.77
0.00
Eileen
681
56,986,400
49,893
48,116
-1,777
-3.6
-2.61
-0.03
Grand View
468
153,321,200
12,926
12,087
-839
-6.5
-1.79
-0.01
Hughes
383
74,831,900
6,254
5,692
-562
-9.0
-1.47
-0.01
Iron River
1
,123
226,740,700
15,474
10,642
-4,832
-31.2
-4.30
-0.02
Kelly
463
33,504,100
31,336
30,515
-821
-2.6
-1.77
-0.02
Keystone
378
27,711,600
45,505
44,958
-547
-1.2
-1.45
-0.02
Lincoln
287
38,850,100
19,822
19,506
-316
-1.6
-1.10
-0.01
Mason
315
22,411,400
29,482
29,102
-380
-1.3
-1.21
-0.02
Namakagon
246
259,775,600
7,967
7,735
-232
-2.9
-0.94
0.00
Orienta
122
41,866,000
4,120
4,063
-57
-1.4
-0.47
0.00
Oulu
527
33,592,500
64,692
63,628
-1,064
-1.6
-2.02
-0.03
Pilsen
210
16,289,700
27,377
27,208
-169
-0.6
-0.80
-0.01
Port Wing
368
52,529,400
57,619
57,100
-519
-0.9
-1.41
-0.01
Russell
1
,279
36,901,400
117,825
114,135
-3,690
-3.1
-2.89
-0.10
Tripp
231
21,792,500
14,944
14,740
-204
-1.4
-0.88
-0.01
Washburn
530
50,205,000
25,312
24,236
-1,076
-4.3
-2.03
-0.02
Villages
Mason
93
3,488,300
39,262
39,229
-33
-0.1
-0.35
-0.01
Cities Bayfield
487
104,625,800
29,444
28,535
-909
-3.1
-1.87
-0.01
Washburn
2
,117
122,206,600
638,913
626,692
-12,221
-1.9
-5.77
-0.10
County Government
15
,014
2,707,386,400
69,307
34,654
-34,653
-50.0
-2.31
-0.01

8/7/2019 LFB Distribution of County and Municipal Aid
http://slidepdf.com/reader/full/lfb-distribution-of-county-and-municipal-aid 16/97

8/7/2019 LFB Distribution of County and Municipal Aid
http://slidepdf.com/reader/full/lfb-distribution-of-county-and-municipal-aid 17/97
ATTACHMENT
Estimated 2012 County and Municipal Aid Program Reductio
n Under SB 27/AB 40
2
010
2010
2011
2012
Estimated Reduction
Census
Equalized
Aid
Estimated
% of 2011
Per
Per $1,000 of
Pop
ulation
Value
Payment
Aid Payment
Am
ount
Aid Payment
Capita
Equalized Value
BUFFALO COUNTY
Towns
Alma
297
$37,934,200
$22,134
$21,796
-
$338
-1.5%
-$1.14
-$0.01
Belvidere
396
50,595,900
25,217
24,616
-601
-2.4
-1.52
-0.01
Buffalo
705
59,371,600
38,382
36,478
-1,904
-5.0
-2.70
-0.03
Canton
305
24,081,600
21,270
20,914
-356
-1.7
-1.17
-0.01
Cross
377
35,371,700
18,132
17,587
-545
-3.0
-1.45
-0.02
Dover
486
30,808,800
37,287
36,382
-905
-2.4
-1.86
-0.03
Gilmanton
426
36,846,400
36,432
35,737
-695
-1.9
-1.63
-0.02
Glencoe
485
32,434,500
28,860
27,959
-901
-3.1
-1.86
-0.03
Lincoln
162
25,676,200
9,696
9,595
-101
-1.0
-0.62
0.00
Maxville
309
32,806,300
11,535
11,169
-366
-3.2
-1.18
-0.01
Milton
534
45,528,700
35,510
34,417
-1,093
-3.1
-2.05
-0.02
Modena
354
28,520,500
25,430
24,950
-480
-1.9
-1.36
-0.02
Mondovi
469
34,208,100
39,767
38,924
-843
-2.1
-1.80
-0.02
Montana
284
28,998,800
13,597
13,288
-309
-2.3
-1.09
-0.01
Naples
691
42,552,300
33,256
31,426
-1,830
-5.5
-2.65
-0.04
Nelson
571
63,270,500
33,191
31,942
-1,249
-3.8
-2.19
-0.02
Waumandee
472
44,327,500
25,363
24,509
-854
-3.4
-1.81
-0.02
Villages
Cochrane
450
23,582,800
82,602
81,826
-776
-0.9
-1.72
-0.03
Nelson
374
19,405,700
97,220
96,684
-536
-0.6
-1.43
-0.03
Cities Alma
781
53,240,800
119,087
116,750
-2,337
-2.0
-2.99
-0.04
Buffalo City
1
,023
71,860,500
68,078
64,068
-4,010
-5.9
-3.92
-0.06
Fountain City
859
50,742,300
209,781
206,954
-2,827
-1.3
-3.29
-0.06
Mondovi
2
,777
144,630,100
620,943
605,497
-15,446
-2.5
-5.56
-0.11
County Government
13
,587
1,016,795,800
427,526
308,293
-119,233
-27.9
-8.78
-0.12

8/7/2019 LFB Distribution of County and Municipal Aid
http://slidepdf.com/reader/full/lfb-distribution-of-county-and-municipal-aid 18/97
ATTACHMENT
Estimated 2012 County and Municipal Aid Program Reductio
n Under SB 27/AB 40
2
010
2010
2011
2012
Estimated Reduction
Census
Equalized
Aid
Estimated
% of 2011
Per
Per $1,000 of
Pop
ulation
Value
Payment
Aid Payment
Am
ount
Aid Payment
Capita
Equalized Value
BURNETT COUNTY
Towns
Anderson
398
$33,430,000
$23,419
$22,812
-
$607
-2.6%
-$1.53
-$0.02
Blaine
197
44,083,600
8,499
8,350
-149
-1.8
-0.76
0.00
Daniels
649
90,173,900
18,119
16,505
-1,614
-8.9
-2.49
-0.02
Dewey
516
51,889,900
25,788
24,768
-1,020
-4.0
-1.98
-0.02
Grantsburg
1
,136
69,356,500
49,894
44,949
-4,945
-9.9
-4.35
-0.07
Jackson
773
265,202,000
9,043
6,753
-2,290
-25.3
-2.96
-0.01
La Follette
536
121,296,900
7,896
6,795
-1,101
-13.9
-2.05
-0.01
Lincoln
309
44,053,700
18,179
17,813
-366
-2.0
-1.18
-0.01
Meenon
1
,163
141,819,400
15,409
10,226
-5,183
-33.6
-4.46
-0.04
Oakland
827
272,627,100
9,655
7,034
-2,621
-27.1
-3.17
-0.01
Roosevelt
199
28,559,900
9,661
9,509
-152
-1.6
-0.76
-0.01
Rusk
409
93,684,100
5,903
5,262
-641
-10.9
-1.57
-0.01
Sand Lake
531
98,228,400
7,163
6,083
-1,080
-15.1
-2.03
-0.01
Scott
494
274,807,600
7,776
6,841
-935
-12.0
-1.89
0.00
Siren
936
170,178,600
18,881
15,524
-3,357
-17.8
-3.59
-0.02
Swiss
790
174,064,400
22,309
19,918
-2,391
-10.7
-3.03
-0.01
Trade Lake
823
139,485,300
17,219
14,624
-2,595
-15.1
-3.15
-0.02
Union
340
111,209,700
4,907
4,464
-443
-9.0
-1.30
0.00
Webb Lake
311
228,740,900
3,926
3,555
-371
-9.4
-1.19
0.00
West Marshland
367
33,653,300
22,657
22,141
-516
-2.3
-1.41
-0.02
Wood River
953
127,026,100
25,727
22,247
-3,480
-13.5
-3.65
-0.03
Villages
Grantsburg
1
,341
66,110,300
404,960
398,349
-6,611
-1.6
-4.93
-0.10
Siren
806
74,924,100
168,331
165,842
-2,489
-1.5
-3.09
-0.03
Webster
653
32,500,100
175,951
174,317
-1,634
-0.9
-2.50
-0.05
County Government
15
,457
2,787,105,800
31,709
15,855
-15,854
-50.0
-1.03
-0.01

8/7/2019 LFB Distribution of County and Municipal Aid
http://slidepdf.com/reader/full/lfb-distribution-of-county-and-municipal-aid 19/97
ATTACHMENT
Estimated 2012 County and Municipal Aid Program Reductio
n Under SB 27/AB 40
2
010
2010
2011
2012
Estimated Reduction
Census
Equalized
Aid
Estimated
% of 2011
Per
Per $1,000 of
Pop
ulation
Value
Payment
Aid Payment
Am
ount
Aid Payment
Capita
Equalized Value
CALUMET COUNTY
Towns
Brillion
1,486
$93,505,000
$61,205
$52,744
-$8,461
-13.8%
-$5.69
-$0.09
Brothertown
1
,329
128,979,200
49,308
42,540
-6,768
-13.7
-5.09
-0.05
Charlestown
775
59,311,300
33,127
30,826
-2,301
-6.9
-2.97
-0.04
Chilton
1
,143
99,765,500
25,468
20,462
-5,006
-19.7
-4.38
-0.05
Harrison
10
,839
847,190,800
74,625
37,313
-37,312
-50.0
-3.44
-0.04
New Holstein
1
,508
113,825,400
76,794
68,080
-8,714
-11.3
-5.78
-0.08
Rantoul
798
63,040,600
48,681
46,241
-2,440
-5.0
-3.06
-0.04
Stockbridge
1
,456
160,200,100
33,148
25,025
-8,123
-24.5
-5.58
-0.05
Woodville
980
66,439,500
52,342
48,662
-3,680
-7.0
-3.76
-0.06
Villages
Hilbert
1
,132
56,424,900
390,844
385,934
-4,910
-1.3
-4.34
-0.09
Potter
253
12,672,100
43,647
43,402
-245
-0.6
-0.97
-0.02
Sherwood
2
,713
228,926,100
18,956
9,478
-9,478
-50.0
-3.49
-0.04
Stockbridge
636
67,493,100
37,582
36,032
-1,550
-4.1
-2.44
-0.02
Cities Brillion
3,148
188,060,300
599,912
578,500
-21,412
-3.6
-6.80
-0.11
Chilton
3
,933
250,953,300
527,107
494,813
-32,294
-6.1
-8.21
-0.13
New Holstein
3
,236
178,800,900
624,928
604,006
-20,922
-3.3
-6.47
-0.12
County Government
48
,971
3,489,098,200
930,485
500,738
-429,747
-46.2
-8.78
-0.12

8/7/2019 LFB Distribution of County and Municipal Aid
http://slidepdf.com/reader/full/lfb-distribution-of-county-and-municipal-aid 20/97
8/7/2019 LFB Distribution of County and Municipal Aid
http://slidepdf.com/reader/full/lfb-distribution-of-county-and-municipal-aid 21/97

8/7/2019 LFB Distribution of County and Municipal Aid
http://slidepdf.com/reader/full/lfb-distribution-of-county-and-municipal-aid 22/97
ATTACHMENT
Estimated 2012 County and Municipal Aid Program Reductio
n Under SB 27/AB 40
2
010
2010
2011
2012
Estimated Reduction
Census
Equalized
Aid
Estimated
% of 2011
Per
Per $1,000 of
Pop
ulation
Value
Payment
Aid Payment
Am
ount
Aid Payment
Capita
Equalized Value
CLARK COUNTY (continued)
Villages
Curtiss
216
$17,048,600
$63,739
$63,560
-
$179
-0.3%
-$0.83
-$0.01
Dorchester *
876
46,398,600
213,893
210,953
-2,940
-1.4
-3.36
-0.06
Granton
355
11,150,400
201,790
201,307
-483
-0.2
-1.36
-0.04
Withee
487
18,397,700
209,738
208,829
-909
-0.4
-1.87
-0.05
Cities Abbotsford *
2
,310
114,277,800
458,653
447,225
-11,428
-2.5
-4.95
-0.10
Colby *
1
,852
71,032,000
446,237
439,134
-7,103
-1.6
-3.84
-0.10
Greenwood
1
,026
40,154,700
462,972
458,957
-4,015
-0.9
-3.91
-0.10
Loyal
1
,261
54,057,300
392,744
387,338
-5,406
-1.4
-4.29
-0.10
Neillsville
2,463
110,429,200
874,650
863,607
-11,043
-1.3
-4.48
-0.10
Owen
940
38,749,600
472,787
469,401
-3,386
-0.7
-3.60
-0.09
Thorp
1
,621
77,628,500
580,981
573,218
-7,763
-1.3
-4.79
-0.10
County Government
34
,690
1,806,213,700
2,109,659
1,838,727
-270,932
-12.8
-7.81
-0.15
* This municipality is located in m
ore than one county. The amounts shown are for the entire municipality, as op
posed to the part of the municipality in this county.

8/7/2019 LFB Distribution of County and Municipal Aid
http://slidepdf.com/reader/full/lfb-distribution-of-county-and-municipal-aid 23/97
ATTACHMENT
Estimated 2012 County and Municipal Aid Program Reductio
n Under SB 27/AB 40
2
010
2010
2011
2012
Estimated Reduction
Census
Equalized
Aid
Estimated
% of 2011
Per
Per $1,000 of
Pop
ulation
Value
Payment
Aid Payment
Am
ount
Aid Payment
Capita
Equalized Value
COLUMBIA COUNTY
Towns
Arlington
806
$89,444,000
$13,936
$11,447
-$2,489
-17.9%
-$3.09
-$0.03
Caledonia
1
,378
231,888,900
29,953
22,677
-7,276
-24.3
-5.28
-0.03
Columbus
646
68,530,200
25,523
23,924
-1,599
-6.3
-2.48
-0.02
Courtland
525
50,091,700
15,992
14,936
-1,056
-6.6
-2.01
-0.02
Dekorra
2
,311
368,262,300
36,513
18,257
-18,256
-50.0
-7.90
-0.05
Fort Winnebago
825
77,955,400
14,559
11,951
-2,608
-17.9
-3.16
-0.03
Fountain Prairie
887
80,702,400
16,946
13,931
-3,015
-17.8
-3.40
-0.04
Hampden
574
58,293,400
15,424
14,162
-1,262
-8.2
-2.20
-0.02
Leeds
774
80,435,000
13,664
11,368
-2,296
-16.8
-2.97
-0.03
Lewiston
1
,225
131,985,400
23,094
17,344
-5,750
-24.9
-4.69
-0.04
Lodi
3
,273
450,341,300
43,533
21,766
-21,767
-50.0
-6.65
-0.05
Lowville
1,008
87,824,800
20,463
16,570
-3,893
-19.0
-3.86
-0.04
Marcellon
1,102
93,305,400
15,190
10,537
-4,653
-30.6
-4.22
-0.05
Newport
586
67,557,700
8,451
7,135
-1,316
-15.6
-2.25
-0.02
Otsego
693
65,929,300
13,952
12,112
-1,840
-13.2
-2.66
-0.03
Pacific
2
,707
244,807,000
24,909
12,455
-12,454
-50.0
-4.60
-0.05
Randolph
769
84,600,900
11,924
9,658
-2,266
-19.0
-2.95
-0.03
Scott
905
57,969,700
12,848
9,710
-3,138
-24.4
-3.47
-0.05
Springvale
520
65,882,400
7,712
6,676
-1,036
-13.4
-1.99
-0.02
West Point
1
,955
339,541,200
26,037
13,019
-13,018
-50.0
-6.66
-0.04
Wyocena
1
,666
181,775,700
24,085
13,450
-10,635
-44.2
-6.38
-0.06

8/7/2019 LFB Distribution of County and Municipal Aid
http://slidepdf.com/reader/full/lfb-distribution-of-county-and-municipal-aid 24/97
ATTACHMENT
Estimated 2012 County and Municipal Aid Program Reductio
n Under SB 27/AB 40
2
010
2010
2011
2012
Estimated Reduction
Census
Equalized
Aid
Estimated
% of 2011
Per
Per $1,000 of
Pop
ulation
Value
Payment
Aid Payment
Am
ount
Aid Payment
Capita
Equalized Value
COLUMBIA COUNTY (continued)
Villages
Arlington
819
$67,669,000
$34,780
$32,210
-$2,570
-7.4%
-$3.14
-$0.04
Cambria
767
48,636,700
224,450
222,196
-2,254
-1.0
-2.94
-0.05
Doylestown
297
14,429,500
50,351
50,013
-338
-0.7
-1.14
-0.02
Fall River
1
,712
123,038,800
91,255
80,024
-11,231
-12.3
-6.56
-0.09
Friesland
356
20,411,500
42,383
41,897
-486
-1.1
-1.37
-0.02
Pardeeville
2,115
137,375,000
260,574
246,836
-13,738
-5.3
-6.50
-0.10
Poynette
2
,528
158,978,100
276,530
260,542
-15,988
-5.8
-6.32
-0.10
Rio
1
,059
63,137,000
144,238
139,941
-4,297
-3.0
-4.06
-0.07
Wyocena
768
38,953,900
93,339
91,079
-2,260
-2.4
-2.94
-0.06
Cities Columbus *
4
,991
366,882,900
627,748
575,180
-52,568
-8.4
-10.53
-0.14
Lodi
3
,050
227,385,200
129,524
104,643
-24,881
-19.2
-8.16
-0.11
Portage
10
,324
606,703,500
1,694,042
1,602,235
-91,807
-5.4
-8.89
-0.15
Wisconsin Dells *
2
,678
449,896,900
104,814
59,215
-45,599
-43.5
-17.03
-0.10
County Government
56
,833
5,115,843,700
333,570
166,785
-166,785
-50.0
-2.93
-0.03
* This municipality is located in m
ore than one county. The amounts shown are for the entire municipality, as op
posed to the part of the municipality in this county.

8/7/2019 LFB Distribution of County and Municipal Aid
http://slidepdf.com/reader/full/lfb-distribution-of-county-and-municipal-aid 25/97
ATTACHMENT
Estimated 2012 County and Municipal Aid Program Reductio
n Under SB 27/AB 40
2
010
2010
2011
2012
Estimated Reduction
Census
Equalized
Aid
Estimated
% of 2011
Per
Per $1,000 of
Pop
ulation
Value
Payment
Aid Payment
Am
ount
Aid Payment
Capita
Equalized Value
CRAWFORD COUNTY
Towns
Bridgeport
990
$92,323,800
$14,345
$10,589
-$3,756
-26.2%
-$3.79
-$0.04
Clayton
958
69,397,500
40,993
37,476
-3,517
-8.6
-3.67
-0.05
Eastman
739
61,252,200
39,366
37,273
-2,093
-5.3
-2.83
-0.03
Freeman
686
91,530,400
31,650
29,847
-1,803
-5.7
-2.63
-0.02
Haney
309
22,923,000
44,701
44,335
-366
-0.8
-1.18
-0.02
Marietta
470
40,270,900
41,640
40,794
-846
-2.0
-1.80
-0.02
Prairie Du Chien
1
,073
60,535,400
58,777
54,365
-4,412
-7.5
-4.11
-0.07
Scott
462
34,882,900
38,155
37,337
-818
-2.1
-1.77
-0.02
Seneca
866
86,067,300
45,708
42,834
-2,874
-6.3
-3.32
-0.03
Utica
661
42,880,800
68,211
66,537
-1,674
-2.5
-2.53
-0.04
Wauzeka
422
25,554,200
46,957
46,275
-682
-1.5
-1.62
-0.03
Villages
Bell Center
117
6,022,700
28,694
28,642
-52
-0.2
-0.44
-0.01
Eastman
428
14,684,600
71,130
70,428
-702
-1.0
-1.64
-0.05
Ferryville
176
22,206,600
43,377
43,258
-119
-0.3
-0.68
-0.01
Gays Mills
491
21,124,900
217,137
216,213
-924
-0.4
-1.88
-0.04
Lynxville
132
9,925,400
36,690
36,623
-67
-0.2
-0.51
-0.01
Mount Sterling
211
6,948,100
46,619
46,448
-171
-0.4
-0.81
-0.02
Soldiers Grove
592
22,175,400
232,176
230,833
-1,343
-0.6
-2.27
-0.06
Steuben
131
5,586,300
35,747
35,681
-66
-0.2
-0.50
-0.01
Wauzeka
711
21,372,300
158,794
156,857
-1,937
-1.2
-2.72
-0.09
Cities Prairie Du Chien
5
,911
347,638,900
1,267,928
1,215,782
-52,146
-4.1
-8.82
-0.15
County Government
16
,644
1,109,595,000
995,511
849,451
-146,060
-14.7
-8.78
-0.13

8/7/2019 LFB Distribution of County and Municipal Aid
http://slidepdf.com/reader/full/lfb-distribution-of-county-and-municipal-aid 26/97

8/7/2019 LFB Distribution of County and Municipal Aid
http://slidepdf.com/reader/full/lfb-distribution-of-county-and-municipal-aid 27/97

8/7/2019 LFB Distribution of County and Municipal Aid
http://slidepdf.com/reader/full/lfb-distribution-of-county-and-municipal-aid 28/97
ATTACHMENT
Estimated 2012 County and Municipal Aid Program Reductio
n Under SB 27/AB 40
2
010
2010
2011
2012
Estimated Reduction
Census
Equalized
Aid
Estimated
% of 2011
Per
Per $1,000 of
Pop
ulation
Value
Payment
Aid Payment
Am
ount
Aid Payment
Capita
Equalized Value
DODGE COUNTY
Towns
Ashippun
2
,559
$254,821,800
$50,245
$25,123
-$25,122
-50.0%
-$9.82
-$0.10
Beaver Dam
3
,962
316,352,900
76,698
38,349
-38,349
-50.0
-9.68
-0.12
Burnett
904
70,874,000
28,553
25,422
-3,131
-11.0
-3.46
-0.04
Calamus
1
,048
82,733,800
35,668
31,460
-4,208
-11.8
-4.02
-0.05
Chester
687
47,864,700
16,383
14,575
-1,808
-11.0
-2.63
-0.04
Clyman
774
70,956,300
18,954
16,658
-2,296
-12.1
-2.97
-0.03
Elba
996
96,025,000
17,402
13,601
-3,801
-21.8
-3.82
-0.04
Emmet
1
,302
122,945,800
24,136
17,640
-6,496
-26.9
-4.99
-0.05
Fox Lake
2
,465
226,213,700
48,630
26,009
-22,621
-46.5
-9.18
-0.10
Herman
1
,108
101,094,900
29,803
25,099
-4,704
-15.8
-4.25
-0.05
Hubbard
1
,774
194,018,500
27,268
15,209
-12,059
-44.2
-6.80
-0.06
Hustisford
1
,373
152,302,000
25,671
18,448
-7,223
-28.1
-5.26
-0.05
Lebanon
1
,659
128,696,100
78,546
68,000
-10,546
-13.4
-6.36
-0.08
Leroy
1
,002
76,089,900
28,185
24,338
-3,847
-13.6
-3.84
-0.05
Lomira
1
,137
118,636,600
32,774
27,820
-4,954
-15.1
-4.36
-0.04
Lowell
1
,190
95,977,800
32,946
27,520
-5,426
-16.5
-4.56
-0.06
Oak Grove
1
,080
97,597,500
29,270
24,801
-4,469
-15.3
-4.14
-0.05
Portland
1
,079
95,362,100
28,864
24,403
-4,461
-15.5
-4.13
-0.05
Rubicon
2
,207
199,548,100
34,013
17,007
-17,006
-50.0
-7.71
-0.09
Shields
554
48,640,000
16,064
14,888
-1,176
-7.3
-2.12
-0.02
Theresa
1
,075
83,671,100
35,315
30,887
-4,428
-12.5
-4.12
-0.05
Trenton
1
,293
110,582,600
22,380
15,974
-6,406
-28.6
-4.95
-0.06
Westford
1
,228
146,068,900
22,042
16,264
-5,778
-26.2
-4.71
-0.04
Williamstown
755
76,654,400
14,448
12,264
-2,184
-15.1
-2.89
-0.03

8/7/2019 LFB Distribution of County and Municipal Aid
http://slidepdf.com/reader/full/lfb-distribution-of-county-and-municipal-aid 29/97
ATTACHMENT
Estimated 2012 County and Municipal Aid Program Reductio
n Under SB 27/AB 40
2
010
2010
2011
2012
Estimated Reduction
Census
Equalized
Aid
Estimated
% of 2011
Per
Per $1,000 of
Pop
ulation
Value
Payment
Aid Payment
Am
ount
Aid Payment
Capita
Equalized Value
DODGE COUNTY (continued)
Villages
Brownsville
581
$59,725,400
$24,345
$23,052
-$1,293
-5.3%
-$2.23
-$0.02
Clyman
422
20,955,000
104,789
104,107
-682
-0.7
-1.62
-0.03
Hustisford
1
,123
75,679,000
138,390
133,558
-4,832
-3.5
-4.30
-0.06
Iron Ridge
929
52,760,600
175,110
171,803
-3,307
-1.9
-3.56
-0.06
Kekoskee
161
10,099,600
27,399
27,300
-99
-0.4
-0.61
-0.01
Lomira
2
,430
150,385,100
216,816
201,777
-15,039
-6.9
-6.19
-0.10
Lowell
340
13,907,600
93,616
93,173
-443
-0.5
-1.30
-0.03
Neosho
574
40,112,800
73,251
71,989
-1,262
-1.7
-2.20
-0.03
Randolph *
1
,811
97,696,300
268,591
258,821
-9,770
-3.6
-5.39
-0.10
Reeseville
708
31,340,800
183,735
181,814
-1,921
-1.0
-2.71
-0.06
Theresa
1
,262
58,903,100
213,394
207,504
-5,890
-2.8
-4.67
-0.10
Cities Beaver Dam
16
,214
1,097,023,700
1,768,709
1,580,026
-188,683
-10.7
-11.64
-0.17
Fox Lake
1
,519
85,797,900
435,059
426,479
-8,580
-2.0
-5.65
-0.10
Horicon
3
,655
230,328,100
743,408
714,983
-28,425
-3.8
-7.78
-0.12
Juneau
2
,814
112,768,100
757,149
744,744
-12,405
-1.6
-4.41
-0.11
Mayville
5,154
340,243,100
830,490
779,454
-51,036
-6.1
-9.90
-0.15
Waupun *
11
,340
406,692,100
2,714,743
2,650,100
-64,643
-2.4
-5.70
-0.16
County Government
88
,759
6,182,736,200
3,157,592
2,378,684
-778,908
-24.7
-8.78
-0.13
* This municipality is located in m
ore than one county. The amounts shown are for the entire municipality, as op
posed to the part of the municipality in this county.

8/7/2019 LFB Distribution of County and Municipal Aid
http://slidepdf.com/reader/full/lfb-distribution-of-county-and-municipal-aid 30/97
ATTACHMENT
Estimated 2012 County and Municipal Aid Program Reductio
n Under SB 27/AB 40
2
010
2010
2011
2012
Estimated Reduction
Census
Equalized
Aid
Estimated
% of 2011
Per
Per $1,000 of
Pop
ulation
Value
Payment
Aid Payment
Am
ount
Aid Payment
Capita
Equalized Value
DOOR COUNTY
Towns
Baileys Harbor
1
,022
$481,796,000
$14,433
$10,431
-$4,002
-27.7%
-$3.92
-$0.01
Brussels
1
,136
73,335,100
38,064
33,119
-4,945
-13.0
-4.35
-0.07
Clay Banks
382
66,924,800
6,298
5,739
-559
-8.9
-1.46
-0.01
Egg Harbor
1
,342
545,189,300
18,194
11,293
-6,901
-37.9
-5.14
-0.01
Forestville
1,096
80,860,300
50,353
45,750
-4,603
-9.1
-4.20
-0.06
Gardner
1
,194
226,982,500
16,614
11,151
-5,463
-32.9
-4.58
-0.02
Gibraltar
1
,021
734,030,700
17,238
13,244
-3,994
-23.2
-3.91
-0.01
Jacksonport
705
287,759,100
12,053
10,149
-1,904
-15.8
-2.70
-0.01
Liberty Grove
1
,734
984,129,300
26,916
15,395
-11,521
-42.8
-6.64
-0.01
Nasewaupee
2
,061
354,247,900
30,047
15,024
-15,023
-50.0
-7.29
-0.04
Sevastopol
2
,628
741,768,500
44,815
22,408
-22,407
-50.0
-8.53
-0.03
Sturgeon Bay
818
187,308,300
15,748
13,184
-2,564
-16.3
-3.13
-0.01
Union
999
139,657,000
12,582
8,758
-3,824
-30.4
-3.83
-0.03
Washington
708
314,398,500
11,637
9,716
-1,921
-16.5
-2.71
-0.01
Villages
Egg Harbor
201
358,682,600
3,638
3,483
-155
-4.3
-0.77
0.00
Ephraim
288
371,334,100
4,298
3,980
-318
-7.4
-1.10
0.00
Forestville
430
20,921,700
62,305
61,597
-708
-1.1
-1.65
-0.03
Sister Bay
876
419,341,000
12,049
9,109
-2,940
-24.4
-3.36
-0.01
Cities Sturgeon Bay
9
,144
854,647,000
844,259
716,062
-128,197
-15.2
-14.02
-0.15
County Government
27
,785
7,243,313,700
44,367
22,184
-22,183
-50.0
-0.80
0.00

8/7/2019 LFB Distribution of County and Municipal Aid
http://slidepdf.com/reader/full/lfb-distribution-of-county-and-municipal-aid 31/97
ATTACHMENT
Estimated 2012 County and Municipal Aid Program Reductio
n Under SB 27/AB 40
2
010
2010
2011
2012
Estimated Reduction
Census
Equalized
Aid
Estimated
% of 2011
Per
Per $1,000 of
Pop
ulation
Value
Payment
Aid Payment
Am
ount
Aid Payment
Capita
Equalized Value
DOUGLAS COUNTY
Towns
Amnicon
1
,155
$70,486,000
$51,858
$46,746
-$5,112
-9.9%
-$4.43
-$0.07
Bennett
597
64,765,400
32,914
31,548
-1,366
-4.2
-2.29
-0.02
Brule
656
58,920,200
40,075
38,426
-1,649
-4.1
-2.51
-0.03
Cloverland
210
21,205,000
30,785
30,616
-169
-0.5
-0.80
-0.01
Dairyland
184
42,824,000
10,309
10,179
-130
-1.3
-0.71
0.00
Gordon
636
107,943,400
16,756
15,206
-1,550
-9.3
-2.44
-0.01
Hawthorne
1
,136
81,604,000
61,845
56,900
-4,945
-8.0
-4.35
-0.06
Highland
311
70,139,400
6,953
6,582
-371
-5.3
-1.19
-0.01
Lakeside
693
60,762,000
52,563
50,723
-1,840
-3.5
-2.66
-0.03
Maple
744
46,378,700
68,590
66,469
-2,121
-3.1
-2.85
-0.05
Oakland
1
,136
97,415,800
80,004
75,059
-4,945
-6.2
-4.35
-0.05
Parkland
1
,220
67,533,000
115,008
109,305
-5,703
-5.0
-4.67
-0.08
Solon Springs
910
109,579,400
22,570
19,397
-3,173
-14.1
-3.49
-0.03
Summit
1
,063
89,479,700
47,835
43,505
-4,330
-9.1
-4.07
-0.05
Superior
2
,166
169,496,900
85,428
68,478
-16,950
-19.8
-7.83
-0.10
Wascott
763
313,462,900
17,380
15,149
-2,231
-12.8
-2.92
-0.01
Villages
Lake Nebagamon
1
,069
154,130,600
20,116
15,737
-4,379
-21.8
-4.10
-0.03
Oliver
399
23,619,800
46,534
45,924
-610
-1.3
-1.53
-0.03
Poplar
603
39,864,200
42,765
41,372
-1,393
-3.3
-2.31
-0.03
Solon Springs
600
45,714,700
92,530
91,151
-1,379
-1.5
-2.30
-0.03
Superior
664
44,793,300
54,438
52,749
-1,689
-3.1
-2.54
-0.04
Cities Superior
27
,244
1,654,068,800
7,937,747
7,577,128
-360,619
-4.5
-13.24
-0.22
County Government
44
,159
3,434,187,200
2,525,300
2,137,781
-387,519
-15.3
-8.78
-0.11

8/7/2019 LFB Distribution of County and Municipal Aid
http://slidepdf.com/reader/full/lfb-distribution-of-county-and-municipal-aid 32/97

8/7/2019 LFB Distribution of County and Municipal Aid
http://slidepdf.com/reader/full/lfb-distribution-of-county-and-municipal-aid 33/97
ATTACHMENT
Estimated 2012 County and Municipal Aid Program Reductio
n Under SB 27/AB 40
2
010
2010
2011
2012
Estimated Reduction
Census
Equalized
Aid
Estimated
% of 2011
Per
Per $1,000 of
Pop
ulation
Value
Payment
Aid Payment
Am
ount
Aid Payment
Capita
Equalized Value
EAU CLAIRE COUNTY
Towns
Bridge Creek
1
,900
$119,455,600
$86,377
$74,431
-$11,946
-13.8%
-$6.29
-$0.10
Brunswick
1
,624
134,820,800
65,887
55,781
-10,106
-15.3
-6.22
-0.07
Clear Creek
821
52,253,000
38,341
35,758
-2,583
-6.7
-3.15
-0.05
Drammen
783
62,939,500
26,507
24,158
-2,349
-8.9
-3.00
-0.04
Fairchild
343
25,328,900
29,923
29,472
-451
-1.5
-1.31
-0.02
Lincoln
1
,096
79,084,500
53,919
49,316
-4,603
-8.5
-4.20
-0.06
Ludington
1
,063
75,185,000
42,219
37,889
-4,330
-10.3
-4.07
-0.06
Otter Creek
500
28,411,600
21,278
20,320
-958
-4.5
-1.92
-0.03
Pleasant Valley
3
,044
300,435,600
53,788
26,894
-26,894
-50.0
-8.84
-0.09
Seymour
3
,209
250,294,200
97,346
69,411
-27,935
-28.7
-8.71
-0.11
Union
2
,663
316,888,400
48,725
24,363
-24,362
-50.0
-9.15
-0.08
Washington
7
,182
626,819,300
130,784
65,392
-65,392
-50.0
-9.10
-0.10
Wilson
485
30,128,700
40,305
39,404
-901
-2.2
-1.86
-0.03
Villages
Fairchild
550
12,760,100
229,769
228,610
-1,159
-0.5
-2.11
-0.09
Fall Creek
1
,315
61,637,700
235,541
229,377
-6,164
-2.6
-4.69
-0.10
Cities Altoona
6
,706
383,350,000
1,194,896
1,137,393
-57,503
-4.8
-8.57
-0.15
Augusta
1
,550
64,074,000
518,971
512,564
-6,407
-1.2
-4.13
-0.10
Eau Claire *
65
,883
4,224,623,800
7,154,278
5,931,054
-1,223,224
-17.1
-18.57
-0.29
County Government
98
,736
6,686,311,700
2,932,686
2,066,224
-866,462
-29.5
-8.78
-0.13
* This municipality is located in m
ore than one county. The amounts shown are for the entire municipality, as op
posed to the part of the municipality in this county.

8/7/2019 LFB Distribution of County and Municipal Aid
http://slidepdf.com/reader/full/lfb-distribution-of-county-and-municipal-aid 34/97
ATTACHMENT
Estimated 2012 County and Municipal Aid Program Reductio
n Under SB 27/AB 40
2
010
2010
2011
2012
Estimated Reduction
Census
Equalized
Aid
Estimated
% of 2011
Per
Per $1,000 of
Pop
ulation
Value
Payment
Aid Payment
Am
ount
Aid Payment
Capita
Equalized Value
FLORENCE COUNTY
Towns
Aurora
1
,036
$62,511,600
$69,990
$65,877
-$4,113
-5.9%
-$3.97
-$0.07
Commonwealth
399
43,389,700
14,081
13,471
-610
-4.3
-1.53
-0.01
Fence
192
35,556,100
4,350
4,209
-141
-3.2
-0.73
0.00
Fern
159
47,757,500
5,635
5,538
-97
-1.7
-0.61
0.00
Florence
2
,002
290,237,500
63,119
47,761
-15,358
-24.3
-7.67
-0.05
Homestead
336
44,508,300
13,298
12,865
-433
-3.3
-1.29
-0.01
Long Lake
157
40,241,100
9,384
9,290
-94
-1.0
-0.60
0.00
Tipler
142
25,966,100
3,986
3,909
-77
-1.9
-0.54
0.00
County Government
4
,423
590,167,900
115,376
76,562
-38,814
-33.6
-8.78
-0.07

8/7/2019 LFB Distribution of County and Municipal Aid
http://slidepdf.com/reader/full/lfb-distribution-of-county-and-municipal-aid 35/97

8/7/2019 LFB Distribution of County and Municipal Aid
http://slidepdf.com/reader/full/lfb-distribution-of-county-and-municipal-aid 36/97
ATTACHMENT
Estimated 2012 County and Municipal Aid Program Reductio
n Under SB 27/AB 40
2
010
2010
2011
2012
Estimated Reduction
Census
Equalized
Aid
Estimated
% of 2011
Per
Per $1,000 of
Pop
ulation
Value
Payment
Aid Payment
Am
ount
Aid Payment
Capita
Equalized Value
FOREST COUNTY
Towns
Alvin
157
$40,013,400
$2,553
$2,459
-$94
-3.7%
-$0.60
$0.00
Argonne
512
39,474,700
33,161
32,157
-1,004
-3.0
-1.96
-0.03
Armstrong Creek
409
41,396,700
21,519
20,878
-641
-3.0
-1.57
-0.02
Blackwell
332
23,845,600
34,425
34,003
-422
-1.2
-1.27
-0.02
Caswell
91
11,844,000
18,943
18,911
-32
-0.2
-0.35
0.00
Crandon
650
56,876,200
34,707
33,088
-1,619
-4.7
-2.49
-0.03
Freedom
345
75,214,400
4,877
4,421
-456
-9.4
-1.32
-0.01
Hiles
311
149,544,700
9,424
9,053
-371
-3.9
-1.19
0.00
Laona
1
,212
102,358,000
99,237
93,608
-5,629
-5.7
-4.64
-0.05
Lincoln
955
191,990,500
21,671
18,176
-3,495
-16.1
-3.66
-0.02
Nashville
1,064
211,940,900
26,677
22,339
-4,338
-16.3
-4.08
-0.02
Popple River
44
14,611,000
615
608
-7
-1.1
-0.16
0.00
Ross
136
12,634,100
23,820
23,749
-71
-0.3
-0.52
-0.01
Wabeno
1
,166
76,358,300
99,846
94,637
-5,209
-5.2
-4.47
-0.07
Cities Crandon
1
,920
95,574,200
428,611
419,054
-9,557
-2.2
-4.98
-0.10
County Government
9
,304
1,143,676,700
160,946
80,473
-80,473
-50.0
-8.65
-0.07

8/7/2019 LFB Distribution of County and Municipal Aid
http://slidepdf.com/reader/full/lfb-distribution-of-county-and-municipal-aid 37/97

8/7/2019 LFB Distribution of County and Municipal Aid
http://slidepdf.com/reader/full/lfb-distribution-of-county-and-municipal-aid 38/97
ATTACHMENT
Estimated 2012 County and Municipal Aid Program Reductio
n Under SB 27/AB 40
2
010
2010
2011
2012
Estimated Reduction
Census
Equalized
Aid
Estimated
% of 2011
Per
Per $1,000 of
Pop
ulation
Value
Payment
Aid Payment
Am
ount
Aid Payment
Capita
Equalized Value
GRANT COUNTY (continued)
Villages
Bagley
379
$19,904,400
$80,613
$80,063
-
$550
-0.7%
-$1.45
-$0.03
Bloomington
735
28,730,900
203,632
201,562
-2,070
-1.0
-2.82
-0.07
Blue River
434
15,759,200
149,692
148,970
-722
-0.5
-1.66
-0.05
Cassville
947
42,505,800
175,716
172,280
-3,436
-2.0
-3.63
-0.08
Dickeyville
1,061
55,916,700
153,560
149,247
-4,313
-2.8
-4.07
-0.08
Hazel Green *
1,256
51,191,100
437,900
432,781
-5,119
-1.2
-4.08
-0.10
Livingston *
664
29,654,300
166,045
164,356
-1,689
-1.0
-2.54
-0.06
Montfort *
718
34,322,900
169,790
167,815
-1,975
-1.2
-2.75
-0.06
Mount Hope
225
6,936,900
47,510
47,316
-194
-0.4
-0.86
-0.03
Muscoda *
1
,299
63,891,300
430,105
423,716
-6,389
-1.5
-4.92
-0.10
Patch Grove
198
7,657,200
73,816
73,666
-150
-0.2
-0.76
-0.02
Potosi
688
33,937,700
206,315
204,501
-1,814
-0.9
-2.64
-0.05
Tennyson
355
14,790,600
65,075
64,592
-483
-0.7
-1.36
-0.03
Woodman
132
3,895,700
37,504
37,437
-67
-0.2
-0.51
-0.02
Cities Boscobel
3
,231
119,169,100
976,882
961,948
-14,934
-1.5
-4.62
-0.13
Cuba City *
2
,086
101,650,100
429,471
419,306
-10,165
-2.4
-4.87
-0.10
Fennimore
2
,497
102,606,300
712,366
702,105
-10,261
-1.4
-4.11
-0.10
Lancaster
3
,868
205,506,500
1,139,806
1,112,497
-27,309
-2.4
-7.06
-0.13
Platteville
11,224
564,873,800
2,559,111
2,471,090
-88,021
-3.4
-7.84
-0.16
County Government
51
,208
2,802,563,500
2,360,037
1,939,652
-420,385
-17.8
-8.21
-0.15
* This municipality is located in m
ore than one county. The amounts shown are for the entire municipality, as op
posed to the part of the municipality in this county.

8/7/2019 LFB Distribution of County and Municipal Aid
http://slidepdf.com/reader/full/lfb-distribution-of-county-and-municipal-aid 39/97
ATTACHMENT
Estimated 2012 County and Municipal Aid Program Reductio
n Under SB 27/AB 40
2
010
2010
2011
2012
Estimated Reduction
Census
Equalized
Aid
Estimated
% of 2011
Per
Per $1,000 of
Pop
ulation
Value
Payment
Aid Payment
Am
ount
Aid Payment
Capita
Equalized Value
GREEN COUNTY
Towns
Adams
530
$45,354,600
$13,918
$12,842
-$1,076
-7.7%
-$2.03
-$0.02
Albany
1
,106
95,183,300
11,574
6,887
-4,687
-40.5
-4.24
-0.05
Brooklyn
1
,083
122,404,000
15,196
10,702
-4,494
-29.6
-4.15
-0.04
Cadiz
815
61,731,200
33,865
31,320
-2,545
-7.5
-3.12
-0.04
Clarno
1
,166
83,362,900
28,581
23,372
-5,209
-18.2
-4.47
-0.06
Decatur
1,767
138,762,600
21,609
10,805
-10,804
-50.0
-6.11
-0.08
Exeter
2
,023
190,700,000
15,172
7,586
-7,586
-50.0
-3.75
-0.04
Jefferson
1
,217
81,812,700
34,642
28,967
-5,675
-16.4
-4.66
-0.07
Jordan
641
54,181,700
16,978
15,404
-1,574
-9.3
-2.46
-0.03
Monroe
1
,245
100,801,000
19,394
13,455
-5,939
-30.6
-4.77
-0.06
Mount Pleasant
598
53,744,000
16,414
15,044
-1,370
-8.3
-2.29
-0.03
New Glarus
1
,335
145,169,000
12,191
6,096
-6,095
-50.0
-4.57
-0.04
Spring Grove
874
77,385,700
13,057
10,130
-2,927
-22.4
-3.35
-0.04
Sylvester
1
,004
97,842,700
13,289
9,427
-3,862
-29.1
-3.85
-0.04
Washington
809
72,059,400
10,348
7,840
-2,508
-24.2
-3.10
-0.03
York
910
89,558,200
9,582
6,409
-3,173
-33.1
-3.49
-0.04
Villages
Albany
1
,018
51,775,600
253,626
249,655
-3,971
-1.6
-3.90
-0.08
Brooklyn *
1
,401
90,721,200
159,957
152,436
-7,521
-4.7
-5.37
-0.08
Browntown
280
11,518,500
82,272
81,972
-300
-0.4
-1.07
-0.03
Monticello
1
,217
70,193,300
268,086
262,411
-5,675
-2.1
-4.66
-0.08
New Glarus
2
,172
163,713,900
206,761
190,390
-16,371
-7.9
-7.54
-0.10
Cities Brodhead
3
,293
164,745,100
748,884
729,074
-19,810
-2.6
-6.02
-0.12
Monroe
10
,827
638,374,700
1,315,560
1,217,659
-97,901
-7.4
-9.04
-0.15
County Government
36
,842
2,667,455,700
422,384
211,192
-211,192
-50.0
-5.73
-0.08
* This municipality is located in m
ore than one county. The amounts shown are for the entire municipality, as op
posed to the part of the municipality in this county.

8/7/2019 LFB Distribution of County and Municipal Aid
http://slidepdf.com/reader/full/lfb-distribution-of-county-and-municipal-aid 40/97
ATTACHMENT
Estimated 2012 County and Municipal Aid Program Reductio
n Under SB 27/AB 40
2
010
2010
2011
2012
Estimated Reduction
Census
Equalized
Aid
Estimated
% of 2011
Per
Per $1,000 of
Pop
ulation
Value
Payment
Aid Payment
Am
ount
Aid Payment
Capita
Equalized Value
GREEN LAKE COUNTY
Towns
Berlin
1
,140
$100,887,800
$18,674
$13,694
-$4,980
-26.7%
-$4.37
-$0.05
Brooklyn
1
,826
565,261,800
34,421
21,645
-12,776
-37.1
-7.00
-0.02
Green Lake
1
,154
575,536,900
23,714
18,611
-5,103
-21.5
-4.42
-0.01
Kingston
1
,064
51,742,000
45,652
41,314
-4,338
-9.5
-4.08
-0.08
Mackford
560
46,546,600
18,565
17,363
-1,202
-6.5
-2.15
-0.03
Manchester
1
,022
56,598,300
38,667
34,665
-4,002
-10.3
-3.92
-0.07
Marquette
531
73,711,100
7,288
6,208
-1,080
-14.8
-2.03
-0.01
Princeton
1
,434
364,934,800
25,005
17,126
-7,879
-31.5
-5.49
-0.02
Saint Marie
351
34,932,300
13,588
13,116
-472
-3.5
-1.34
-0.01
Seneca
408
33,170,400
19,527
18,889
-638
-3.3
-1.56
-0.02
Villages
Kingston
326
16,520,200
65,521
65,114
-407
-0.6
-1.25
-0.02
Marquette
150
17,396,600
28,631
28,545
-86
-0.3
-0.57
0.00
Cities Berlin *
5
,524
241,241,700
1,718,794
1,682,608
-36,186
-2.1
-6.55
-0.15
Green Lake
960
249,649,700
28,367
24,836
-3,531
-12.4
-3.68
-0.01
Markesan
1,476
71,183,800
426,421
419,303
-7,118
-1.7
-4.82
-0.10
Princeton
1
,214
59,673,500
444,923
439,276
-5,647
-1.3
-4.65
-0.09
County Government
19
,051
2,548,055,700
93,615
46,808
-46,807
-50.0
-2.46
-0.02
* This municipality is located in m
ore than one county. The amounts shown are for the entire municipality, as op
posed to the part of the municipality in this county.

8/7/2019 LFB Distribution of County and Municipal Aid
http://slidepdf.com/reader/full/lfb-distribution-of-county-and-municipal-aid 41/97
ATTACHMENT
Estimated 2012 County and Municipal Aid Program Reductio
n Under SB 27/AB 40
2
010
2010
2011
2012
Estimated Reduction
Census
Equalized
Aid
Estimated
% of 2011
Per
Per $1,000 of
Pop
ulation
Value
Payment
Aid Payment
Am
ount
Aid Payment
Capita
Equalized Value
IOWA COUNTY
Towns
Arena
1
,456
$148,951,300
$34,077
$25,954
-$8,123
-23.8%
-$5.58
-$0.05
Brigham
1
,034
108,119,000
21,366
17,269
-4,097
-19.2
-3.96
-0.04
Clyde
306
38,920,200
10,810
10,451
-359
-3.3
-1.17
-0.01
Dodgeville
1,708
198,381,900
34,457
23,279
-11,178
-32.4
-6.54
-0.06
Eden
355
32,705,700
13,834
13,351
-483
-3.5
-1.36
-0.01
Highland
750
59,446,700
21,806
19,651
-2,155
-9.9
-2.87
-0.04
Linden
847
51,015,000
22,679
19,930
-2,749
-12.1
-3.25
-0.05
Mifflin
585
34,405,300
21,051
19,740
-1,311
-6.2
-2.24
-0.04
Mineral Point
1
,033
76,482,200
24,931
20,842
-4,089
-16.4
-3.96
-0.05
Moscow
576
52,802,400
16,330
15,059
-1,271
-7.8
-2.21
-0.02
Pulaski
400
34,423,200
13,041
12,428
-613
-4.7
-1.53
-0.02
Ridgeway
568
61,517,000
11,964
10,728
-1,236
-10.3
-2.18
-0.02
Waldwick
473
38,564,200
17,156
16,299
-857
-5.0
-1.81
-0.02
Wyoming
302
98,523,700
6,390
6,041
-349
-5.5
-1.16
0.00
Villages
Arena
834
44,443,800
102,359
99,694
-2,665
-2.6
-3.20
-0.06
Avoca
637
17,038,200
157,895
156,340
-1,555
-1.0
-2.44
-0.09
Barneveld
1
,231
88,318,400
68,834
63,027
-5,807
-8.4
-4.72
-0.07
Cobb
458
25,091,800
111,079
110,275
-804
-0.7
-1.76
-0.03
Highland
842
38,579,500
188,278
185,561
-2,717
-1.4
-3.23
-0.07
Hollandale
288
12,769,000
69,708
69,390
-318
-0.5
-1.10
-0.02
Linden
549
18,639,100
171,704
170,549
-1,155
-0.7
-2.10
-0.06
Rewey
292
6,940,600
63,113
62,786
-327
-0.5
-1.12
-0.05
Ridgeway
653
35,155,400
127,526
125,892
-1,634
-1.3
-2.50
-0.05
Cities Dodgeville
4,693
363,347,900
183,426
133,946
-49,480
-27.0
-10.54
-0.14
Mineral Point
2
,487
188,873,700
322,773
303,886
-18,887
-5.9
-7.59
-0.10
County Government
23
,687
1,892,822,400
155,808
77,904
-77,904
-50.0
-3.29
-0.04

8/7/2019 LFB Distribution of County and Municipal Aid
http://slidepdf.com/reader/full/lfb-distribution-of-county-and-municipal-aid 42/97
ATTACHMENT
Estimated 2012 County and Municipal Aid Program Reductio
n Under SB 27/AB 40
2
010
2010
2011
2012
Estimated Reduction
Census
Equalized
Aid
Estimated
% of 2011
Per
Per $1,000 of
Pop
ulation
Value
Payment
Aid Payment
Am
ount
Aid Payment
Capita
Equalized Value
IRON COUNTY
Towns
Anderson
58
$19,441,700
$11,642
$11,629
-$13
-0.1%
-$0.22
$0.00
Carey
163
20,186,200
15,429
15,327
-102
-0.7
-0.63
-0.01
Gurney
159
13,073,200
25,698
25,601
-97
-0.4
-0.61
-0.01
Kimball
498
43,578,000
72,411
71,461
-950
-1.3
-1.91
-0.02
Knight
211
23,569,100
29,797
29,626
-171
-0.6
-0.81
-0.01
Mercer
1,407
475,288,300
31,984
24,398
-7,586
-23.7
-5.39
-0.02
Oma
289
117,223,100
8,170
7,850
-320
-3.9
-1.11
0.00
Pence
163
17,528,200
44,234
44,132
-102
-0.2
-0.63
-0.01
Saxon
324
25,453,800
47,786
47,384
-402
-0.8
-1.24
-0.02
Sherman
290
127,184,700
8,711
8,389
-322
-3.7
-1.11
0.00
Cities Hurley
1
,547
61,161,300
633,478
627,362
-6,116
-1.0
-3.95
-0.10
Montreal
807
29,439,800
254,414
251,919
-2,495
-1.0
-3.09
-0.08
County Government
5
,916
973,127,400
113,135
61,219
-51,916
-45.9
-8.78
-0.05

8/7/2019 LFB Distribution of County and Municipal Aid
http://slidepdf.com/reader/full/lfb-distribution-of-county-and-municipal-aid 43/97

8/7/2019 LFB Distribution of County and Municipal Aid
http://slidepdf.com/reader/full/lfb-distribution-of-county-and-municipal-aid 44/97
ATTACHMENT
Estimated 2012 County and Municipal Aid Program Reductio
n Under SB 27/AB 40
2
010
2010
2011
2012
Estimated Reduction
Census
Equalized
Aid
Estimated
% of 2011
Per
Per $1,000 of
Pop
ulation
Value
Payment
Aid Payment
Am
ount
Aid Payment
Capita
Equalized Value
JEFFERSON COUNTY
Towns
Aztalan
1
,457
$131,089,700
$40,171
$32,037
-$8,134
-20.2%
-$5.58
-$0.06
Cold Spring
727
75,109,600
12,984
10,959
-2,025
-15.6
-2.79
-0.03
Concord
2
,072
178,091,600
45,234
28,784
-16,450
-36.4
-7.94
-0.09
Farmington
1
,380
127,445,000
29,890
22,593
-7,297
-24.4
-5.29
-0.06
Hebron
1
,094
100,647,900
20,486
15,900
-4,586
-22.4
-4.19
-0.05
Ixonia
4
,385
413,519,100
86,477
43,238
-43,239
-50.0
-9.86
-0.10
Jefferson
2
,178
190,147,800
73,321
55,144
-18,177
-24.8
-8.35
-0.10
Koshkonong
3
,692
369,051,200
54,631
27,316
-27,315
-50.0
-7.40
-0.07
Lake Mills
2,070
275,074,000
30,058
15,029
-15,029
-50.0
-7.26
-0.05
Milford
1
,099
104,248,300
18,325
13,697
-4,628
-25.3
-4.21
-0.04
Oakland
3
,100
343,284,500
51,291
25,645
-25,646
-50.0
-8.27
-0.07
Palmyra
1
,186
202,372,200
22,144
16,754
-5,390
-24.3
-4.54
-0.03
Sullivan
2,208
192,727,300
60,900
42,219
-18,681
-30.7
-8.46
-0.10
Sumner
832
120,251,700
13,956
11,304
-2,652
-19.0
-3.19
-0.02
Waterloo
909
86,952,200
14,395
11,229
-3,166
-22.0
-3.48
-0.04
Watertown
1
,975
194,026,800
64,731
49,785
-14,946
-23.1
-7.57
-0.08
Villages
Johnson Creek
2
,738
328,251,700
295,290
261,633
-33,657
-11.4
-12.29
-0.10
Palmyra
1
,781
127,080,200
222,496
210,342
-12,154
-5.5
-6.82
-0.10
Sullivan
669
48,324,100
50,237
48,522
-1,715
-3.4
-2.56
-0.04
Cities Fort Atkinson
12
,368
862,971,300
1,093,598
957,138
-136,460
-12.5
-11.03
-0.16
Jefferson
7
,973
504,511,400
721,564
645,887
-75,677
-10.5
-9.49
-0.15
Lake Mills
5,708
475,764,000
405,948
334,983
-70,965
-17.5
-12.43
-0.15
Waterloo
3
,333
202,107,600
421,351
397,594
-23,757
-5.6
-7.13
-0.12
Watertown *
23
,861
1,382,105,200
2,913,566
2,627,044
-286,522
-9.8
-12.01
-0.21
County Government
83
,686
6,663,739,200
1,569,685
835,295
-734,390
-46.8
-8.78
-0.11
* This municipality is located in m
ore than one county. The amounts shown are for the entire municipality, as op
posed to the part of the municipality in this county.

8/7/2019 LFB Distribution of County and Municipal Aid
http://slidepdf.com/reader/full/lfb-distribution-of-county-and-municipal-aid 45/97
ATTACHMENT
Estimated 2012 County and Municipal Aid Program Reductio
n Under SB 27/AB 40
2
010
2010
2011
2012
Estimated Reduction
Census
Equalized
Aid
Estimated
% of 2011
Per
Per $1,000 of
Pop
ulation
Value
Payment
Aid Payment
Am
ount
Aid Payment
Capita
Equalized Value
JUNEAU COUNTY
Towns
Armenia
699
$176,049,600
$16,920
$15,048
-$1,872
-11.1%
-$2.68
-$0.01
Clearfield
728
66,815,700
13,877
11,846
-2,031
-14.6
-2.79
-0.03
Cutler
326
32,708,600
14,658
14,251
-407
-2.8
-1.25
-0.01
Finley
97
18,547,000
10,160
10,124
-36
-0.4
-0.37
0.00
Fountain
555
35,529,300
58,270
57,090
-1,180
-2.0
-2.13
-0.03
Germantown
1
,471
374,034,300
11,852
5,926
-5,926
-50.0
-4.03
-0.02
Kildare
681
73,869,700
11,151
9,374
-1,777
-15.9
-2.61
-0.02
Kingston
91
3,987,300
1,102
1,070
-32
-2.9
-0.35
-0.01
Lemonweir
1
,743
122,470,000
99,117
87,476
-11,641
-11.7
-6.68
-0.10
Lindina
718
51,081,900
45,219
43,244
-1,975
-4.4
-2.75
-0.04
Lisbon
912
65,815,500
34,910
31,723
-3,187
-9.1
-3.49
-0.05
Lyndon
1
,384
116,300,100
17,104
9,764
-7,340
-42.9
-5.30
-0.06
Marion
426
54,563,500
13,185
12,490
-695
-5.3
-1.63
-0.01
Necedah
2,327
202,049,800
59,106
38,901
-20,205
-34.2
-8.68
-0.10
Orange
570
38,112,500
44,059
42,814
-1,245
-2.8
-2.18
-0.03
Plymouth
597
57,920,600
55,168
53,802
-1,366
-2.5
-2.29
-0.02
Seven Mile Creek
358
33,259,000
20,986
20,495
-491
-2.3
-1.37
-0.01
Summit
646
50,784,900
64,310
62,711
-1,599
-2.5
-2.48
-0.03
Wonewoc
687
44,988,000
87,027
85,219
-1,808
-2.1
-2.63
-0.04
Villages
Camp Douglas
601
19,087,100
171,064
169,680
-1,384
-0.8
-2.30
-0.07
Hustler
194
9,391,500
49,471
49,327
-144
-0.3
-0.74
-0.02
Lyndon Station
500
25,411,100
134,806
133,848
-958
-0.7
-1.92
-0.04
Necedah
916
46,253,800
211,978
208,763
-3,215
-1.5
-3.51
-0.07
Union Center
200
12,319,000
63,478
63,325
-153
-0.2
-0.77
-0.01
Wonewoc
816
23,713,600
256,829
254,458
-2,371
-0.9
-2.91
-0.10
Cities Elroy
1
,442
55,985,600
577,102
571,503
-5,599
-1.0
-3.88
-0.10
Mauston
4
,423
218,428,900
1,042,648
1,009,942
-32,706
-3.1
-7.39
-0.15
New Lisbon
2
,554
70,099,600
575,216
568,030
-7,186
-1.2
-2.81
-0.10
County Government
26
,664
2,100,086,100
1,173,974
939,983
-233,991
-19.9
-8.78
-0.11

8/7/2019 LFB Distribution of County and Municipal Aid
http://slidepdf.com/reader/full/lfb-distribution-of-county-and-municipal-aid 46/97
ATTACHMENT
Estimated 2012 County and Municipal Aid Program Reductio
n Under SB 27/AB 40
2
010
2010
2011
2012
Estimated Reduction
Census
Equalized
Aid
Estimated
% of 2011
Per
Per $1,000 of
Pop
ulation
Value
Payment
Aid Payment
Am
ount
Aid Payment
Capita
Equalized Value
KENOSHA COUNTY
Towns
Brighton
1
,456
$196,333,700
$23,462
$15,339
-$8,123
-34.6%
-$5.58
-$0.04
Paris
1
,504
224,276,500
20,254
11,586
-8,668
-42.8
-5.76
-0.04
Randall
3
,180
524,557,500
45,369
22,684
-22,685
-50.0
-7.13
-0.04
Salem
12
,067
1,150,464,800
148,556
74,278
-74,278
-50.0
-6.16
-0.06
Somers
9
,597
854,366,100
162,728
81,364
-81,364
-50.0
-8.48
-0.10
Wheatland
3
,373
327,657,300
58,705
29,352
-29,353
-50.0
-8.70
-0.09
Villages
Bristol
4
,914
594,389,300
77,055
38,528
-38,527
-50.0
-7.84
-0.06
Paddock Lake
2
,992
246,490,100
82,592
56,063
-26,529
-32.1
-8.87
-0.11
Pleasant Prairie
19
,719
2,651,068,300
229,103
114,552
-114,551
-50.0
-5.81
-0.04
Silver Lake
2
,411
193,747,700
79,033
59,658
-19,375
-24.5
-8.04
-0.10
Twin Lakes
5
,989
863,408,200
85,554
42,777
-42,777
-50.0
-7.14
-0.05
Cities Kenosha
99
,218
6,405,482,800
13,247,692
11,326,047
-1,921,645
-14.5
-19.37
-0.30
County Government
166
,426
14,232,681,100
1,864,121
932,061
-932,060
-50.0
-5.60
-0.07

8/7/2019 LFB Distribution of County and Municipal Aid
http://slidepdf.com/reader/full/lfb-distribution-of-county-and-municipal-aid 47/97
ATTACHMENT
Estimated 2012 County and Municipal Aid Program Reductio
n Under SB 27/AB 40
2
010
2010
2011
2012
Estimated Reduction
Census
Equalized
Aid
Estimated
% of 2011
Per
Per $1,000 of
Pop
ulation
Value
Payment
Aid Payment
Am
ount
Aid Payment
Capita
Equalized Value
KEWAUNEE COUNTY
Towns
Ahnapee
940
$81,034,000
$47,266
$43,880
-$3,386
-7.2%
-$3.60
-$0.04
Carlton
1
,014
79,361,200
21,605
17,665
-3,940
-18.2
-3.89
-0.05
Casco
1
,165
86,140,700
59,298
54,097
-5,201
-8.8
-4.46
-0.06
Franklin
993
85,046,600
30,601
26,823
-3,778
-12.3
-3.80
-0.04
Lincoln
948
70,415,500
64,663
61,219
-3,444
-5.3
-3.63
-0.05
Luxemburg
1
,469
118,004,800
49,419
41,150
-8,269
-16.7
-5.63
-0.07
Montpelier
1
,306
98,292,700
44,296
37,760
-6,536
-14.8
-5.00
-0.07
Pierce
833
76,735,500
19,091
16,432
-2,659
-13.9
-3.19
-0.03
Red River
1
,393
135,890,300
50,202
42,767
-7,435
-14.8
-5.34
-0.05
West Kewaunee
1
,296
92,234,200
46,125
39,689
-6,436
-14.0
-4.97
-0.07
Villages
Casco
583
29,115,800
78,257
76,955
-1,302
-1.7
-2.23
-0.04
Luxemburg
2
,515
158,196,500
93,750
77,882
-15,868
-16.9
-6.31
-0.10
Cities Algoma
3
,167
179,844,400
961,089
940,407
-20,682
-2.2
-6.53
-0.11
Kewaunee
2
,952
175,737,400
564,126
544,848
-19,278
-3.4
-6.53
-0.11
County Government
20
,574
1,466,049,600
824,734
644,186
-180,548
-21.9
-8.78
-0.12

8/7/2019 LFB Distribution of County and Municipal Aid
http://slidepdf.com/reader/full/lfb-distribution-of-county-and-municipal-aid 48/97
ATTACHMENT
Estimated 2012 County and Municipal Aid Program Reductio
n Under SB 27/AB 40
2
010
2010
2011
2012
Estimated Reduction
Census
Equalized
Aid
Estimated
% of 2011
Per
Per $1,000 of
Pop
ulation
Value
Payment
Aid Payment
Am
ount
Aid Payment
Capita
Equalized Value
LA CROSSE COUNTY
Towns
Bangor
615
$49,726,700
$36,245
$34,796
-$1,449
-4.0%
-$2.36
-$0.03
Barre
1
,234
96,041,600
48,368
42,533
-5,835
-12.1
-4.73
-0.06
Burns
947
77,210,900
59,878
56,442
-3,436
-5.7
-3.63
-0.04
Campbell
4
,314
298,705,900
351,145
311,279
-39,866
-11.4
-9.24
-0.13
Farmington
2
,061
158,304,900
79,354
63,524
-15,830
-19.9
-7.68
-0.10
Greenfield
2
,060
149,385,000
69,106
54,167
-14,939
-21.6
-7.25
-0.10
Hamilton
2,436
208,313,900
37,111
18,556
-18,555
-50.0
-7.62
-0.09
Holland
3
,701
276,306,200
74,812
41,504
-33,308
-44.5
-9.00
-0.12
Medary
1
,461
133,347,000
35,038
26,859
-8,179
-23.3
-5.60
-0.06
Onalaska
5
,623
438,011,400
203,388
137,686
-65,702
-32.3
-11.68
-0.15
Shelby
4
,715
387,371,900
179,416
127,340
-52,076
-29.0
-11.04
-0.13
Washington
558
43,795,200
27,769
26,576
-1,193
-4.3
-2.14
-0.03
Villages
Bangor
1
,459
65,157,500
123,951
117,435
-6,516
-5.3
-4.47
-0.10
Holmen
9
,005
490,545,800
551,668
478,086
-73,582
-13.3
-8.17
-0.15
Rockland
594
24,910,400
132,175
130,823
-1,352
-1.0
-2.28
-0.05
West Salem
4
,799
307,895,200
432,021
387,140
-44,881
-10.4
-9.35
-0.15
Cities La Crosse
51
,320
3,125,836,800
9,816,086
9,023,811
-792,275
-8.1
-15.44
-0.25
Onalaska
17
,736
1,604,589,600
603,313
329,766
-273,547
-45.3
-15.42
-0.17
County Government
114
,638
7,935,455,900
4,525,614
3,519,604
-1,006,010
-22.2
-8.78
-0.13

8/7/2019 LFB Distribution of County and Municipal Aid
http://slidepdf.com/reader/full/lfb-distribution-of-county-and-municipal-aid 49/97
ATTACHMENT
Estimated 2012 County and Municipal Aid Program Reductio
n Under SB 27/AB 40
2
010
2010
2011
2012
Estimated Reduction
Census
Equalized
Aid
Estimated
% of 2011
Per
Per $1,000 of
Pop
ulation
Value
Payment
Aid Payment
Am
ount
Aid Payment
Capita
Equalized Value
LAFAYETTE COUNTY
Towns
Argyle
436
$43,030,100
$15,890
$15,162
-
$728
-4.6%
-$1.67
-$0.02
Belmont
767
49,804,900
36,058
33,804
-2,254
-6.3
-2.94
-0.05
Benton
504
35,152,700
21,729
20,756
-973
-4.5
-1.93
-0.03
Blanchard
264
25,682,500
14,924
14,657
-267
-1.8
-1.01
-0.01
Darlington
875
73,361,600
17,561
14,627
-2,934
-16.7
-3.35
-0.04
Elk Grove
551
33,923,300
19,551
18,388
-1,163
-5.9
-2.11
-0.03
Fayette
376
28,951,400
21,941
21,399
-542
-2.5
-1.44
-0.02
Gratiot
550
43,284,300
23,018
21,859
-1,159
-5.0
-2.11
-0.03
Kendall
454
32,590,200
16,524
15,734
-790
-4.8
-1.74
-0.02
Lamont
314
18,763,400
18,704
18,326
-378
-2.0
-1.20
-0.02
Monticello
133
11,509,500
18,709
18,641
-68
-0.4
-0.51
-0.01
New Diggings
502
29,076,100
41,738
40,772
-966
-2.3
-1.92
-0.03
Seymour
446
33,130,000
17,353
16,591
-762
-4.4
-1.71
-0.02
Shullsburg
354
36,802,600
15,518
15,038
-480
-3.1
-1.36
-0.01
Wayne
490
32,984,200
19,994
19,074
-920
-4.6
-1.88
-0.03
White Oak Springs
118
9,243,400
20,012
19,959
-53
-0.3
-0.45
-0.01
Willow Springs
758
62,544,900
24,032
21,830
-2,202
-9.2
-2.91
-0.04
Wiota
856
63,456,300
27,661
24,853
-2,808
-10.2
-3.28
-0.04
Villages
Argyle
857
35,489,100
203,462
200,648
-2,814
-1.4
-3.28
-0.08
Belmont
986
59,558,600
204,509
200,784
-3,725
-1.8
-3.78
-0.06
Benton
973
38,206,200
283,782
280,154
-3,628
-1.3
-3.73
-0.09
Blanchardville *
825
39,481,900
258,724
256,116
-2,608
-1.0
-3.16
-0.07
Gratiot
236
8,433,200
94,831
94,618
-213
-0.2
-0.90
-0.03
South Wayne
489
17,962,900
168,791
167,875
-916
-0.5
-1.87
-0.05
Cities Darlington
2
,451
104,912,900
643,775
633,284
-10,491
-1.6
-4.28
-0.10
Shullsburg
1
,226
51,826,000
521,135
515,952
-5,183
-1.0
-4.23
-0.10
County Government
16
,836
1,024,444,000
1,788,346
1,640,601
-147,745
-8.3
-8.78
-0.14
* This municipality is located in m
ore than one county. The amounts shown are for the entire municipality, as op
posed to the part of the municipality in this county.

8/7/2019 LFB Distribution of County and Municipal Aid
http://slidepdf.com/reader/full/lfb-distribution-of-county-and-municipal-aid 50/97
ATTACHMENT
Estimated 2012 County and Municipal Aid Program Reductio
n Under SB 27/AB 40
2
010
2010
2011
2012
Estimated Reduction
Census
Equalized
Aid
Estimated
% of 2011
Per
Per $1,000 of
Pop
ulation
Value
Payment
Aid Payment
Am
ount
Aid Payment
Capita
Equalized Value
LANGLADE COUNTY
Towns
Ackley
524
$38,453,000
$25,323
$24,271
-$1,052
-4.2%
-$2.01
-$0.03
Ainsworth
469
85,214,500
14,251
13,408
-843
-5.9
-1.80
-0.01
Antigo
1
,412
91,390,400
31,179
23,539
-7,640
-24.5
-5.41
-0.08
Elcho
1
,233
270,253,500
29,790
23,965
-5,825
-19.6
-4.72
-0.02
Evergreen
495
33,910,600
28,546
27,607
-939
-3.3
-1.90
-0.03
Langlade
473
63,012,600
7,869
7,012
-857
-10.9
-1.81
-0.01
Neva
902
71,519,900
29,626
26,508
-3,118
-10.5
-3.46
-0.04
Norwood
913
67,617,100
40,752
37,558
-3,194
-7.8
-3.50
-0.05
Parrish
91
14,363,700
1,535
1,503
-32
-2.1
-0.35
0.00
Peck
349
30,089,400
28,267
27,800
-467
-1.7
-1.34
-0.02
Polar
984
74,800,100
31,826
28,116
-3,710
-11.7
-3.77
-0.05
Price
228
19,925,400
14,918
14,719
-199
-1.3
-0.87
-0.01
Rolling
1
,504
102,238,700
54,026
45,358
-8,668
-16.0
-5.76
-0.08
Summit
163
22,432,200
6,941
6,839
-102
-1.5
-0.63
0.00
Upham
676
195,589,000
10,210
8,459
-1,751
-17.1
-2.59
-0.01
Vilas
233
27,526,500
7,112
6,904
-208
-2.9
-0.89
-0.01
Wolf River
731
121,250,200
23,185
21,137
-2,048
-8.8
-2.80
-0.02
Villages
White Lake
363
15,991,700
107,868
107,363
-505
-0.5
-1.39
-0.03
Cities Antigo
8
,234
373,132,300
2,856,121
2,800,151
-55,970
-2.0
-6.80
-0.15
County Government
19
,977
1,718,710,800
869,036
693,727
-175,309
-20.2
-8.78
-0.10

8/7/2019 LFB Distribution of County and Municipal Aid
http://slidepdf.com/reader/full/lfb-distribution-of-county-and-municipal-aid 51/97
ATTACHMENT
Estimated 2012 County and Municipal Aid Program Reductio
n Under SB 27/AB 40
2
010
2010
2011
2012
Estimated Reduction
Census
Equalized
Aid
Estimated
% of 2011
Per
Per $1,000 of
Pop
ulation
Value
Payment
Aid Payment
Am
ount
Aid Payment
Capita
Equalized Value
LINCOLN COUNTY
Towns
Birch
594
$36,656,400
$34,026
$32,674
-$1,352
-4.0%
-$2.28
-$0.04
Bradley
2
,408
464,886,400
53,043
30,825
-22,218
-41.9
-9.23
-0.05
Corning
883
71,324,200
33,488
30,500
-2,988
-8.9
-3.38
-0.04
Harding
372
44,582,100
8,815
8,285
-530
-6.0
-1.42
-0.01
Harrison
833
166,917,000
20,747
18,088
-2,659
-12.8
-3.19
-0.02
King
855
175,633,400
12,655
9,854
-2,801
-22.1
-3.28
-0.02
Merrill
2,980
178,986,600
98,929
79,203
-19,726
-19.9
-6.62
-0.11
Pine River
1
,869
132,669,600
88,184
74,917
-13,267
-15.0
-7.10
-0.10
Rock Falls
618
80,053,500
8,669
7,206
-1,463
-16.9
-2.37
-0.02
Russell
677
43,255,600
48,290
46,534
-1,756
-3.6
-2.59
-0.04
Schley
934
64,109,200
30,455
27,112
-3,343
-11.0
-3.58
-0.05
Scott
1
,432
99,433,700
53,996
46,138
-7,858
-14.6
-5.49
-0.08
Skanawan
391
53,779,400
6,293
5,707
-586
-9.3
-1.50
-0.01
Somo
114
19,224,800
14,144
14,094
-50
-0.4
-0.44
0.00
Tomahawk
416
71,274,800
8,561
7,898
-663
-7.7
-1.59
-0.01
Wilson
309
64,655,000
4,561
4,195
-366
-8.0
-1.18
-0.01
Cities Merrill
9,661
390,935,400
3,104,122
3,045,482
-58,640
-1.9
-6.07
-0.15
Tomahawk
3
,397
222,219,900
639,827
613,713
-26,114
-4.1
-7.69
-0.12
County Government
28
,743
2,380,597,000
1,210,748
958,513
-252,235
-20.8
-8.78
-0.11

8/7/2019 LFB Distribution of County and Municipal Aid
http://slidepdf.com/reader/full/lfb-distribution-of-county-and-municipal-aid 52/97

8/7/2019 LFB Distribution of County and Municipal Aid
http://slidepdf.com/reader/full/lfb-distribution-of-county-and-municipal-aid 53/97

8/7/2019 LFB Distribution of County and Municipal Aid
http://slidepdf.com/reader/full/lfb-distribution-of-county-and-municipal-aid 54/97
ATTACHMENT
Estimated 2012 County and Municipal Aid Program Reductio
n Under SB 27/AB 40
2
010
2010
2011
2012
Estimated Reduction
Census
Equalized
Aid
Estimated
% of 2011
Per
Per $1,000 of
Pop
ulation
Value
Payment
Aid Payment
Am
ount
Aid Payment
Capita
Equalized Value
MARATHON COUNTY (continued)
Villages
Athens
1
,105
$51,152,900
$
275,002
$270,323
-$4,679
-1.7%
-$4.23
-$0.09
Brokaw
251
35,165,200
16,262
16,021
-241
-1.5
-0.96
-0.01
Edgar
1
,479
65,737,400
333,304
326,730
-6,574
-2.0
-4.44
-0.10
Elderon
179
6,768,300
37,587
37,464
-123
-0.3
-0.69
-0.02
Fenwood
152
5,483,900
59,063
58,974
-89
-0.2
-0.59
-0.02
Hatley
574
30,883,900
23,741
22,479
-1,262
-5.3
-2.20
-0.04
Kronenwetter
7
,210
485,478,300
316,901
244,079
-72,822
-23.0
-10.10
-0.15
Marathon
1
,524
118,681,600
111,105
102,205
-8,900
-8.0
-5.84
-0.07
Rothschild
5
,269
416,594,900
265,142
204,848
-60,294
-22.7
-11.44
-0.14
Spencer
1
,925
93,853,600
526,409
517,024
-9,385
-1.8
-4.88
-0.10
Stratford
1
,578
90,393,200
387,221
378,182
-9,039
-2.3
-5.73
-0.10
Unity *
343
12,954,500
86,182
85,731
-451
-0.5
-1.31
-0.03
Weston
14
,868
1,017,654,200
1,222,299
1,052,318
-169,981
-13.9
-11.43
-0.17
Cities
Mosinee
3
,988
286,549,200
538,248
502,014
-36,234
-6.7
-9.09
-0.13
Schofield
2
,169
193,559,300
190,717
172,690
-18,027
-9.5
-8.31
-0.09
Wausau
39
,106
2,681,223,200
4,619,273
3,948,967
-670,306
-14.5
-17.14
-0.25
County Government
134
,063
9,844,078,200
5,056,841
3,880,366
-1,176,475
-23.3
-8.78
-0.12
* This municipality is located in m
ore than one county. The amounts shown are for the entire municipality, as op
posed to the part of the municipality in this county.

8/7/2019 LFB Distribution of County and Municipal Aid
http://slidepdf.com/reader/full/lfb-distribution-of-county-and-municipal-aid 55/97
ATTACHMENT
Estimated 2012 County and Municipal Aid Program Reductio
n Under SB 27/AB 40
2
010
2010
2011
2012
Estimated Reduction
Census
Equalized
Aid
Estimated
% of 2011
Per
Per $1,000 of
Pop
ulation
Value
Payment
Aid Payment
Am
ount
Aid Payment
Capita
Equalized Value
MARINETTE COUNTY
Towns
Amberg
726
$100,311,100
$33,932
$31,912
-$2,020
-6.0%
-$2.78
-$0.02
Athelstane
504
133,891,300
14,697
13,724
-973
-6.6
-1.93
-0.01
Beaver
1
,146
130,299,300
36,123
31,091
-5,032
-13.9
-4.39
-0.04
Beecher
724
105,925,400
15,547
13,538
-2,009
-12.9
-2.77
-0.02
Dunbar
1
,094
91,025,500
28,563
23,977
-4,586
-16.1
-4.19
-0.05
Goodman
619
82,004,600
33,029
31,561
-1,468
-4.4
-2.37
-0.02
Grover
1
,768
121,048,200
81,257
69,280
-11,977
-14.7
-6.77
-0.10
Lake
1
,135
160,492,900
32,551
27,615
-4,936
-15.2
-4.35
-0.03
Middle Inlet
840
118,867,400
13,724
11,020
-2,704
-19.7
-3.22
-0.02
Niagara
853
82,201,300
32,772
29,984
-2,788
-8.5
-3.27
-0.03
Pembine
889
95,174,200
24,295
21,267
-3,028
-12.5
-3.41
-0.03
Peshtigo
4
,057
306,656,000
114,321
75,587
-38,734
-33.9
-9.55
-0.13
Porterfield
1
,971
168,053,900
51,381
36,495
-14,886
-29.0
-7.55
-0.09
Pound
1
,425
95,920,200
74,873
67,092
-7,781
-10.4
-5.46
-0.08
Silver Cliff
491
123,225,000
10,259
9,335
-924
-9.0
-1.88
-0.01
Stephenson
3
,006
533,546,100
51,305
25,653
-25,652
-50.0
-8.53
-0.05
Wagner
681
107,516,900
14,447
12,670
-1,777
-12.3
-2.61
-0.02
Wausaukee
1
,066
196,601,200
29,927
25,573
-4,354
-14.5
-4.08
-0.02
Villages
Coleman
724
43,647,500
172,338
170,329
-2,009
-1.2
-2.77
-0.05
Crivitz
984
79,935,400
177,695
173,985
-3,710
-2.1
-3.77
-0.05
Pound
377
13,255,100
153,332
152,787
-545
-0.4
-1.45
-0.04
Wausaukee
575
25,034,800
131,460
130,193
-1,267
-1.0
-2.20
-0.05
Cities Marinette
10
,968
597,053,400
4,601,295
4,509,194
-92,101
-2.0
-8.40
-0.15
Niagara
1
,624
73,937,600
613,145
605,751
-7,394
-1.2
-4.55
-0.10
Peshtigo
3
,502
172,442,900
1,184,592
1,162,866
-21,726
-1.8
-6.20
-0.13
County Government
41
,749
3,758,067,200
1,323,397
957,027
-366,370
-27.7
-8.78
-0.10

8/7/2019 LFB Distribution of County and Municipal Aid
http://slidepdf.com/reader/full/lfb-distribution-of-county-and-municipal-aid 56/97
ATTACHMENT
Estimated 2012 County and Municipal Aid Program Reductio
n Under SB 27/AB 40
2
010
2010
2011
2012
Estimated Reduction
Census
Equalized
Aid
Estimated
% of 2011
Per
Per $1,000 of
Pop
ulation
Value
Payment
Aid Payment
Am
ount
Aid Payment
Capita
Equalized Value
MARQUETTE COUNTY
Towns
Buffalo
1
,221
$104,570,200
$15,729
$10,016
-$5,713
-36.3%
-$4.68
-$0.05
Crystal Lake
484
119,905,700
7,285
6,387
-898
-12.3
-1.86
-0.01
Douglas
725
72,062,600
14,114
12,100
-2,014
-14.3
-2.78
-0.03
Harris
790
70,187,900
16,189
13,798
-2,391
-14.8
-3.03
-0.03
Mecan
686
117,593,700
9,908
8,105
-1,803
-18.2
-2.63
-0.02
Montello
1
,033
142,647,400
18,462
14,373
-4,089
-22.1
-3.96
-0.03
Moundville
552
41,457,800
21,881
20,713
-1,168
-5.3
-2.12
-0.03
Neshkoro
561
97,964,700
10,106
8,900
-1,206
-11.9
-2.15
-0.01
Newton
547
66,776,400
8,379
7,233
-1,146
-13.7
-2.10
-0.02
Oxford
885
109,584,100
14,015
11,014
-3,001
-21.4
-3.39
-0.03
Packwaukee
1
,416
170,937,600
22,410
14,727
-7,683
-34.3
-5.43
-0.04
Shields
550
61,082,100
12,457
11,298
-1,159
-9.3
-2.11
-0.02
Springfield
830
127,305,300
9,527
6,887
-2,640
-27.7
-3.18
-0.02
Westfield
866
96,618,900
10,496
7,622
-2,874
-27.4
-3.32
-0.03
Villages
Endeavor
468
21,445,400
93,079
92,240
-839
-0.9
-1.79
-0.04
Neshkoro
434
23,721,800
89,528
88,806
-722
-0.8
-1.66
-0.03
Oxford
607
26,056,300
132,192
130,780
-1,412
-1.1
-2.33
-0.05
Westfield
1
,254
59,161,400
253,512
247,596
-5,916
-2.3
-4.72
-0.10
Cities Montello
1
,495
90,401,900
163,720
155,156
-8,564
-5.2
-5.73
-0.09
County Government
15
,404
1,619,481,200
82,976
41,488
-41,488
-50.0
-2.69
-0.03

8/7/2019 LFB Distribution of County and Municipal Aid
http://slidepdf.com/reader/full/lfb-distribution-of-county-and-municipal-aid 57/97
ATTACHMENT
Estimated 2012 County and Municipal Aid Program Reductio
n Under SB 27/AB 40
2
010
2010
2011
2012
Estimated Reduction
Census
Equalized
Aid
Estimated
% of 2011
Per
Per $1,000 of
Pop
ulation
Value
Payment
Aid Payment
Am
ount
Aid Payment
Capita
Equalized Value
MENOMINEE COUNTY
Towns
Menominee
4,232
$317,620,600
$
227,531
$186,407
-$41,124
-18.1%
-$9.72
-$0.13
County Government
4
,232
317,620,600
471,716
434,578
-37,138
-7.9
-8.78
-0.12

8/7/2019 LFB Distribution of County and Municipal Aid
http://slidepdf.com/reader/full/lfb-distribution-of-county-and-municipal-aid 58/97
ATTACHMENT
Estimated 2012 County and Municipal Aid Program Reductio
n Under SB 27/AB 40
2
010
2010
2011
2012
Estimated Reduction
Census
Equalized
Aid
Estimated
% of 2011
Per
Per $1,000 of
Pop
ulation
Value
Payment
Aid Payment
Am
ount
Aid Payment
Capita
Equalized Value
MILWAUKEE COUNTY
Villages
Bayside *
4
,389
$640,167,900
$80,399
$40,200
-$40,199
-50.0%
-$9.16
-$0.06
Brown Deer
11
,999
1,074,804,200
238,607
119,304
-119,303
-50.0
-9.94
-0.11
Fox Point
6
,701
1,062,262,800
119,958
59,979
-59,979
-50.0
-8.95
-0.06
Greendale
14
,046
1,310,875,900
324,129
162,064
-162,065
-50.0
-11.54
-0.12
Hales Corners
7
,692
662,412,100
139,528
69,764
-69,764
-50.0
-9.07
-0.11
River Hills
1,597
512,856,400
27,491
17,718
-9,773
-35.5
-6.12
-0.02
Shorewood
13
,162
1,437,686,900
312,329
156,165
-156,164
-50.0
-11.86
-0.11
West Milwaukee
4
,206
347,167,400
779,108
735,226
-43,882
-5.6
-10.43
-0.13
Whitefish Bay
14
,110
1,991,308,800
234,768
117,384
-117,384
-50.0
-8.32
-0.06
Cities Cudahy
18
,267
1,221,146,100
3,610,472
3,391,135
-219,337
-6.1
-12.01
-0.18
Franklin
35
,451
3,670,508,700
509,864
254,932
-254,932
-50.0
-7.19
-0.07
Glendale
12
,872
2,393,447,700
241,724
120,862
-120,862
-50.0
-9.39
-0.05
Greenfield
36
,720
2,939,146,800
1,051,976
525,988
-525,988
-50.0
-14.32
-0.18
Milwaukee *
594
,833
29,520,783,200
227,275,131
216,942,857
-10,332,274
-4.5
-17.37
-0.35
Oak Creek
34
,451
3,113,583,000
1,039,731
519,866
-519,865
-50.0
-15.09
-0.17
Saint Francis
9
,365
649,557,500
1,984,141
1,886,707
-97,434
-4.9
-10.40
-0.15
South Milwaukee
21
,156
1,326,033,700
3,130,905
2,875,478
-255,427
-8.2
-12.07
-0.19
Wauwatosa
46
,396
5,462,436,300
828,188
414,094
-414,094
-50.0
-8.93
-0.08
West Allis
60
,411
4,112,421,800
8,183,391
7,054,871
-1,128,520
-13.8
-18.68
-0.27
County Government
947
,735
63,403,510,200
55,343,365
47,026,480
-8,316,885
-15.0
-8.78
-0.13
* This municipality is located in m
ore than one county. The amounts shown are for the entire municipality, as op
posed to the part of the municipality in this county.

8/7/2019 LFB Distribution of County and Municipal Aid
http://slidepdf.com/reader/full/lfb-distribution-of-county-and-municipal-aid 59/97
ATTACHMENT
Estimated 2012 County and Municipal Aid Program Reductio
n Under SB 27/AB 40
2
010
2010
2011
2012
Estimated Reduction
Census
Equalized
Aid
Estimated
% of 2011
Per
Per $1,000 of
Pop
ulation
Value
Payment
Aid Payment
Am
ount
Aid Payment
Capita
Equalized Value
MONROE COUNTY
Towns
Adrian
762
$57,372,100
$32,608
$30,383
-$2,225
-6.8%
-$2.92
-$0.04
Angelo
1
,296
62,385,900
69,819
63,580
-6,239
-8.9
-4.81
-0.10
Byron
1
,342
89,678,500
63,989
57,088
-6,901
-10.8
-5.14
-0.08
Clifton
690
35,009,600
61,003
59,179
-1,824
-3.0
-2.64
-0.05
Glendale
667
36,303,800
47,255
45,550
-1,705
-3.6
-2.56
-0.05
Grant
495
39,358,200
25,309
24,370
-939
-3.7
-1.90
-0.02
Greenfield
707
58,024,900
43,122
41,207
-1,915
-4.4
-2.71
-0.03
Jefferson
819
33,188,100
81,973
79,403
-2,570
-3.1
-3.14
-0.08
La Fayette
396
20,371,600
35,041
34,440
-601
-1.7
-1.52
-0.03
La Grange
2
,007
132,856,000
41,597
28,311
-13,286
-31.9
-6.62
-0.10
Leon
1
,086
78,549,000
71,228
66,709
-4,519
-6.3
-4.16
-0.06
Lincoln
835
71,591,700
20,288
17,616
-2,672
-13.2
-3.20
-0.04
Little Falls
1
,523
109,144,000
53,524
44,636
-8,888
-16.6
-5.84
-0.08
New Lyme
168
21,352,800
12,236
12,128
-108
-0.9
-0.64
-0.01
Oakdale
772
55,167,200
76,532
74,248
-2,284
-3.0
-2.96
-0.04
Portland
808
47,651,600
56,897
54,395
-2,502
-4.4
-3.10
-0.05
Ridgeville
501
34,256,400
38,389
37,427
-962
-2.5
-1.92
-0.03
Scott
135
12,172,800
18,317
18,247
-70
-0.4
-0.52
-0.01
Sheldon
727
28,925,800
54,617
52,592
-2,025
-3.7
-2.79
-0.07
Sparta
3
,128
200,640,100
101,453
78,880
-22,573
-22.2
-7.22
-0.11
Tomah
1
,400
97,232,000
47,258
39,748
-7,510
-15.9
-5.36
-0.08
Wellington
621
31,185,000
60,129
58,651
-1,478
-2.5
-2.38
-0.05
Wells
519
39,558,200
34,727
33,695
-1,032
-3.0
-1.99
-0.03
Wilton
1
,027
37,762,000
76,594
72,818
-3,776
-4.9
-3.68
-0.10

8/7/2019 LFB Distribution of County and Municipal Aid
http://slidepdf.com/reader/full/lfb-distribution-of-county-and-municipal-aid 60/97
ATTACHMENT
Estimated 2012 County and Municipal Aid Program Reductio
n Under SB 27/AB 40
2
010
2010
2011
2012
Estimated Reduction
Census
Equalized
Aid
Estimated
% of 2011
Per
Per $1,000 of
Pop
ulation
Value
Payment
Aid Payment
Am
ount
Aid Payment
Capita
Equalized Value
MONROE COUNTY (continued)
Villages
Cashton
1
,102
$61,901,900
$
269,112
$264,459
-$4,653
-1.7%
-$4.22
-$0.08
Kendall
472
17,603,700
124,773
123,919
-854
-0.7
-1.81
-0.05
Melvina
104
2,199,900
43,071
43,030
-41
-0.1
-0.39
-0.02
Norwalk
638
13,967,900
180,688
179,291
-1,397
-0.8
-2.19
-0.10
Oakdale
297
20,909,900
35,302
34,964
-338
-1.0
-1.14
-0.02
Warrens
363
68,331,700
78,453
77,948
-505
-0.6
-1.39
-0.01
Wilton
504
22,863,000
185,239
184,266
-973
-0.5
-1.93
-0.04
Wyeville
147
5,124,900
41,792
41,709
-83
-0.2
-0.56
-0.02
Cities Sparta
9
,522
450,547,700
2,027,718
1,960,136
-67,582
-3.3
-7.10
-0.15
Tomah
9
,093
555,599,400
1,677,036
1,593,696
-83,340
-5.0
-9.17
-0.15
County Government
44
,673
2,648,787,300
2,518,873
2,126,843
-392,030
-15.6
-8.78
-0.15

8/7/2019 LFB Distribution of County and Municipal Aid
http://slidepdf.com/reader/full/lfb-distribution-of-county-and-municipal-aid 61/97

8/7/2019 LFB Distribution of County and Municipal Aid
http://slidepdf.com/reader/full/lfb-distribution-of-county-and-municipal-aid 62/97
ATTACHMENT
Estimated 2012 County and Municipal Aid Program Reductio
n Under SB 27/AB 40
2
010
2010
2011
2012
Estimated Reduction
Census
Equalized
Aid
Estimated
% of 2011
Per
Per $1,000 of
Pop
ulation
Value
Payment
Aid Payment
Am
ount
Aid Payment
Capita
Equalized Value
ONEIDA COUNTY
Towns
Cassian
985
$280,263,700
$23,884
$20,166
-$3,718
-15.6%
-$3.77
-$0.01
Crescent
2
,033
289,353,500
38,011
22,174
-15,837
-41.7
-7.79
-0.05
Enterprise
315
101,492,900
7,266
6,886
-380
-5.2
-1.21
0.00
Hazelhurst
1,273
384,274,900
18,125
11,916
-6,209
-34.3
-4.88
-0.02
Lake Tomahawk
1
,043
230,920,100
16,445
12,277
-4,168
-25.3
-4.00
-0.02
Little Rice
306
68,197,900
7,100
6,741
-359
-5.1
-1.17
-0.01
Lynne
141
34,120,600
9,143
9,067
-76
-0.8
-0.54
0.00
Minocqua
4
,385
1,754,154,600
68,206
34,103
-34,103
-50.0
-7.78
-0.02
Monico
309
27,404,500
26,219
25,853
-366
-1.4
-1.18
-0.01
Newbold
2
,719
543,204,900
53,078
26,539
-26,539
-50.0
-9.76
-0.05
Nokomis
1
,371
271,122,700
20,650
13,448
-7,202
-34.9
-5.25
-0.03
Pelican
2
,764
316,417,500
114,656
82,082
-32,574
-28.4
-11.79
-0.10
Piehl
86
16,255,300
17,530
17,502
-28
-0.2
-0.33
0.00
Pine Lake
2
,740
295,149,800
94,220
63,865
-30,355
-32.2
-11.08
-0.10
Schoepke
387
123,508,100
6,713
6,139
-574
-8.6
-1.48
0.00
Stella
650
87,617,700
10,403
8,784
-1,619
-15.6
-2.49
-0.02
Sugar Camp
1
,694
391,922,200
36,515
25,519
-10,996
-30.1
-6.49
-0.03
Three Lakes
2
,131
1,001,411,800
49,774
32,373
-17,401
-35.0
-8.17
-0.02
Woodboro
813
183,799,100
13,681
11,148
-2,533
-18.5
-3.12
-0.01
Woodruff
2
,055
338,394,300
30,609
15,305
-15,304
-50.0
-7.45
-0.05
Cities Rhinelander
7
,798
591,178,400
988,846
900,169
-88,677
-9.0
-11.37
-0.15
County Government
35
,998
7,330,164,500
58,079
29,040
-29,039
-50.0
-0.81
0.00

8/7/2019 LFB Distribution of County and Municipal Aid
http://slidepdf.com/reader/full/lfb-distribution-of-county-and-municipal-aid 63/97

8/7/2019 LFB Distribution of County and Municipal Aid
http://slidepdf.com/reader/full/lfb-distribution-of-county-and-municipal-aid 64/97
ATTACHMENT
Estimated 2012 County and Municipal Aid Program Reductio
n Under SB 27/AB 40
2
010
2010
2011
2012
Estimated Reduction
Census
Equalized
Aid
Estimated
% of 2011
Per
Per $1,000 of
Pop
ulation
Value
Payment
Aid Payment
Am
ount
Aid Payment
Capita
Equalized Value
OZAUKEE COUNTY
Towns
Belgium
1
,415
$280,573,100
$26,022
$18,350
-$7,672
-29.5%
-$5.42
-$0.03
Cedarburg
5
,760
749,687,600
94,876
47,438
-47,438
-50.0
-8.24
-0.06
Fredonia
2
,172
222,923,900
39,052
20,975
-18,077
-46.3
-8.32
-0.08
Grafton
4
,053
557,600,900
71,186
35,593
-35,593
-50.0
-8.78
-0.06
Port Washington
1
,643
197,789,300
27,634
17,290
-10,344
-37.4
-6.30
-0.05
Saukville
1,822
219,733,000
31,801
19,081
-12,720
-40.0
-6.98
-0.06
Villages
Belgium
2
,245
181,776,900
57,852
39,674
-18,178
-31.4
-8.10
-0.10
Fredonia
2
,160
161,385,600
212,872
196,733
-16,139
-7.6
-7.47
-0.10
Grafton
11
,459
1,171,676,800
387,793
208,038
-179,755
-46.4
-15.69
-0.15
Saukville
4,451
411,814,100
383,598
331,325
-52,273
-13.6
-11.74
-0.13
Thiensville
3,235
328,479,900
59,445
29,723
-29,722
-50.0
-9.19
-0.09
Cities Cedarburg
11
,412
1,170,383,900
235,208
117,604
-117,604
-50.0
-10.31
-0.10
Mequon
23
,132
4,223,167,500
360,755
180,377
-180,378
-50.0
-7.80
-0.04
Port Washington
11
,250
893,911,200
580,757
443,303
-137,454
-23.7
-12.22
-0.15
County Government
86
,395
10,801,617,900
187,342
93,671
-93,671
-50.0
-1.08
-0.01

8/7/2019 LFB Distribution of County and Municipal Aid
http://slidepdf.com/reader/full/lfb-distribution-of-county-and-municipal-aid 65/97
ATTACHMENT
Estimated 2012 County and Municipal Aid Program Reductio
n Under SB 27/AB 40
2
010
2010
2011
2012
Estimated Reduction
Census
Equalized
Aid
Estimated
% of 2011
Per
Per $1,000 of
Pop
ulation
Value
Payment
Aid Payment
Am
ount
Aid Payment
Capita
Equalized Value
PEPIN COUNTY
Towns
Albany
676
$45,707,500
$43,668
$41,917
-$1,751
-4.0%
-$2.59
-$0.04
Durand
742
44,316,100
31,988
29,878
-2,110
-6.6
-2.84
-0.05
Frankfort
343
26,662,100
24,878
24,427
-451
-1.8
-1.31
-0.02
Lima
702
46,413,200
43,893
42,005
-1,888
-4.3
-2.69
-0.04
Pepin
721
82,840,400
20,783
18,791
-1,992
-9.6
-2.76
-0.02
Stockholm
197
34,195,800
7,734
7,585
-149
-1.9
-0.76
0.00
Waterville
831
53,137,200
97,460
94,814
-2,646
-2.7
-3.18
-0.05
Waubeek
423
37,326,100
5,805
5,119
-686
-11.8
-1.62
-0.02
Villages
Pepin
837
61,155,800
128,370
125,686
-2,684
-2.1
-3.21
-0.04
Stockholm
66
17,348,500
15,631
15,614
-17
-0.1
-0.26
0.00
Cities Durand
1
,931
94,901,900
475,492
466,002
-9,490
-2.0
-4.91
-0.10
County Government
7
,469
544,004,600
530,954
465,410
-65,544
-12.3
-8.78
-0.12

8/7/2019 LFB Distribution of County and Municipal Aid
http://slidepdf.com/reader/full/lfb-distribution-of-county-and-municipal-aid 66/97
ATTACHMENT
Estimated 2012 County and Municipal Aid Program Reductio
n Under SB 27/AB 40
2
010
2010
2011
2012
Estimated Reduction
Census
Equalized
Aid
Estimated
% of 2011
Per
Per $1,000 of
Pop
ulation
Value
Payment
Aid Payment
Am
ount
Aid Payment
Capita
Equalized Value
PIERCE COUNTY
Towns
Clifton
2
,012
$259,144,500
$21,607
$10,803
-$10,804
-50.0%
-$5.37
-$0.04
Diamond Bluff
469
53,268,800
18,808
17,965
-843
-4.5
-1.80
-0.02
Ellsworth
1
,146
88,857,400
48,651
43,619
-5,032
-10.3
-4.39
-0.06
El Paso
681
62,993,200
34,469
32,692
-1,777
-5.2
-2.61
-0.03
Gilman
959
79,297,700
32,235
28,711
-3,524
-10.9
-3.67
-0.04
Hartland
827
66,105,500
27,014
24,393
-2,621
-9.7
-3.17
-0.04
Isabelle
281
32,253,000
3,480
3,177
-303
-8.7
-1.08
-0.01
Maiden Rock
589
67,002,300
34,173
32,844
-1,329
-3.9
-2.26
-0.02
Martell
1
,185
105,377,200
27,029
21,648
-5,381
-19.9
-4.54
-0.05
Oak Grove
2
,150
264,478,500
22,745
11,372
-11,373
-50.0
-5.29
-0.04
River Falls
2
,271
219,242,900
37,263
18,632
-18,631
-50.0
-8.20
-0.08
Rock Elm
485
40,949,800
27,548
26,647
-901
-3.3
-1.86
-0.02
Salem
510
48,214,300
24,903
23,906
-997
-4.0
-1.95
-0.02
Spring Lake
563
46,233,600
40,815
39,600
-1,215
-3.0
-2.16
-0.03
Trenton
1
,829
157,131,000
33,854
21,036
-12,818
-37.9
-7.01
-0.08
Trimbelle
1
,679
134,956,200
48,921
38,119
-10,802
-22.1
-6.43
-0.08
Union
609
41,803,400
46,808
45,387
-1,421
-3.0
-2.33
-0.03
Villages
Bay City
500
19,816,600
82,161
81,203
-958
-1.2
-1.92
-0.05
Ellsworth
3
,284
184,251,700
529,450
507,736
-21,714
-4.1
-6.61
-0.12
Elmwood
817
40,317,300
204,614
202,056
-2,558
-1.3
-3.13
-0.06
Maiden Rock
119
14,859,700
56,804
56,750
-54
-0.1
-0.45
0.00
Plum City
599
26,362,900
148,970
147,595
-1,375
-0.9
-2.30
-0.05
Spring Valley *
1
,352
60,982,400
183,957
177,859
-6,098
-3.3
-4.51
-0.10
Cities Prescott
4
,258
282,998,000
317,946
280,085
-37,861
-11.9
-8.89
-0.13
River Falls *
15
,000
837,562,700
2,126,691
1,983,095
-143,596
-6.8
-9.57
-0.17
County Government
41
,019
2,941,150,400
1,224,356
864,392
-359,964
-29.4
-8.78
-0.12
* This municipality is located in m
ore than one county. The amounts shown are for the entire municipality, as op
posed to the part of the municipality in this county.

8/7/2019 LFB Distribution of County and Municipal Aid
http://slidepdf.com/reader/full/lfb-distribution-of-county-and-municipal-aid 67/97

8/7/2019 LFB Distribution of County and Municipal Aid
http://slidepdf.com/reader/full/lfb-distribution-of-county-and-municipal-aid 68/97
ATTACHMENT
Estimated 2012 County and Municipal Aid Program Reductio
n Under SB 27/AB 40
2
010
2010
2011
2012
Estimated Reduction
Census
Equalized
Aid
Estimated
% of 2011
Per
Per $1,000 of
Pop
ulation
Value
Payment
Aid Payment
Am
ount
Aid Payment
Capita
Equalized Value
POLK COUNTY (continued)
Villages
Balsam Lake
1
,009
$129,285,300
$21,804
$17,903
-$3,901
-17.9%
-$3.87
-$0.03
Centuria
948
35,595,200
270,808
267,364
-3,444
-1.3
-3.63
-0.10
Clayton
571
24,989,800
128,912
127,663
-1,249
-1.0
-2.19
-0.05
Clear Lake
1
,070
56,372,400
335,315
330,928
-4,387
-1.3
-4.10
-0.08
Dresser
895
57,707,600
111,521
108,452
-3,069
-2.8
-3.43
-0.05
Frederic
1
,137
56,656,000
336,280
331,326
-4,954
-1.5
-4.36
-0.09
Luck
1
,119
68,457,100
191,705
186,907
-4,798
-2.5
-4.29
-0.07
Milltown
917
42,917,300
240,592
237,370
-3,222
-1.3
-3.51
-0.08
Osceola
2
,568
190,946,800
341,782
322,464
-19,318
-5.7
-7.52
-0.10
Cities Amery
2
,902
183,212,200
534,069
514,258
-19,811
-3.7
-6.83
-0.11
Saint Croix Falls
2
,133
208,972,500
167,119
149,686
-17,433
-10.4
-8.17
-0.08
County Government
44
,205
4,544,946,600
564,122
282,061
-282,061
-50.0
-6.38
-0.06

8/7/2019 LFB Distribution of County and Municipal Aid
http://slidepdf.com/reader/full/lfb-distribution-of-county-and-municipal-aid 69/97
ATTACHMENT
Estimated 2012 County and Municipal Aid Program Reductio
n Under SB 27/AB 40
2
010
2010
2011
2012
Estimated Reduction
Census
Equalized
Aid
Estimated
% of 2011
Per
Per $1,000 of
Pop
ulation
Value
Payment
Aid Payment
Am
ount
Aid Payment
Capita
Equalized Value
PORTAGE COUNTY
Towns
Alban
885
$78,585,700
$20,762
$17,761
-$3,001
-14.5%
-$3.39
-$0.04
Almond
680
51,204,600
19,173
17,401
-1,772
-9.2
-2.61
-0.03
Amherst
1
,325
120,362,900
33,977
27,250
-6,727
-19.8
-5.08
-0.06
Belmont
616
60,873,700
16,508
15,054
-1,454
-8.8
-2.36
-0.02
Buena Vista
1
,198
92,454,100
36,394
30,895
-5,499
-15.1
-4.59
-0.06
Carson
1
,305
127,781,900
23,389
16,863
-6,526
-27.9
-5.00
-0.05
Dewey
932
95,882,000
18,736
15,408
-3,328
-17.8
-3.57
-0.03
Eau Pleine
908
97,043,200
32,119
28,960
-3,159
-9.8
-3.48
-0.03
Grant
1
,906
144,558,400
48,316
34,396
-13,920
-28.8
-7.30
-0.10
Hull
5
,346
364,295,600
207,338
152,694
-54,644
-26.4
-10.22
-0.15
Lanark
1
,527
116,071,700
28,906
19,971
-8,935
-30.9
-5.85
-0.08
Linwood
1
,121
93,585,400
25,734
20,919
-4,815
-18.7
-4.30
-0.05
New Hope
718
82,144,400
12,780
10,805
-1,975
-15.5
-2.75
-0.02
Pine Grove
937
48,617,100
51,047
47,683
-3,364
-6.6
-3.59
-0.07
Plover
1
,701
175,029,400
40,737
29,650
-11,087
-27.2
-6.52
-0.06
Sharon
1
,982
158,855,200
49,480
34,428
-15,052
-30.4
-7.59
-0.09
Stockton
2
,917
224,281,400
59,929
35,947
-23,982
-40.0
-8.22
-0.11
Villages
Almond
448
17,261,000
103,530
102,761
-769
-0.7
-1.72
-0.04
Amherst
1
,035
55,166,200
137,957
133,852
-4,105
-3.0
-3.97
-0.07
Amherst Junction
377
26,273,200
20,322
19,777
-545
-2.7
-1.45
-0.02
Junction City
439
16,221,400
147,826
147,088
-738
-0.5
-1.68
-0.05
Nelsonville
155
9,626,200
24,464
24,372
-92
-0.4
-0.59
-0.01
Park Ridge
491
47,975,800
13,863
12,939
-924
-6.7
-1.88
-0.02
Plover
12
,123
941,948,100
692,328
544,872
-147,456
-21.3
-12.16
-0.16
Rosholt
506
19,498,500
84,170
83,189
-981
-1.2
-1.94
-0.05
Whiting
1
,724
138,311,600
85,413
74,024
-11,389
-13.3
-6.61
-0.08
Cities Stevens Point
26
,717
1,576,688,200
3,617,780
3,274,316
-343,464
-9.5
-12.86
-0.22
County Government
70
,019
4,980,596,900
2,319,418
1,704,964
-614,454
-26.5
-8.78
-0.12

8/7/2019 LFB Distribution of County and Municipal Aid
http://slidepdf.com/reader/full/lfb-distribution-of-county-and-municipal-aid 70/97
ATTACHMENT
Estimated 2012 County and Municipal Aid Program Reductio
n Under SB 27/AB 40
2
010
2010
2011
2012
Estimated Reduction
Census
Equalized
Aid
Estimated
% of 2011
Per
Per $1,000 of
Pop
ulation
Value
Payment
Aid Payment
Am
ount
Aid Payment
Capita
Equalized Value
PRICE COUNTY
Towns
Catawba
269
$24,777,500
$13,142
$12,865
-
$277
-2.1%
-$1.03
-$0.01
Eisenstein
630
75,319,900
20,384
18,863
-1,521
-7.5
-2.41
-0.02
Elk
988
159,711,100
18,498
14,758
-3,740
-20.2
-3.79
-0.02
Emery
297
35,021,600
15,815
15,477
-338
-2.1
-1.14
-0.01
Fifield
901
172,181,600
26,665
23,554
-3,111
-11.7
-3.45
-0.02
Flambeau
489
77,649,400
15,019
14,103
-916
-6.1
-1.87
-0.01
Georgetown
171
15,973,800
27,732
27,620
-112
-0.4
-0.65
-0.01
Hackett
169
30,340,800
9,106
8,997
-109
-1.2
-0.64
0.00
Harmony
222
25,514,600
14,572
14,383
-189
-1.3
-0.85
-0.01
Hill
333
38,276,600
19,307
18,882
-425
-2.2
-1.28
-0.01
Kennan
356
29,223,300
32,882
32,396
-486
-1.5
-1.37
-0.02
Knox
341
36,953,700
25,395
24,949
-446
-1.8
-1.31
-0.01
Lake
1
,128
161,520,600
86,038
81,163
-4,875
-5.7
-4.32
-0.03
Ogema
713
65,614,200
91,646
89,698
-1,948
-2.1
-2.73
-0.03
Prentice
475
58,508,900
24,804
23,939
-865
-3.5
-1.82
-0.01
Spirit
277
46,562,700
13,848
13,554
-294
-2.1
-1.06
-0.01
Worcester
1
,555
178,502,400
48,738
39,473
-9,265
-19.0
-5.96
-0.05
Villages
Catawba
110
5,344,900
37,668
37,622
-46
-0.1
-0.42
-0.01
Kennan
135
5,401,100
39,316
39,246
-70
-0.2
-0.52
-0.01
Prentice
660
27,652,400
197,646
195,977
-1,669
-0.8
-2.53
-0.06
Cities Park Falls
2
,462
117,610,500
984,631
972,870
-11,761
-1.2
-4.78
-0.10
Phillips
1,478
88,826,400
516,479
508,109
-8,370
-1.6
-5.66
-0.09
County Government
14
,159
1,476,488,000
591,501
467,248
-124,253
-21.0
-8.78
-0.08

8/7/2019 LFB Distribution of County and Municipal Aid
http://slidepdf.com/reader/full/lfb-distribution-of-county-and-municipal-aid 71/97
ATTACHMENT
Estimated 2012 County and Municipal Aid Program Reductio
n Under SB 27/AB 40
2
010
2010
2011
2012
Estimated Reduction
Census
Equalized
Aid
Estimated
% of 2011
Per
Per $1,000 of
Pop
ulation
Value
Payment
Aid Payment
Am
ount
Aid Payment
Capita
Equalized Value
RACINE COUNTY
Towns
Burlington
6
,502
$698,670,900
$
104,404
$52,202
-$52,202
-50.0%
-$8.03
-$0.07
Dover
4
,051
331,303,800
72,081
36,041
-36,040
-50.0
-8.90
-0.11
Norway
7
,948
833,262,300
118,602
59,301
-59,301
-50.0
-7.46
-0.07
Raymond
3
,870
454,830,900
57,473
28,737
-28,736
-50.0
-7.43
-0.06
Waterford
6
,344
740,077,900
95,336
47,668
-47,668
-50.0
-7.51
-0.06
Yorkville
3,071
496,618,700
51,761
25,880
-25,881
-50.0
-8.43
-0.05
Caledonia
24
,705
2,152,771,600
689,644
344,822
-344,822
-50.0
-13.96
-0.16
Villages
Elmwood Park
497
42,697,100
13,946
13,000
-946
-6.8
-1.90
-0.02
Mount Pleasant
26
,197
2,707,300,800
401,059
200,530
-200,529
-50.0
-7.65
-0.07
North Bay
241
37,194,700
9,191
8,968
-223
-2.4
-0.93
-0.01
Rochester
3
,682
352,703,600
82,167
41,338
-40,829
-49.7
-11.09
-0.12
Sturtevant
6
,970
545,052,300
912,443
830,685
-81,758
-9.0
-11.73
-0.15
Union Grove
4
,915
312,232,100
451,061
404,677
-46,384
-10.3
-9.44
-0.15
Waterford
5
,368
434,574,900
166,349
103,228
-63,121
-37.9
-11.76
-0.15
Wind Point
1
,723
261,051,400
31,911
20,536
-11,375
-35.6
-6.60
-0.04
Cities Burlington *
10
,464
887,438,400
495,770
361,491
-134,279
-27.1
-12.83
-0.15
Racine
78
,860
3,941,360,600
26,142,599
24,960,191
-1,182,408
-4.5
-14.99
-0.30
County Government
195
,408
15,228,632,600
3,132,657
1,566,329
-1,566,328
-50.0
-8.02
-0.10
* This municipality is located in m
ore than one county. The amounts shown are for the entire municipality, as op
posed to the part of the municipality in this county.

8/7/2019 LFB Distribution of County and Municipal Aid
http://slidepdf.com/reader/full/lfb-distribution-of-county-and-municipal-aid 72/97
ATTACHMENT
Estimated 2012 County and Municipal Aid Program Reductio
n Under SB 27/AB 40
2
010
2010
2011
2012
Estimated Reduction
Census
Equalized
Aid
Estimated
% of 2011
Per
Per $1,000 of
Pop
ulation
Value
Payment
Aid Payment
Am
ount
Aid Payment
Capita
Equalized Value
RICHLAND COUNTY
Towns
Akan
403
$30,747,200
$31,004
$30,382
-
$622
-2.0%
-$1.54
-$0.02
Bloom
512
32,102,800
48,399
47,395
-1,004
-2.1
-1.96
-0.03
Buena Vista
1
,869
104,243,200
71,179
60,755
-10,424
-14.6
-5.58
-0.10
Dayton
693
46,796,200
48,984
47,144
-1,840
-3.8
-2.66
-0.04
Eagle
531
39,452,700
35,546
34,466
-1,080
-3.0
-2.03
-0.03
Forest
352
32,938,800
19,500
19,025
-475
-2.4
-1.35
-0.01
Henrietta
493
34,335,000
62,684
61,753
-931
-1.5
-1.89
-0.03
Ithaca
619
44,809,800
43,814
42,346
-1,468
-3.4
-2.37
-0.03
Marshall
567
38,431,700
42,131
40,899
-1,232
-2.9
-2.17
-0.03
Orion
579
60,884,600
27,801
26,516
-1,285
-4.6
-2.22
-0.02
Richland
1
,379
84,859,400
46,029
38,742
-7,287
-15.8
-5.28
-0.09
Richwood
533
39,611,700
54,341
53,252
-1,089
-2.0
-2.04
-0.03
Rockbridge
734
49,782,100
52,392
50,328
-2,064
-3.9
-2.81
-0.04
Sylvan
555
33,205,600
38,744
37,564
-1,180
-3.0
-2.13
-0.04
Westford
530
30,336,900
43,901
42,825
-1,076
-2.5
-2.03
-0.04
Willow
579
33,988,400
41,533
40,248
-1,285
-3.1
-2.22
-0.04
Villages
Boaz
156
4,339,400
57,177
57,084
-93
-0.2
-0.60
-0.02
Cazenovia *
318
16,459,300
81,795
81,408
-387
-0.5
-1.22
-0.02
Lone Rock
888
36,895,200
140,408
137,386
-3,022
-2.2
-3.40
-0.08
Viola *
699
21,528,400
284,155
282,283
-1,872
-0.7
-2.68
-0.09
Yuba
74
2,406,400
9,464
9,443
-21
-0.2
-0.28
-0.01
Cities Richland Center
5
,184
282,164,900
1,320,397
1,278,072
-42,325
-3.2
-8.16
-0.15
County Government
18
,021
1,094,203,300
1,330,715
1,172,571
-158,144
-11.9
-8.78
-0.14
* This municipality is located in m
ore than one county. The amounts shown are for the entire municipality, as op
posed to the part of the municipality in this county.

8/7/2019 LFB Distribution of County and Municipal Aid
http://slidepdf.com/reader/full/lfb-distribution-of-county-and-municipal-aid 73/97

8/7/2019 LFB Distribution of County and Municipal Aid
http://slidepdf.com/reader/full/lfb-distribution-of-county-and-municipal-aid 74/97

8/7/2019 LFB Distribution of County and Municipal Aid
http://slidepdf.com/reader/full/lfb-distribution-of-county-and-municipal-aid 75/97

8/7/2019 LFB Distribution of County and Municipal Aid
http://slidepdf.com/reader/full/lfb-distribution-of-county-and-municipal-aid 76/97
ATTACHMENT
Estimated 2012 County and Municipal Aid Program Reductio
n Under SB 27/AB 40
2
010
2010
2011
2012
Estimated Reduction
Census
Equalized
Aid
Estimated
% of 2011
Per
Per $1,000 of
Pop
ulation
Value
Payment
Aid Payment
Am
ount
Aid Payment
Capita
Equalized Value
SAUK COUNTY
Towns
Baraboo
1
,672
$199,241,300
$29,582
$18,870
-$10,712
-36.2%
-$6.41
-$0.05
Bear Creek
595
60,849,000
9,041
7,684
-1,357
-15.0
-2.28
-0.02
Dellona
1
,552
213,801,800
14,890
7,445
-7,445
-50.0
-4.80
-0.03
Delton
2
,391
297,603,400
32,557
16,279
-16,278
-50.0
-6.81
-0.05
Excelsior
1
,575
150,989,500
25,967
16,462
-9,505
-36.6
-6.03
-0.06
Fairfield
1
,077
105,004,500
15,739
11,294
-4,445
-28.2
-4.13
-0.04
Franklin
652
73,561,300
14,109
12,480
-1,629
-11.5
-2.50
-0.02
Freedom
447
57,474,900
11,721
10,955
-766
-6.5
-1.71
-0.01
Greenfield
932
105,503,200
13,493
10,165
-3,328
-24.7
-3.57
-0.03
Honey Creek
733
75,736,600
14,420
12,361
-2,059
-14.3
-2.81
-0.03
Ironton
660
47,143,300
34,787
33,118
-1,669
-4.8
-2.53
-0.04
La Valle
1
,302
386,920,800
20,992
14,496
-6,496
-30.9
-4.99
-0.02
Merrimac
942
259,072,600
14,884
11,484
-3,400
-22.8
-3.61
-0.01
Prairie Du Sac
1
,144
136,602,200
21,225
16,210
-5,015
-23.6
-4.38
-0.04
Reedsburg
1
,293
94,247,200
45,422
39,016
-6,406
-14.1
-4.95
-0.07
Spring Green
1
,697
164,220,600
25,014
13,979
-11,035
-44.1
-6.50
-0.07
Sumpter
1
,191
58,977,200
19,685
14,250
-5,435
-27.6
-4.56
-0.09
Troy
794
82,309,600
18,537
16,121
-2,416
-13.0
-3.04
-0.03
Washington
1
,007
56,460,700
41,814
37,928
-3,886
-9.3
-3.86
-0.07
Westfield
571
47,886,000
15,506
14,257
-1,249
-8.1
-2.19
-0.03
Winfield
856
85,476,300
16,912
14,104
-2,808
-16.6
-3.28
-0.03
Woodland
790
81,174,200
9,936
7,545
-2,391
-24.1
-3.03
-0.03

8/7/2019 LFB Distribution of County and Municipal Aid
http://slidepdf.com/reader/full/lfb-distribution-of-county-and-municipal-aid 77/97
ATTACHMENT
Estimated 2012 County and Municipal Aid Program Reductio
n Under SB 27/AB 40
2
010
2010
2011
2012
Estimated Reduction
Census
Equalized
Aid
Estimated
% of 2011
Per
Per $1,000 of
Pop
ulation
Value
Payment
Aid Payment
Am
ount
Aid Payment
Capita
Equalized Value
SAUK COUNTY (continued)
Villages
Ironton
253
$8,218,400
$43,912
$43,667
-
$245
-0.6%
-$0.97
-$0.03
Lake Delton
2
,914
1,405,021,700
27,844
13,922
-13,922
-50.0
-4.78
-0.01
La Valle
367
17,180,500
98,070
97,554
-516
-0.5
-1.41
-0.03
Lime Ridge
162
8,075,300
41,240
41,139
-101
-0.2
-0.62
-0.01
Loganville
300
15,388,300
48,423
48,078
-345
-0.7
-1.15
-0.02
Merrimac
420
71,627,800
18,605
17,929
-676
-3.6
-1.61
-0.01
North Freedom
701
25,778,600
150,047
148,164
-1,883
-1.3
-2.69
-0.07
Plain
773
76,284,400
25,408
23,118
-2,290
-9.0
-2.96
-0.03
Prairie Du Sac
3
,972
344,612,100
158,262
116,333
-41,929
-26.5
-10.56
-0.12
Rock Springs
362
19,635,100
88,043
87,541
-502
-0.6
-1.39
-0.03
Sauk City
3
,410
303,388,200
185,517
151,215
-34,302
-18.5
-10.06
-0.11
Spring Green
1
,628
152,085,100
105,437
95,281
-10,156
-9.6
-6.24
-0.07
West Baraboo
1
,414
111,396,100
35,019
27,358
-7,661
-21.9
-5.42
-0.07
Cities Baraboo
12
,048
829,682,300
1,515,071
1,384,710
-130,361
-8.6
-10.82
-0.16
Reedsburg
9
,200
591,561,400
818,029
729,295
-88,734
-10.8
-9.65
-0.15
County Government
61
,976
6,924,568,300
633,138
316,569
-316,569
-50.0
-5.11
-0.05

8/7/2019 LFB Distribution of County and Municipal Aid
http://slidepdf.com/reader/full/lfb-distribution-of-county-and-municipal-aid 78/97
ATTACHMENT
Estimated 2012 County and Municipal Aid Program Reductio
n Under SB 27/AB 40
2
010
2010
2011
2012
Estimated Reduction
Census
Equalized
Aid
Estimated
% of 2011
Per
Per $1,000 of
Pop
ulation
Value
Payment
Aid Payment
Am
ount
Aid Payment
Capita
Equalized Value
SAWYER COUNTY
Towns
Bass Lake
2
,377
$561,355,200
$31,897
$15,948
-$15,949
-50.0%
-$6.71
-$0.03
Couderay
401
29,329,200
22,368
21,752
-616
-2.8
-1.54
-0.02
Draper
204
48,566,800
5,491
5,332
-159
-2.9
-0.78
0.00
Edgewater
519
167,779,100
9,351
8,319
-1,032
-11.0
-1.99
-0.01
Hayward
3
,567
567,724,100
69,159
34,579
-34,580
-50.0
-9.69
-0.06
Hunter
678
199,284,100
9,456
7,695
-1,761
-18.6
-2.60
-0.01
Lenroot
1
,279
281,647,900
29,382
23,114
-6,268
-21.3
-4.90
-0.02
Meadowbrook
131
19,379,500
21,336
21,270
-66
-0.3
-0.50
0.00
Meteor
158
24,943,800
9,991
9,895
-96
-1.0
-0.61
0.00
Ojibwa
249
55,076,600
7,483
7,245
-238
-3.2
-0.96
0.00
Radisson
405
64,250,500
17,430
16,801
-629
-3.6
-1.55
-0.01
Round Lake
977
367,850,200
24,998
21,340
-3,658
-14.6
-3.74
-0.01
Sand Lake
813
409,332,100
15,819
13,286
-2,533
-16.0
-3.12
-0.01
Spider Lake
351
332,050,900
10,767
10,295
-472
-4.4
-1.34
0.00
Weirgor
332
42,548,900
25,089
24,667
-422
-1.7
-1.27
-0.01
Winter
960
243,290,300
23,237
19,706
-3,531
-15.2
-3.68
-0.01
Villages
Couderay
88
3,428,400
40,567
40,537
-30
-0.1
-0.34
-0.01
Exeland
196
7,267,800
67,880
67,733
-147
-0.2
-0.75
-0.02
Radisson
241
7,619,000
80,182
79,959
-223
-0.3
-0.93
-0.03
Winter
313
13,460,300
127,827
127,452
-375
-0.3
-1.20
-0.03
Cities Hayward
2
,318
232,563,500
88,999
68,410
-20,589
-23.1
-8.88
-0.09
County Government
16
,557
3,678,748,200
33,835
16,917
-16,918
-50.0
-1.02
0.00

8/7/2019 LFB Distribution of County and Municipal Aid
http://slidepdf.com/reader/full/lfb-distribution-of-county-and-municipal-aid 79/97
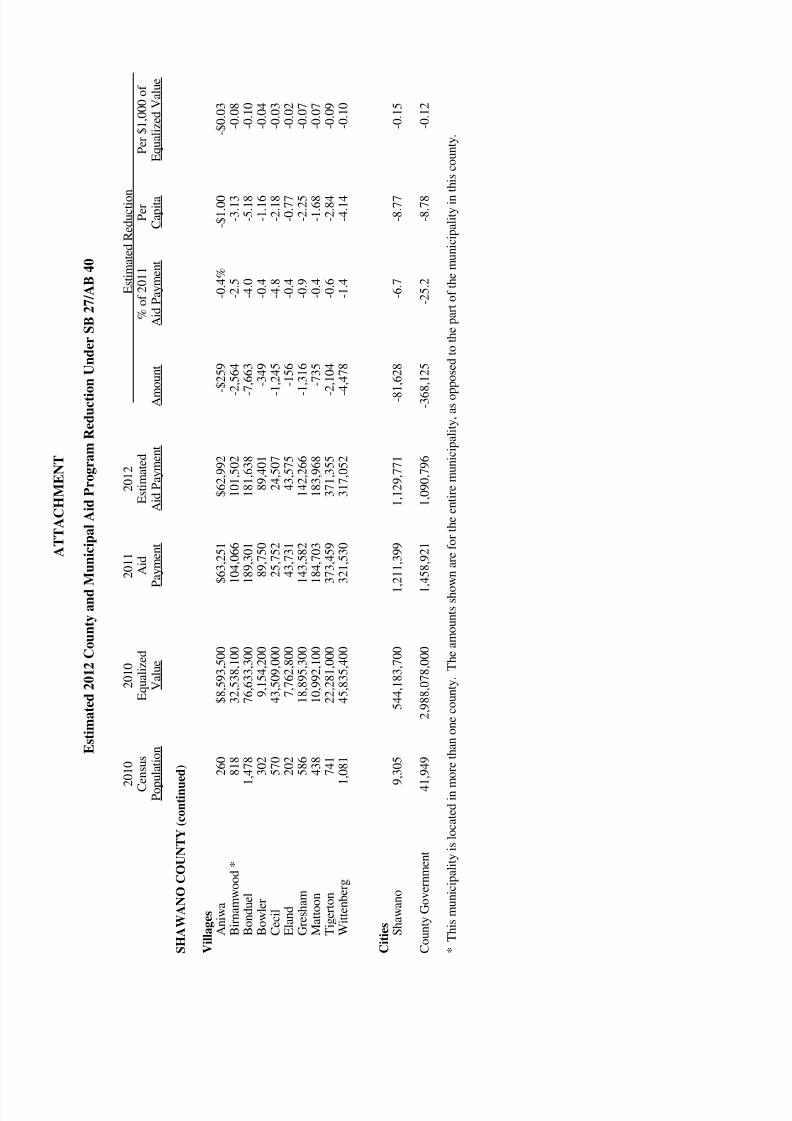
8/7/2019 LFB Distribution of County and Municipal Aid
http://slidepdf.com/reader/full/lfb-distribution-of-county-and-municipal-aid 80/97
ATTACHMENT
Estimated 2012 County and Municipal Aid Program Reductio
n Under SB 27/AB 40
2
010
2010
2011
2012
Estimated Reduction
Census
Equalized
Aid
Estimated
% of 2011
Per
Per $1,000 of
Pop
ulation
Value
Payment
Aid Payment
Am
ount
Aid Payment
Capita
Equalized Value
SHAWANO COUNTY (continu
ed)
Villages
Aniwa
260
$8,593,500
$63,251
$62,992
-
$259
-0.4%
-$1.00
-$0.03
Birnamwood *
818
32,538,100
104,066
101,502
-2,564
-2.5
-3.13
-0.08
Bonduel
1
,478
76,633,300
189,301
181,638
-7,663
-4.0
-5.18
-0.10
Bowler
302
9,154,200
89,750
89,401
-349
-0.4
-1.16
-0.04
Cecil
570
43,509,000
25,752
24,507
-1,245
-4.8
-2.18
-0.03
Eland
202
7,762,800
43,731
43,575
-156
-0.4
-0.77
-0.02
Gresham
586
18,895,300
143,582
142,266
-1,316
-0.9
-2.25
-0.07
Mattoon
438
10,992,100
184,703
183,968
-735
-0.4
-1.68
-0.07
Tigerton
741
22,281,000
373,459
371,355
-2,104
-0.6
-2.84
-0.09
Wittenberg
1,081
45,835,400
321,530
317,052
-4,478
-1.4
-4.14
-0.10
Cities Shawano
9
,305
544,183,700
1,211,399
1,129,771
-81,628
-6.7
-8.77
-0.15
County Government
41
,949
2,988,078,000
1,458,921
1,090,796
-368,125
-25.2
-8.78
-0.12
* This municipality is located in m
ore than one county. The amounts shown are for the entire municipality, as op
posed to the part of the municipality in this county.

8/7/2019 LFB Distribution of County and Municipal Aid
http://slidepdf.com/reader/full/lfb-distribution-of-county-and-municipal-aid 81/97

8/7/2019 LFB Distribution of County and Municipal Aid
http://slidepdf.com/reader/full/lfb-distribution-of-county-and-municipal-aid 82/97
ATTACHMENT
Estimated 2012 County and Municipal Aid Program Reductio
n Under SB 27/AB 40
2
010
2010
2011
2012
Estimated Reduction
Census
Equalized
Aid
Estimated
% of 2011
Per
Per $1,000 of
Pop
ulation
Value
Payment
Aid Payment
Am
ount
Aid Payment
Capita
Equalized Value
TAYLOR COUNTY
Towns
Aurora
422
$26,085,500
$47,821
$47,139
-
$682
-1.4%
-$1.62
-$0.03
Browning
905
49,375,400
43,233
40,095
-3,138
-7.3
-3.47
-0.06
Chelsea
806
58,269,800
29,717
27,228
-2,489
-8.4
-3.09
-0.04
Cleveland
268
20,140,400
21,439
21,164
-275
-1.3
-1.03
-0.01
Deer Creek
768
42,507,300
67,501
65,241
-2,260
-3.3
-2.94
-0.05
Ford
268
19,541,700
24,478
24,203
-275
-1.1
-1.03
-0.01
Goodrich
510
34,087,100
31,923
30,926
-997
-3.1
-1.95
-0.03
Greenwood
638
52,563,300
35,914
34,354
-1,560
-4.3
-2.45
-0.03
Grover
256
34,932,300
11,200
10,949
-251
-2.2
-0.98
-0.01
Hammel
713
64,037,600
19,022
17,074
-1,948
-10.2
-2.73
-0.03
Holway
973
37,844,600
67,888
64,260
-3,628
-5.3
-3.73
-0.10
Jump River
375
20,948,200
36,468
35,929
-539
-1.5
-1.44
-0.03
Little Black
1
,140
69,607,400
56,374
51,394
-4,980
-8.8
-4.37
-0.07
Maplehurst
335
24,609,800
27,424
26,994
-430
-1.6
-1.28
-0.02
McKinley
458
28,905,100
37,392
36,588
-804
-2.2
-1.76
-0.03
Medford
2
,606
148,152,000
77,901
62,733
-15,168
-19.5
-5.82
-0.10
Molitor
324
37,914,100
9,790
9,388
-402
-4.1
-1.24
-0.01
Pershing
180
17,996,200
23,722
23,598
-124
-0.5
-0.69
-0.01
Rib Lake
852
72,779,000
35,380
32,599
-2,781
-7.9
-3.26
-0.04
Roosevelt
473
28,158,900
34,779
33,922
-857
-2.5
-1.81
-0.03
Taft
430
30,078,500
33,316
32,608
-708
-2.1
-1.65
-0.02
Westboro
684
62,129,700
52,503
50,710
-1,793
-3.4
-2.62
-0.03
Villages
Gilman
410
15,822,300
145,470
144,826
-644
-0.4
-1.57
-0.04
Lublin
118
3,580,900
51,148
51,095
-53
-0.1
-0.45
-0.01
Rib Lake
910
30,115,500
306,371
303,359
-3,012
-1.0
-3.31
-0.10
Stetsonville
541
20,927,300
118,269
117,148
-1,121
-0.9
-2.07
-0.05
Cities Medford
4
,326
264,966,200
1,085,874
1,049,288
-36,586
-3.4
-8.46
-0.14
County Government
20
,689
1,316,076,100
1,223,376
1,041,819
-181,557
-14.8
-8.78
-0.14

8/7/2019 LFB Distribution of County and Municipal Aid
http://slidepdf.com/reader/full/lfb-distribution-of-county-and-municipal-aid 83/97
ATTACHMENT
Estimated 2012 County and Municipal Aid Program Reductio
n Under SB 27/AB 40
2
010
2010
2011
2012
Estimated Reduction
Census
Equalized
Aid
Estimated
% of 2011
Per
Per $1,000 of
Pop
ulation
Value
Payment
Aid Payment
Am
ount
Aid Payment
Capita
Equalized Value
TREMPEALEAU COUNTY
Towns
Albion
653
$46,361,700
$67,824
$66,190
-$1,634
-2.4%
-$2.50
-$0.04
Arcadia
1
,779
146,789,500
90,373
78,246
-12,127
-13.4
-6.82
-0.08
Burnside
511
32,590,000
56,848
55,847
-1,001
-1.8
-1.96
-0.03
Caledonia
920
62,619,900
34,916
31,673
-3,243
-9.3
-3.53
-0.05
Chimney Rock
241
23,454,700
25,857
25,634
-223
-0.9
-0.93
-0.01
Dodge
389
31,050,200
47,585
47,005
-580
-1.2
-1.49
-0.02
Ettrick
1
,237
106,578,600
72,841
66,978
-5,863
-8.0
-4.74
-0.06
Gale
1
,695
138,336,400
124,597
113,588
-11,009
-8.8
-6.49
-0.08
Hale
1
,037
72,747,100
72,857
68,736
-4,121
-5.7
-3.97
-0.06
Lincoln
823
38,779,100
104,026
101,431
-2,595
-2.5
-3.15
-0.07
Pigeon
891
52,587,700
77,437
74,395
-3,042
-3.9
-3.41
-0.06
Preston
953
64,565,600
96,277
92,797
-3,480
-3.6
-3.65
-0.05
Sumner
810
54,826,900
55,366
52,852
-2,514
-4.5
-3.10
-0.05
Trempealeau
1,756
133,920,400
56,400
44,585
-11,815
-20.9
-6.73
-0.09
Unity
506
42,067,300
41,481
40,500
-981
-2.4
-1.94
-0.02
Villages
Eleva
670
26,515,300
166,491
164,771
-1,720
-1.0
-2.57
-0.06
Ettrick
524
23,426,000
127,130
126,078
-1,052
-0.8
-2.01
-0.04
Pigeon Falls
411
17,568,800
90,429
89,782
-647
-0.7
-1.57
-0.04
Strum
1
,114
46,039,100
284,129
279,525
-4,604
-1.6
-4.13
-0.10
Trempealeau
1,529
99,843,300
241,284
232,326
-8,958
-3.7
-5.86
-0.09
Cities Arcadia
2
,925
149,642,100
718,898
702,346
-16,552
-2.3
-5.66
-0.11
Blair
1
,366
53,671,300
600,443
595,076
-5,367
-0.9
-3.93
-0.10
Galesville
1,481
85,350,000
352,819
344,415
-8,404
-2.4
-5.67
-0.10
Independence
1
,336
63,789,500
308,827
302,448
-6,379
-2.1
-4.77
-0.10
Osseo
1
,701
105,299,800
232,538
222,008
-10,530
-4.5
-6.19
-0.10
Whitehall
1
,558
75,662,100
451,446
443,880
-7,566
-1.7
-4.86
-0.10
County Government
28
,816
1,794,082,400
1,866,291
1,613,415
-252,876
-13.5
-8.78
-0.14
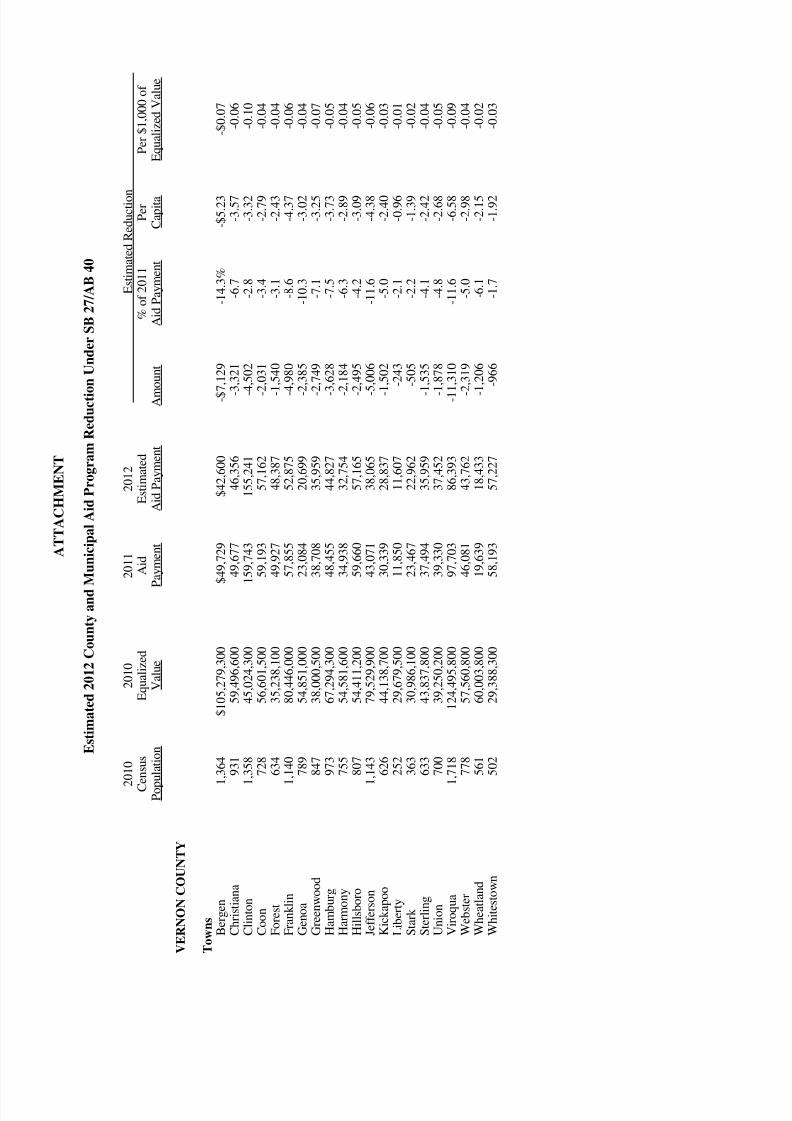
8/7/2019 LFB Distribution of County and Municipal Aid
http://slidepdf.com/reader/full/lfb-distribution-of-county-and-municipal-aid 84/97
ATTACHMENT
Estimated 2012 County and Municipal Aid Program Reductio
n Under SB 27/AB 40
2
010
2010
2011
2012
Estimated Reduction
Census
Equalized
Aid
Estimated
% of 2011
Per
Per $1,000 of
Pop
ulation
Value
Payment
Aid Payment
Am
ount
Aid Payment
Capita
Equalized Value
VERNON COUNTY
Towns
Bergen
1
,364
$105,279,300
$49,729
$42,600
-$7,129
-14.3%
-$5.23
-$0.07
Christiana
931
59,496,600
49,677
46,356
-3,321
-6.7
-3.57
-0.06
Clinton
1
,358
45,024,300
159,743
155,241
-4,502
-2.8
-3.32
-0.10
Coon
728
56,601,500
59,193
57,162
-2,031
-3.4
-2.79
-0.04
Forest
634
35,238,100
49,927
48,387
-1,540
-3.1
-2.43
-0.04
Franklin
1
,140
80,446,000
57,855
52,875
-4,980
-8.6
-4.37
-0.06
Genoa
789
54,851,000
23,084
20,699
-2,385
-10.3
-3.02
-0.04
Greenwood
847
38,000,500
38,708
35,959
-2,749
-7.1
-3.25
-0.07
Hamburg
973
67,294,300
48,455
44,827
-3,628
-7.5
-3.73
-0.05
Harmony
755
54,581,600
34,938
32,754
-2,184
-6.3
-2.89
-0.04
Hillsboro
807
54,411,200
59,660
57,165
-2,495
-4.2
-3.09
-0.05
Jefferson
1
,143
79,529,900
43,071
38,065
-5,006
-11.6
-4.38
-0.06
Kickapoo
626
44,138,700
30,339
28,837
-1,502
-5.0
-2.40
-0.03
Liberty
252
29,679,500
11,850
11,607
-243
-2.1
-0.96
-0.01
Stark
363
30,986,100
23,467
22,962
-505
-2.2
-1.39
-0.02
Sterling
633
43,837,800
37,494
35,959
-1,535
-4.1
-2.42
-0.04
Union
700
39,250,200
39,330
37,452
-1,878
-4.8
-2.68
-0.05
Viroqua
1
,718
124,495,800
97,703
86,393
-11,310
-11.6
-6.58
-0.09
Webster
778
57,560,800
46,081
43,762
-2,319
-5.0
-2.98
-0.04
Wheatland
561
60,003,800
19,639
18,433
-1,206
-6.1
-2.15
-0.02
Whitestown
502
29,388,300
58,193
57,227
-966
-1.7
-1.92
-0.03

8/7/2019 LFB Distribution of County and Municipal Aid
http://slidepdf.com/reader/full/lfb-distribution-of-county-and-municipal-aid 85/97
ATTACHMENT
Estimated 2012 County and Municipal Aid Program Reductio
n Under SB 27/AB 40
2
010
2010
2011
2012
Estimated Reduction
Census
Equalized
Aid
Estimated
% of 2011
Per
Per $1,000 of
Pop
ulation
Value
Payment
Aid Payment
Am
ount
Aid Payment
Capita
Equalized Value
VERNON COUNTY (continued
)
Villages
Chaseburg
284
$15,570,400
$97,576
$97,267
-
$309
-0.3%
-$1.09
-$0.02
Coon Valley
765
40,571,700
236,771
234,529
-2,242
-0.9
-2.93
-0.06
De Soto *
287
21,475,700
103,739
103,423
-316
-0.3
-1.10
-0.01
Genoa
253
12,602,600
27,972
27,727
-245
-0.9
-0.97
-0.02
La Farge
746
29,282,200
248,368
246,236
-2,132
-0.9
-2.86
-0.07
Ontario
554
15,429,800
169,882
168,706
-1,176
-0.7
-2.12
-0.08
Readstown
415
13,914,600
208,716
208,056
-660
-0.3
-1.59
-0.05
Stoddard
774
42,647,900
170,421
168,125
-2,296
-1.3
-2.97
-0.05
Cities Hillsboro
1
,417
60,206,600
473,114
467,093
-6,021
-1.3
-4.25
-0.10
Viroqua
4
,362
241,704,200
1,032,200
997,656
-34,544
-3.3
-7.92
-0.14
Westby
2
,200
107,641,900
527,444
516,680
-10,764
-2.0
-4.89
-0.10
County Government
29
,773
1,792,272,800
946,271
684,997
-261,274
-27.6
-8.78
-0.15
* This municipality is located in m
ore than one county. The amounts shown are for the entire municipality, as op
posed to the part of the municipality in this county.

8/7/2019 LFB Distribution of County and Municipal Aid
http://slidepdf.com/reader/full/lfb-distribution-of-county-and-municipal-aid 86/97
ATTACHMENT
Estimated 2012 County and Municipal Aid Program Reductio
n Under SB 27/AB 40
2
010
2010
2011
2012
Estimated Reduction
Census
Equalized
Aid
Estimated
% of 2011
Per
Per $1,000 of
Pop
ulation
Value
Payment
Aid Payment
Am
ount
Aid Payment
Capita
Equalized Value
VILAS COUNTY
Towns
Arbor Vitae
3
,316
$578,327,000
$61,248
$30,624
-$30,624
-50.0%
-$9.24
-$0.05
Boulder Junction
933
557,986,700
26,511
23,175
-3,336
-12.6
-3.58
-0.01
Cloverland
1
,029
260,886,500
13,736
9,679
-4,057
-29.5
-3.94
-0.02
Conover
1
,235
432,161,500
28,195
22,351
-5,844
-20.7
-4.73
-0.01
Lac Du Flambeau
3,441
987,724,800
57,631
28,815
-28,816
-50.0
-8.37
-0.03
Land O' Lakes
861
498,905,100
24,160
21,319
-2,841
-11.8
-3.30
-0.01
Lincoln
2
,423
542,469,100
41,755
20,878
-20,877
-50.0
-8.62
-0.04
Manitowish Waters
566
576,958,400
11,348
10,120
-1,228
-10.8
-2.17
0.00
Phelps
1
,200
429,964,800
32,499
26,981
-5,518
-17.0
-4.60
-0.01
Plum Lake
491
292,454,200
14,312
13,388
-924
-6.5
-1.88
0.00
Presque Isle
618
651,408,800
14,947
13,484
-1,463
-9.8
-2.37
0.00
Saint Germain
2
,085
680,028,600
23,934
11,967
-11,967
-50.0
-5.74
-0.02
Washington
1
,451
572,317,800
21,332
13,265
-8,067
-37.8
-5.56
-0.01
Winchester
383
309,965,500
6,571
6,009
-562
-8.6
-1.47
0.00
Cities Eagle River
1
,398
183,191,100
27,927
20,438
-7,489
-26.8
-5.36
-0.04
County Government
21
,430
7,554,749,900
28,097
14,049
-14,048
-50.0
-0.66
0.00

8/7/2019 LFB Distribution of County and Municipal Aid
http://slidepdf.com/reader/full/lfb-distribution-of-county-and-municipal-aid 87/97

8/7/2019 LFB Distribution of County and Municipal Aid
http://slidepdf.com/reader/full/lfb-distribution-of-county-and-municipal-aid 88/97
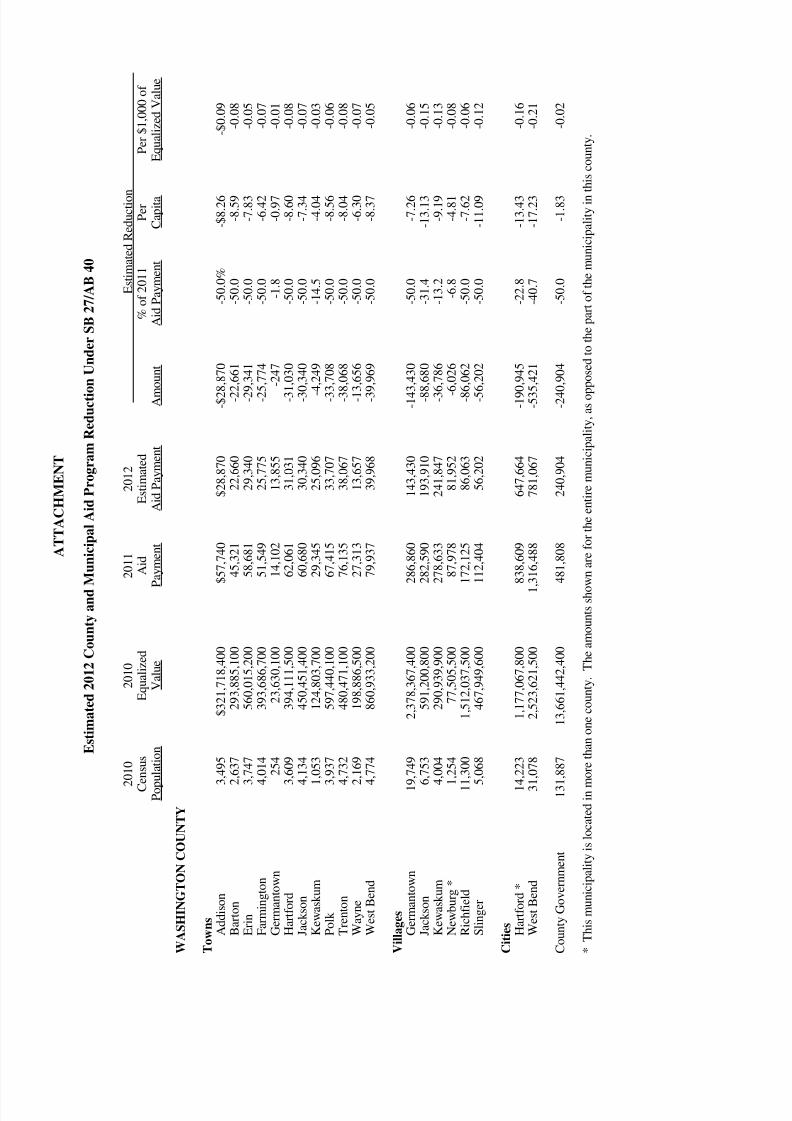
8/7/2019 LFB Distribution of County and Municipal Aid
http://slidepdf.com/reader/full/lfb-distribution-of-county-and-municipal-aid 89/97
ATTACHMENT
Estimated 2012 County and Municipal Aid Program Reductio
n Under SB 27/AB 40
2
010
2010
2011
2012
Estimated Reduction
Census
Equalized
Aid
Estimated
% of 2011
Per
Per $1,000 of
Pop
ulation
Value
Payment
Aid Payment
Am
ount
Aid Payment
Capita
Equalized Value
WASHINGTON COUNTY
Towns
Addison
3
,495
$321,718,400
$57,740
$28,870
-$28,870
-50.0%
-$8.26
-$0.09
Barton
2
,637
293,885,100
45,321
22,660
-22,661
-50.0
-8.59
-0.08
Erin
3
,747
560,015,200
58,681
29,340
-29,341
-50.0
-7.83
-0.05
Farmington
4
,014
393,686,700
51,549
25,775
-25,774
-50.0
-6.42
-0.07
Germantown
254
23,630,100
14,102
13,855
-247
-1.8
-0.97
-0.01
Hartford
3
,609
394,111,500
62,061
31,031
-31,030
-50.0
-8.60
-0.08
Jackson
4
,134
450,451,400
60,680
30,340
-30,340
-50.0
-7.34
-0.07
Kewaskum
1
,053
124,803,700
29,345
25,096
-4,249
-14.5
-4.04
-0.03
Polk
3
,937
597,440,100
67,415
33,707
-33,708
-50.0
-8.56
-0.06
Trenton
4
,732
480,471,100
76,135
38,067
-38,068
-50.0
-8.04
-0.08
Wayne
2
,169
198,886,500
27,313
13,657
-13,656
-50.0
-6.30
-0.07
West Bend
4
,774
860,933,200
79,937
39,968
-39,969
-50.0
-8.37
-0.05
Villages
Germantown
19
,749
2,378,367,400
286,860
143,430
-143,430
-50.0
-7.26
-0.06
Jackson
6
,753
591,200,800
282,590
193,910
-88,680
-31.4
-13.13
-0.15
Kewaskum
4
,004
290,939,900
278,633
241,847
-36,786
-13.2
-9.19
-0.13
Newburg *
1
,254
77,505,500
87,978
81,952
-6,026
-6.8
-4.81
-0.08
Richfield
11
,300
1,512,037,500
172,125
86,063
-86,062
-50.0
-7.62
-0.06
Slinger
5
,068
467,949,600
112,404
56,202
-56,202
-50.0
-11.09
-0.12
Cities Hartford *
14
,223
1,177,067,800
838,609
647,664
-190,945
-22.8
-13.43
-0.16
West Bend
31
,078
2,523,621,500
1,316,488
781,067
-535,421
-40.7
-17.23
-0.21
County Government
131
,887
13,661,442,400
481,808
240,904
-240,904
-50.0
-1.83
-0.02
* This municipality is located in m
ore than one county. The amounts shown are for the entire municipality, as op
posed to the part of the municipality in this county.

8/7/2019 LFB Distribution of County and Municipal Aid
http://slidepdf.com/reader/full/lfb-distribution-of-county-and-municipal-aid 90/97
ATTACHMENT
Estimated 2012 County and Municipal Aid Program Reductio
n Under SB 27/AB 40
2
010
2010
2011
2012
Estimated Reduction
Census
Equalized
Aid
Estimated
% of 2011
Per
Per $1,000 of
Pop
ulation
Value
Payment
Aid Payment
Am
ount
Aid Payment
Capita
Equalized Value
WAUKESHA COUNTY
Towns
Brookfield
6
,116
$1,034,213,300
$
108,660
$54,330
-$54,330
-50.0%
-$8.88
-$0.05
Delafield
8
,400
1,514,578,600
125,120
62,560
-62,560
-50.0
-7.45
-0.04
Eagle
3
,507
452,789,400
44,989
22,494
-22,495
-50.0
-6.41
-0.05
Genesee
7
,340
906,162,700
124,017
62,008
-62,009
-50.0
-8.45
-0.07
Lisbon
10
,157
1,091,634,500
155,716
77,858
-77,858
-50.0
-7.67
-0.07
Merton
8
,338
1,542,098,600
130,511
65,255
-65,256
-50.0
-7.83
-0.04
Mukwonago
7
,959
844,565,700
123,879
61,939
-61,940
-50.0
-7.78
-0.07
Oconomowoc
8
,408
1,466,191,100
135,313
67,656
-67,657
-50.0
-8.05
-0.05
Ottawa
3
,859
572,248,400
60,191
30,095
-30,096
-50.0
-7.80
-0.05
Summit
4
,674
1,006,660,800
75,117
37,559
-37,558
-50.0
-8.04
-0.04
Vernon
7
,601
851,783,100
141,295
70,647
-70,648
-50.0
-9.29
-0.08
Waukesha
9
,133
975,673,300
143,350
71,675
-71,675
-50.0
-7.85
-0.07
Villages
Big Bend
1
,290
152,114,000
54,479
48,103
-6,376
-11.7
-4.94
-0.04
Butler
1
,841
230,597,000
34,825
21,838
-12,987
-37.3
-7.05
-0.06
Chenequa
590
519,226,300
10,658
9,324
-1,334
-12.5
-2.26
0.00
Dousman
2
,302
169,320,100
167,928
150,996
-16,932
-10.1
-7.36
-0.10
Eagle
1
,950
161,190,400
45,791
31,221
-14,570
-31.8
-7.47
-0.09
Elm Grove
5
,934
1,065,098,100
106,983
53,491
-53,492
-50.0
-9.01
-0.05
Hartland
9
,110
1,182,801,000
299,147
149,573
-149,574
-50.0
-16.42
-0.13
Lac La Belle
290
125,800,000
4,920
4,598
-322
-6.5
-1.11
0.00
Lannon
1
,107
108,039,700
28,533
23,837
-4,696
-16.5
-4.24
-0.04

8/7/2019 LFB Distribution of County and Municipal Aid
http://slidepdf.com/reader/full/lfb-distribution-of-county-and-municipal-aid 91/97
ATTACHMENT
Estimated 2012 County and Municipal Aid Program Reductio
n Under SB 27/AB 40
2
010
2010
2011
2012
Estimated Reduction
Census
Equalized
Aid
Estimated
% of 2011
Per
Per $1,000 of
Pop
ulation
Value
Payment
Aid Payment
Am
ount
Aid Payment
Capita
Equalized Value
WAUKESHA COUNTY (contin
ued)
Villages (continued)
Menomonee Falls
35
,626
$4,437,584,100
$
559,967
$279,983
-$279,984
-50.0%
-$7.86
-$0.06
Merton
3
,346
370,936,800
27,024
13,512
-13,512
-50.0
-4.04
-0.04
Mukwonago *
7
,355
745,620,100
252,241
140,398
-111,843
-44.3
-15.21
-0.15
Nashotah
1
,395
174,761,000
13,539
6,770
-6,769
-50.0
-4.85
-0.04
North Prairie
2
,141
235,969,300
40,108
22,544
-17,564
-43.8
-8.20
-0.07
Oconomowoc Lake
595
401,633,900
8,717
7,360
-1,357
-15.6
-2.28
0.00
Pewaukee
8
,166
931,756,400
259,505
129,752
-129,753
-50.0
-15.89
-0.14
Sussex
10
,518
1,156,534,800
141,204
70,602
-70,602
-50.0
-6.71
-0.06
Wales
2
,549
351,497,000
46,455
23,227
-23,228
-50.0
-9.11
-0.07
Cities Brookfield
37
,920
6,149,720,400
633,232
316,616
-316,616
-50.0
-8.35
-0.05
Delafield
7
,085
1,351,345,000
108,233
54,117
-54,116
-50.0
-7.64
-0.04
Muskego
24
,135
2,639,578,400
471,870
235,935
-235,935
-50.0
-9.78
-0.09
New Berlin
39
,584
4,778,847,600
655,486
327,743
-327,743
-50.0
-8.28
-0.07
Oconomowoc
15
,759
2,018,359,000
289,740
144,870
-144,870
-50.0
-9.19
-0.07
Pewaukee
13
,195
2,656,418,000
195,962
97,981
-97,981
-50.0
-7.43
-0.04
Waukesha
70
,718
5,904,933,100
1,700,517
850,259
-850,258
-50.0
-12.02
-0.14
County Government
389
,891
50,288,874,200
848,622
424,311
-424,311
-50.0
-1.09
-0.01
* This municipality is located in m
ore than one county. The amounts shown are for the entire municipality, as op
posed to the part of the municipality in this county.

8/7/2019 LFB Distribution of County and Municipal Aid
http://slidepdf.com/reader/full/lfb-distribution-of-county-and-municipal-aid 92/97
ATTACHMENT
Estimated 2012 County and Municipal Aid Program Reductio
n Under SB 27/AB 40
2
010
2010
2011
2012
Estimated Reduction
Census
Equalized
Aid
Estimated
% of 2011
Per
Per $1,000 of
Pop
ulation
Value
Payment
Aid Payment
Am
ount
Aid Payment
Capita
Equalized Value
WAUPACA COUNTY
Towns
Bear Creek
823
$60,722,200
$34,651
$32,056
-$2,595
-7.5%
-$3.15
-$0.04
Caledonia
1
,627
145,920,300
26,696
16,553
-10,143
-38.0
-6.23
-0.07
Dayton
2
,748
378,451,600
39,620
19,810
-19,810
-50.0
-7.21
-0.05
Dupont
738
49,990,100
37,364
35,277
-2,087
-5.6
-2.83
-0.04
Farmington
3
,974
478,347,600
70,292
35,146
-35,146
-50.0
-8.84
-0.07
Fremont
597
79,592,600
10,304
8,938
-1,366
-13.3
-2.29
-0.02
Harrison
468
56,211,200
13,110
12,271
-839
-6.4
-1.79
-0.01
Helvetia
636
70,625,000
14,918
13,368
-1,550
-10.4
-2.44
-0.02
Iola
971
107,165,700
11,209
7,596
-3,613
-32.2
-3.72
-0.03
Larrabee
1
,381
80,977,100
62,429
55,121
-7,308
-11.7
-5.29
-0.09
Lebanon
1
,665
111,692,500
50,118
39,495
-10,623
-21.2
-6.38
-0.10
Lind
1
,579
115,022,400
38,649
29,095
-9,554
-24.7
-6.05
-0.08
Little Wolf
1,424
98,345,400
56,879
49,109
-7,770
-13.7
-5.46
-0.08
Matteson
936
61,554,500
42,178
38,821
-3,357
-8.0
-3.59
-0.05
Mukwa
2
,930
201,906,500
59,821
38,021
-21,800
-36.4
-7.44
-0.11
Royalton
1
,434
124,723,500
43,543
35,664
-7,879
-18.1
-5.49
-0.06
Saint Lawrence
710
64,289,600
34,710
32,778
-1,932
-5.6
-2.72
-0.03
Scandinavia
1
,066
106,717,900
20,348
15,994
-4,354
-21.4
-4.08
-0.04
Union
806
56,598,600
32,772
30,283
-2,489
-7.6
-3.09
-0.04
Waupaca
1
,173
94,927,400
43,855
38,583
-5,272
-12.0
-4.49
-0.06
Weyauwega
583
54,762,500
33,253
31,951
-1,302
-3.9
-2.23
-0.02
Wyoming
329
33,712,900
12,197
11,782
-415
-3.4
-1.26
-0.01

8/7/2019 LFB Distribution of County and Municipal Aid
http://slidepdf.com/reader/full/lfb-distribution-of-county-and-municipal-aid 93/97
ATTACHMENT
Estimated 2012 County and Municipal Aid Program Reductio
n Under SB 27/AB 40
2
010
2010
2011
2012
Estimated Reduction
Census
Equalized
Aid
Estimated
% of 2011
Per
Per $1,000 of
Pop
ulation
Value
Payment
Aid Payment
Am
ount
Aid Payment
Capita
Equalized Value
WAUPACA COUNTY (continued)
Villages
Big Falls
61
$3,003,300
$29,303
$29,289
-$14
0.0%
-$0.23
$0.00
Embarrass
404
13,952,800
97,059
96,434
-625
-0.6
-1.55
-0.04
Fremont
679
68,862,900
31,899
30,132
-1,767
-5.5
-2.60
-0.03
Iola
1
,301
65,487,000
178,288
171,802
-6,486
-3.6
-4.99
-0.10
Ogdensburg
185
6,709,900
43,081
42,950
-131
-0.3
-0.71
-0.02
Scandinavia
363
16,197,300
47,792
47,287
-505
-1.1
-1.39
-0.03
Cities Clintonville
4,559
210,556,300
1,222,123
1,190,540
-31,583
-2.6
-6.93
-0.15
Manawa
1
,371
77,711,200
286,651
279,449
-7,202
-2.5
-5.25
-0.09
Marion *
1
,260
58,053,200
360,445
354,640
-5,805
-1.6
-4.61
-0.10
New London *
7
,295
355,977,600
2,027,030
1,973,633
-53,397
-2.6
-7.32
-0.15
Waupaca
6
,069
407,942,300
930,613
869,422
-61,191
-6.6
-10.08
-0.15
Weyauwega
1
,900
87,133,600
505,327
496,614
-8,713
-1.7
-4.59
-0.10
County Government
52
,410
3,883,845,100
1,687,806
1,227,880
-459,926
-27.2
-8.78
-0.12
* This municipality is located in m
ore than one county. The amounts shown are for the entire municipality, as op
posed to the part of the municipality in this county.

8/7/2019 LFB Distribution of County and Municipal Aid
http://slidepdf.com/reader/full/lfb-distribution-of-county-and-municipal-aid 94/97
ATTACHMENT
Estimated 2012 County and Municipal Aid Program Reductio
n Under SB 27/AB 40
2
010
2010
2011
2012
Estimated Reduction
Census
Equalized
Aid
Estimated
% of 2011
Per
Per $1,000 of
Pop
ulation
Value
Payment
Aid Payment
Am
ount
Aid Payment
Capita
Equalized Value
WAUSHARA COUNTY
Towns
Aurora
985
$83,926,700
$19,997
$16,279
-$3,718
-18.6%
-$3.77
-$0.04
Bloomfield
1
,052
91,287,900
25,012
20,771
-4,241
-17.0
-4.03
-0.05
Coloma
753
102,486,300
9,407
7,234
-2,173
-23.1
-2.89
-0.02
Dakota
1
,227
107,543,100
25,120
19,351
-5,769
-23.0
-4.70
-0.05
Deerfield
737
94,418,900
8,514
6,433
-2,081
-24.4
-2.82
-0.02
Hancock
528
77,025,900
9,302
8,234
-1,068
-11.5
-2.02
-0.01
Leon
1
,439
171,811,400
18,348
10,413
-7,935
-43.2
-5.51
-0.05
Marion
2
,038
344,816,000
26,969
13,484
-13,485
-50.0
-6.62
-0.04
Mount Morris
1
,097
258,789,200
14,436
9,825
-4,611
-31.9
-4.20
-0.02
Oasis
389
51,671,700
6,446
5,866
-580
-9.0
-1.49
-0.01
Plainfield
550
47,162,000
15,075
13,916
-1,159
-7.7
-2.11
-0.02
Poy Sippi
931
67,774,900
41,486
38,165
-3,321
-8.0
-3.57
-0.05
Richford
612
68,633,200
8,473
7,038
-1,435
-16.9
-2.34
-0.02
Rose
640
79,281,200
9,632
8,063
-1,569
-16.3
-2.45
-0.02
Saxeville
986
145,367,800
15,727
12,002
-3,725
-23.7
-3.78
-0.03
Springwater
1
,274
293,032,500
18,310
12,091
-6,219
-34.0
-4.88
-0.02
Warren
668
51,796,500
13,428
11,718
-1,710
-12.7
-2.56
-0.03
Wautoma
1
,278
134,406,200
20,532
14,274
-6,258
-30.5
-4.90
-0.05
Villages
Coloma
450
23,560,300
86,584
85,808
-776
-0.9
-1.72
-0.03
Hancock
417
19,462,300
152,419
151,753
-666
-0.4
-1.60
-0.03
Lohrville
402
17,333,400
31,722
31,103
-619
-2.0
-1.54
-0.04
Plainfield
862
33,185,700
156,029
153,182
-2,847
-1.8
-3.30
-0.09
Redgranite
2
,149
46,898,800
227,438
222,748
-4,690
-2.1
-2.18
-0.10
Wild Rose
725
32,438,300
186,053
184,039
-2,014
-1.1
-2.78
-0.06
Cities Wautoma
2
,218
102,889,100
465,600
455,311
-10,289
-2.2
-4.64
-0.10
County Government
24
,496
2,557,931,100
73,489
36,744
-36,745
-50.0
-1.50
-0.01

8/7/2019 LFB Distribution of County and Municipal Aid
http://slidepdf.com/reader/full/lfb-distribution-of-county-and-municipal-aid 95/97
ATTACHMENT
Estimated 2012 County and Municipal Aid Program Reductio
n Under SB 27/AB 40
2
010
2010
2011
2012
Estimated Reduction
Census
Equalized
Aid
Estimated
% of 2011
Per
Per $1,000 of
Pop
ulation
Value
Payment
Aid Payment
Am
ount
Aid Payment
Capita
Equalized Value
WINNEBAGO COUNTY
Towns
Algoma
6
,822
$566,316,700
$81,072
$40,536
-$40,536
-50.0%
-$5.94
-$0.07
Black Wolf
2
,410
259,240,900
36,935
18,468
-18,467
-50.0
-7.66
-0.07
Clayton
3
,951
431,886,000
44,971
22,485
-22,486
-50.0
-5.69
-0.05
Menasha
18
,498
1,414,080,300
437,612
218,806
-218,806
-50.0
-11.83
-0.15
Neenah
3
,237
366,622,800
62,137
31,068
-31,069
-50.0
-9.60
-0.08
Nekimi
1
,429
122,620,200
27,234
19,409
-7,825
-28.7
-5.48
-0.06
Nepeuskun
710
54,071,600
20,648
18,716
-1,932
-9.4
-2.72
-0.04
Omro
2
,116
182,745,200
30,322
15,161
-15,161
-50.0
-7.16
-0.08
Oshkosh
2
,475
308,422,500
83,749
60,277
-23,472
-28.0
-9.48
-0.08
Poygan
1
,301
139,490,100
15,417
8,931
-6,486
-42.1
-4.99
-0.05
Rushford
1
,561
111,051,200
41,416
32,079
-9,337
-22.5
-5.98
-0.08
Utica
1
,299
125,823,400
19,211
12,745
-6,466
-33.7
-4.98
-0.05
Vinland
1
,765
238,824,000
30,220
18,283
-11,937
-39.5
-6.76
-0.05
Winchester
1
,763
135,628,100
44,713
32,803
-11,910
-26.6
-6.76
-0.09
Winneconne
2
,350
301,832,900
31,443
15,721
-15,722
-50.0
-6.69
-0.05
Wolf River
1
,189
177,232,500
19,043
13,626
-5,417
-28.4
-4.56
-0.03
Villages
Winneconne
2
,383
189,226,900
164,127
145,204
-18,923
-11.5
-7.94
-0.10
Cities Menasha *
17
,353
1,027,132,300
3,509,732
3,325,105
-184,627
-5.3
-10.64
-0.18
Neenah
25
,501
1,918,845,500
1,778,639
1,396,146
-382,493
-21.5
-15.00
-0.20
Omro
3
,517
177,774,600
786,702
764,356
-22,346
-2.8
-6.35
-0.13
Oshkosh
66
,083
3,779,437,800
10,742,679
9,628,134
-1,114,545
-10.4
-16.87
-0.29
County Government
166
,994
11,916,963,900
2,907,994
1,453,997
-1,453,997
-50.0
-8.71
-0.12
* This municipality is located in m
ore than one county. The amounts shown are for the entire municipality, as op
posed to the part of the municipality in this county.

8/7/2019 LFB Distribution of County and Municipal Aid
http://slidepdf.com/reader/full/lfb-distribution-of-county-and-municipal-aid 96/97
ATTACHMENT
Estimated 2012 County and Municipal Aid Program Reductio
n Under SB 27/AB 40
2
010
2010
2011
2012
Estimated Reduction
Census
Equalized
Aid
Estimated
% of 2011
Per
Per $1,000 of
Pop
ulation
Value
Payment
Aid Payment
Am
ount
Aid Payment
Capita
Equalized Value
WOOD COUNTY
Towns
Arpin
929
$49,650,500
$88,904
$85,597
-$3,307
-3.7%
-$3.56
-$0.07
Auburndale
860
52,659,800
48,348
45,514
-2,834
-5.9
-3.30
-0.05
Cameron
511
56,104,700
14,562
13,561
-1,001
-6.9
-1.96
-0.02
Cary
424
46,819,300
20,662
19,973
-689
-3.3
-1.63
-0.01
Cranmoor
168
41,841,800
6,560
6,452
-108
-1.6
-0.64
0.00
Dexter
359
31,854,200
22,951
22,457
-494
-2.2
-1.38
-0.02
Grand Rapids
7
,646
468,153,700
308,552
238,329
-70,223
-22.8
-9.18
-0.15
Hansen
690
53,237,800
54,950
53,126
-1,824
-3.3
-2.64
-0.03
Hiles
167
23,659,300
10,822
10,715
-107
-1.0
-0.64
0.00
Lincoln
1
,564
124,249,400
36,855
27,482
-9,373
-25.4
-5.99
-0.08
Marshfield
764
57,434,600
24,172
21,935
-2,237
-9.3
-2.93
-0.04
Milladore
690
41,483,100
41,920
40,096
-1,824
-4.4
-2.64
-0.04
Port Edwards
1
,427
81,060,400
53,330
45,527
-7,803
-14.6
-5.47
-0.10
Remington
268
33,545,100
21,860
21,585
-275
-1.3
-1.03
-0.01
Richfield
1
,628
92,504,800
84,741
75,491
-9,250
-10.9
-5.68
-0.10
Rock
855
69,551,300
26,968
24,167
-2,801
-10.4
-3.28
-0.04
Rudolph
1
,028
62,346,000
62,173
58,124
-4,049
-6.5
-3.94
-0.06
Saratoga
5
,142
295,934,400
214,072
169,682
-44,390
-20.7
-8.63
-0.15
Seneca
1
,120
76,775,600
34,700
29,893
-4,807
-13.9
-4.29
-0.06
Sherry
803
58,788,800
41,882
39,411
-2,471
-5.9
-3.08
-0.04
Sigel
1
,051
66,035,100
78,720
74,487
-4,233
-5.4
-4.03
-0.06
Wood
796
63,530,000
40,725
38,297
-2,428
-6.0
-3.05
-0.04

8/7/2019 LFB Distribution of County and Municipal Aid
http://slidepdf.com/reader/full/lfb-distribution-of-county-and-municipal-aid 97/97
ATTACHMENT
ated 2012 County and Municipal Aid Program Reductio
n Under SB 27/AB 40
2010
2011
2012
Estimated Reduction
Equalized
Aid
Estimated
% of 2011
Per
Per $1,000 of
Value
Payment
Aid Payment
Am
ount
Aid Payment
Capita
Equalized Value
$9,464,300
$85,171
$84,746
-
$425
-0.5%
-$1.28
-$0.04
34,017,100
140,752
138,858
-1,894
-1.3
-2.69
-0.06
88,093,400
14,220
11,523
-2,697
-19.0
-3.21
-0.03
50,941,100
66,392
63,765
-2,627
-4.0
-3.17
-0.05
8,739,000
72,013
71,721
-292
-0.4
-1.06
-0.03
107,571,600
207,377
196,620
-10,757
-5.2
-5.92
-0.10
24,809,300
67,397
66,659
-738
-1.1
-1.68
-0.03
26,380,900
136,685
135,378
-1,307
-1.0
-2.24
-0.05
,332,746,600
4,624,559
4,382,900
-241,659
-5.2
-12.64
-0.18
107,213,200
971,960
960,975
-10,985
-1.1
-4.26
-0.10
45,182,300
337,809
334,882
-2,927
-0.9
-3.35
-0.06
,024,089,900
3,935,526
3,745,109
-190,417
-4.8
-10.37
-0.19
4,704,210,200
3,508,912
2,852,949
-655,963
-18.7
-8.78
-0.14
county. The amounts shown are for the entire municipality, as op
posed to the part of the municipality in this county.