leveraging wbi (broker) monitoring - nastel ·
TRANSCRIPT
Capitalware's MQ Technical Conference v2.0.1.4
Leveraging
WBI (Broker)
Monitoring
Copyright © 2014 Nastel Technologies, Inc.
Capitalware's MQ Technical Conference v2.0.1.4
Introduction
WBI (Broker) provides the ability to get considerable data about its operation
and the behavior of your message flows.
This session will cover the various interfaces to request data from the
broker. This will include command line and programming interfaces to
request status information, monitoring data publishing and message flow
events.
By attending this session, you will be able to better understand your broker
operation and function.
Copyright © 2014 Nastel Technologies, Inc.

Capitalware's MQ Technical Conference v2.0.1.4
About the Speaker
Richard Nikula VP of Product Development and Support
Over 20 years experience with MQ, Broker and related technologies
About Nastel Technologies www.nastel.com Founded in 1994
Middleware-centric Application Performance Management software supplier
Core competency : Real-time monitoring and analytics, Messaging Middleware, Java
Application Servers, ESB's and other SOA technologies
Details on our Message Broker solution are here:
http://www.nastel.com/tech/middleware/websphere-message-broker.html
Copyright © 2014 Nastel Technologies, Inc.

Capitalware's MQ Technical Conference v2.0.1.4
Broker Concepts
Copyright © 2014 Nastel Technologies, Inc.

Capitalware's MQ Technical Conference v2.0.1.4
Disclaimers
IBM periodically has changed the name of the Message Broker,
from MQSI to WebSphere Message Broker, WebSphere Business
Integrator, IBM Integration Bus, …
In this session, we are specifically focused on the broker, whatever
you call it…
All topics are applicable to Version 7 and higher
Most examples are from Version 8 but are applicable to Version 9
Some examples included are from Nastel products but there are
several methods to leverage this data and vendor products are not
required.
Copyright © 2014 Nastel Technologies, Inc.
Capitalware's MQ Technical Conference v2.0.1.4
Overview
Agenda
• Introduction to Broker Monitoring
• Resource Statistics
• Flow Statistics
• Broker Tracking
• Using the Statistics to monitor Broker Environments
• Conclusion
Copyright © 2014 Nastel Technologies, Inc.

Capitalware's MQ Technical Conference v2.0.1.4
Key Broker Terms (as People know them)
Broker – Routing and Transformation Engine supporting various protocols
such as http, MQ and files
Execution Group – a grouping of related Message Flows (processes) that
provides isolation, performance allocation, and control
Message Flow – A specific logical flow through the message broker which
may include logic, transformation and routing.
Threads – processing threads allocated to an Execution Group which
execute the message flows
Topic – A hierarchy that describes the context of a specific message
Subscription – A request to receive posts to all or part of a topic hierarchy
Queue Manager – An IBM (WebSphere) MQ service that provides the
underlying technology for Message Broker. Required even if the broker
does not use WMQ Message Flows
Copyright © 2014 Nastel Technologies, Inc.

Capitalware's MQ Technical Conference v2.0.1.4
Simple Example
This is one of the sample message flows that is shipped with the broker,
which has a single input node , one transformation step, and an output. It
also has a potential failure node.
Copyright © 2014 Nastel Technologies, Inc.

Capitalware's MQ Technical Conference v2.0.1.4
This example shows a broker with 3 execution groups, each running a set
of message flows. One of the execution groups is running 2 instances
(threads) of the sample Surfwatch flow, as well as a TextMessage message
flow.
Broker1
Execution Group Other
Execution Group Default
Execution Example
Copyright © 2014 Nastel Technologies, Inc.
Execution Group PagerExecutionGroup
Capitalware's MQ Technical Conference v2.0.1.4
Why Monitor the broker?
“Sub-optimal” configuration
“Sub-optimal” Application Design
Contention for broker resources
Actual usage compared to intended usage
Planning for future growth
Tracking
…
Copyright © 2014 Nastel Technologies, Inc.

Capitalware's MQ Technical Conference v2.0.1.4
Broker Got Monitoring Right Integrated Monitoring
Robust Statistics
Dynamic Activation
Multiple Collection Levels
Consumers Subscribe / Broker Publishes
Basic Monitoring Tools *
Copyright © 2014 Nastel Technologies, Inc.

Capitalware's MQ Technical Conference v2.0.1.4
Broker Statistics
Copyright © 2014 Nastel Technologies, Inc.

Capitalware's MQ Technical Conference v2.0.1.4
Type of Broker Management Data
Resource Statistics Resources used by execution groups
Monitoring Statistics Usage Statistics of execution groups, nodes and threads
Flow Tracking Tracking of execution flow through message flows
Copyright © 2014 Nastel Technologies, Inc.
Capitalware's MQ Technical Conference v2.0.1.4
RESOURCE STATISTICS
Copyright © 2014 Nastel Technologies, Inc.

Capitalware's MQ Technical Conference v2.0.1.4
Broker Resource Statistics
The broker provides detailed statistics
- Base Data - Collection Information
- Extended Data by domain - JVM
- Parsers
- DotNet
- Security
- JMS
- FTE
- JDBC
- Sockets
- Soap
- Specific data for details varies by domain
Copyright © 2014 Nastel Technologies, Inc.
Capitalware's MQ Technical Conference v2.0.1.4
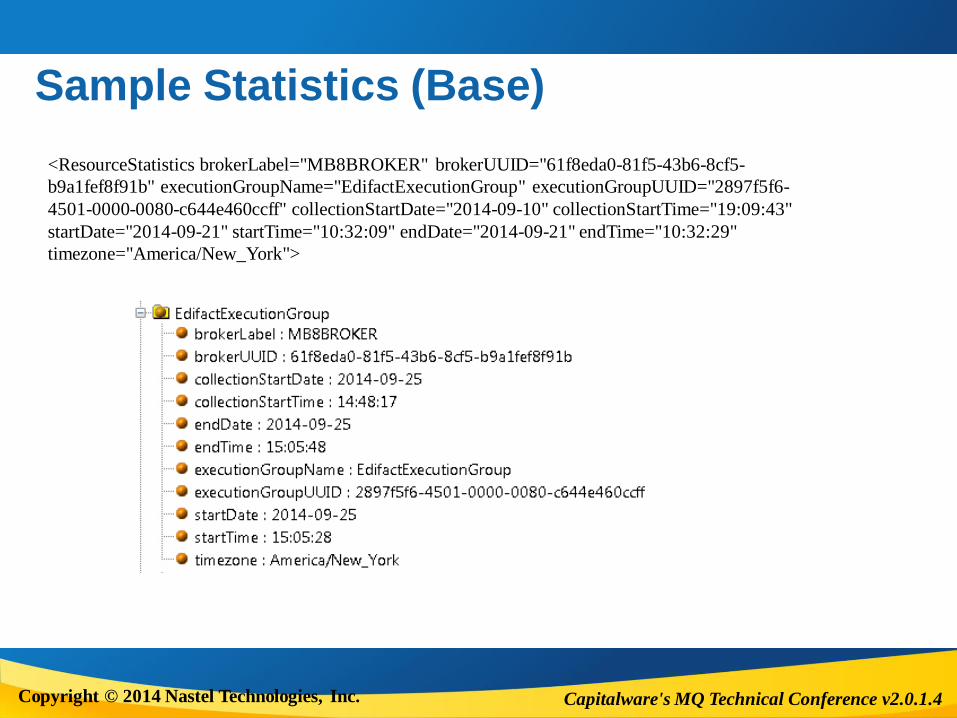
Sample Statistics (Base)
<ResourceStatistics brokerLabel="MB8BROKER" brokerUUID="61f8eda0-81f5-43b6-8cf5-
b9a1fef8f91b" executionGroupName="EdifactExecutionGroup" executionGroupUUID="2897f5f6-
4501-0000-0080-c644e460ccff" collectionStartDate="2014-09-10" collectionStartTime="19:09:43"
startDate="2014-09-21" startTime="10:32:09" endDate="2014-09-21" endTime="10:32:29"
timezone="America/New_York">
Copyright © 2014 Nastel Technologies, Inc.

Capitalware's MQ Technical Conference v2.0.1.4
Sample Statistics (Detail)
<ResourceType name="JVM">
<resourceIdentifier name="summary"
InitialMemoryInMB="32"
UsedMemoryInMB="63"
CommittedMemoryInMB="92"
MaxMemoryInMB="-1"
CumulativeGCTimeInSeconds="0"
CumulativeNumberOfGCCollections="40" />
<resourceIdentifier name="Heap Memory"
InitialMemoryInMB="32"
UsedMemoryInMB="43"
CommittedMemoryInMB="59"
MaxMemoryInMB="256" />
<resourceIdentifier name="Non-Heap Memory"
InitialMemoryInMB="0"
UsedMemoryInMB="20"
CommittedMemoryInMB="33"
MaxMemoryInMB="-1" />
…
Copyright © 2014 Nastel Technologies, Inc.

Capitalware's MQ Technical Conference v2.0.1.4
Activating Resource Statistics mqsichangeresourcestats
Collect for all or specific execution group
Similar commands for distributed and z/OS
Once Executed, set until reset
Collection Interval is fixed at 20 seconds
Copyright © 2014 Nastel Technologies, Inc.

Capitalware's MQ Technical Conference v2.0.1.4
mqsichangeresourcestats Examples
mqsichangeresourcestats Broker -c active
> Activate resource stats data collection for all execution groups
mqsichangeresourcestats Broker -e EGRP -c active
> Activate resource stats data collection for execution group EGRP
mqsichangeresourcestats Broker -c inactive
> Deactivate resource stats for everything
Copyright © 2014 Nastel Technologies, Inc.
Capitalware's MQ Technical Conference v2.0.1.4
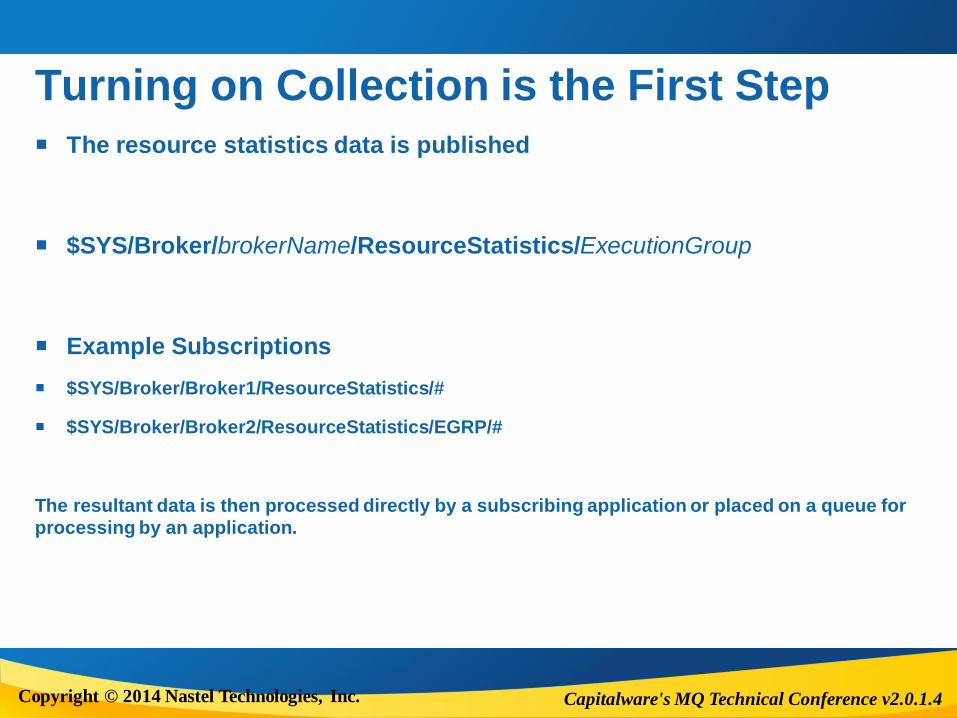
Turning on Collection is the First Step
The resource statistics data is published
$SYS/Broker/brokerName/ResourceStatistics/ExecutionGroup
Example Subscriptions
$SYS/Broker/Broker1/ResourceStatistics/#
$SYS/Broker/Broker2/ResourceStatistics/EGRP/#
The resultant data is then processed directly by a subscribing application or placed on a queue for
processing by an application.
Copyright © 2014 Nastel Technologies, Inc.

Capitalware's MQ Technical Conference v2.0.1.4
Sample Subscription
Sample Broker Subscription
Copyright © 2014 Nastel Technologies, Inc.
Capitalware's MQ Technical Conference v2.0.1.4
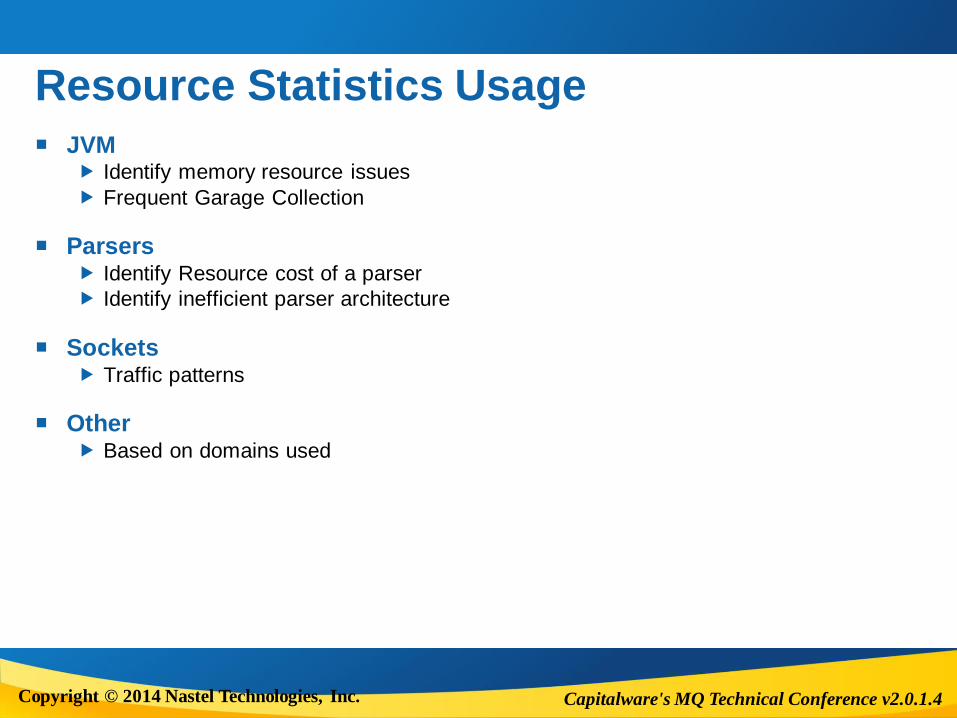
Resource Statistics Usage
JVM Identify memory resource issues
Frequent Garage Collection
Parsers Identify Resource cost of a parser
Identify inefficient parser architecture
Sockets Traffic patterns
Other Based on domains used
Copyright © 2014 Nastel Technologies, Inc.
Capitalware's MQ Technical Conference v2.0.1.4
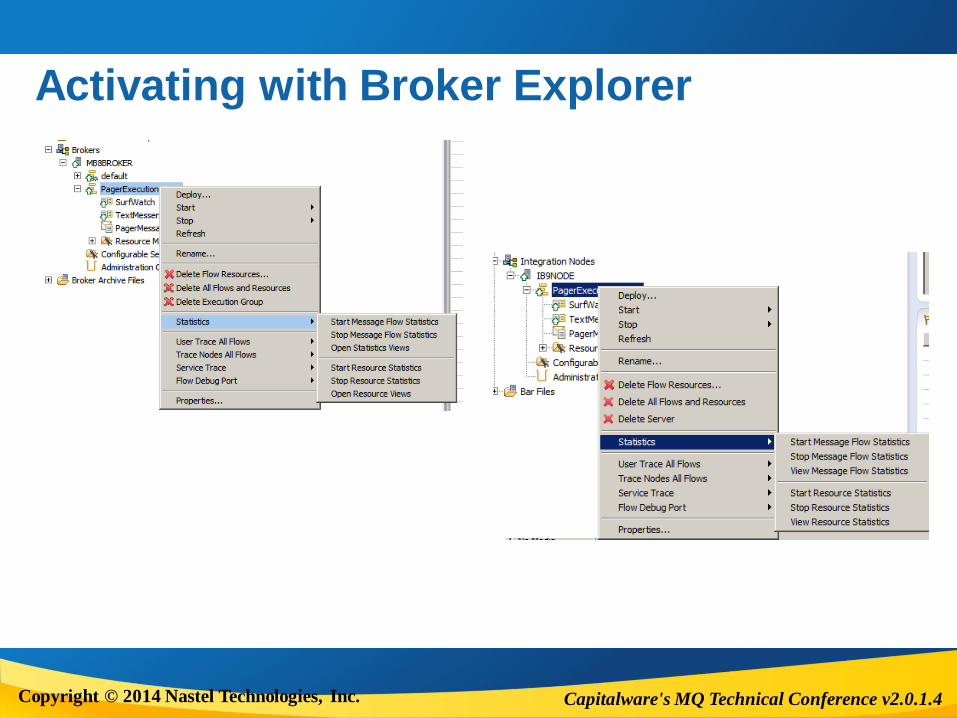
Activating with Broker Explorer
Copyright © 2014 Nastel Technologies, Inc.

Capitalware's MQ Technical Conference v2.0.1.4
Displaying Resource Statistic Charts
Copyright © 2014 Nastel Technologies, Inc.
Capitalware's MQ Technical Conference v2.0.1.4
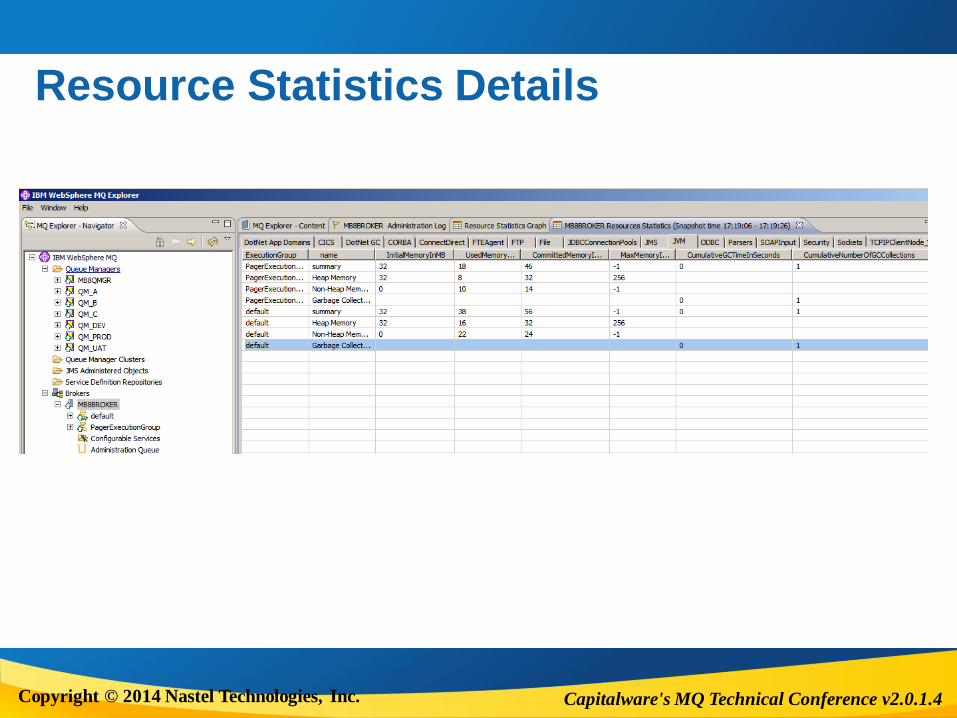
Resource Statistics Details
Copyright © 2014 Nastel Technologies, Inc.

Capitalware's MQ Technical Conference v2.0.1.4
MONITORING STATISTICS
Copyright © 2014 Nastel Technologies, Inc.

Capitalware's MQ Technical Conference v2.0.1.4
Broker Monitoring Statistics
The broker provides detailed statistics
- Message Flow Level (for the flow) - Total Messages Processed
- Total Messages in Error
- CPU Time Spent
- Message Statistics
- Node Level (for each processing node) - Invocations
- CPU Time
- Information
- Thread Level (for each thread) - Messages Processed
- CPU Time Spent
- Message Statistics
Copyright © 2014 Nastel Technologies, Inc.
Capitalware's MQ Technical Conference v2.0.1.4
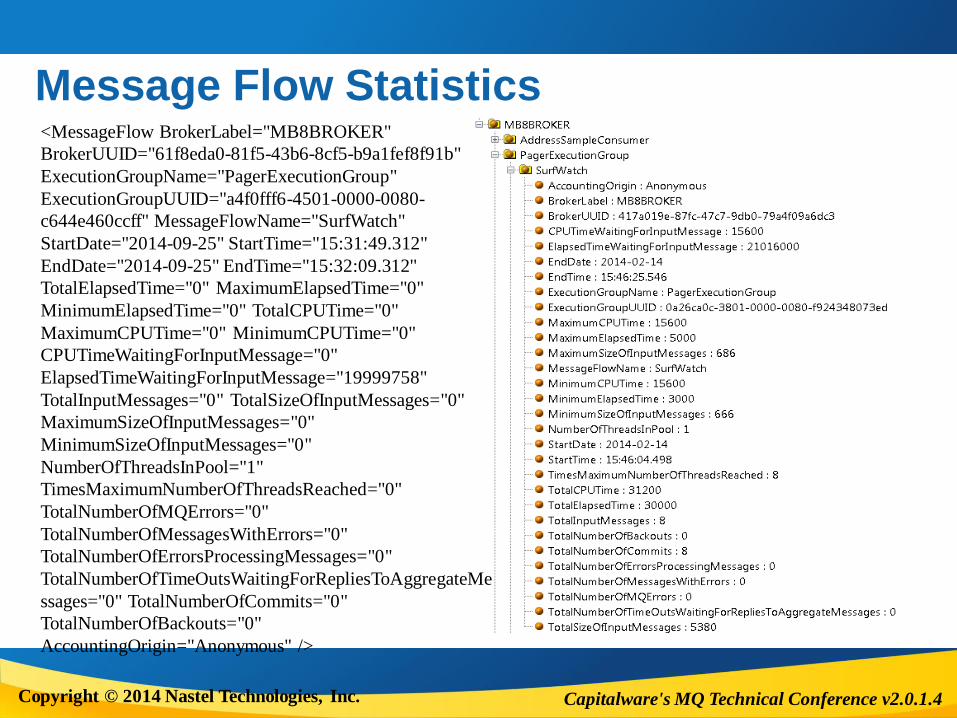
Message Flow Statistics
Copyright © 2014 Nastel Technologies, Inc.
<MessageFlow BrokerLabel="MB8BROKER"
BrokerUUID="61f8eda0-81f5-43b6-8cf5-b9a1fef8f91b"
ExecutionGroupName="PagerExecutionGroup"
ExecutionGroupUUID="a4f0fff6-4501-0000-0080-
c644e460ccff" MessageFlowName="SurfWatch"
StartDate="2014-09-25" StartTime="15:31:49.312"
EndDate="2014-09-25" EndTime="15:32:09.312"
TotalElapsedTime="0" MaximumElapsedTime="0"
MinimumElapsedTime="0" TotalCPUTime="0"
MaximumCPUTime="0" MinimumCPUTime="0"
CPUTimeWaitingForInputMessage="0"
ElapsedTimeWaitingForInputMessage="19999758"
TotalInputMessages="0" TotalSizeOfInputMessages="0"
MaximumSizeOfInputMessages="0"
MinimumSizeOfInputMessages="0"
NumberOfThreadsInPool="1"
TimesMaximumNumberOfThreadsReached="0"
TotalNumberOfMQErrors="0"
TotalNumberOfMessagesWithErrors="0"
TotalNumberOfErrorsProcessingMessages="0"
TotalNumberOfTimeOutsWaitingForRepliesToAggregateMe
ssages="0" TotalNumberOfCommits="0"
TotalNumberOfBackouts="0"
AccountingOrigin="Anonymous" />

Capitalware's MQ Technical Conference v2.0.1.4
Node Statistics
Copyright © 2014 Nastel Technologies, Inc.
<Nodes Number="5">
<NodeStatistics Label="Change The
Message.ComIbmCompute" Type="ComputeNode"
TotalElapsedTime="2724" MaximumElapsedTime="465"
MinimumElapsedTime="448" TotalCPUTime="0"
MaximumCPUTime="0" MinimumCPUTime="0"
CountOfInvocations="6" NumberOfInputTerminals="1"
NumberOfOutputTerminals="6" />
<NodeStatistics Label="Publish Reports.Publish"
Type="PSServiceNode" TotalElapsedTime="4751"
MaximumElapsedTime="808" MinimumElapsedTime="773"
TotalCPUTime="0" MaximumCPUTime="0"
MinimumCPUTime="0" CountOfInvocations="6"
NumberOfInputTerminals="2"
NumberOfOutputTerminals="4" />
<NodeStatistics Label="Publish Reports.Response"
Type="MQOutputNode" TotalElapsedTime="961"
MaximumElapsedTime="167" MinimumElapsedTime="157"
TotalCPUTime="0" MaximumCPUTime="0"
MinimumCPUTime="0" CountOfInvocations="6"
NumberOfInputTerminals="1"
NumberOfOutputTerminals="2" />

Capitalware's MQ Technical Conference v2.0.1.4
Thread Level Statistics
Copyright © 2014 Nastel Technologies, Inc.
<Threads Number="1">
<ThreadStatistics Number="10044"
TotalNumberOfInputMessages="6"
TotalElapsedTime="47679" TotalCPUTime=“15600"
CPUTimeWaitingForInputMessage="0"
ElapsedTimeWaitingForInputMessage="18003043"
TotalSizeOfInputMessages="4013"
MaximumSizeOfInputMessages="674"
MinimumSizeOfInputMessages="666" />
</Threads>

Capitalware's MQ Technical Conference v2.0.1.4
Activating Statistics Collection mqsichangeflowstats
Collect for all or specific flows
Collect Node level statistics (optional)
Collect Thread level statistics (optional)
Similar commands for distributed and z/OS
Once Executed, set until reset
2 forms
- Snapshot – 20 second sample
- Archive – longer term sample (default 60 minutes)
Copyright © 2014 Nastel Technologies, Inc.

Capitalware's MQ Technical Conference v2.0.1.4
mqsichangeflowstats Examples mqsichangeflowstats Broker -s -g -j -c active
> Activate snapshot data collection for all execution groups and flows (with the last options previously set)
mqsichangeflowstats Broker -a -g -j –n basic -c active
> Activate archive data collection for all execution groups and flows including basic node level statistics
mqsichangeflowstats Broker -a -e EGRP -f MyFlow1 -c active -t basic
> Activate archive data collection for execution group EGRP and only flow MyFlow1 include basic thread statistics
mqsichangeflowstats Broker -s -g -j -c inactive
> Deactivate snapshot data collection for everything
Copyright © 2014 Nastel Technologies, Inc.

Capitalware's MQ Technical Conference v2.0.1.4
Some Notable Options
-r Resets the archive interval
-k Application name for fine-grain analysis
-o json Output is sent using JSON format (unique topics)
smf zOS, written as SMF type 117
usertrace written to log files for post processing
xml xml formatted
Copyright © 2014 Nastel Technologies, Inc.

Capitalware's MQ Technical Conference v2.0.1.4
Turning on Collection is the First Step
The statistics data is published
$SYS/Broker/brokerName/StatisticsAccounting/recordType/executionGroupLabel/messageFlowLabel
$SYS/Broker/brokerName/Statistics/JSON/SnapShot/…
Example Subscriptions
$SYS/Broker/Broker1/StatisticsAccounting/#
$SYS/Broker/+/StatisticsAccounting/SnapShot/#
$SYS/Broker/Broker2/StatisticsAccounting/+/EGRP/#
The resultant data is then processed directly by a subscribing application or placed on a queue for
processing by an application.
Copyright © 2014 Nastel Technologies, Inc.
Capitalware's MQ Technical Conference v2.0.1.4
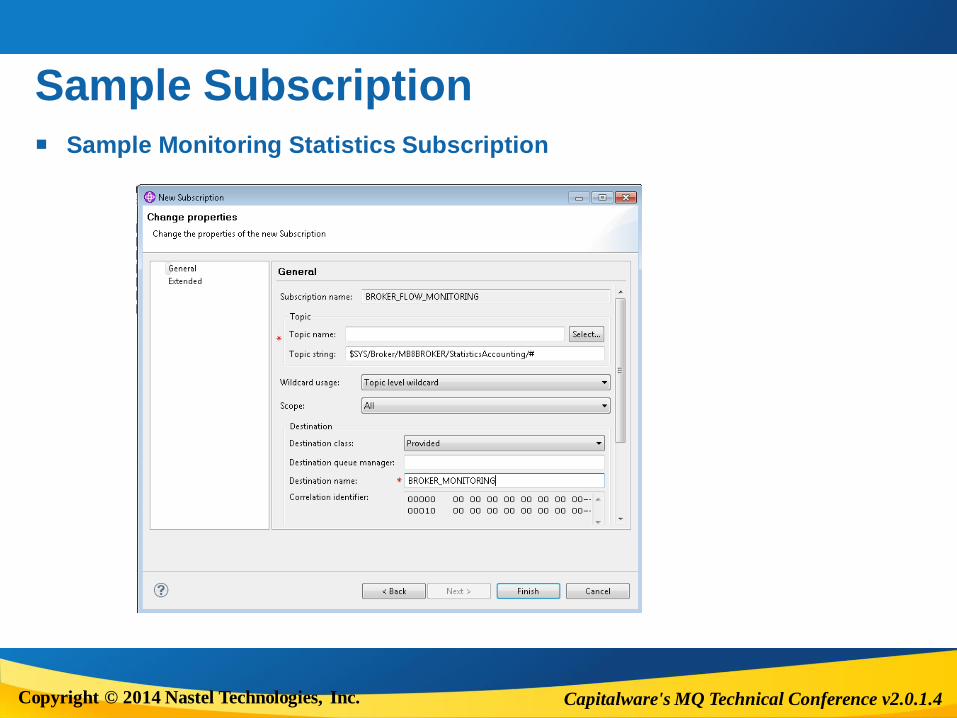
Sample Subscription
Sample Monitoring Statistics Subscription
Copyright © 2014 Nastel Technologies, Inc.

Capitalware's MQ Technical Conference v2.0.1.4
Activating with Broker Explorer
Copyright © 2014 Nastel Technologies, Inc.
Capitalware's MQ Technical Conference v2.0.1.4
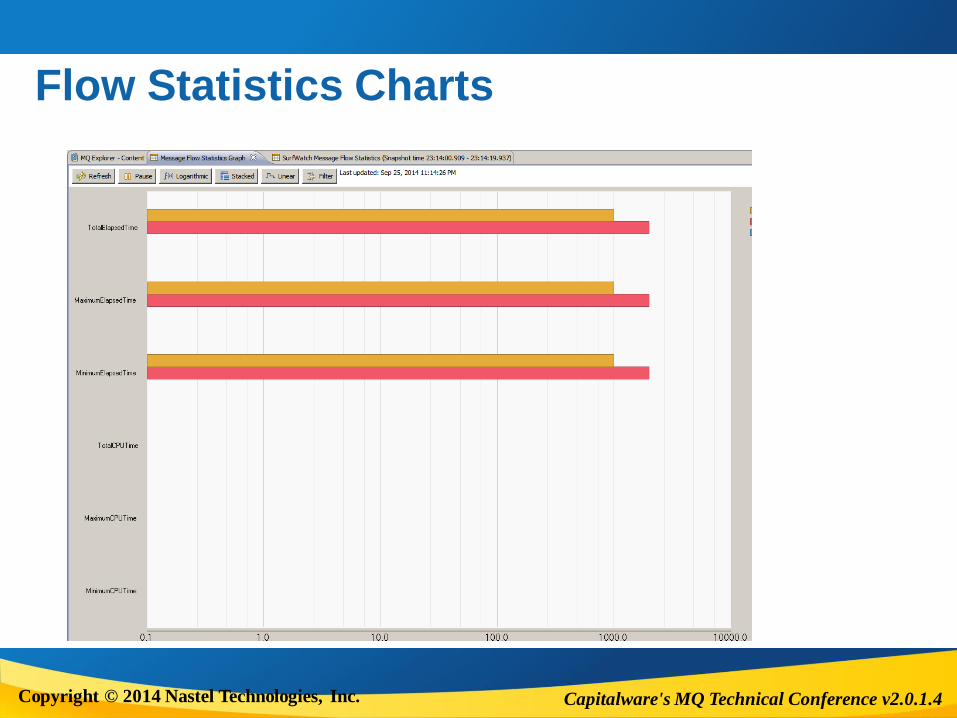
Flow Statistics Charts
Copyright © 2014 Nastel Technologies, Inc.
Capitalware's MQ Technical Conference v2.0.1.4
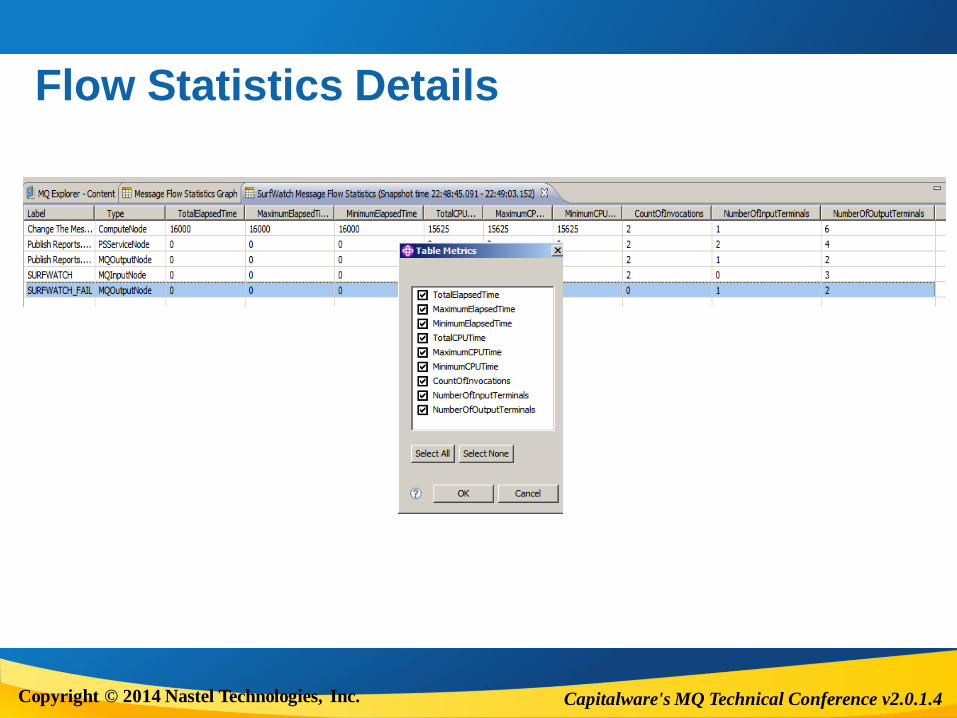
Flow Statistics Details
Copyright © 2014 Nastel Technologies, Inc.

Capitalware's MQ Technical Conference v2.0.1.4
Snapshot to File Snapshot time 2014-09-25 23:13:40.849 - 2014-09-25 23:14:00.909
Broker MB8BROKER
Execution Group PagerExecutionGroup
Flow SurfWatch
Label Type TotalElapsedTime MaximumElapsedTime MinimumElapsedTime TotalCPUTime
MaximumCPUTime MinimumCPUTime CountOfInvocations NumberOfInputTerminals NumberOfOutputTerminals
Change The Message.ComIbmCompute ComputeNode 0 0 0 0 0 0
3 1 6
Publish Reports.Publish PSServiceNode 0 0 0 0 0 0
3 2 4
Publish Reports.Response MQOutputNode 0 0 0 0 0 0
3 1 2
SURFWATCH MQInputNode 0 0 0 0 0 0 3
0 3
SURFWATCH_FAIL MQOutputNode 0 0 0 0 0 0 0
1 2
Snapshot time 2014-09-25 23:14:00.909 - 2014-09-25 23:14:19.937
Broker MB8BROKER
Execution Group PagerExecutionGroup
Flow SurfWatch
Label Type TotalElapsedTime MaximumElapsedTime MinimumElapsedTime TotalCPUTime
MaximumCPUTime MinimumCPUTime CountOfInvocations NumberOfInputTerminals NumberOfOutputTerminals
Change The Message.ComIbmCompute ComputeNode 1000 1000 1000 0 0 0
4 1 6
Publish Reports.Publish PSServiceNode 2000 2000 2000 0 0 0
4 2 4
Publish Reports.Response MQOutputNode 0 0 0 0 0 0
4 1 2
SURFWATCH MQInputNode 1000 1000 1000 0 0 0 4
0 3
SURFWATCH_FAIL MQOutputNode 0 0 0 0 0 0 0
1 2
Copyright © 2014 Nastel Technologies, Inc.

Capitalware's MQ Technical Conference v2.0.1.4
Capture and Display
Via 3rd Party Products
IS03
Web Visualization and Analytics
Copyright © 2014 Nastel Technologies, Inc.

Capitalware's MQ Technical Conference v2.0.1.4
FLOW MONITORING
Copyright © 2014 Nastel Technologies, Inc.

Capitalware's MQ Technical Conference v2.0.1.4
Tracking within the Message Flows
The Broker Supports Tracking within the Message Flows
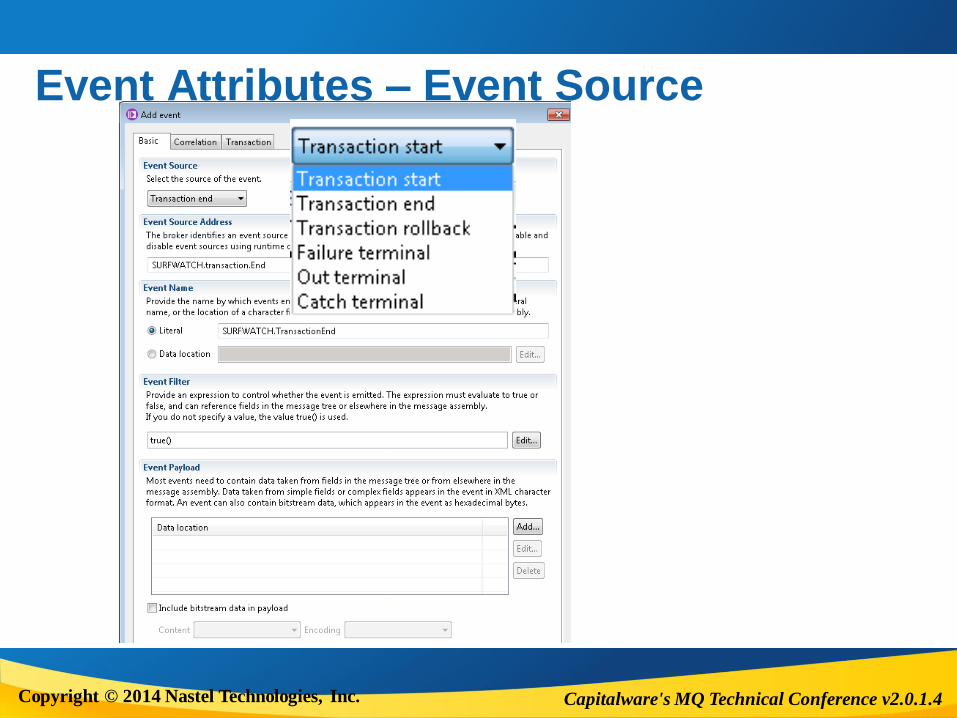
Transaction Start / Stop (default)
See when a given node was processed
See details about the message being processed by the flow
Track message flows in and across brokers
Activated at the Message Flow and Node Level
Whether to collect
Data to Collect
Copyright © 2014 Nastel Technologies, Inc.

Capitalware's MQ Technical Conference v2.0.1.4
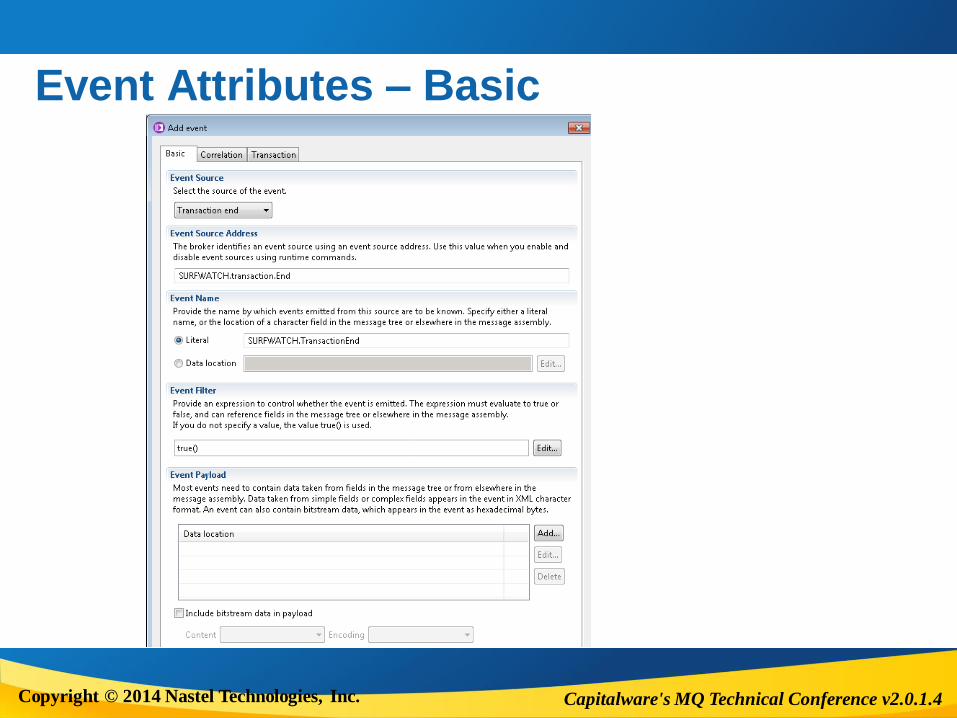
Configuring Message Flow Events
Copyright © 2014 Nastel Technologies, Inc.
Capitalware's MQ Technical Conference v2.0.1.4
Event Attributes – Basic
Copyright © 2014 Nastel Technologies, Inc.
Capitalware's MQ Technical Conference v2.0.1.4
Event Attributes – Event Source
Copyright © 2014 Nastel Technologies, Inc.
Capitalware's MQ Technical Conference v2.0.1.4
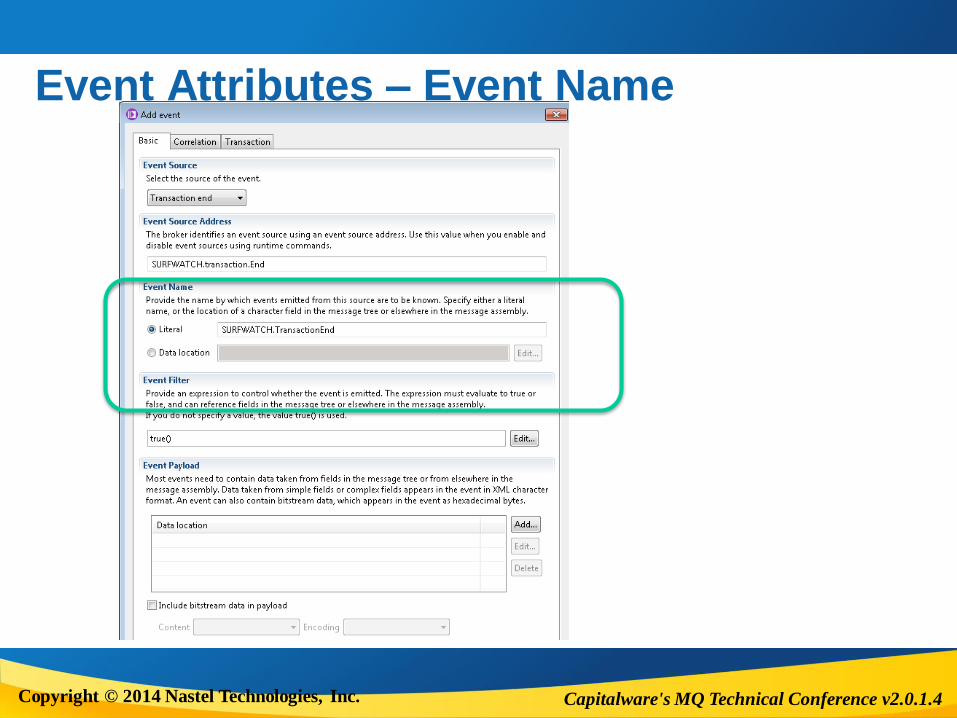
Event Attributes – Event Name
Copyright © 2014 Nastel Technologies, Inc.

Capitalware's MQ Technical Conference v2.0.1.4
Event Attributes – Dynamic Event Name
Copyright © 2014 Nastel Technologies, Inc.

Capitalware's MQ Technical Conference v2.0.1.4
Event Attributes – Event Filter
Copyright © 2014 Nastel Technologies, Inc.

Capitalware's MQ Technical Conference v2.0.1.4
Event Attributes – Event Payload
Copyright © 2014 Nastel Technologies, Inc.
Capitalware's MQ Technical Conference v2.0.1.4
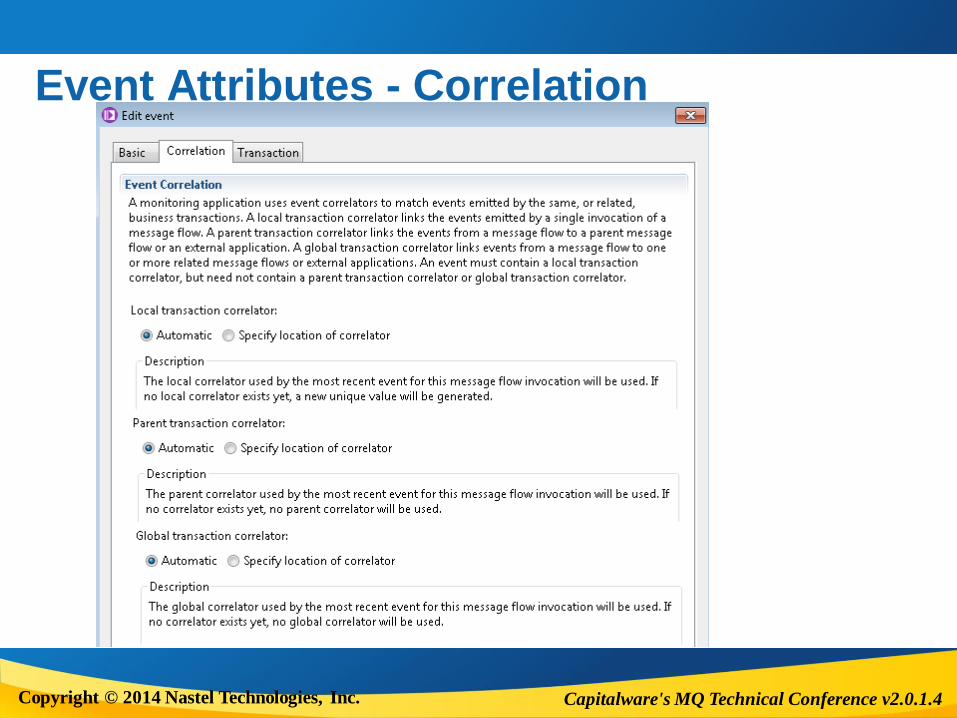
Event Attributes - Correlation
Copyright © 2014 Nastel Technologies, Inc.
Capitalware's MQ Technical Conference v2.0.1.4
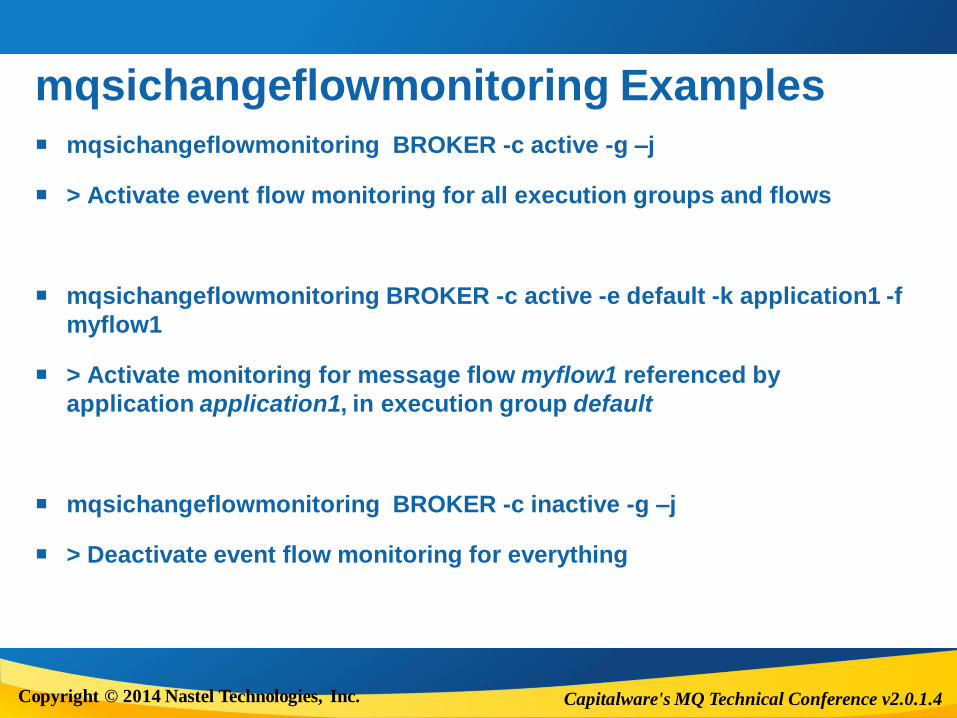
mqsichangeflowmonitoring Examples
mqsichangeflowmonitoring BROKER -c active -g –j
> Activate event flow monitoring for all execution groups and flows
mqsichangeflowmonitoring BROKER -c active -e default -k application1 -f
myflow1
> Activate monitoring for message flow myflow1 referenced by
application application1, in execution group default
mqsichangeflowmonitoring BROKER -c inactive -g –j
> Deactivate event flow monitoring for everything
Copyright © 2014 Nastel Technologies, Inc.

Capitalware's MQ Technical Conference v2.0.1.4
The statistics Tracking data is published
$SYS/Broker/<brokerName>/Monitoring/<executionGroupName>/<flowName>
Example Subscriptions
$SYS/Broker/Broker1/Monitoring/#
$SYS/Broker/+/Monitoring/#
$SYS/Broker/Broker2/Monitoring/EGRP/Flow1
The resultant data is then processed directly by a subscribing application or placed on a queue for processing by an
application.
Copyright © 2014 Nastel Technologies, Inc.
Getting Tracking Data

Capitalware's MQ Technical Conference v2.0.1.4
Tracking Data
<wmb:event xmlns:wmb="http://www.ibm.com/xmlns/prod/websphere/messagebroker/6.1.0/monitoring/event">
<wmb:eventPointData>
<wmb:eventData wmb:productVersion="8001" wmb:eventSchemaVersion="6.1.0.2">
<wmb:eventIdentity wmb:eventName="transactionStart" />
<wmb:eventSequence wmb:creationTime="2014-09-25T21:06:10.008Z" wmb:counter="1" />
<wmb:eventCorrelation wmb:localTransactionId="414d51204d4238514d47522020202020bf172454201458fe"
wmb:parentTransactionId="" wmb:globalTransactionId="" />
</wmb:eventData>
<wmb:messageFlowData>
<wmb:broker wmb:name="MB8BROKER" wmb:UUID="61f8eda0-81f5-43b6-8cf5-b9a1fef8f91b" />
<wmb:executionGroup wmb:name="PagerExecutionGroup"
wmb:UUID="a4f0fff6-4501-0000-0080-c644e460ccff" />
<wmb:messageFlow wmb:uniqueFlowName="MB8BROKER.PagerExecutionGroup.SurfWatch"
wmb:name="SurfWatch" wmb:UUID="6c0000f7-4501-0000-0080-d6b3e1d5c115"
wmb:threadId="10044" />
<wmb:node wmb:nodeLabel="SURFWATCH" wmb:nodeType="ComIbmMQInputNode"
wmb:detail="SURFWATCH" />
</wmb:messageFlowData>
</wmb:eventPointData>
</wmb:event>
Copyright © 2014 Nastel Technologies, Inc.

Capitalware's MQ Technical Conference v2.0.1.4
Tracking Data
<wmb:event
xmlns:wmb="http://www.ibm.com/xmlns/prod/websphere/messagebroker/6.1.0/monitoring/event">
<wmb:eventPointData>
<wmb:eventData wmb:productVersion="8001" wmb:eventSchemaVersion="6.1.0.2">
<wmb:eventIdentity wmb:eventName="transactionEnd" />
<wmb:eventSequence wmb:creationTime="2014-09-25T21:06:48.273998Z" wmb:counter="2" />
<wmb:eventCorrelation wmb:localTransactionId=" 414d51204d4238514d47522020202020bf172454201458fe "
wmb:parentTransactionId="" wmb:globalTransactionId="" />
</wmb:eventData>
<wmb:messageFlowData>
<wmb:broker wmb:name="MB8BROKER" wmb:UUID="61f8eda0-81f5-43b6-8cf5-b9a1fef8f91b" />
<wmb:executionGroup wmb:name="PagerExecutionGroup"
wmb:UUID="a4f0fff6-4501-0000-0080-c644e460ccff" />
<wmb:messageFlow wmb:uniqueFlowName="MB8BROKER.PagerExecutionGroup.SurfWatch"
wmb:name="SurfWatch" wmb:UUID="6c0000f7-4501-0000-0080-d6b3e1d5c115"
wmb:threadId="10044" />
<wmb:node wmb:nodeLabel="SURFWATCH" wmb:nodeType="ComIbmMQInputNode"
wmb:detail="SURFWATCH" />
</wmb:messageFlowData>
</wmb:eventPointData>
</wmb:event>
Copyright © 2014 Nastel Technologies, Inc.
Capitalware's MQ Technical Conference v2.0.1.4
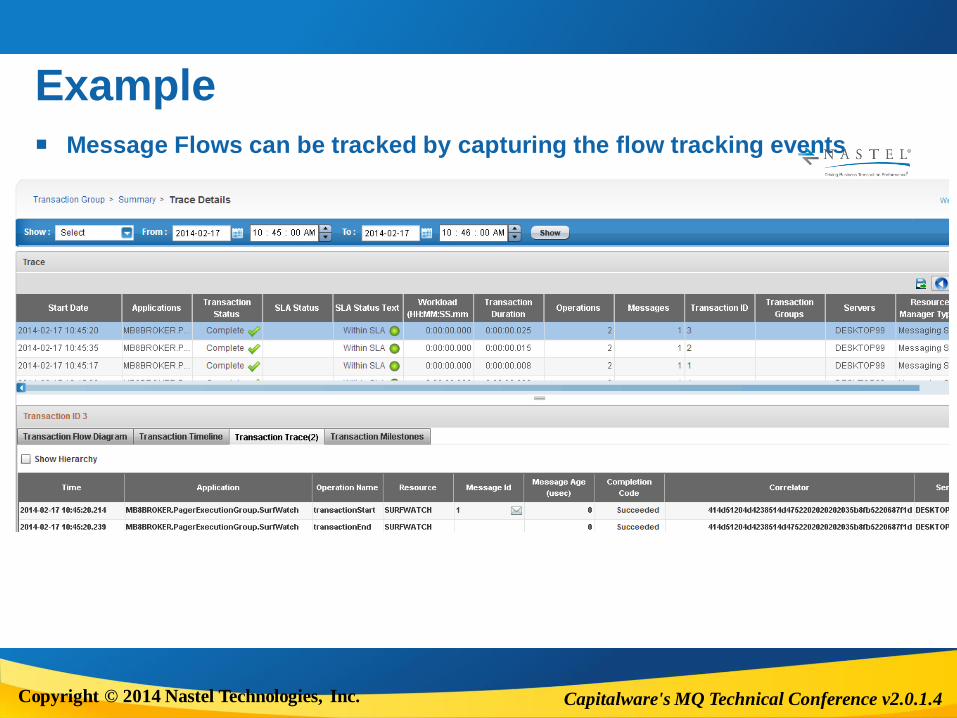
Example
Message Flows can be tracked by capturing the flow tracking events
Copyright © 2014 Nastel Technologies, Inc.
Capitalware's MQ Technical Conference v2.0.1.4
A FEW RELATED ITEMS
Copyright © 2014 Nastel Technologies, Inc.

Capitalware's MQ Technical Conference v2.0.1.4
Activity Log
A Useful related capability
Copyright © 2014 Nastel Technologies, Inc.
Capitalware's MQ Technical Conference v2.0.1.4
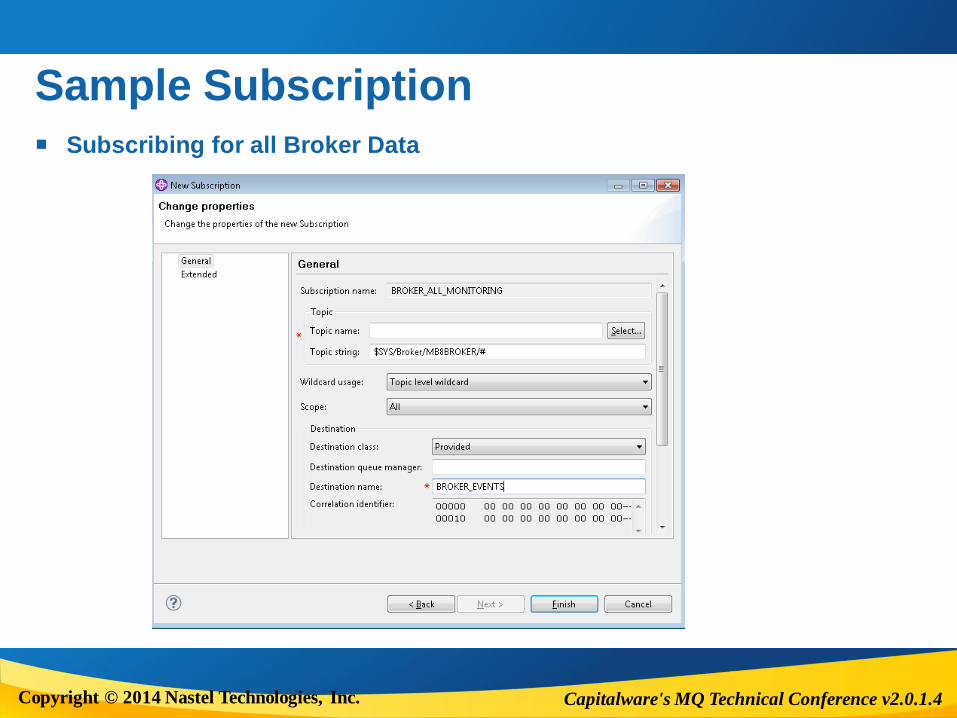
Sample Subscription
Subscribing for all Broker Data
Copyright © 2014 Nastel Technologies, Inc.

Capitalware's MQ Technical Conference v2.0.1.4
Bad Things Can Happen
Copyright © 2014 Nastel Technologies, Inc.

Capitalware's MQ Technical Conference v2.0.1.4
SUMMARY
Copyright © 2014 Nastel Technologies, Inc.

Capitalware's MQ Technical Conference v2.0.1.4
Where to Start
Resource Statistics Identify resource usage
Flow Statistics How Broker is being used
Flow Tracking Advanced analysis
Special use cases (audit)
Other sources
- Session “Performance Considerations for IBM MQ and IBM Integration
Bus”
- Redbooks/Web Sessions
Copyright © 2014 Nastel Technologies, Inc.

Capitalware's MQ Technical Conference v2.0.1.4
Summary
• Message Broker provides a wealth of statistics and performance data
• Collection is an integrated component of the broker
• You can select the level of data collection required
• Tracking data can be used to augment the statistical data
Copyright © 2014 Nastel Technologies, Inc.
Capitalware's MQ Technical Conference v2.0.1.4
Questions & Answers
Copyright © 2014 Nastel Technologies, Inc.