leveraging time for school equity time for school equity: indicators to measure ... jaime l. del...
TRANSCRIPT
Leveraging Time
for School Equity:
Indicators to Measure
More and Better
Learning Time

The Annenberg Institute for School Reformwould like to thank the Institute for Democracy,Education, and Access (IDEA) at the Universityof California, Los Angeles, for their partnershipin the development of this report and frameworkand their helpful suggestions throughout theprocess. We are also grateful to colleagues at:National Education Policy Center at the Uni-versity of Colorado, Boulder; Citizen Schools;the Coalition for Community Schools at theInstitute for Education Leadership; ConnectEd;ExpandED Schools by TASC; the Ford Founda-tion; Generation Schools Network; the NationalCenter for Community Schools at the Children’sAid Society; the National Center on Time andLearning; New York City Public School 186;Oakland Unified School District; the PromiseNeighborhoods Institute at PolicyLink; SouthBay Community Services; California Commu-nity Foundation; Chicago Community Trust;Hartford Foundation for Public Giving; NewarkTrust for Education; Rochester Area Commu-nity Foundation; Rose Community Foundation;Skillman Foundation; Abbott Leadership Insti-tute; Alliance for a Better Community; Alliancefor Quality Education; Community Coalition;InnerCity Struggle; New York City Coalition forEducational Justice; Padres Unidos; SouthwestTurn; and Together Colorado for taking thetime to offer extensive feedback on this frame-work.
This work was made possible by the generoussupport of the Ford Foundation.
title Leveraging Time for Equity: Indicators toMeasure More and Better Learning Time
authors Jaime L. Del Razo, Marisa Saunders, Michelle Renée, Ruth M. López, Kerri Ullucci
contributing editors Warren Simmons, Margaret Balch-Gonzalez,Rosann Tung, Joanna Geller, Jaein Lee Herrick
suggested citation Del Razo, J. L., M. Saunders, M. Renée, R. M. López, and K. Ullucci. 2014. Leveraging Time for Equity: Indicators to MeasureMore and Better Learning Time. Providence, RI:Annenberg Institute for School Reform, BrownUniversity.
graphic design Haewon M. Kim
cover and spot illustrations Modification of original design by freepik.com
© 2014 Annenberg Institute for School Reform, Brown University
Acknowledgments

4 Introduction
Why Develop a Framework of Indicators? ....................................................................4
Beyond Standardized Test Scores: An Evolving, Formative Tool ................................ 5
About This Report ......................................................................................................... 5
6 About the More and Better Learning Time Initiative
Educational Equity at the Center .................................................................................. 7
Guiding Principles: A Cross-Sector Ecosystem for Equitable Reform ....................... 8
10 Building a Shared Theory of Action
The Limits of Traditional Education Indicators: What the Research Says ............... 13
A Multi-dimensional Framework as a Solution .......................................................... 15
16 MBLT Indicators Framework
Levels of Analysis: Student, School, System ............................................................... 17
Criteria for Selecting Indicators .................................................................................. 18
Getting to This Framework ........................................................................................ 18
More and Better Learning Time Indicators: Summary .............................................. 20
1. Creating and Sustaining the Conditions for More and Better Learning Time ..... 22
2. Ensuring Equitable Access to and Implementation of More and Better Learning Time ........................................................................................................ 26
3. Preparing Students for College, Career, and Civic Life ........................................ 30
4. Scaling Up: Making More and Better Learning Time the “New Normal” ........... 33
34 Conclusion
35 References
Contents

4
Leveraging
Tim
e for Sc
hool Equ
ity: Ind
icators to M
easu
re M
ore an
d Better Le
arning
Tim
e
he More and Better Learning Time(MBLT) initiative seeks “to reinvent pub-lic schools through more and better
learning time in neighborhoods of concentratedpoverty, so that students are prepared equitablyfor college, career, and civic participation.”1 Theinitiative goes beyond simply adding time to theschool day and year to ensure that the use oftime (new and existing) becomes a lever forimproving educational opportunities for stu-dents in the nation’s most underserved schoolsystems. The MBLT initiative defines a set ofguiding principles that ensures that equity iscentral to implementation.
The Ford Foundation envisions this approachbecoming the “new normal” for schools acrossthe nation. To support these goals, Ford fundsefforts to develop scalable program designs,build a body of powerful evidence, strengthensystem conditions, and leverage communitycapacity in six urban centers that make up theMBLT sites – Los Angeles, Denver, Detroit,Chicago, Newark, and Rochester – as well asstatewide and national initiatives.
The Annenberg Institute for School Reform(AISR) at Brown University, with support fromthe Institute for Democracy, Education, andAccess (IDEA) at the University of California,Los Angeles, has developed an indicators frame-work that captures the complexity of implement-ing such an ambitious initiative. With inputfrom model developers, community organizers,and other stakeholders working with the MBLTsites, we developed a multi-layered framework ofMBLT indicators to track multiple measures ofprogress toward increasing educational opportu-nity and improving outcomes for students andcommunities.
The indicators are organized into four majorcategories:
1. Creating and Sustaining the Conditions forMore and Better Learning Time
2. Ensuring Equitable Access to and Implemen-tation of More and Better Learning Time
3. Preparing Students for College, Career, and Civic Life
4. Scaling Up: Making More and Better Learn-ing Time the “New Normal”
Why Develop a Framework of Indicators?Education indicators are “yardsticks” that caninform a system by highlighting areas in need ofdevelopment as well as areas that have experi-enced growth and improvements. According toShavelson, McDonnell, and Oakes (1991), “Agood education indicator system is expected toprovide accurate and precise information to illu-minate the condition of education and con-tribute to its improvement.” Creating suchmeasures and collecting the relevant data acrossthe MBLT initiative has these benefits:
• Indicators help illustrate the core values and
goals of the initiative to grantees and the edu-cation field as a whole.
1 See www.fordfoundation.org/issues/educational-opportunity-
and-scholarship/ more-and-better-learning-time.
T
Introduction

Annenberg Institute for School Reform at Brown University | 5
• Indicators help define, clarify, and measure abroad range of educational conditions andoutcomes that are possible in the implemen-tation of MBLT.
• Indicators can offer timely information thateducators, leaders, and community memberscan use to understand and improve practice.
• Indicators provide key stakeholders and thepublic with an understanding of whether andhow the initiative is effecting change acrossseveral important dimensions.
Beyond Standardized Test Scores: An Evolving, Formative ToolSchools and student learning are complex. Usingstandardized student test scores as the sole meas-ure of the impact of policies and practices is notenough to capture that complexity: understand-ing school and student achievement requiresmultiple measures that take into account manydimensions of students’ learning and prepared-ness to learn.
The indicators framework described in thisreport intentionally confronts the notion that astudent’s or school’s needs, challenges, and suc-cesses can be relegated to a single numerical sta-tistic – or even a handful of narrowly definedstatistics. Instead, by looking across multipleindicators, this framework aims to provide adeeper understanding of how the MBLT initia-tive influences students’ lives, school policy, andpublic opinion.
By providing new and alternative ways of meas-uring what matters for student learning and taking a reform to scale (Coburn 2003), thesemulti-layered indicators will allow sites tobroaden their understanding of what makesmore and better learning time programs effec-tive and will inform and influence the design of
research and evaluation of their improvementefforts. Rather than create a traditional summa-tive evaluation and externally imposed monitor-ing plan, we built a living framework that canevolve as grantees learn, improve, and share.Where possible, we built on existing work –both from indicators of MBLT already beingcollected and from reliable indicators created for other complex, multi-sector education initiatives.
Together, these indicators offer a comprehen-sive, rich, and meaningful look into the complexwork of educating youth in high-poverty com-munities. They provide a way for MBLT systemsand programs to chart their successes and deter-mine areas for improvement, as well as a way forschool models to determine if they are meetingtheir goals in line with the MBLT principles.
While the primary goal of the MBLT indicatorproject is to help document the work andprogress of districts, schools, and communitygroups currently at work to implement theMBLT initiative, the indicators can also con-tribute to the work of a wide range of practition-ers, community members, and policymakers.
About This ReportLeveraging Time for Equity is grounded in thework of the MBLT field, extensive research oneducation reform and indicators, and a commit-ment to social and educational equity for all.The report begins with an introduction to thegoals and design of the MBLT initiative in thesection “About the More and Better LearningTime Initiative.”
The section “Building a Shared Theory ofAction” discusses what factors guided the devel-opment of the indicator framework. In particu-lar, we share an approach that highlights thecollaborative efforts of multiple actors that needto engage in the work to reach scale. This sec-

6
Leveraging
Tim
e for Sc
hool Equ
ity: Ind
icators to M
easu
re M
ore an
d Better Le
arning
Tim
e
tion includes a review of existing research sup-porting the use of multiple educational measure-ments and evaluations in place of the traditionalsingle assessments.
The “MBLT Indicators Framework” sectionintroduces the indicators. The section outlinesour process for producing a parsimonious list of useful MBLT indicators and discusses whyindicators are needed at three levels – student,school, and system. The section continues withthe heart of this report: a description of indica-tors that align with MBLT principles and goals.This report will be accompanied by a website,due to launch in fall 2014, that will offer addi-tional information, tools, and resources.
Leveraging Time for Equity is a collaborative project and is the result of successful efforts inengaging different entities involved in the imple-mentation of MBLT – researchers, schooldesigners, community organizers, and localfunding partners – to reflect on and refineMBLT indicators. The report has evolved asthose involved in implementing and supportingthe MBLT initiative have reviewed the frame-work, offered feedback, and demonstrated how itcan be adapted or augmented to make it mostuseful to the field.
he MBLT initiative is grounded in thebelief that an expanded and redesignedschool day and year can provide students
from low-income backgrounds with an opportu-nity to master the core academic subjects, engageand access a broad and well-rounded curriculum,and receive needed individualized supports andattention. This approach can also provide teach-ers, school leaders, and staff with additional timeto collaborate, learn, and improve school struc-tures and curriculum.
Providing “more and better learning time” caninclude increasing the time for learning at schoolsby adding days to the school year or time to each school day or both. Equally important, theMBLT initiative also attends to the quality ofhow new and existing time is spent. As one vet-eran teacher who is participating in an MBLTprogram said, “Quantity is great, if you have thequality to back it up” (Rich 2012). MBLTapproaches restructure how time is used duringthe school day through innovative structures likeoff-campus student internships, a second shift forteachers, or strategic partnerships with otherpublic agencies or community organizations to create high-quality teaching and learningopportunities.
T
About the More and Better
Learning Time Initiative
Annenberg Institute for School Reform at Brown University | 7
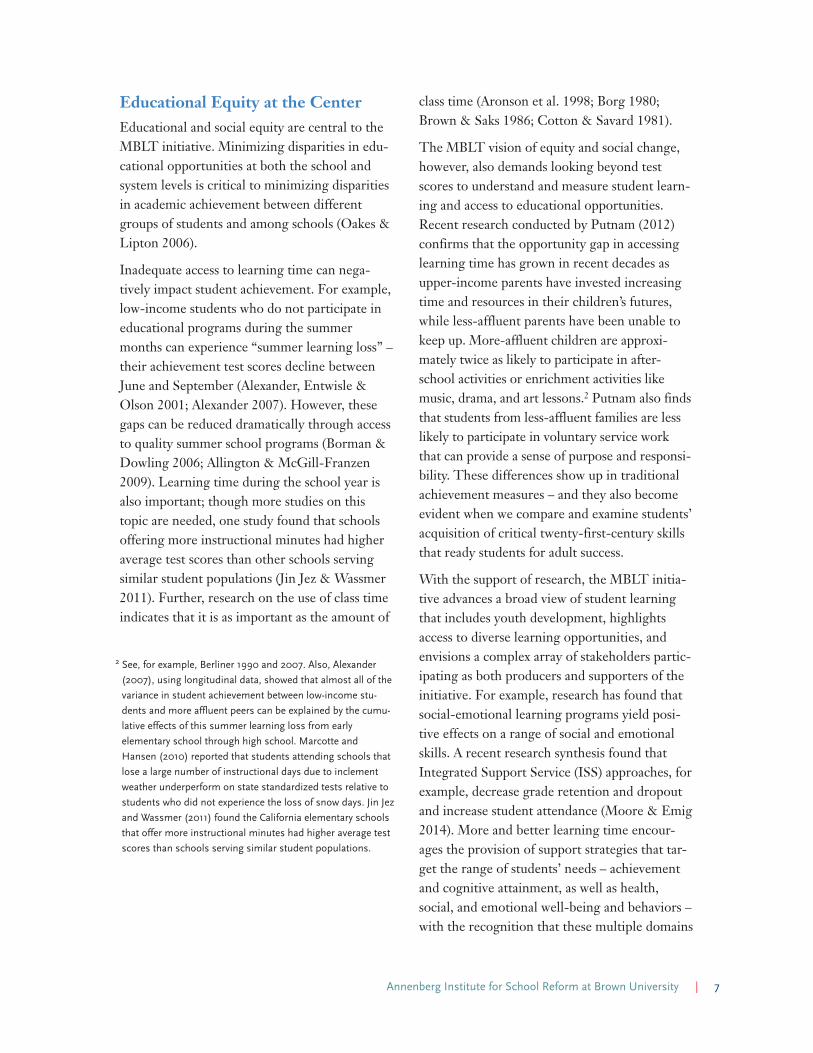
Educational Equity at the CenterEducational and social equity are central to theMBLT initiative. Minimizing disparities in edu-cational opportunities at both the school andsystem levels is critical to minimizing disparitiesin academic achievement between differentgroups of students and among schools (Oakes &Lipton 2006).
Inadequate access to learning time can nega-tively impact student achievement. For example,low-income students who do not participate ineducational programs during the summermonths can experience “summer learning loss” –their achievement test scores decline betweenJune and September (Alexander, Entwisle &Olson 2001; Alexander 2007). However, thesegaps can be reduced dramatically through accessto quality summer school programs (Borman &Dowling 2006; Allington & McGill-Franzen2009). Learning time during the school year isalso important; though more studies on thistopic are needed, one study found that schoolsoffering more instructional minutes had higheraverage test scores than other schools servingsimilar student populations (Jin Jez & Wassmer2011). Further, research on the use of class timeindicates that it is as important as the amount of
class time (Aronson et al. 1998; Borg 1980;Brown & Saks 1986; Cotton & Savard 1981).
The MBLT vision of equity and social change,however, also demands looking beyond testscores to understand and measure student learn-ing and access to educational opportunities.Recent research conducted by Putnam (2012)confirms that the opportunity gap in accessinglearning time has grown in recent decades asupper-income parents have invested increasingtime and resources in their children’s futures,while less-affluent parents have been unable tokeep up. More-affluent children are approxi-mately twice as likely to participate in after-school activities or enrichment activities likemusic, drama, and art lessons.2 Putnam also findsthat students from less-affluent families are lesslikely to participate in voluntary service workthat can provide a sense of purpose and responsi-bility. These differences show up in traditionalachievement measures – and they also becomeevident when we compare and examine students’acquisition of critical twenty-first-century skillsthat ready students for adult success.
With the support of research, the MBLT initia-tive advances a broad view of student learningthat includes youth development, highlightsaccess to diverse learning opportunities, andenvisions a complex array of stakeholders partic-ipating as both producers and supporters of theinitiative. For example, research has found thatsocial-emotional learning programs yield posi-tive effects on a range of social and emotionalskills. A recent research synthesis found thatIntegrated Support Service (ISS) approaches, forexample, decrease grade retention and dropoutand increase student attendance (Moore & Emig2014). More and better learning time encour-ages the provision of support strategies that tar-get the range of students’ needs – achievementand cognitive attainment, as well as health,social, and emotional well-being and behaviors –with the recognition that these multiple domains
2 See, for example, Berliner 1990 and 2007. Also, Alexander
(2007), using longitudinal data, showed that almost all of the
variance in student achievement between low-income stu-
dents and more affluent peers can be explained by the cumu-
lative effects of this summer learning loss from early
elementary school through high school. Marcotte and
Hansen (2010) reported that students attending schools that
lose a large number of instructional days due to inclement
weather underperform on state standardized tests relative to
students who did not experience the loss of snow days. Jin Jez
and Wassmer (2011) found the California elementary schools
that offer more instructional minutes had higher average test
scores than schools serving similar student populations.
8
Leveraging
Tim
e for Sc
hool Equ
ity: Ind
icators to M
easu
re M
ore an
d Better Le
arning
Tim
e
are interrelated and that success in one domaincan contribute to success in another (Moore &Emig 2014).
The MBLT indicator framework encompassesthis broader understanding and captures the roleof schools and community partners in ensuringthat students have access to the high-qualitylearning opportunities they need to becomewell-rounded young adults ready for college,well-paid careers, and civic life. When schoolsinclude more and better time for students tolearn and for teachers to teach, they can achievetheir mission of providing all students with anengaging and relevant education.
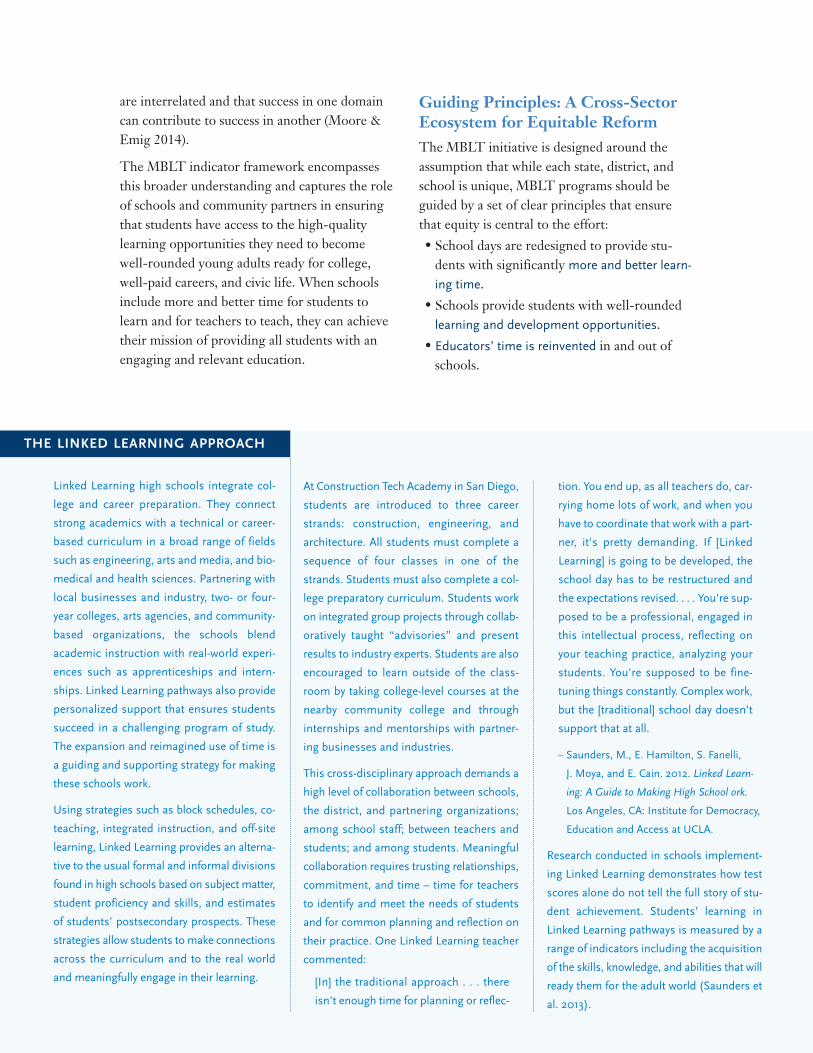
Guiding Principles: A Cross-SectorEcosystem for Equitable ReformThe MBLT initiative is designed around theassumption that while each state, district, andschool is unique, MBLT programs should beguided by a set of clear principles that ensurethat equity is central to the effort:
• School days are redesigned to provide stu-dents with significantly more and better learn-
ing time.
• Schools provide students with well-roundedlearning and development opportunities.
• Educators’ time is reinvented in and out ofschools.
Linked Learning high schools integrate col-
lege and career preparation. They connect
strong academics with a technical or career-
based curriculum in a broad range of fields
such as engineering, arts and media, and bio-
medical and health sciences. Partnering with
local businesses and industry, two- or four-
year colleges, arts agencies, and community-
based organizations, the schools blend
academic instruction with real-world experi-
ences such as apprenticeships and intern-
ships. Linked Learning pathways also provide
personalized support that ensures students
succeed in a challenging program of study.
The expansion and reimagined use of time is
a guiding and supporting strategy for making
these schools work.
Using strategies such as block schedules, co-
teaching, integrated instruction, and off-site
learning, Linked Learning provides an alterna-
tive to the usual formal and informal divisions
found in high schools based on subject matter,
student proficiency and skills, and estimates
of students’ postsecondary prospects. These
strategies allow students to make connections
across the curriculum and to the real world
and meaningfully engage in their learning.
At Construction Tech Academy in San Diego,
students are introduced to three career
strands: construction, engineering, and
architecture. All students must complete a
sequence of four classes in one of the
strands. Students must also complete a col-
lege preparatory curriculum. Students work
on integrated group projects through collab-
oratively taught “advisories” and present
results to industry experts. Students are also
encouraged to learn outside of the class-
room by taking college-level courses at the
nearby community college and through
internships and mentorships with partner-
ing businesses and industries.
This cross-disciplinary approach demands a
high level of collaboration between schools,
the district, and partnering organizations;
among school staff; between teachers and
students; and among students. Meaningful
collaboration requires trusting relationships,
commitment, and time – time for teachers
to identify and meet the needs of students
and for common planning and reflection on
their practice. One Linked Learning teacher
commented:
[In] the traditional approach . . . there
isn't enough time for planning or reflec-
tion. You end up, as all teachers do, car-
rying home lots of work, and when you
have to coordinate that work with a part-
ner, it's pretty demanding. If [Linked
Learning] is going to be developed, the
school day has to be restructured and
the expectations revised. . . . You're sup-
posed to be a professional, engaged in
this intellectual process, reflecting on
your teaching practice, analyzing your
students. You're supposed to be fine-
tuning things constantly. Complex work,
but the [traditional] school day doesn't
support that at all.
– Saunders, M., E. Hamilton, S. Fanelli,
J. Moya, and E. Cain. 2012. Linked Learn-
ing: A Guide to Making High School ork.
Los Angeles, CA: Institute for Democracy,
Education and Access at UCLA.
Research conducted in schools implement-
ing Linked Learning demonstrates how test
scores alone do not tell the full story of stu-
dent achievement. Students’ learning in
Linked Learning pathways is measured by a
range of indicators including the acquisition
of the skills, knowledge, and abilities that will
ready them for the adult world (Saunders et
al. 2013).
THE LINKED LEARNING APPROACH

Annenberg Institute for School Reform at Brown University | 9
• Programs use a whole-school/every-child
approach.
• Schools engage families and integrate com-
munity partnerships.
To apply these principles, multiple stakeholderswork together in an ecosystem that ensures equi-table implementation of MBLT. School design-ers develop and implement effective and scalableschool designs; researchers and journalistsdevelop and communicate compelling ideas andevidence; support and advocacy from grasstopsand grassroots organizations create public sup-port and political will; and policymakers andelected officials remove systemic barriers tochange.
This ecosystem of equity reform reflects theunderstanding that schools do not operate in avacuum, but rather exist and coexist within thelocal, state, and national policies and practicesthat impact how students learn and grow (Sim-mons 2007). To move toward educational equity,the components of the ecosystem must worktogether in a principled and coordinated wayacross sectors and issues. Building and sustainingcapacity goes beyond securing additional fund-ing for schools or supporting new policies andpractices; it also entails revitalizing communitiesso that families and entire neighborhoods canoffer necessary supports to ensure student suc-cess (Anyon 2005).
The Generation Schools Network in New York
City and Denver staggers teacher vacations to
provide more learning time for students and
for teacher collaboration, planning, and
instructional personalization. The result is a
200-day school year – 20 more than the
national average – without increasing teach-
ers’ total work time. In addition to their “reg-
ular” courses, all students take rigorous,
month-long, credit-bearing “intensive”
courses twice a year, taught by a team of
teachers. The city becomes the classroom:
students explore college campuses, corporate
boardrooms, community organizations, and
public services. In New York, this approach
costs the same as other New York City public
schools, demonstrating its cost-effectiveness.
Each day, students experience learning time
in the following ways:*
• An 85-minute “foundation course,” which
serves as the core of the instructional pro-
gram. Courses are taught by a team of teach-
ers including content area experts and
experts in special needs or EL instruction.
Teachers share fewer than sixteen students
on average (in a fully scaled school), and
teachers have common preparation time
every day.
• Three hour-long “studio courses” daily.
Studio courses are additional required
courses, electives or mandated services
(e.g., arts and music, foreign language, fit-
ness, advanced sciences and technology,
remediation, or enrichment). Studio
courses last six to eight weeks. This allows
students to take many types of courses
throughout the year and allows staff to
plan courses that adapt to student needs
and interests.
• Two month-long “intersession courses.”
Courses focus on critical English and math
instruction and are taught by a team of cer-
tified teachers and guidance counselor
who rotate to each grade throughout the
year. The courses provide college guidance,
and through off-campus learning experi-
ences, all students graduate with the
knowledge and skills they need for postsec-
ondary success.
The goal is to meet the needs of all students
by providing a range of learning experiences
including semi-independent or independent
practice; intensive and interactive skill
instruction; interactive guidance and social
support; ongoing exploration of an interest
area; and deep-dive, inquiry-based learning
that require and enable student-to-student
and student-to-adult interaction. As shared
by the co-founder, the school works to meet
its goal of preparing all students for lifes
responsibilities, challenges, and opportuni-
ties, in contrast to traditional notions of suc-
cess:
What often happens is we’ll have a ninth-
grade student, for example, who takes
integrated algebra, passes the New York
state regions, but only gets a 65. While
most schools would then move on to
geometry, we sit down with the kids and
we have conversations about the fact
that, “You know, you might have passed
but . . . there's good research that if you
got a 65 in integrated algebra, you're not
going to pass geometry and trig. If you
pass, you're going to have to pay for a
remedial class when you get to college.
– Excerpt of interview with Jonathan
Spear, Co-Founder, Generation Schools
Network, Sept. 25, 2013
Together, students and caring adults develop
a plan that will best meet the long-term aca-
demic and social needs of each student.
* See www.generationschools.org/about/ model.
THE GENERATION SCHOOLS NETWORK APPROACH
10
Leveraging
Tim
e for Sc
hool Equ
ity: Ind
icators to M
easu
re M
ore an
d Better Le
arning
Tim
e
The wide range of approaches working towardproviding students with more and better learningtime reflects the depth of this approach. Theseapproaches – Linked Learning, the PromiseNeighborhoods Initiative, Community Schools,Generation Schools Network, Citizen Schools,the TIME Collaborative of the National Centeron Time and Learning, and ExpandEd Schoolsby TASC (The After-School Corporation) –operate in different regions of the country andare creating scalable, effective school designs in“regular” public school systems. (See pages – fora brief description of two of these approaches.)The work of these schools and organizationsdemonstrates that there is not one “fix,” butrather a multitude of solutions that must beapplied to systems and schools to help reducethe opportunity gap between affluent and less-affluent families (Putnam 2012).
ased on the literature, the MBLT guidingprinciples, and extensive input fromMBLT implementers, we developed a
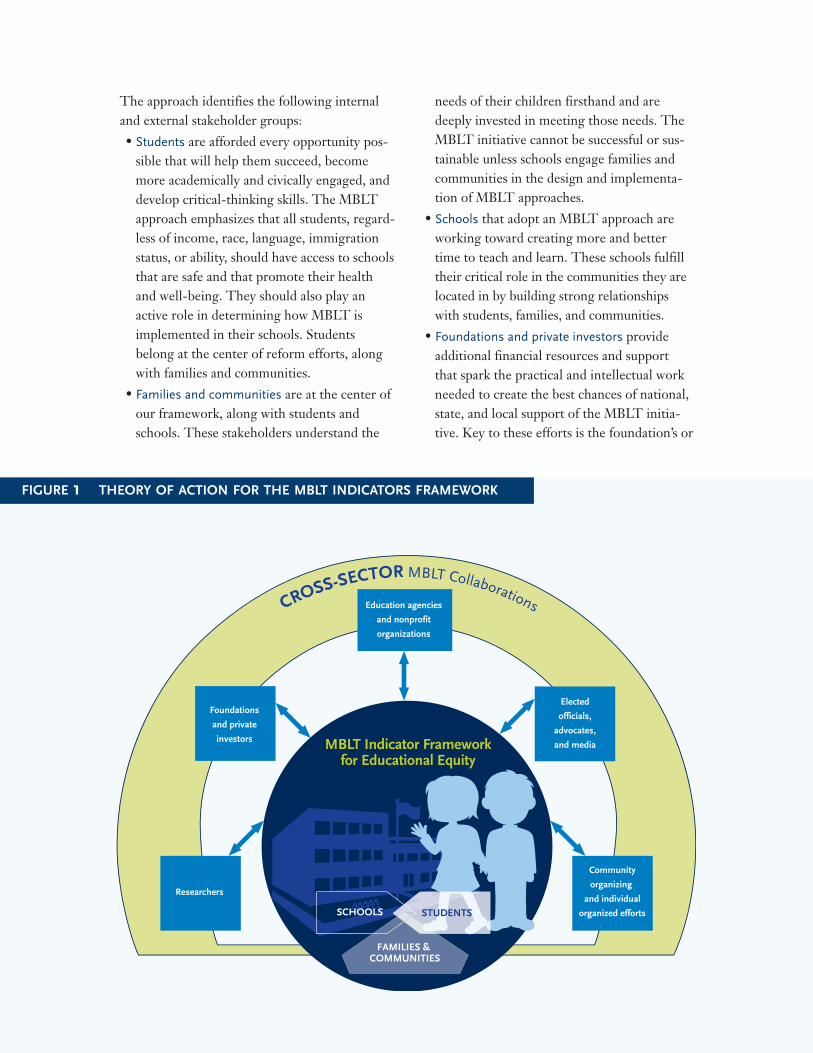
theory of action to guide the construction of an indicator framework. At the center of theapproach are educated, well-rounded, andhealthy students, families, and communities par-ticipating in strong and equitable schools andschool systems, surrounded by the multipleactors that need to engage in the work to reachscale. Together, these stakeholders create anecosystem of MBLT equity reform, as seen inFigure 1 on the next page.
This approach includes internal and externalstakeholder groups, each of which provides aunique and essential contribution for the successof the MBLT initiative. The theory of actionalso captures cross-sector collaboration acrossthe stakeholder groups. As demonstrated in Figure 1, internal and external stakeholdergroups work together across the ecosystem tocreate and use MBLT to improve schools so thatthey can better support all students. We high-light this cross-sector work because it only hap-pens when it is intentional and resourced; ittakes significant time to meet and build a sharedvision and goals and to work across sectors.
B
Building a Shared Theory of Action
Annen-
The approach identifies the following internaland external stakeholder groups:
• Students are afforded every opportunity pos-sible that will help them succeed, becomemore academically and civically engaged, anddevelop critical-thinking skills. The MBLTapproach emphasizes that all students, regard-less of income, race, language, immigrationstatus, or ability, should have access to schoolsthat are safe and that promote their healthand well-being. They should also play anactive role in determining how MBLT isimplemented in their schools. Studentsbelong at the center of reform efforts, alongwith families and communities.
• Families and communities are at the center ofour framework, along with students andschools. These stakeholders understand the
needs of their children firsthand and aredeeply invested in meeting those needs. TheMBLT initiative cannot be successful or sus-tainable unless schools engage families andcommunities in the design and implementa-tion of MBLT approaches.
• Schools that adopt an MBLT approach areworking toward creating more and bettertime to teach and learn. These schools fulfilltheir critical role in the communities they arelocated in by building strong relationshipswith students, families, and communities.
• Foundations and private investors provideadditional financial resources and supportthat spark the practical and intellectual workneeded to create the best chances of national,state, and local support of the MBLT initia-tive. Key to these efforts is the foundation’s or
CROSS-SECTOR MBLT CollaborationsEducation agencies
and nonprofit
organizations
Community
organizing
and individual
organized efforts
MBLT Indicator Frameworkfor Educational Equity
STUDENTSSCHOOLS
FAMILIES & COMMUNITIES
Elected
officials,
advocates,
and media
Researchers
Foundations
and private
investors
FIGURE 1 THEORY OF ACTION FOR THE MBLT INDICATORS FRAMEWORK
12
Leveraging
Tim
e for Sc
hool Equ
ity: Ind
icators to M
easu
re M
ore an
d Better Le
arning
Tim
e
investor’s commitment to changing existinginequities across schools and improving con-ditions.
• Education agencies (LEAs, SEAs, and theU.S. Department of Education) and nonprofit
organizations (e.g., service providers andreform support organizations) redirect andreadjust policies or remove barriers towardfull MBLT implementation in schools andsystems.
• Researchers, including people from academia,institutes, and think tanks, provide an intellec-tual space to generate new ideas or documentongoing work. Researchers can push partnersto think about the possibilities and potential ofthe MBLT initiative and document or dissem-inate evidence of best practices.
• Community organizing and individual organ-
ized efforts create the public knowledge andpolitical will to ensure that the MBLT initia-tive is driven by and stays focused on the realsocial and educational inequities that exist inschools and communities. Community organ-izers can help develop and pass policies, iden-tify implementation problems and solutions,monitor access to MBLT programs, andensure that all stages of work are informed by meaningful community engagement.
• Elected officials, advocates, and media lever-age their resources to help implement MBLTstrategies. These two areas are combined, aseach entity influences and informs the other.
As much as the external stakeholders influenceschools and students, schools and students doand should affect the decisions and direction ofthese stakeholders. Figure 1 is not a static snap-shot; it represents a dynamic system that influ-ences and is influenced by the social, political,
cultural, and normative context of its own educa-tional ecosystem. This theory of action isgrounded in the knowledge that:
• Student academic success cannot be measuredby one instrument or through one singlemoment of engagement. The diverse range ofstudents’ needs and growth requires various
forms of measurements and of engagement.This framework provides a structure that canserve these multiple needs at various levels ofan educational system.
• Schools are impacted by societal failings ofinequality. Thus, increasing education and
social equity are primary goals of the MBLTinitiative. The indicators framework focuseson the many ways in which equity can bemeasured across sites and by those imple-menting MBLT strategies.
• An educational ecosystem like MBLT worksbest when external and internal stakeholdersmaintain open lines of communication, whenthey practice mutual respect, and when thereis a shared commitment to improve theirschools and communities.

Annenberg Institute for School Reform at Brown University | 13
The Limits of Traditional EducationIndicators: What the Research SaysGrounded in the theory of action outlined in theprevious section, this section provides a briefreview of relevant research and an overview ofcurrent efforts to move beyond a single assess-ment ideology to a multi-dimensional approach.There are many reasons to move beyond singleassessments. Current reform efforts to close theachievement gap through test-based accounta-bility systems have had untold negative effectson students and schools, including a narrowingof the curriculum and instruction (Au 2009;Mora 2011). Furthermore, there is growingrecognition that since the problems that impactlearning are complex and multi-dimensional,standardized test scores alone do not adequatelycapture student learning and growth. For exam-ple, considerable research documents how thelack of access to a rich learning environment andopportunities impacts students’ achievement,including students’ acquisition of a whole rangeof skills, knowledge, and abilities that affectreadiness for the adult world (Carter 2013).Despite this evidence, education reform effortshave paid little attention to identifying inputsand opportunities (such as time) as a lever forequity-based reform.
Measuring What Matters
Education stakeholders increasingly agree thatin our twenty-first-century society, success isdependent on the ability to use a range of skillsand behaviors to solve problems. The Universityof Chicago Consortium on Chicago SchoolResearch (CCSR) demonstrated that “noncogni-tive factors” (academic behaviors, academic per-severance, academic mindsets, learning strategies,and social skills) impact students’ school per-formance and educational attainment. Thisresearch indicates that academic behaviors likeschool attendance, doing homework, and organ-izing materials impact academic achievement,while noncognitive factors work through aca-demic behaviors to affect performance (Farring-ton et al. 2012).
A recent report by the National Bureau of Economic Research (Heckman & Kautz 2012)strengthens these findings. The authors establishthat important “character” skills (e.g., conscien-tiousness, perseverance, sociability, and curiosity)are deeply valued in the labor market, school,and other domains. However, many of theseskills cannot be captured by achievement tests.Indeed, many have argued that high-stakes stan-dardized testing cannot adequately measure aquality education or capture important life skills(Bransford, Brown & Cocking 2003; Darling-Hammond 1995, 2003; Heckman & Kautz 2013;Rogoff 2003).
Recognizing these shortcomings of standardizedtest data taken alone, some current reformefforts have sought to advance a broaderapproach to documenting student achievementand development. For example, the CommonCore State Standards and movement towardCommon Core assessments are intended to ben-efit students by providing clear and consistent
14
Leveraging
Tim
e for Sc
hool Equ
ity: Ind
icators to M
easu
re M
ore an
d Better Le
arning
Tim
e
expectations for success in college and the work-place. The standards suggest using time in differ-ent ways, including the integration of academicsubject areas and the use of extended researchprojects. While the standards are “designed to berobust and relevant to the real world, reflectingthe knowledge and skills that our young peopleneed for success in college and careers,”3 it isunclear how assessments based on these stan-dards can or will capture students’ growth anddevelopment.
Measuring Inequities
A myopic focus on test preparation can under-mine the goals of preparing students for the adultworld, particularly for students in low-perform-ing schools. Both large-scale teacher surveys(Clarke et al. 2003; Tracey 2005) and ethno-graphic research in schools (McNeil 2000; Valli& Buese 2007) show that high-stakes accounta-bility testing has pushed many to teach to testsand focus on basic skills even when these prac-tices conflict with teachers’ beliefs about the bestapproaches for student learning. This effect hasbeen particularly notable for teachers in low-per-forming schools, where pressures to raise testsand avoid sanctions are highest (Hursh 2008;Sunderman, Kim & Orfield 2005; Valenzuela2005; White & Rosenbaum 2008; Wood 2004).
Research also shows that a single measure can-not capture the complexity of assessing educa-tional systems that serve students in high-poverty communities. Rather than preparingstudents solely to be good test-takers as the way
to remedy the problems of failing schools, edu-cators should be permitted to “create learningenvironments informed by both action andreflection” (Bartolomé 1994, p. 177) that assessthe multiple dimensions of student learning andneeds. If the goal of education is creating thisdynamic system of teaching and learning, it fol-lows that the measures of that system should beequally robust and not narrowed to a singlenumeric value attached to test scores.
Research (Oakes 1989) demonstrates that it isimportant to consider students’ learning opportu-nities in addition to traditional outcome measureslike standardized test scores. A focus on outcomesmeasures must be combined with an examinationof critical inputs and capacity building. Indeed,the conceptualization of an “achievement gap,”according to Ladson-Billings (2013), that is basedon test scores must be reconceptualized to con-sider the “education debt” the nation has accu-mulated. Rather than focusing on “catching up”or raising the test scores of disadvantaged stu-dents, we must begin to pay down this debt(2013). No real academic improvements can bemade unless we address, as a nation, the disparatelevels of resources, support, and opportunitiesprovided to those who continue to be disadvan-taged due to a historical legacy of discrimination(Ladson-Billings 2013). This history producesnegative perceptions of African American andLatino communities and privileges middle-class,White communities, thus producing and main-taining cultural inequality in our society and inour schools (Carter 2013).
Understanding this historical and societal con-text is crucial if we are to truly transform oureducation systems. This is especially evidentwhen creating educational indicators that seek tochange school conditions for some of our coun-try’s most marginalized students.
3 See www.corestandards.org.

Annenberg Institute for School Reform at Brown University | 15
It is also critical to capture stakeholder actionand influence on educational initiatives at all lev-els of the education system. This attention to allstakeholders ensures equity consciousness – oran “awareness of the level of equity and inequitypresent in behaviors, policies, settings, organiza-tions, and outcomes” (McKenzie & Skrla 2011,p.12). In particular, our commitment to neigh-borhoods of concentrated poverty emphasizesthe critical importance of measuring school suc-cess and progress in a way that captures thispolitical, social, and cultural reality.
A Multi-dimensional Framework as aSolutionBased on the research discussed in the previoussection, the indicator framework measures arange of critical inputs and outcomes at the stu-dent, school, and system levels. Both inputs andoutputs are needed to bring this initiative toscale. The outputs involve traditional indicatorsthat measure evidence of student learning, aswell as non-traditional indicators that highlightthe range of skills and abilities students need forsuccess in the twenty-first century. The inputsinclude external stakeholders’ actions that helpshape the MBLT initiative and the student out-comes. The fluid relationship among theseinputs and outputs allows us to document theinteractions that lead to the creation and sustain-ing of ecosystems of equity.
Critical to any reform is that once solutions aredeveloped and implemented the ideas spread andare taken to scale. Coburn’s (2003) conceptual-ization of scale is useful in understanding what isrequired to make MBLT the “new normal”across America’s schools. Coburn explains thatgetting to scale “must include attention to thenature of change in classroom instruction; issuesof sustainability; spread of norms, principles, andbeliefs; and a shift in ownership such that areform can become self-generative” (p. 2). Thesefour concepts of depth, sustainability, spread,and ownership are important to winning overthe hearts and minds of the teachers, schools,and districts that will learn, teach, and, hope-fully, come to own MBLT.
Similarly, successful reform efforts must belinked to the health and well-being of the sur-rounding community. Linking school and com-munity improvement can ensure students cometo school ready to learn, work to transform theculture of schools and the practice of schooling,and help build a political constituency for publiceducation to support the delivery of necessaryresources and address inequalities (Warren2005). AISR’s theory of smart education systems(SES) offers insight into what ownership of theMBLT initiative may look like.4 In an SES, ahigh-functioning district partners with a range of community and civic partners to provide abroad web of supports and opportunities for stu-dents, both inside and outside of schools (Foleyet al. 2008; Mishook 2012). In other words, allaspects of an ecosystem move toward a widearray of positive results while ensuring mutualaccountability across the different sectors. By
4 See http://annenberginstitute.org/about/smart-education-
systems.

16
Leveraging
Tim
e for Sc
hool Equ
ity: Ind
icators to M
easu
re M
ore an
d Better Le
arning
Tim
e
establishing higher levels of trust between allsectors of the SES, issues relating to racialand/or economic disparities are handled morehonestly and effectively.
Like a smart education system, the MBLT initia-tive acknowledges that technical solutions toschool reform must be anchored to a theory ofequity to provide better academic outcomes anda more just society. Mutual respect must existbetween the community and those committed toits improvement in a smart education system.The school reforms that are a result of thisapproach should work towards empoweringcommunities with greater social, cultural, andpolitical capital (Hubbard & Stein 2006; Oakeset al. 1998; Welner 2001).
here is a strong need to document andunderstand strategies that develop stu-dents into successful learners, create better
schools, and help establish strong relationshipsbetween communities and schools. Stakeholdersneed guidance about how to best use time, buildclassroom environments, and apply appropriatepedagogy to leverage the body of research onthese factors. The More and Better LearningTime (MBLT) initiative proposes a set of guid-ing principles for developing these strategies:redesign school days to provide students withsignificantly more and better learning time; pro-vide well-rounded learning and developmentopportunities; reinvent how teachers/educatorsspend their time in schools; include all students;and engage families and the community (see thesection “Guiding Principles: A Cross-SectorEcosystem for Equitable Reform” for more onthe principles).
The MBLT indicators framework offers a way totransform MBLT principles into practice. Theindicators identified in this framework aim tomeasure the extent to which more and betterlearning time can impact students’ preparationfor school success, culminating in graduatingfrom high school ready for the adult world of
T
MBLT Indicators Framework
Annenberg Institute for School Reform at Brown University | 17
learning, work, and civic engagement. The indi-cators also identify the extent to which schools,districts, and communities provide the supportneeded for students to reach these ambitiousgoals.
Levels of Analysis: Student, School,SystemThe MBLT indicators framework identifies indi-cators that document the impact of the guidingprinciples at three levels of analysis – student,school, and system – with some indicators fallingunder more than one level. Each level of analysisprovides crucial information about the mosteffective strategies to implement more and bet-ter learning time.
Why Student-Level Indicators?
Changing the opportunities and lives of youngpeople is at the heart of our education system.The current education policy climate empha-sizes holding systems accountable for servingstudents well, and AISR supports that goal. But,as established, students’ readiness for success incollege, career, and civic life can’t be capturedthrough a single test. The indicators in theframework explore and broaden existing indica-tors of students’ comprehensive academic suc-cess and development. They also measure theimpact of educational opportunities made possi-ble through more and better learning time.
Why School-Level Indicators?
Viewing an approach through school-level indi-cators is useful in many ways. This more“macro-level” approach provides different feed-back than can be gleaned from student-level data(although there is clearly overlap, as some
school-level data are based on aggregated stu-dent-level data). School-level indicators candemonstrate how a school structures, supports,organizes, and reflects on MBLT priorities.Analysis of school-level data provides informa-tion on how more and better learning time cantransform entire school structures.
School-level data can also serve as a startingpoint for sharing effective, equitable implemen-tation strategies by illuminating the strengths ofparticular schools and organizations. School-level indicators provide insight into how stu-dents, teachers, administrators, and partnerorganizations interact with each other and howtime can influence these relationships. Further-more, school-level indicators provide opportuni-ties to highlight the important role of teachersand other adults who interact with students anddirectly impact their educational experiences.Finally, examining disaggregated student-leveldata provides an important opportunity to ana-lyze differences in access to more and betterlearning time opportunities and outcomesbetween subgroups.
Why System-Level Indicators?
Education research has historically held a deficitbias – that is, students and teachers are oftenblamed for educational outcomes that are actu-ally the result of inadequate opportunities orresources (Valencia 2010). Most traditionalmeasures of success reinforce this bias by focus-ing almost exclusively on student and schooloutcomes, without capturing the impact of theecosystem of practices, policies, and resourcesthat schools operate in – the district, community,state, and federal contexts.
Schools are not isolated entities, and many fac-tors that affect how students learn and grow areoutside of the control of schools. MBLT external
18
Leveraging
Tim
e for Sc
hool Equ
ity: Ind
icators to M
easu
re M
ore an
d Better Le
arning
Tim
e
stakeholders are viewed as the context of people,processes, and structures surrounding a schoolthat influence the development, adoption, andimplementation of MBLT at the local, state, ornational level. System-level indicators provide anew way for understanding student and schoolperformance in the larger social and politicalcontext.
Criteria for Selecting IndicatorsIn addition to ensuring indicators capturechange at the student, school, and system levels,it is also important to consider the characteris-tics of each indicator and how each indicatorcontributes to the framework as a whole. Wedeveloped a set of criteria for selecting indica-tors. We also limited the number of indicatorsincluded to allow for greater ease and morewidespread use of the framework, and, therefore,to have a greater influence on educationalimprovement. Oakes (1989) supports this con-cept: “The trick is to design systems that providethe most essential information with a parsimo-nious set of indicators.”
The MBLT indicator framework includes indi-cators that meet the following criteria:
• are measurable by data that can be collected
and analyzed;
• provide information on an issue or set ofissues affecting students and schools, butneed not necessarily explain causality;
• are easy to understand;
• are unique enough to stand alone, but alsorelate to other indicators;
• lead to improvement in student outcomes thatinclude academic, social, and emotionaldevelopment;
• lead to clear implications for the improve-
ment of policy and practice among multiplelayers of the education system; and
• are currently measured by MBLT grantees or noted as something they would like to
measure.
Getting to This FrameworkThroughout the research process, we identifiedhundreds of possible indicators with the poten-tial to document the MBLT principles at thethree levels of impact. However, our goal is notto provide an exhaustive list, but rather to helpprioritize a series of indicators that align withthe goals of the MBLT initiative and MBLTimplementers, and that can be shared acrossmultiple sites, organizations, and efforts. In par-ticular, the framework captures the complexityinvolved in assessing programs that serve stu-dents in high-poverty communities.
We engaged in a participatory process withMBLT supporters and implementers to systemi-cally prioritize these indicators. The processstarted by engaging deeply with colleagues at theInstitute for Democracy, Education, and Accessat the University of California, Los Angeles, andat the National Center for Time and Learning,to consider existing research and indicators cur-rently collected nationally.
We synthesized knowledge from these conversa-tions, reviewed relevant literature, and devel-oped a draft document that we shared withschool designers, researchers, community organ-izers, and local grant-makers to gather criticalfeedback (please see the Acknowledgments for alist of the participating organizations). Theprocess of gathering feedback occurred over anentire year, during which the framework wasextensively revised. We conducted site visits tothree of the MBLT cities, had one-on-one con-
Annenberg Institute for School Reform at Brown University | 19
versations with many individuals in each sector,and held four separate in-person meetings.Meetings with school designers and with com-munity organizers each took place over a two-day period and included interviews to learnabout their MBLT implementation efforts. Par-ticipants held small- and large-group conversa-tions that focused on details of the framework,the collection of indicators, the development ofdata tools, and ways to ensure that the frame-work best supports the field as a whole. We arehumbled by the time and efforts our colleaguesmade to improve this work. The MBLT indica-tors framework that follows is a shared productof our collective work.
As we listened to the field, we were urged to finda simple, intuitive, and useful way of organizingthe twenty-four final indicators. Our effortsattempted to capture the way practitioners andpolicymakers understand the reality of imple-mentation – through constant adjustments andimprovements based on access to inputs and theoutcomes they are seeing. Fluid, strategic, col-laborative planning – not a reaction to a singlemoment or score – are the true constant ofMBLT development and implementation.
As a result, we have included MBLT indicatorsthat measure opportunity alongside outcomes.This intentional focus on both opportunity andoutcomes attempts to capture one of the corevalues of the MBLT initiative: that we cannotunderstand changes in student or school out-comes without understanding changes in the
ecosystem and supports surrounding thoseschools and students. This more fluid way ofmeasuring more and better learning time canprovide a more sustainable approach of docu-menting education initiatives.
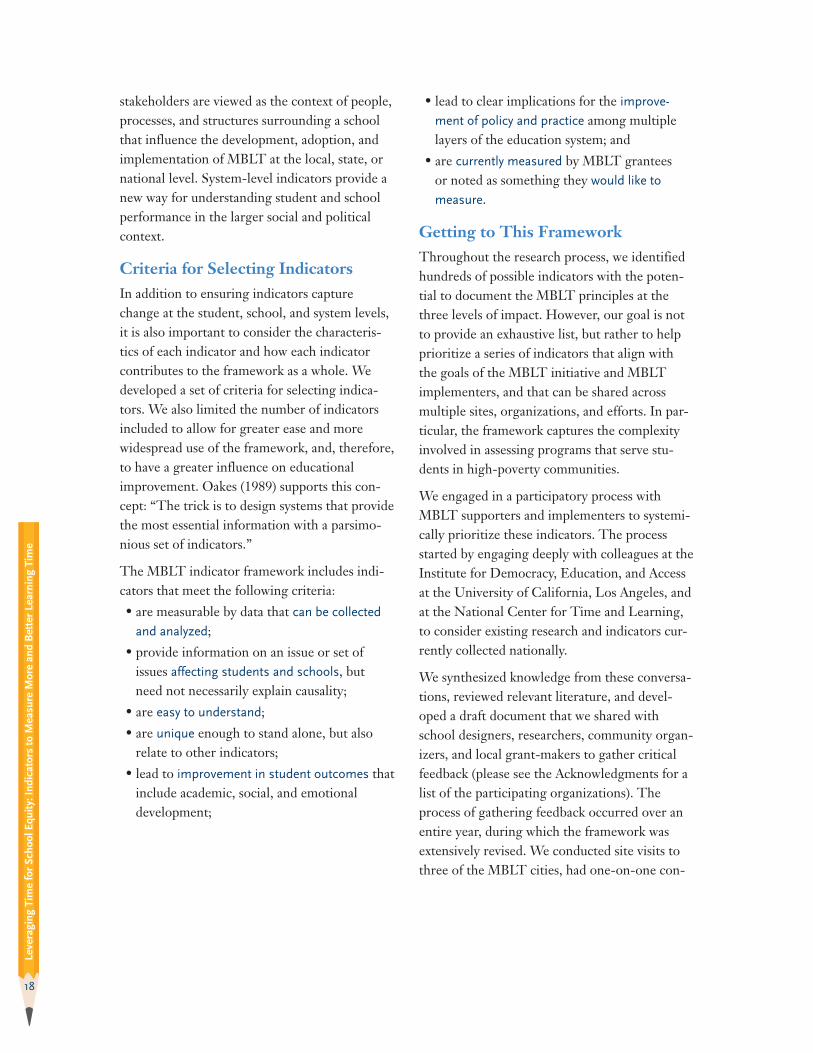
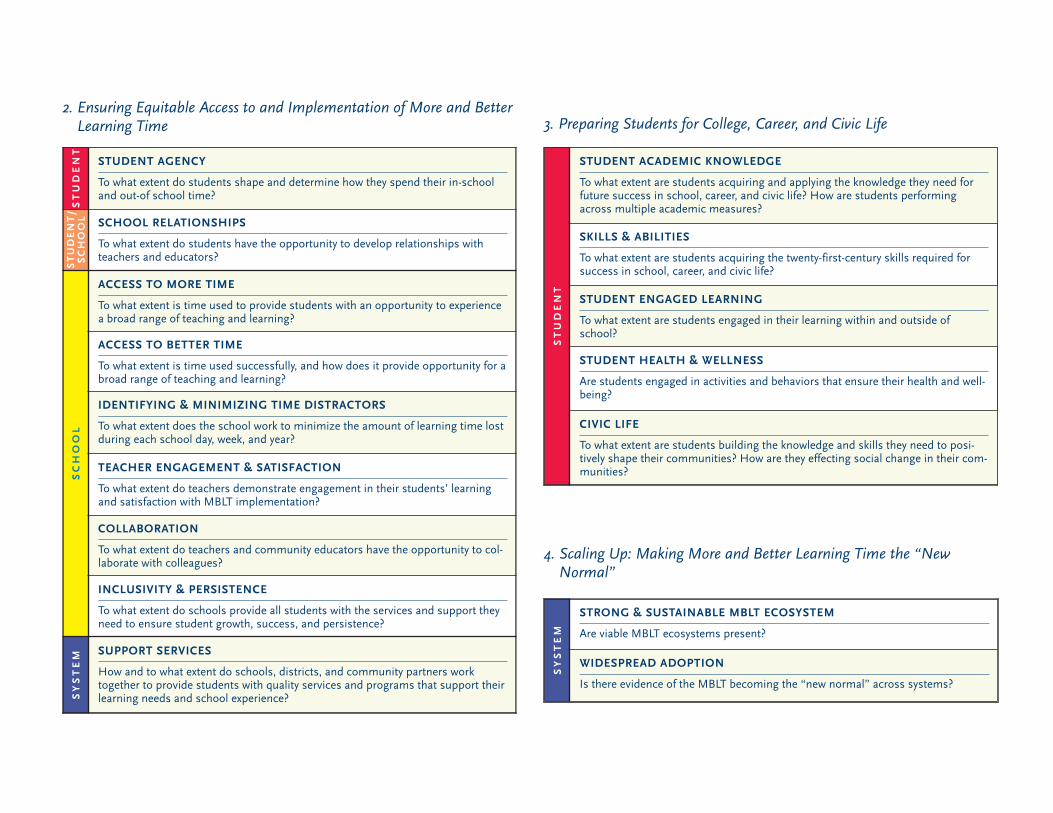
In the pages that follow, we provide a list oftwenty-four indicators at the student, school, orsystem level that follow the logic of implementa-tion:
1. Creating and Sustaining the Conditions forMore and Better Learning Time
2. Ensuring Equitable Access to and Implemen-tation of More and Better Learning Time
3. Preparing Students for College, Career, andCivic Life
4. Scaling Up: Making More and Better Learn-ing Time the “New Normal”
We do not imagine that data will be collected onevery indicator, but rather that a narrow subsetof indicators will be collected across the MBLTinitiative to tell a national story. The indicatorframework is designed to help districts, schools,community-based organizations, and otherschool partners design internal or external evalu-ation systems that can emphasize the inputs, out-comes, and levels of analysis (student, school,system) most relevant to their work. The hope isthat this comprehensive framework will provideexamples of a holistic assessment of more andbetter learning time.
We recognize that some of the indicators maynot have existing methods of measurement.However, we include these indicators becausethis framework aims both to build upon existingwork and to help build future work. We hopethat researchers will design studies to try anddevelop new ways to measure particularly chal-lenging but important indicators.

1. Creating and Sustaining the Conditions for More and Better Learning Time
SCH
OO
L
TEACHER OWNERSHIP, KNOWLEDGE & LEADERSHIP
To what extent do teachers and school leaders demonstrate ownership, learn about, and exercise leader-ship with regard to MBLT implementation strategies?
SCHOOL CLIMATE
To what extent does the school focus on the quality and character of school life through the establishmentof norms, values, and interpersonal relationships that foster youth development and learning, along witha positive approach to racial diversity on campus?
SCH
OO
L/SYSTEM
SCHOOL-COMMUNITY PARTNERSHIPS
To what extent are there opportunities for school-community partnerships and for the community toengage/support student learning?
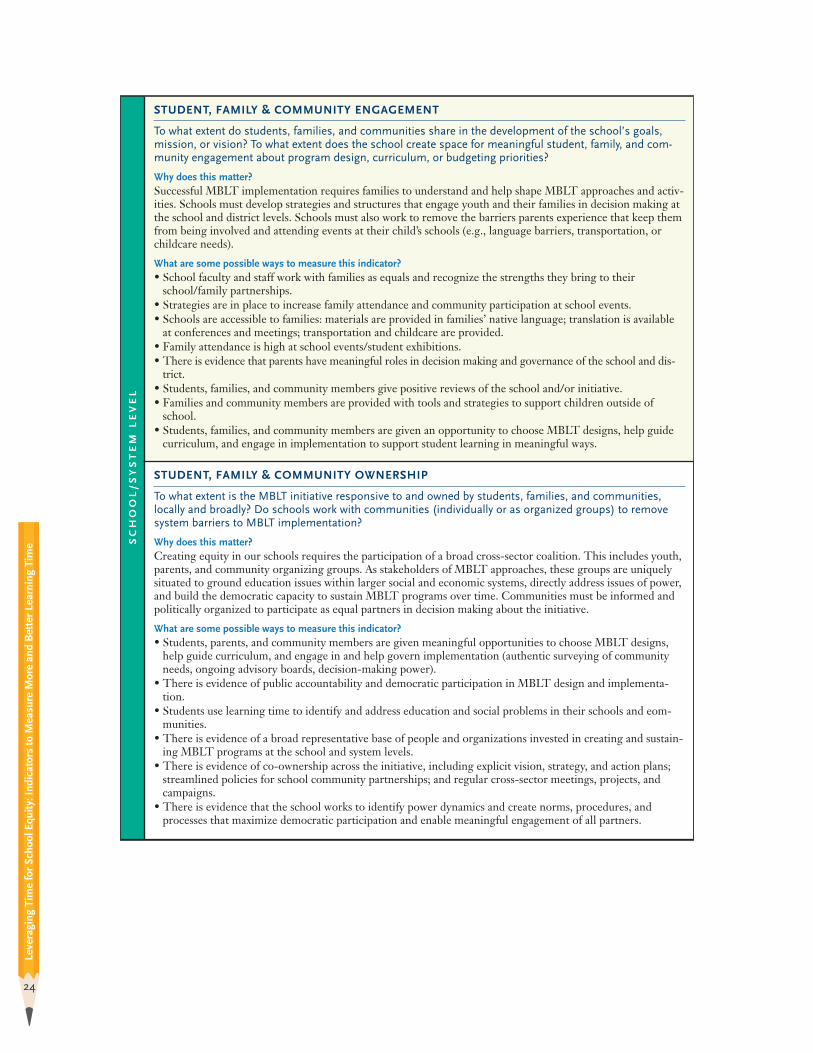
STUDENT, FAMILY & COMMUNITY ENGAGEMENT
To what extent do students, families, and communities share in the development of the school’s goals,mission, or vision? To what extent does the school create space for meaningful student, family, and com-munity engagement about program design, curriculum, or budgeting priorities?
STUDENT, FAMILY & COMMUNITY OWNERSHIP
To what extent is the MBLT initiative responsive to and owned by students, families, and communities,locally and broadly? Do schools work with communities (individually or as organized groups) to removesystem barriers to MBLT implementation?
SYSTEM
SUPPORTIVE DISTRICT POLICY & STRUCTURES
To what extent does the district create and implement policies and structures that provide criticalresources and support for MBLT?
LEADERSHIP SUPPORT & COMMUNICATION
To what extent does district leadership provide support and communicate information about the MBLTinitiative to those involved in implementation?
TARGETED FISCAL RESOURCES
To what extent are resources reallocated and/or targeted to support local MBLT ecosystems? What neces-sary resources do stakeholders provide to support the MBLT initiative?
More and Better
Learning Time Indicators:
Summary
4. Scaling Up: Making More and Better Learning Time the “New Normal”
2. Ensuring Equitable Access to and Implementation of More and BetterLearning Time 3. Preparing Students for College, Career, and Civic Life
STUDEN
T
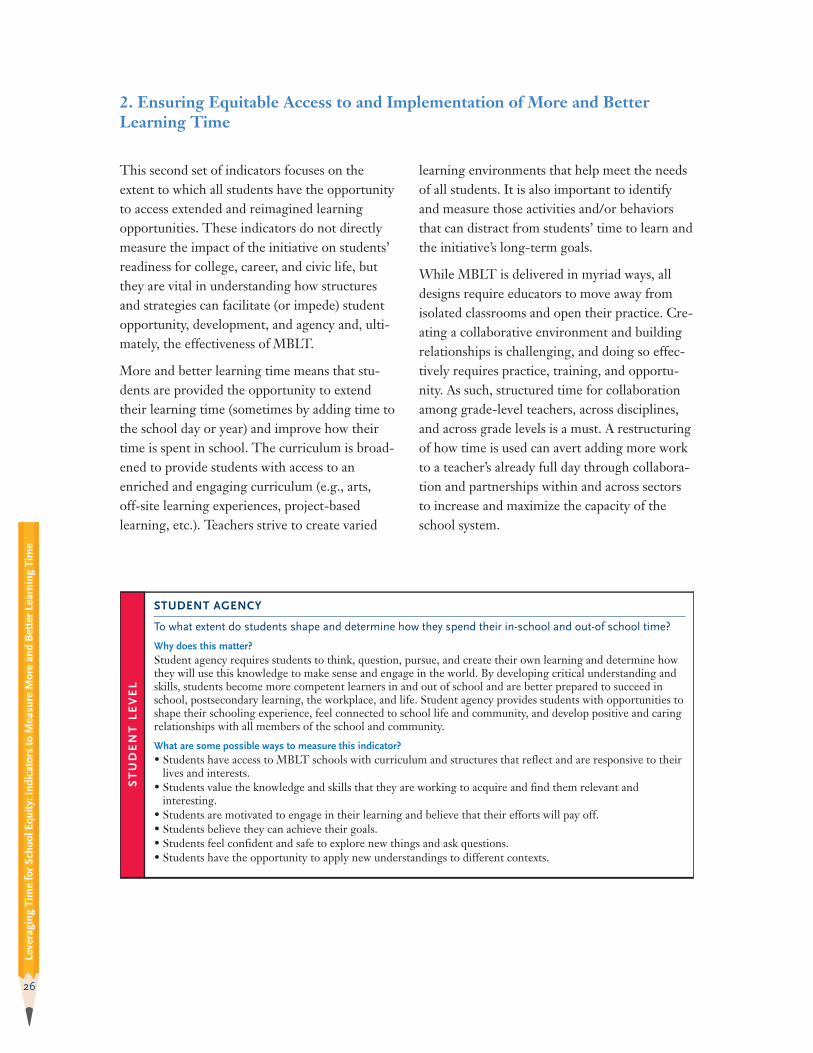
STUDENT AGENCY
To what extent do students shape and determine how they spend their in-schooland out-of school time?
STUDENT/
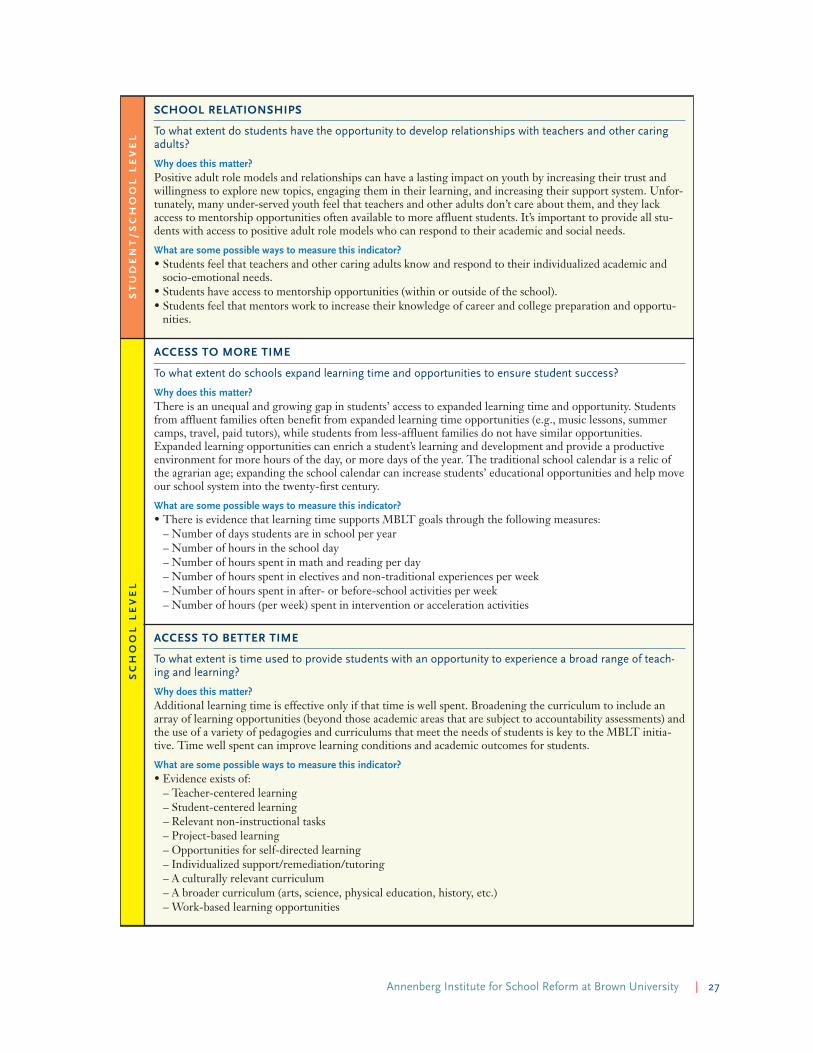
SCHOOL SCHOOL RELATIONSHIPS
To what extent do students have the opportunity to develop relationships withteachers and educators?
SCH
OO
L
ACCESS TO MORE TIME
To what extent is time used to provide students with an opportunity to experiencea broad range of teaching and learning?
ACCESS TO BETTER TIME
To what extent is time used successfully, and how does it provide opportunity for abroad range of teaching and learning?
IDENTIFYING & MINIMIZING TIME DISTRACTORS
To what extent does the school work to minimize the amount of learning time lostduring each school day, week, and year?
TEACHER ENGAGEMENT & SATISFACTION
To what extent do teachers demonstrate engagement in their students’ learningand satisfaction with MBLT implementation?
COLLABORATION
To what extent do teachers and community educators have the opportunity to col-laborate with colleagues?
INCLUSIVITY & PERSISTENCE
To what extent do schools provide all students with the services and support theyneed to ensure student growth, success, and persistence?
SYSTEM SUPPORT SERVICES
How and to what extent do schools, districts, and community partners worktogether to provide students with quality services and programs that support theirlearning needs and school experience?
STUDEN
T
STUDENT ACADEMIC KNOWLEDGE
To what extent are students acquiring and applying the knowledge they need forfuture success in school, career, and civic life? How are students performingacross multiple academic measures?
SKILLS & ABILITIES
To what extent are students acquiring the twenty-first-century skills required forsuccess in school, career, and civic life?
STUDENT ENGAGED LEARNING
To what extent are students engaged in their learning within and outside ofschool?
STUDENT HEALTH & WELLNESS
Are students engaged in activities and behaviors that ensure their health and well-being?
CIVIC LIFE
To what extent are students building the knowledge and skills they need to posi-tively shape their communities? How are they effecting social change in their com-munities?
SYSTEM
STRONG & SUSTAINABLE MBLT ECOSYSTEM
Are viable MBLT ecosystems present?
WIDESPREAD ADOPTION
Is there evidence of the MBLT becoming the “new normal” across systems?

22
Leveraging
Tim
e for Sc
hool Equ
ity: Ind
icators to M
easu
re M
ore an
d Better Le
arning
Tim
e
This set of indicators focuses on understandinghow schools and systems create and sustain theconditions that allow more and better learningtime to take root and develop. These indicatorsmeasure the commitment and actions of a rangeof groups, organizations, and individuals respon-sible for ensuring that the MBLT initiative meetsthe needs of students and their families. Together,the indicators measure cross-sector presence,commitment, co-ownership, and collaborationacross the MBLT ecosystem. This set of indica-tors looks at factors ranging from evidence ofshared goals and plans within and across schools
and partners to the resources and policies thatsupport MBLT implementation.
A shared vision and co-ownership is critical forexternal partners, school leaders, students, andteachers engaged in the reform. When studentsand families take part in establishing the visionand purpose of the school, ownership follows.Similarly, teachers must be given opportunitiesto learn about and lead a movement towardmore and better learning time. These actionscontribute to a positive school climate and pro-vide the right conditions for student success.
1. Creating and Sustaining the Conditions for More and Better Learning Time
SCHOOL L
EVEL
TEACHER OWNERSHIP, KNOWLEDGE & LEADERSHIP
To what extent do teachers and school leaders demonstrate ownership of, learn about, and exercise leader-ship with regard to MBLT implementation strategies?
Why does this matter?Successful implementation of MBLT is dependent on the ownership and leadership of teacher-led effortsthroughout the MBLT implementation process. Teachers’ expertise, experience, and on-the-ground under-standing of effective implementation strategies are key to learning and development. Teachers are professionalsand scholars who require time and space to develop their own learning and practice. This can be achievedthrough collaboration among colleagues and other educational providers, within and outside their schools.
What are some possible ways to measure this indicator?• Teachers have the opportunity to learn about MBLT and develop understanding of the issues MBLT seeks to
address.• Teachers lead and implement MBLT efforts at their schools.• Teachers understand alignment between MBLT and other reforms/initiatives (e.g., Common Core State
Standards).• Teachers use MBLT as a strategy to improve learning for their students.• Teachers have the opportunity to share their knowledge and to learn from others through professional devel-
opment in and out of the school and/or district.
Annenberg Institute for School Reform at Brown University | 23
SCH
OO
L L
EVEL
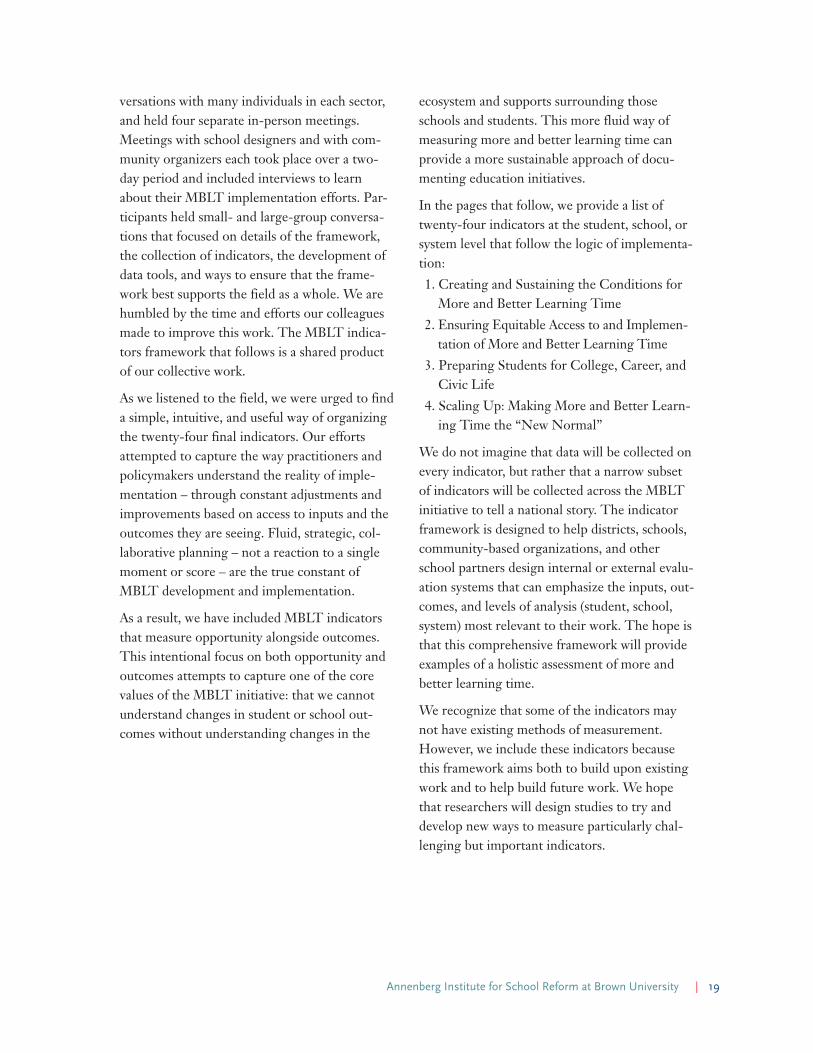
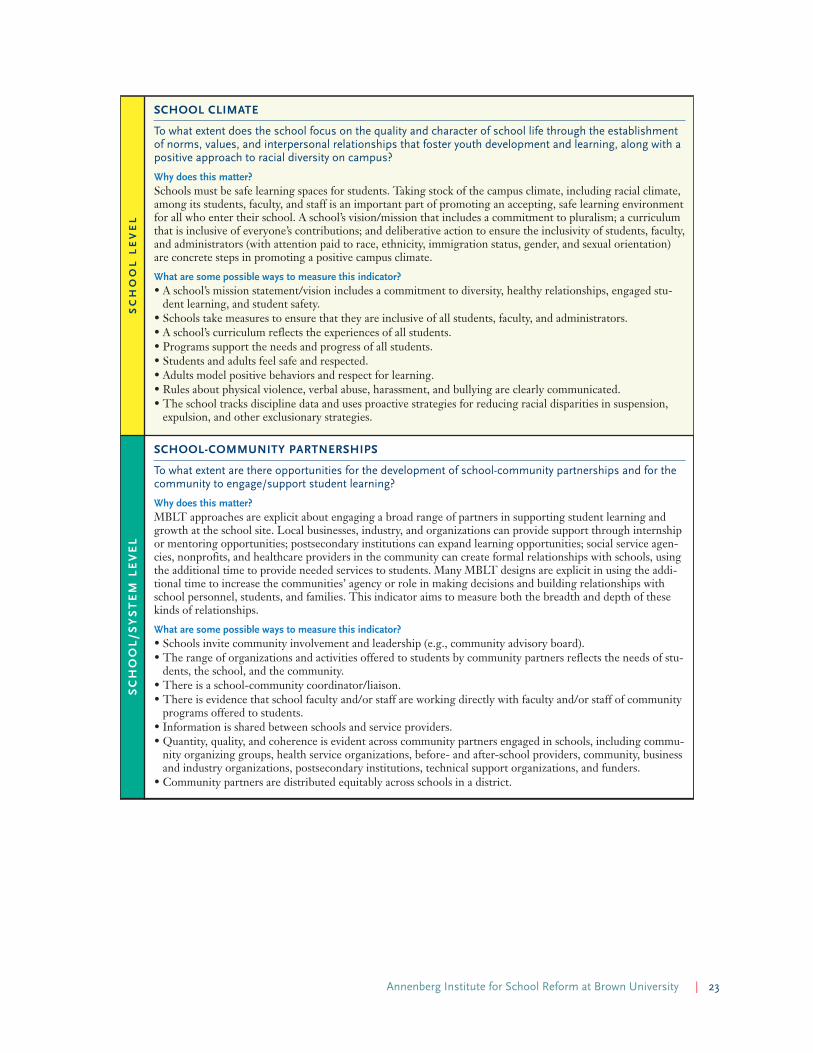
SCHOOL CLIMATE
To what extent does the school focus on the quality and character of school life through the establishment of norms, values, and interpersonal relationships that foster youth development and learning, along with apositive approach to racial diversity on campus?
Why does this matter?Schools must be safe learning spaces for students. Taking stock of the campus climate, including racial climate,among its students, faculty, and staff is an important part of promoting an accepting, safe learning environmentfor all who enter their school. A school’s vision/mission that includes a commitment to pluralism; a curriculumthat is inclusive of everyone’s contributions; and deliberative action to ensure the inclusivity of students, faculty,and administrators (with attention paid to race, ethnicity, immigration status, gender, and sexual orientation)are concrete steps in promoting a positive campus climate.
What are some possible ways to measure this indicator?• A school’s mission statement/vision includes a commitment to diversity, healthy relationships, engaged stu-
dent learning, and student safety.• Schools take measures to ensure that they are inclusive of all students, faculty, and administrators.• A school’s curriculum reflects the experiences of all students.• Programs support the needs and progress of all students.• Students and adults feel safe and respected.• Adults model positive behaviors and respect for learning.• Rules about physical violence, verbal abuse, harassment, and bullying are clearly communicated.• The school tracks discipline data and uses proactive strategies for reducing racial disparities in suspension,
expulsion, and other exclusionary strategies.
SCHOOL/S
YSTEM
LEVEL
SCHOOL-COMMUNITY PARTNERSHIPS
To what extent are there opportunities for the development of school-community partnerships and for thecommunity to engage/support student learning?
Why does this matter?MBLT approaches are explicit about engaging a broad range of partners in supporting student learning andgrowth at the school site. Local businesses, industry, and organizations can provide support through internshipor mentoring opportunities; postsecondary institutions can expand learning opportunities; social service agen-cies, nonprofits, and healthcare providers in the community can create formal relationships with schools, usingthe additional time to provide needed services to students. Many MBLT designs are explicit in using the addi-tional time to increase the communities’ agency or role in making decisions and building relationships withschool personnel, students, and families. This indicator aims to measure both the breadth and depth of thesekinds of relationships.
What are some possible ways to measure this indicator?• Schools invite community involvement and leadership (e.g., community advisory board).• The range of organizations and activities offered to students by community partners reflects the needs of stu-
dents, the school, and the community.• There is a school-community coordinator/liaison.• There is evidence that school faculty and/or staff are working directly with faculty and/or staff of community
programs offered to students.• Information is shared between schools and service providers.• Quantity, quality, and coherence is evident across community partners engaged in schools, including commu-
nity organizing groups, health service organizations, before- and after-school providers, community, businessand industry organizations, postsecondary institutions, technical support organizations, and funders.
• Community partners are distributed equitably across schools in a district.
24
Leveraging
Tim
e for Sc
hool Equ
ity: Ind
icators to M
easu
re M
ore an
d Better Le
arning
Tim
e SCH
OO
L/SYSTEM
LEVEL
STUDENT, FAMILY & COMMUNITY ENGAGEMENT
To what extent do students, families, and communities share in the development of the school’s goals,mission, or vision? To what extent does the school create space for meaningful student, family, and com-munity engagement about program design, curriculum, or budgeting priorities?
Why does this matter?Successful MBLT implementation requires families to understand and help shape MBLT approaches and activ-ities. Schools must develop strategies and structures that engage youth and their families in decision making atthe school and district levels. Schools must also work to remove the barriers parents experience that keep themfrom being involved and attending events at their child’s schools (e.g., language barriers, transportation, orchildcare needs).
What are some possible ways to measure this indicator?• School faculty and staff work with families as equals and recognize the strengths they bring to their
school/family partnerships.• Strategies are in place to increase family attendance and community participation at school events.• Schools are accessible to families: materials are provided in families’ native language; translation is available
at conferences and meetings; transportation and childcare are provided.• Family attendance is high at school events/student exhibitions.• There is evidence that parents have meaningful roles in decision making and governance of the school and dis-
trict.• Students, families, and community members give positive reviews of the school and/or initiative.• Families and community members are provided with tools and strategies to support children outside of
school.• Students, families, and community members are given an opportunity to choose MBLT designs, help guide
curriculum, and engage in implementation to support student learning in meaningful ways.
STUDENT, FAMILY & COMMUNITY OWNERSHIP
To what extent is the MBLT initiative responsive to and owned by students, families, and communities,locally and broadly? Do schools work with communities (individually or as organized groups) to removesystem barriers to MBLT implementation?
Why does this matter?Creating equity in our schools requires the participation of a broad cross-sector coalition. This includes youth,parents, and community organizing groups. As stakeholders of MBLT approaches, these groups are uniquelysituated to ground education issues within larger social and economic systems, directly address issues of power,and build the democratic capacity to sustain MBLT programs over time. Communities must be informed andpolitically organized to participate as equal partners in decision making about the initiative.
What are some possible ways to measure this indicator?• Students, parents, and community members are given meaningful opportunities to choose MBLT designs,
help guide curriculum, and engage in and help govern implementation (authentic surveying of communityneeds, ongoing advisory boards, decision-making power).
• There is evidence of public accountability and democratic participation in MBLT design and implementa-tion.
• Students use learning time to identify and address education and social problems in their schools and eom-munities.
• There is evidence of a broad representative base of people and organizations invested in creating and sustain-ing MBLT programs at the school and system levels.
• There is evidence of co-ownership across the initiative, including explicit vision, strategy, and action plans;streamlined policies for school community partnerships; and regular cross-sector meetings, projects, andcampaigns.
• There is evidence that the school works to identify power dynamics and create norms, procedures, andprocesses that maximize democratic participation and enable meaningful engagement of all partners.

Annenberg Institute for School Reform at Brown University | 25
SYSTEM
LEVEL
SUPPORTIVE DISTRICT POLICY & STRUCTURES
To what extent does the district create and implement policies and structures that provide criticalresources and support for MBLT?
Why does this matter?The vision and actions of district leaders determine the extent to which MBLT is implemented. Districts mustbuild capacity, create the conditions, and provide the necessary resources and support that allow for more andbetter learning time across the system. District action must include the establishment of accountability struc-tures, data-informed decision making, and a commitment to developing shared outcomes and goals withschools and other stakeholders.
What are some possible ways to measure this indicator?• Policies provide resources to support more and better learning time.• Policies provide personnel with time to engage in MBLT and collaborate and learn about the initiative within
contracted time.• District initiatives and policies show alignment and coherence.• Accountability structures are in place to ensure student access to more and better learning time opportunities
and academic progress and growth.• Policies and practices support the MBLT guiding principles.• Policies allow for provision of data and data analysis support.
LEADERSHIP SUPPORT & COMMUNICATION
To what extent does district leadership provide support and communicate information about the MBLT ini-tiative to those involved in implementation?
Why does this matter?District leadership must have the capacity to both develop and articulate a vision and a set of practices that sup-port more and better learning time. Leadership should send a clear message to schools and practitioners thataffirms a commitment to establish the conditions necessary to implement MBLT, including different staffingmodels, the assignment of a designated staff person to lead the initiative, and the provision of transportation.
What are some possible ways to measure this indicator?• Leadership supports different staffing and workday models.• Strong partnership exists between the teachers union and management to support MBLT.• There are high-quality district MBLT vision and action plans at the cabinet/leadership level.• An MBLT lead staff person is assigned at the district level, and staff are designated at school sites.• The district provides necessary support such as transportation to allow for off-campus activities.
TARGETED FISCAL RESOURCES
To what extent are resources reallocated and/or targeted to support local MBLT ecosystems? What neces-sary resources do stakeholders provide to support the MBLT initiative?
Why does this matter?Adequate education funding is critical to any reform – particularly reforms that aim to improve the educationalopportunities offered to students in neighborhoods of concentrated poverty. Thus, a key part of understandinghow an ecosystem is creating and sustaining more and better learning time is measuring whether a school, dis-trict, or state is working to increase education funding through legislative initiatives and seeking additionalfunds through external sources (e.g., foundations).
What are some possible ways to measure this indicator?• Public funds are reallocated, targeted, or increased to support the provision of more and better learning time,
in particular to schools serving neighborhoods of concentrated poverty.• Effective and sustainable funding from external sources, including foundations, is in place.• District and/or funder initiatives that may be in conflict with the implementation of MBLT have been identi-
fied and are being addressed.
26
Leveraging
Tim
e for Sc
hool Equ
ity: Ind
icators to M
easu
re M
ore an
d Better Le
arning
Tim
e
This second set of indicators focuses on theextent to which all students have the opportunityto access extended and reimagined learningopportunities. These indicators do not directlymeasure the impact of the initiative on students’readiness for college, career, and civic life, butthey are vital in understanding how structuresand strategies can facilitate (or impede) studentopportunity, development, and agency and, ulti-mately, the effectiveness of MBLT.
More and better learning time means that stu-dents are provided the opportunity to extendtheir learning time (sometimes by adding time tothe school day or year) and improve how theirtime is spent in school. The curriculum is broad-ened to provide students with access to anenriched and engaging curriculum (e.g., arts,off-site learning experiences, project-basedlearning, etc.). Teachers strive to create varied
learning environments that help meet the needsof all students. It is also important to identifyand measure those activities and/or behaviorsthat can distract from students’ time to learn andthe initiative’s long-term goals.
While MBLT is delivered in myriad ways, alldesigns require educators to move away fromisolated classrooms and open their practice. Cre-ating a collaborative environment and buildingrelationships is challenging, and doing so effec-tively requires practice, training, and opportu-nity. As such, structured time for collaborationamong grade-level teachers, across disciplines,and across grade levels is a must. A restructuringof how time is used can avert adding more workto a teacher’s already full day through collabora-tion and partnerships within and across sectorsto increase and maximize the capacity of theschool system.
2. Ensuring Equitable Access to and Implementation of More and BetterLearning Time
STUDENT L
EVEL
STUDENT AGENCY
To what extent do students shape and determine how they spend their in-school and out-of school time?
Why does this matter?Student agency requires students to think, question, pursue, and create their own learning and determine howthey will use this knowledge to make sense and engage in the world. By developing critical understanding andskills, students become more competent learners in and out of school and are better prepared to succeed inschool, postsecondary learning, the workplace, and life. Student agency provides students with opportunities toshape their schooling experience, feel connected to school life and community, and develop positive and caringrelationships with all members of the school and community.
What are some possible ways to measure this indicator?• Students have access to MBLT schools with curriculum and structures that reflect and are responsive to their
lives and interests.• Students value the knowledge and skills that they are working to acquire and find them relevant and
interesting.• Students are motivated to engage in their learning and believe that their efforts will pay off.• Students believe they can achieve their goals.• Students feel confident and safe to explore new things and ask questions.• Students have the opportunity to apply new understandings to different contexts.
Annenberg Institute for School Reform at Brown University | 27
STUDEN
T/SCH
OO
L L
EVEL
SCHOOL RELATIONSHIPS
To what extent do students have the opportunity to develop relationships with teachers and other caringadults?
Why does this matter?Positive adult role models and relationships can have a lasting impact on youth by increasing their trust andwillingness to explore new topics, engaging them in their learning, and increasing their support system. Unfor-tunately, many under-served youth feel that teachers and other adults don’t care about them, and they lackaccess to mentorship opportunities often available to more affluent students. It’s important to provide all stu-dents with access to positive adult role models who can respond to their academic and social needs.
What are some possible ways to measure this indicator?• Students feel that teachers and other caring adults know and respond to their individualized academic and
socio-emotional needs.• Students have access to mentorship opportunities (within or outside of the school).• Students feel that mentors work to increase their knowledge of career and college preparation and opportu-
nities.
SCH
OO
L L
EVEL
ACCESS TO MORE TIME
To what extent do schools expand learning time and opportunities to ensure student success?
Why does this matter?There is an unequal and growing gap in students’ access to expanded learning time and opportunity. Studentsfrom affluent families often benefit from expanded learning time opportunities (e.g., music lessons, summercamps, travel, paid tutors), while students from less-affluent families do not have similar opportunities.Expanded learning opportunities can enrich a student’s learning and development and provide a productiveenvironment for more hours of the day, or more days of the year. The traditional school calendar is a relic ofthe agrarian age; expanding the school calendar can increase students’ educational opportunities and help moveour school system into the twenty-first century.
What are some possible ways to measure this indicator?• There is evidence that learning time supports MBLT goals through the following measures:
– Number of days students are in school per year– Number of hours in the school day– Number of hours spent in math and reading per day– Number of hours spent in electives and non-traditional experiences per week– Number of hours spent in after- or before-school activities per week– Number of hours (per week) spent in intervention or acceleration activities
ACCESS TO BETTER TIME
To what extent is time used to provide students with an opportunity to experience a broad range of teach-ing and learning?
Why does this matter?Additional learning time is effective only if that time is well spent. Broadening the curriculum to include anarray of learning opportunities (beyond those academic areas that are subject to accountability assessments) andthe use of a variety of pedagogies and curriculums that meet the needs of students is key to the MBLT initia-tive. Time well spent can improve learning conditions and academic outcomes for students.
What are some possible ways to measure this indicator?• Evidence exists of:
– Teacher-centered learning– Student-centered learning– Relevant non-instructional tasks– Project-based learning– Opportunities for self-directed learning– Individualized support/remediation/tutoring– A culturally relevant curriculum– A broader curriculum (arts, science, physical education, history, etc.)– Work-based learning opportunities

28
Leveraging
Tim
e for Sc
hool Equ
ity: Ind
icators to M
easu
re M
ore an
d Better Le
arning
Tim
e
SCH
OO
L L
EVEL
IDENTIFYING & MINIMIZING TIME DISTRACTORS
To what extent does the school work to minimize the amount of learning time lost during each school day,week, and year?
Why does this matter?Expanding and improving students’ learning time and opportunity means addressing those policies, practices,and structures that can distract teachers and students from teaching and learning. For example, to what extentis learning time lost to discipline policies and practices such as suspensions and expulsions? Other aspects ofthe school day that can be improved to allow for more and better learning time include minimizing transitionsbetween classes, ensuring that students are accurately scheduled in appropriate classes, and minimizing schoolclosures.
What are some possible ways to measure this indicator?• School closures are minimized.• Disparities by subgroups in retentions, suspensions, and expulsion rates decrease.• Transitions within and between classes are minimized.• Mis-scheduling of students decreases.
TEACHER ENGAGEMENT & SATISFACTION
To what extent do teachers demonstrate engagement in their students’ learning and satisfaction with MBLTimplementation?
Why does this matter?An empowering, satisfying work environment for teachers can translate into an enriching, successful learningenvironment for students. Schools that provide opportunities for teachers to continue developing their craft,contribute to their school as partners, and hear and respond to the recommendations and critiques of col-leagues can increases their satisfaction (and hence, minimize teacher mobility and absenteeism). Examining thecauses for teacher departures from the school (e.g., exit interviews) and taking action in remedying any recur-ring problems at the school can increase learning time.
What are some possible ways to measure this indicator?• Teachers support different staffing and work-day approaches.• Teachers are involved in designing and implementing MBLT.• Teacher mobility rates are low.• Teacher retention rates are high.• Teacher attendance rates are high.
COLLABORATION
To what extent do teachers and community educators have the opportunity to collaborate with colleagues?
Why does this matter?Compensated, scheduled time for teachers and educators to collaborate is key to keeping lessons interesting,relevant, and dynamic for students. Time for collaboration allows teachers to integrate subject areas and plancross-curricular projects. Further, time for collaboration provides an opportunity for teachers to learn fromeach other, build trust and respect, and work together to identify students’ needs and strategies to meet thoseneeds. Extending this collaboration time to other professionals, stakeholders, and allies provides teachers withopportunities to keep their pedagogy current and useful to their students’ communities.
What are some possible ways to measure this indicator?• The master schedule ensures collaborative planning time and student data analysis per week among:
– Grade-level teachers within the school – Content-area teachers within the school – Teachers with similar interests– Professionals, experts, community partners, and MBLT providers outside of the classroom or school
• There is evidence of a culture of trust and shared responsibility among faculty.
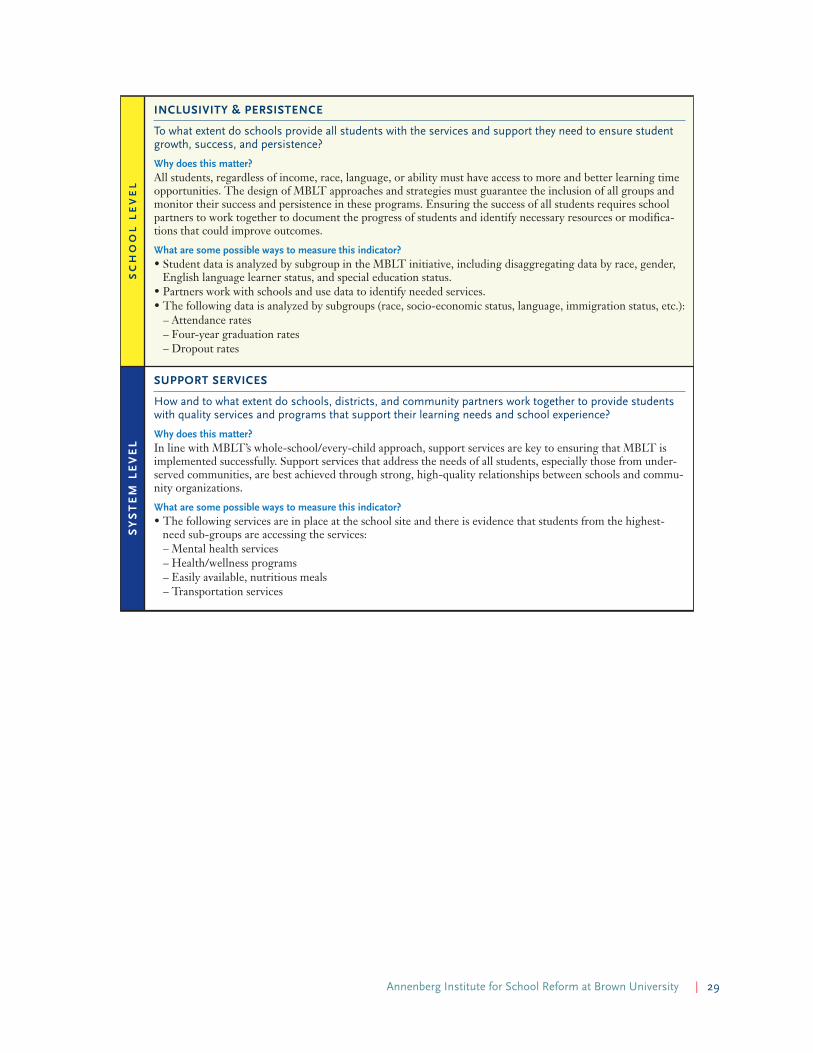
Annenberg Institute for School Reform at Brown University | 29
SCH
OO
L L
EVEL
INCLUSIVITY & PERSISTENCE
To what extent do schools provide all students with the services and support they need to ensure studentgrowth, success, and persistence?
Why does this matter?All students, regardless of income, race, language, or ability must have access to more and better learning timeopportunities. The design of MBLT approaches and strategies must guarantee the inclusion of all groups andmonitor their success and persistence in these programs. Ensuring the success of all students requires schoolpartners to work together to document the progress of students and identify necessary resources or modifica-tions that could improve outcomes.
What are some possible ways to measure this indicator?• Student data is analyzed by subgroup in the MBLT initiative, including disaggregating data by race, gender,
English language learner status, and special education status.• Partners work with schools and use data to identify needed services.• The following data is analyzed by subgroups (race, socio-economic status, language, immigration status, etc.):
– Attendance rates– Four-year graduation rates– Dropout rates
SYSTEM
LEVEL
SUPPORT SERVICES
How and to what extent do schools, districts, and community partners work together to provide studentswith quality services and programs that support their learning needs and school experience?
Why does this matter?In line with MBLT’s whole-school/every-child approach, support services are key to ensuring that MBLT isimplemented successfully. Support services that address the needs of all students, especially those from under-served communities, are best achieved through strong, high-quality relationships between schools and commu-nity organizations.
What are some possible ways to measure this indicator?• The following services are in place at the school site and there is evidence that students from the highest-
need sub-groups are accessing the services:– Mental health services– Health/wellness programs– Easily available, nutritious meals– Transportation services

30
Leveraging
Tim
e for Sc
hool Equ
ity: Ind
icators to M
easu
re M
ore an
d Better Le
arning
Tim
e
In our twenty-first-century society, it is criticalthat students develop a broad range of academic,social-emotional, and professional skills. Whilewe have become quite familiar with measures ofacademic attainment such as students’ grades,course enrollments, and test scores, it is equallyimportant to identify and measure students’ abil-ity to use a range of skills and behaviors to solveproblems. These important skills (often referredto as soft skills, social-emotional skills, characterskills, or noncognitive skills) are essential forsuccess in college, career, and civic life. Yet, theacquisition of these skills cannot be assessed bystandardized achievement tests alone. Clearly, ashift to preparing students for life after highschool requires a corresponding shift in how weassess students’ learning and their attainment ofcritical skills.
In addition to students’ acquisition of criticalknowledge, skills, and abilities, it is also impor-tant to measure the extent to which students areengaged in and in charge of their learning andbehaviors both in and out of school. Possible
measures of engagement could include schoolattendance, as well as students’ participation inand completion of a project or activity thatdemonstrates deep engagement in an interestarea. Behaviors and practices include students’engagement in activities that safeguard theirhealth and well-being, such as spending after-school hours in an adult supervised environmentand making good choices regarding health andnutritional practices.
Another crucial aspect of the indicators in thissection is that they measure the extent to whichstudents are gaining the skills and knowledgethey need to positively impact their communi-ties: the acquisition of leadership and relation-ship-building skills, an awareness of issues thatimpact their communities, and a belief that theycan take action.
The indicators that follow aim to ensure that allstudents are progressing toward responsibleadulthood and preparation for college, career,and civic life.
3. Preparing Students for College, Career, and Civic Life
STUDENT L
EVEL
STUDENT ACADEMIC KNOWLEDGE
To what extent are students acquiring and applying the knowledge they need for future success in collegeand career?
Why does this matter?Course completion, GPA, college knowledge, and college-going rates should be measured alongside standard-ized test scores to determine acquisition of critical content knowledge. All of these measures should be calcu-lated by school, district, and subgroup to ensure that all students are being equally prepared for college andcareers.
What are some possible ways to measure this indicator?• Students understand postsecondary requirements and acquire the knowledge they need to navigate their path
toward their postsecondary goals.• Students complete college prep requirements and/or a comprehensive curriculum that includes arts, the sci-
ences, and history along with English and math.• Students are on track for high school graduation.• Students achieve a grade point average that meets graduation and college entrance requirements. • Students demonstrate mastery of Common Core State Standards (CCSS) on CCSS-based assessments.• Benchmark assessments take place throughout the year.• Students register for and complete postsecondary entrance examinations (e.g., PSAT, SAT, ACT).
Annenberg Institute for School Reform at Brown University | 31
STUDEN
T L
EVEL
SKILLS & ABILITIES
To what extent are students acquiring the twenty-first-century skills required for success in school, career,and civic life?
Why does this matter?Preparing all students to successfully transition from K–12 to postsecondary institutions, careers, and civic lifeis the goal of the MBLT initiative. In addition to acquiring content knowledge, students need to be able towork and share ideas with others, establish and maintain positive relationships, lead, think creatively, problem-solve, use and develop information and technology, make responsible decisions, and set and achieve positivegoals for themselves. Students need these skills and abilities to be able to apply their knowledge and continuetheir learning beyond high school graduation.
What are some possible ways to measure this indicator?• Students demonstrate mastery of the following:
– Communication skills– Leadership skills– Ability to work collaboratively– Relationship building– Creative expression– Technology skills– Information literacy– Civic involvement– Common Core standards– Social-emotional learning
STUDENT ENGAGED LEARNING
To what extent are students engaged in their learning within and outside of school?
Why does this matter?The extent to which students feel positive about their learning can shape their school experience and schoolsuccess. Students’ engagement and investment in their learning is impacted when education is relevant and stu-dents can see a connection between their learning and their lives. Students who are engaged in their learningdemonstrate persistence, curiosity, and improved student outcomes (as measured by attendance rates, an explo-ration of non-assigned learning opportunities, and involvement in activities that allow for a deep exploration inan area of interest).
What are some possible ways to measure this indicator?• Students attain high attendance rates.• Students complete “deep engagement” performance or exhibition.• Students participate in a range of learning opportunities that take place in various spaces and times (off- and
on-campus; before and after school).• Non-assigned learning opportunities are pursued by students.• Students persist to high school graduation.
32
Leveraging
Tim
e for Sc
hool Equ
ity: Ind
icators to M
easu
re M
ore an
d Better Le
arning
Tim
e
STUDEN
T L
EVEL
STUDENT HEALTH & WELLNESS
Are students engaged in activities and behaviors that ensure their health and well-being?
Why does this matter?Student health and wellness in and out of school have a direct impact on students’ academic and social out-comes. Students in communities of high poverty have more need for, but significantly less access to medical,mental health, and social services. Providing these services in schools, often through partnerships with healthorganizations, gives students the opportunity to learn about health and nutritional practices and gain access tohealth services; it also reduces absenteeism. Positive adult relationships and time spent in adult-supervisedenvironments can also help shape well-being.
What are some possible ways to measure this indicator?• Students spend time in after-school hours in adult-supervised environments.• Students learn general health practices.• Nutritional practices are taught at school.• Drug prevention and youth intervention programs are available, accessible, and viewed as safe spaces.• Students have increased or streamlined access to mental health, medical, and social services.• Students are rarely absent.
CIVIC LIFE
To what extent are students building the knowledge and skills they need to positively shape their communi-ties? How are they effecting social change in their communities?
Why does this matter?While it is important for schools to prepare students for success in college and the workplace, schools alsoneed to ensure that they prepare students for positive civic contributions. This means that students mustacquire the skills that allow them to shape and participate in the life of their community.
What are some possible ways to measure this indicator?• There is evidence that the curriculum increases a critical understanding of issues that impact the community.• Students are provided an opportunity to identify and solve a problem in their community.• Youth opportunities for positive action are developed, encouraged, and supported.• Students feel they can shape the school environment.• There is evidence that youth are acquiring the following:
– Leadership skills– Collaboration skills– Ability to build relationships

Annenberg Institute for School Reform at Brown University | 33
The final set of indicators takes a closer look atthe issue of scalability and the extent to whichthese designs can contribute to the spread ofadoption. In keeping with Coburn’s (2003) con-ceptualization of scale, this final set of indicatorshighlights measures that signal a shift and spreadin the norms, principles, and beliefs that under-gird more and better learning time and identifyit as a lever for providing all students withimproved educational opportunities. Possible
measures of widespread adoption include theidentification and implementation of MBLTapproaches, as well as increased references toand greater understanding of the initiative(through media attention and research).
This final set of indicators aims to understandthe extent to which communities, teachers,schools, and districts are working toward makingmore and better learning time the “new normal”in American public schools.
4. Scaling Up: Making More and Better Learning Time the “New Normal”
SYSTEM
LEVEL
STRONG & SUSTAINABLE MBLT ECOSYSTEM
Are viable MBLT ecosystems present?
Why does this matter?To reach the systemic goal of the MBLT initiative, it is critical that rich learning opportunities are made avail-able to all students. This indicator measures the breadth of MBLT implementation across the entire ecosystem,focusing on the number of schools and districts working toward the implementation of MBLT approaches andensuring that students across the system graduate prepared to succeed in college, career, and civic life.
What are some possible ways to measure this indicator?• A growing number of schools and districts are implementing sustainable MBLT approaches. • A growing number of school partners such as community-based organizations, outreach college programs,
businesses and industries, city-sponsored community programs, and colleges and universities support imple-mentation of MBLT across districts.
• There is growing fiscal support for MBLT (through the reallocation of funds and/or other investments suchas foundation support).
• A growing number of research partners are in place, or a growing number of research projects focused onMBLT are published or under way.
• There are a growing number of media, policy, and public references to more and better learning time.
WIDESPREAD ADOPTION
Is there evidence of MBLT becoming the “new normal” across systems?
Why does this matter?It is important that sustainable approaches are documented, communicated, and scaled up in a way that thegoal of systemic equity is reached. Creating districtwide, statewide, or nationwide change does not happen byaccident – rather, it requires intentional effort, collective ownership, communication, and changes to policystructures. This indicator attempts to capture the depth and coherence of MBLT work across governance lev-els and sectors.
What are some possible ways to measure this indicator?• Successful MBLT approaches are identified and studied, and findings are made accessible.• There is evidence of MBLT programs becoming institutionalized across a district or state education system
(rather than specialized at one site).• MBLT policies that reduce barriers to districtwide, statewide, or federal implementation are formulated,
developed, and implemented.• Cross-sector collaborations create coherency and shared ownership across a district, state, or the nation.
34
Leveraging
Tim
e for Sc
hool Equ
ity: Ind
icators to M
easu
re M
ore an
d Better Le
arning
Tim
e
he goal of the MBLT indicators frame-work is to support the identification anddevelopment of scalable designs that can
provide students with more and better learningtime. To that end, the indicators outlined in thisreport measure changes in the systems and sup-ports surrounding schools and students along-side changes in student and school outcomes.
Staying true to Coburn’s (2003) ideas on scale,the indicators pay close attention to issues of sus-tainability and the extent to which the designdirectly impacts change in the classroom and stu-dent learning. This framework is also attentive tothe extent to which students, families, educators,and community partners share ownership of theinitiative and adopt new norms, principles, andbeliefs that support implementation of more andbetter learning time.
This framework is not the first step or the laststep in using time as a lever to improve schoolsfor all students. Educators, school designers, andcommunity organizations have been engaged inthis work for years. Our hope is that the frame-work can serve as a useful tool and resource toadvance this work, engage those interested inimplementing MBLT designs in their communi-ties, and help ensure equity and excellence acrossschools.
T
Conclusion

Annenberg Institute for School Reform at Brown University | 35
Alexander, K. L., D. R. Entwisle, and L. S.Olson. 2001. “Schools, Achievement, andInequality: A Seasonal Perspective,” Educa-tional Evaluation and Policy Analysis 23, no.2:171–191.
Alexander, K. L. 2007. “Lasting Consequencesof the Summer Learning Gap,” American Socio-logical Review 72:167–180.
Allington, R., and A. McGill-Franzen. 2009.“Why Summers Matter in the Rich/PoorAchievement Gap,” Teachers College Record(August 24), ID Number: 15757,www.tcrecord.org.
Anyon, J. 2005. Radical Possibilities: Public Policy,Urban Education, and a New Social Movement.New York: Routledge.
Aronson, J., J. Zimmerman, and L. Carlos. 1998.Improving Student Achievement by ExtendingSchool: Is it Just a Matter of Time? San Fran-cisco, CA: WestEd. Available at:http://www.wested. org/online_pubs/po-98-02.pdf.
Au, W. 2009. “Social Studies, Social Justice:W(h)ither the Social Studies in High-StakesTesting?” Teacher Education Quarterly (Winter).
Bartolomé, L. 1994. “Beyond the MethodsFetish: Toward a Humanizing Pedagogy,” Harvard Educational Review 642, 173–194.
Borg, W. R. 1980. Time and School Learning.In C. Denham and A. Lieberman (Eds.), Timeto Learn. Washington, DC: National Instituteof Education.
Berliner, D. 1990. “What Is All the Fuss aboutInstructional Time?” In The Nature of Time inSchools: Theoretical Concepts, Practitioner Percep-tions, edited by M. Ben-Peretz and R. Bromme,pp. 3–35. New York: Teachers College Press.
Berliner, D. 2007. “Time to Learn,” ResearchPoints 5, no. 2:1-4.
Borman, G. D., and N. M. Dowling. 2006.“Longitudinal Achievement Effects of Multi-year Summer School: Evidence from the TeachBaltimore Randomized Field Trial,” EducationPolicy Analysis Archives 28, no. 1:25–48.
Bransford, J. D., A. L. Brown, and R. R. Cock-ing. 2003. How People Learn: Brain, Mind,Experience, and School. Washington, DC:National Academy Press.
Brown, B. W., and D. H. Saks. 1986. “Measur-ing the Effects of Instructional Time on Stu-dent Learning: Evidence from the BeginningTeaching Evaluation Study,” American Journalof Education 94:480–500.
Carter, P. L. 2013. “Students and School Cul-tures and the Opportunity Gap: Paying Atten-tion to Academic Engagement andAchievement.” In Closing the Opportunity Gap:What America Must Do to Give Every Child anEven Chance, edited by P. L. Carter and K. G.Welner. New York: Oxford University Press.
Clarke, M., A. Shore, K. Rhoades, L. Abrams, J.Miao, and J. Li. 2003. Perceived Effects of State-Mandated Testing Programs on Teaching andLearning: Findings from Interviews with Educa-tors in Low-, Medium-, and High-Stakes States.Boston, MA: Boston College, Lynch School ofEducation. Available at www.bc.edu/research/nbetpp/statements/nbr1.pdf.
References

36
Leveraging
Tim
e for Sc
hool Equ
ity: Ind
icators to M
easu
re M
ore an
d Better Le
arning
Tim
e
Coburn, C. E. 2003. “Rethinking Scale: Movingbeyond Numbers to Deep and LastingChange,” Educational Researcher 326:3–12.
Cotton, K., and W. G. Savard. 1981. Time Fac-tors in Learning. Portland, OR: NorthwestRegional Education Laboratory.
Darling-Hammond, L. 1995. “Equity Issues inPerformance-Based Assessment.” In Equity andExcellence in Educational Testing and Assessment;edited by M. T. Nettles and A. L. Nettles.Boston, MA: Kluwer Academic Publishers.
Darling-Hammond, L. 2003. “Standards andAssessments: Where We Are and What WeNeed.” Teachers College Record, ID Number11109 (February 16).
Farrington, C. A., M. Roderick, E. A. Allensworth,J. Nagaoka, D. W. Johnson, T. S. Keyes, andN. Beechum. 2012. Teaching Adolescents toBecome Learners: The Role of Noncognitive Factorsin Academic Performance – A Critical LiteratureReview. Chicago, IL: Consortium on ChicagoSchool Research.
Foley, E., J. Mishook, J. Thompson, M. Kubiak,J. Supovitz, and M. K. Rhude-Faust. 2008.Beyond Test Scores: Leading Indicators for Educa-tion. Providence, RI: Brown University,Annenberg Institute for School Reform. Available at http://annenberginstitute.org/publication/beyond-test-scores-leading-indicators-education.
Heckman, J. J., and T. D. Kautz. 2012. HardEvidence on Soft Skills. NBER Working Paper18121. Cambridge, MA: National Bureau ofEconomic Research. Available at www.nber.org/papers/w18121.
Hubbard, L., and M. K. Stein. 2006. Reform asLearning: When School Reform Collides withSchool Culture and Community Politics. NewYork: Taylor & Francis.
Hursh, D. 2008. High-Stakes Testing and theDecline of Teaching And Learning. Plymouth,UK: Rowan and Littlefield Publishers.
Jin Jez, S. and R. Wassmer. 2011. The Impact ofLearning Time on Academic Achievement. Sacra-mento, California: Center for California Studies.
Ladson-Billings, G. 2013. “Lack of Achievementor Loss of Opportunity.” In Closing the Oppor-tunity Gap: What America Must Do to GiveEvery Child an Even Chance, edited by P. L. Carter and K. G. Welner. New York:Oxford University Press.
Marcotte, D., and B. Hansen. 2010. “When theSnow Falls, Test Scores Also Drop,” EducationNext 10, no. 1.
McKenzie, K. B., and L. Skrla. 2011. Using EquityAudits in the Classroom to Reach And Teach All Stu-dents. Thousand Oaks, CA: Corwin.
McNeil, L. M. 2000. “Creating New Inequali-ties: Contradictions of Reform,” Phi Delta Kappan, 81, no. 10.
Mishook, J. 2012. “College Readiness and SmartEducation Systems,” Voices in Urban Education35 (Fall):42–52.
Moore, K. A., and Emig, C. 2014. IntegratedStudent Supports: A Summary of the EvidenceBase for Policymakers. Publication #2014-05.Bethesda, MD: Child Trends. Available atwww.childtrends.org/wp-content/uploads/2014/02/2014-05ISSWhitePaper1.pdf.
Mora, R. 2011. “‘School is So Boring’: High-Stakes Testing and Boredom at an Urban Middle School,” PennGSE Perspectives on Urban Education 9, no. 1 (Fall). Available atwww.urbanedjournal.org/archive/volume-9-issue-1-fall-2011.
Oakes, J. 1989. “What Education Indicators?The Case for Assessing the School Context,”Educational Evaluation and Policy Analysis112:181–199.

Annenberg Institute for School Reform at Brown University | 37
Oakes, J., and M. Lipton. 2006. Teaching toChange the World. New York: McGraw Hill.
Oakes, J., K. Welner, S. Yonezawa, and R. L. Allen. 1998. “Norms and Politics ofEquity-Minded Change: Researching the‘Zone of Mediation.’” In International Handbookof Educational Change, edited by A. Hargreaves,A. Lieberman, and D. W. Hopkins, vol. 1, pp.952–975. Dordrecht, Netherlands: KluwerAcademic Publishers.
Putnam, R. D., C. B. Frederick, and K. Snell-man. 2012. Growing Class Gaps in Social Con-nectedness among American Youth. The SaguaroSeminar: Civic Engagement in America(August 8). Cambridge, MA: Harvard KennedySchool of Government.
Rich, M. 2012. “To Increase Learning Time,Some Schools Add Days to Academic Year,”New York Times (August 12).
Rogoff, B. 2003. The Cultural Nature of HumanDevelopment. Oxford, UK: Oxford UniversityPress.
Saunders, M., E. Hamilton, S. Fanelli, J. Moya,and E. Cain. 2013. Linked Learning: A Guide toMaking High School Work. Los Angeles, CA:University of California, Los Angeles, Institutefor Democracy, Education, and Access.
Shavelson, R. J., L. McDonnell, and J. Oakes.1991. “What Are Educational Indicators andIndicator Systems?” Practical Assessment,Research & Evaluation 211.
Simmons, W. 2007. “From Smart Districts toSmart Education Systems: A Broader Agendafor Educational Development.” In City Schools:How Districts and Communities Can Create SmartEducation Systems, edited by R. Rothman, pp.181–204. Cambridge, MA: Harvard EducationPress.
Sunderman, G. L., J. S. Kim, and G. Orfield(Eds.). 2005. NCLB Meets School Realities: Les-sons from the Field. Thousand Oakes, CA: Corwin Press.
Tracey, C. 2005. “Listening to Teachers.” InNCLB Meets School Realities: Lessons from theField, edited by G. L. Sunderman, J. S. Kim,and G. Orfield. Thousand Oaks, CA: CorwinPress.
Valencia, R. R. 2010. Dismantling ContemporaryDeficit Thinking: Educational Thought and Prac-tice. New York: Routledge.
Valenzuela, A. (Ed.). 2005. Leaving ChildrenBehind: How “Texas-style” Accountability FailsLatino Youth. Albany, NY: SUNY Press.
Valli, L., and D. Buese. 2007. “The ChangingRoles of Teachers in an Era of High-StakesAccountability,” American Educational ResearchJournal 443:519–558.
Warren, M. 2005. “Communities and Schools: A New View of Urban Education Reform,”Harvard Educational Review 752:133.
Welner, K. G. 2001. Legal Rights, Local Wrongs:When Community Control Collides With Educa-tional Equity. Albany, NY: State University ofNew York Press.
White, K. W., and J. E. Rosenbaum. 2008.“Inside the Black Box of Accountability: HowHigh-Stakes Accountability Alters School Cul-ture and the Classification and Treatment ofStudents and Teachers.” In No Child Left Behindand the Reduction of the Achievement Gap: Sociolog-ical Perspectives on Federal Educational Policy,edited by A. R. Sadovnik, J. A. O’Day, G. W.Bohrnstedt, and K. M. Borman. New York:Routledge.
Wood, G. 2004. “A View from the Field:NCLB’s Effects on Classrooms and Schools.”In Many Children Left Behind: How the No Child left Behind Act Is Damaging Our Childrenand Our Schools, edited by D. Meier and G. Wood. Boston, MA: Beacon Press.