leveraging demographic data for business intelligence in local … · 2010-02-19 · – infousa...
TRANSCRIPT
Leveraging Demographic Data for Business Intelligence in Local Government
Harry J. Moore IV

Outline
• Business Analyst in the public sector
• Business Analyst data– Demographic– Segmentation
• Analysis
• Reports
• Business Analyst Suite

What is Business Analyst?
• Solution to help make more informed location based business decisions
• Data• Analysis tools• Reportseports
Value to the government sector
• Helping local businesses be more successful• Is this a good location for business of type
“X”?• What’s the best business for a particular
location?• What’s the supply & demand for goods &
services in my city?• Selling your community• Increasing tax base
EconomicDevelopment
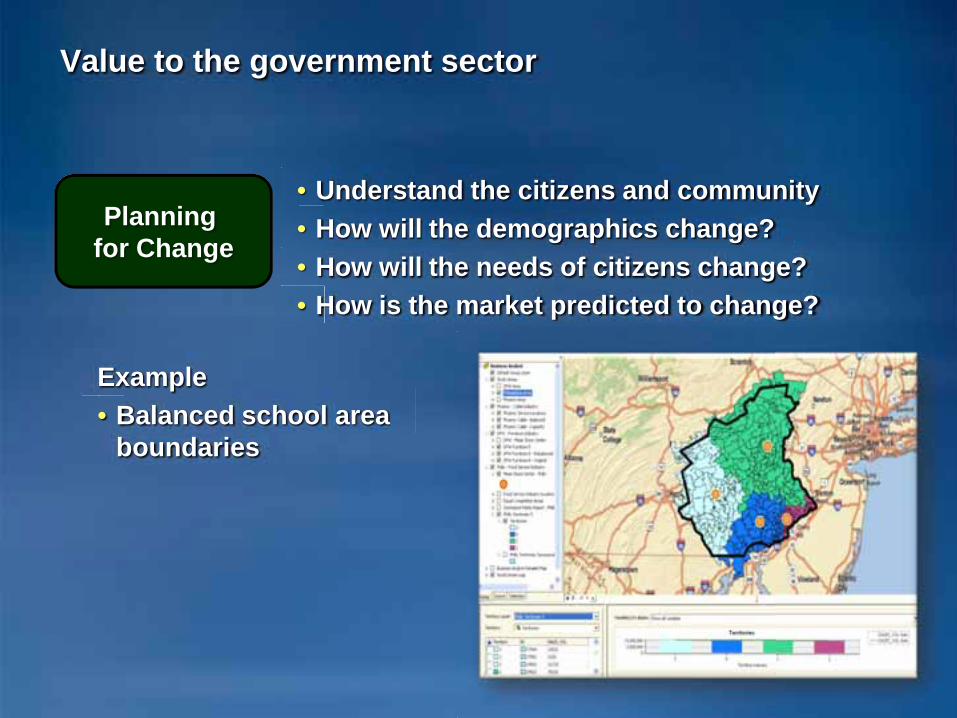
Value to the government sector
• Understand the citizens and community• How will the demographics change?• How will the needs of citizens change?• How is the market predicted to change?
Planning for Change
Example• Balanced school area
boundaries
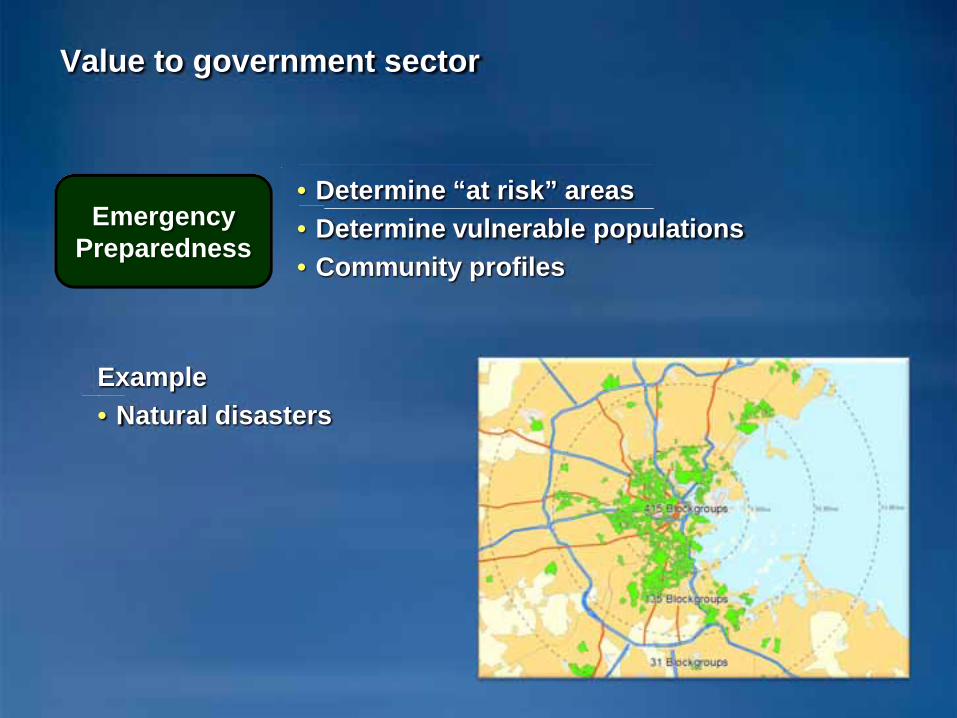
Value to government sector
• Determine “at risk” areas• Determine vulnerable populations• Community profiles
EmergencyPreparedness
Example• Natural disasters

Demonstration

+ +
= More insightful decisions
Your Data
• Facilities• Tax records• Students• Employees
ESRI Data Business Analyst
• Maps• Analyses• Models• Reports
• Updated demographics• Consumer spending• Tapestry Segmentation• Supply & demand
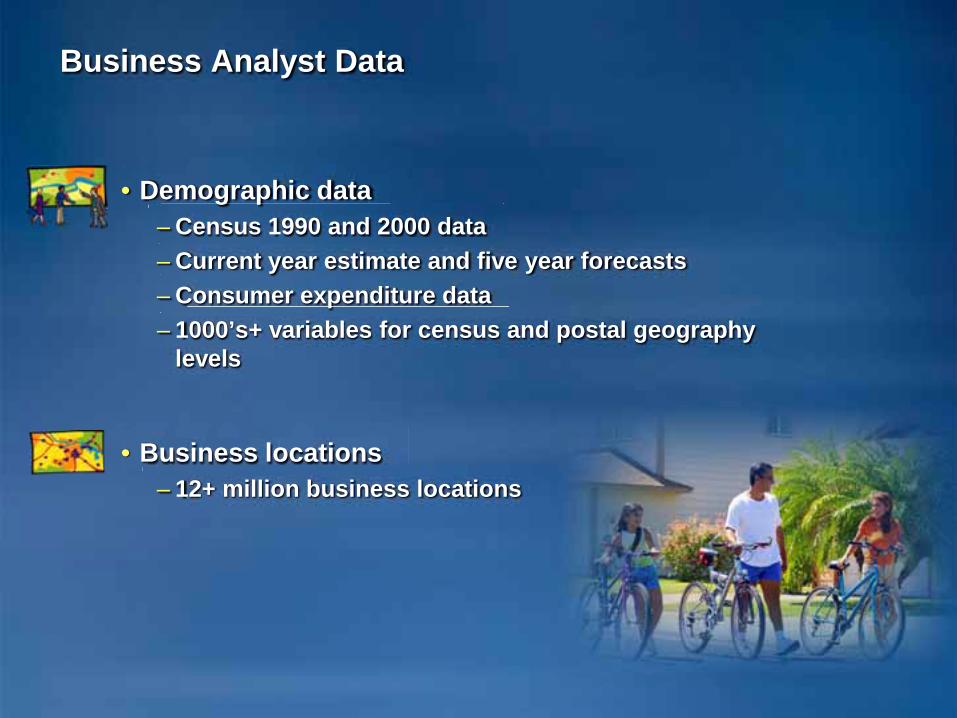
Business Analyst Data
• Demographic data– Census 1990 and 2000 data– Current year estimate and five year forecasts– Consumer expenditure data– 1000’s+ variables for census and postal geography
levels
• Business locations – 12+ million business locations
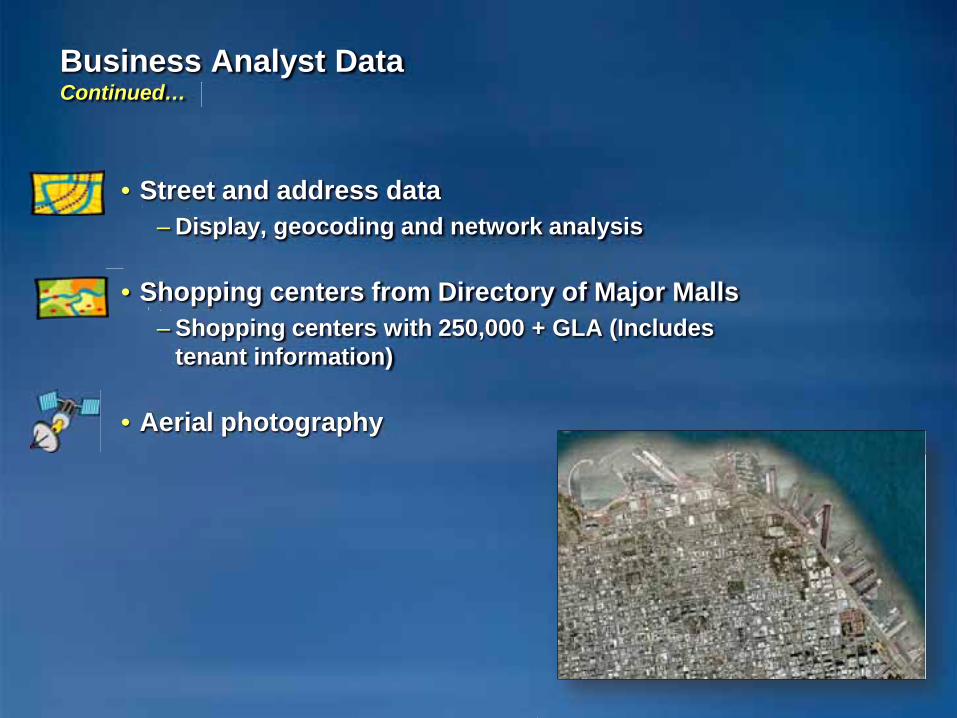
Business Analyst DataContinued…
• Street and address data– Display, geocoding and network analysis
• Shopping centers from Directory of Major Malls– Shopping centers with 250,000 + GLA (Includes
tenant information)
• Aerial photography

Data Updates
• Continuous updates:– Imagery
• Quarterly updates:– Cable TV boundaries (Add-On)– Traffic counts (Add-On)
• Semiannually (additional fee):– InfoUSA business data– Directory of Major Malls
• Annual updates:– Tapestry Segmentation data– Demographic data (CYFY)– Consumer expenditure– TeleAtlas street data
– Market potential (Segmentation Module)– Crime data (Add-On)– Bank data (Add-On)
Business Analyst Data vs. ESRI Data and Maps
• Updated demographic data– Current year and 5 year forecast
• More data– Tapestry Segmentation– Business listing– 1,500+ variables
• Data aggregated to many current levels of geography

Demonstration
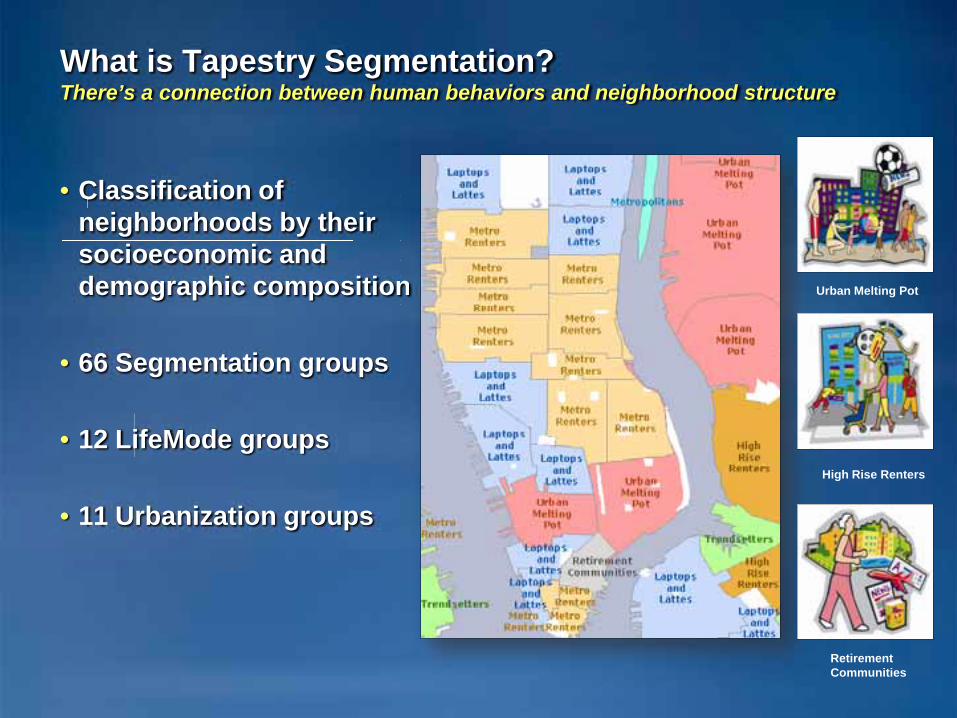
What is Tapestry Segmentation?There’s a connection between human behaviors and neighborhood structure
• Classification of neighborhoods by their socioeconomic and demographic composition
• 66 Segmentation groups
• 12 LifeMode groups
• 11 Urbanization groups
nn Urban Melting Pot
High Rise Renters
Retirement Communities

What can Tapestry Segmentation tell us?
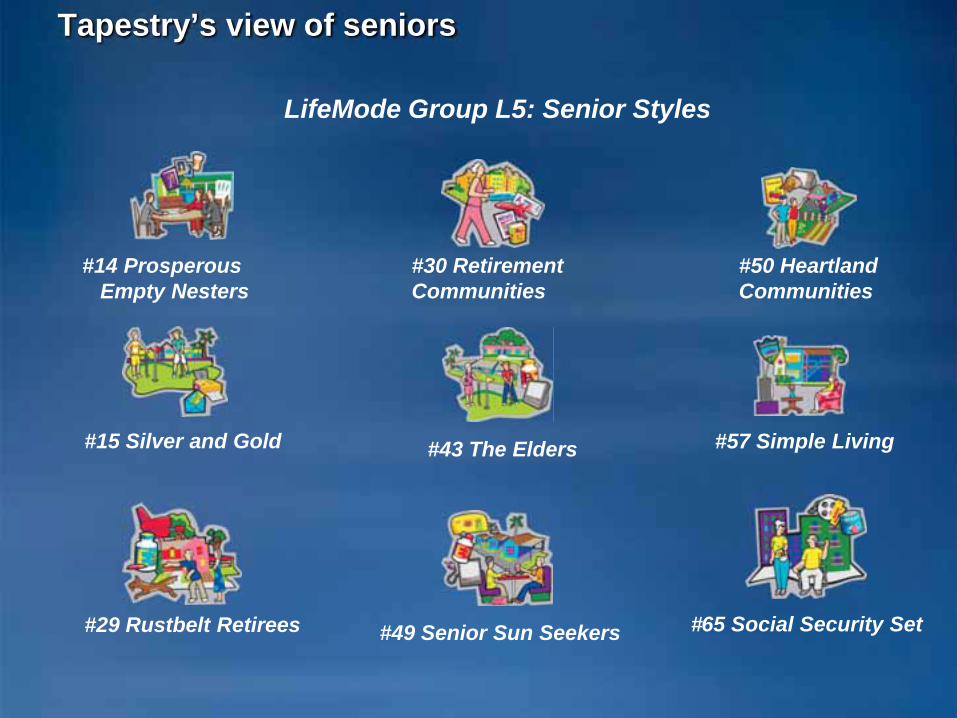
Tapestry’s view of seniors
LifeMode Group L5: Senior Styles
#65 Social Security Set#49 Senior Sun Seekers
#43 The Elders#15 Silver and Gold
#14 Prosperous Empty Nesters
#29 Rustbelt Retirees
#50 Heartland Communities
#57 Simple Living
#30 Retirement Communities
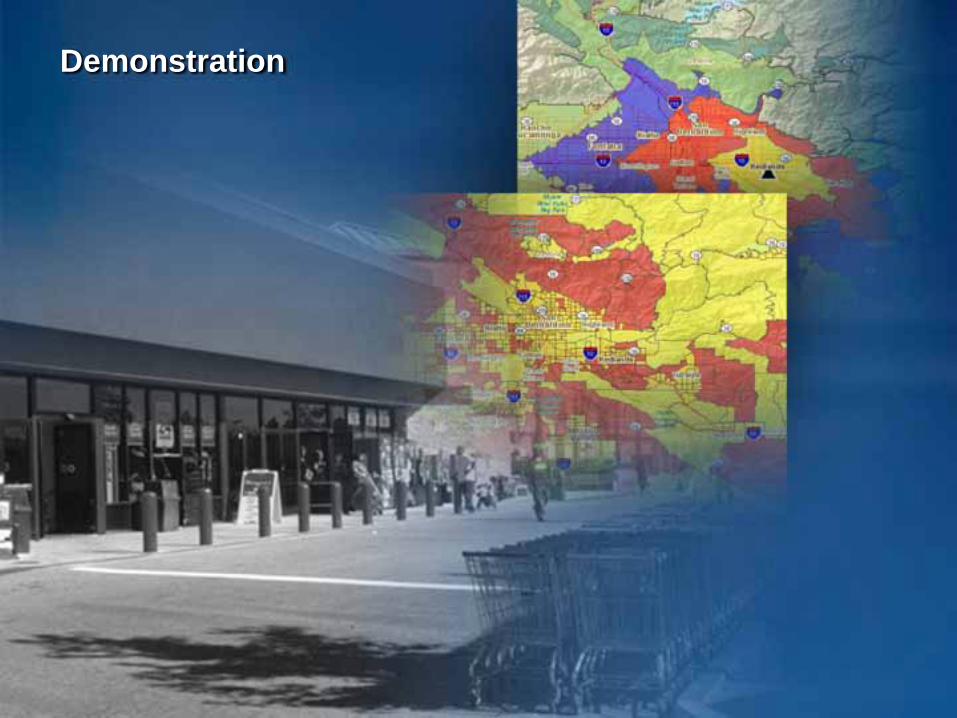
Demonstration
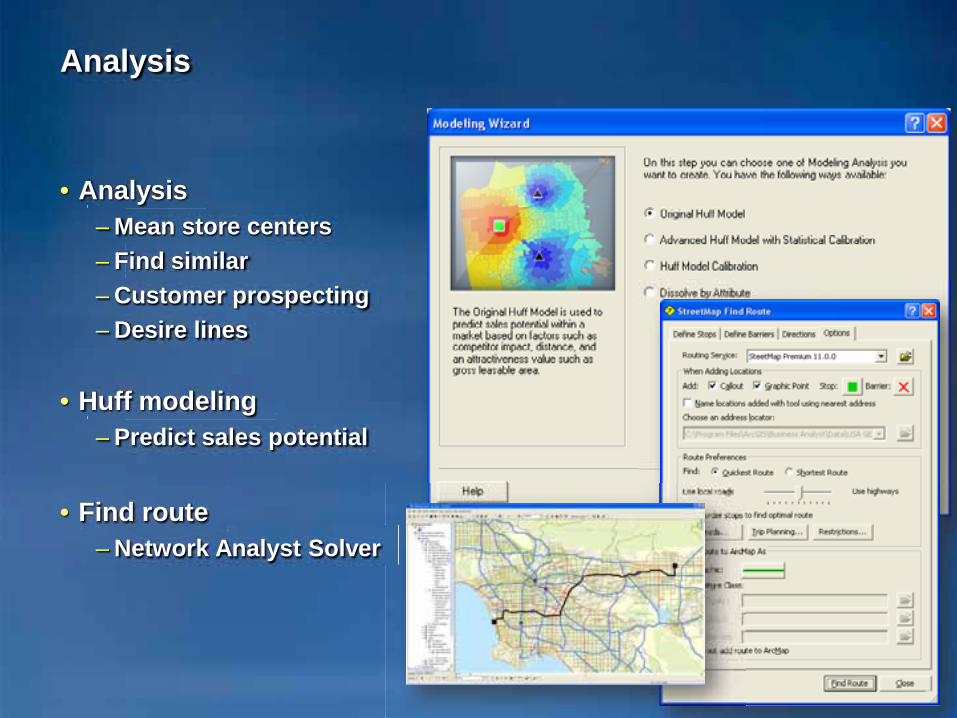
Analysis
• Analysis– Mean store centers– Find similar– Customer prospecting– Desire lines
• Huff modeling– Predict sales potential
• Find route– Network Analyst Solver
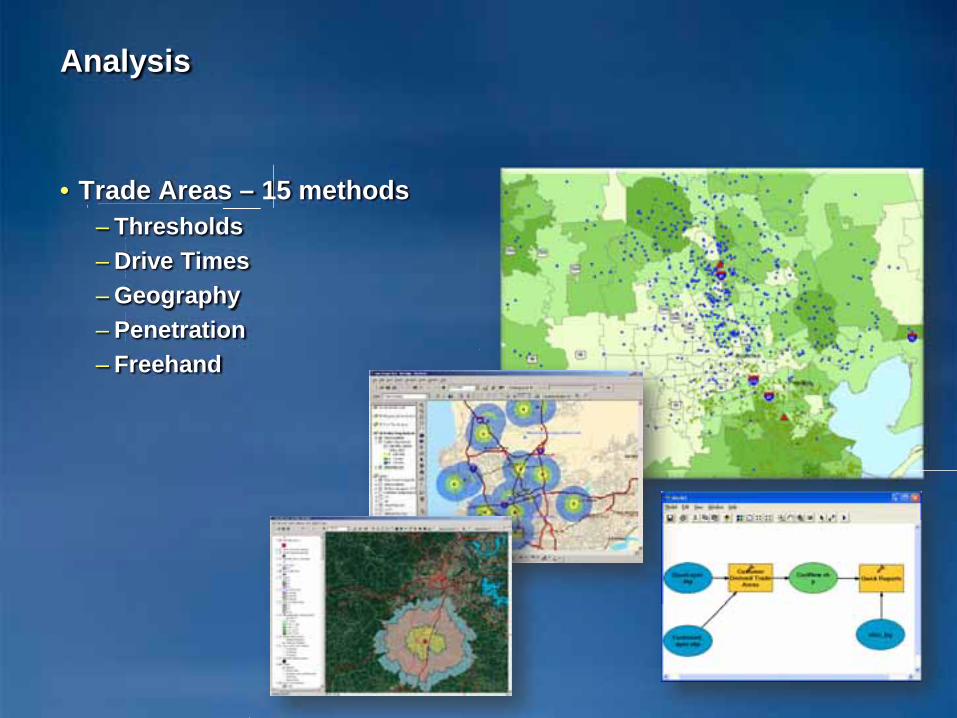
Analysis
• Trade Areas – 15 methods– Thresholds– Drive Times– Geography– Penetration– Freehand
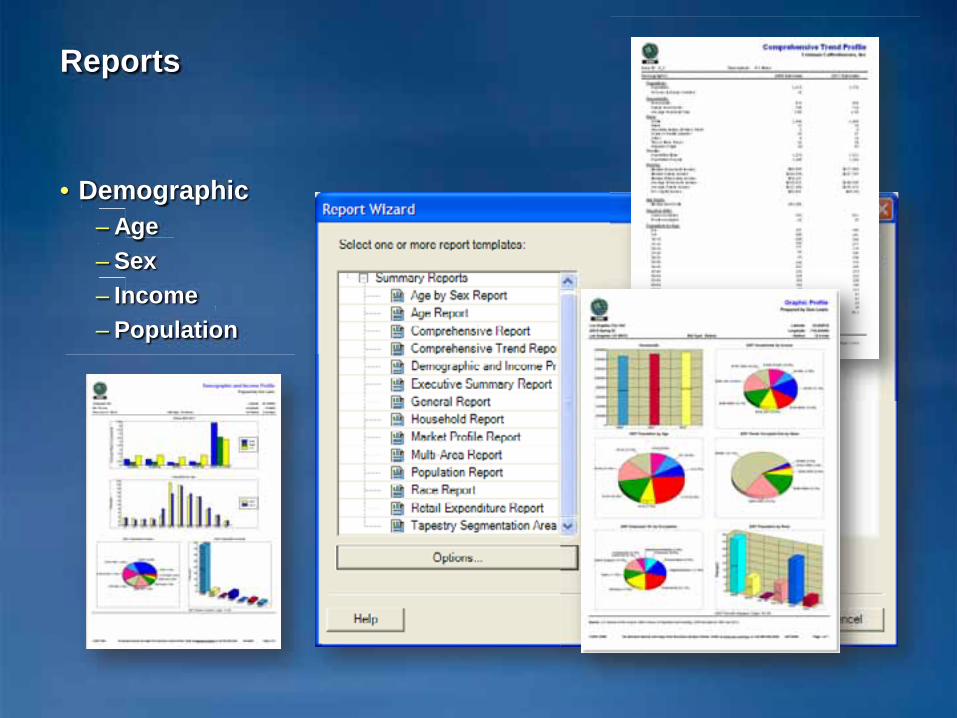
Reports
• Demographic– Age– Sex– Income– Population
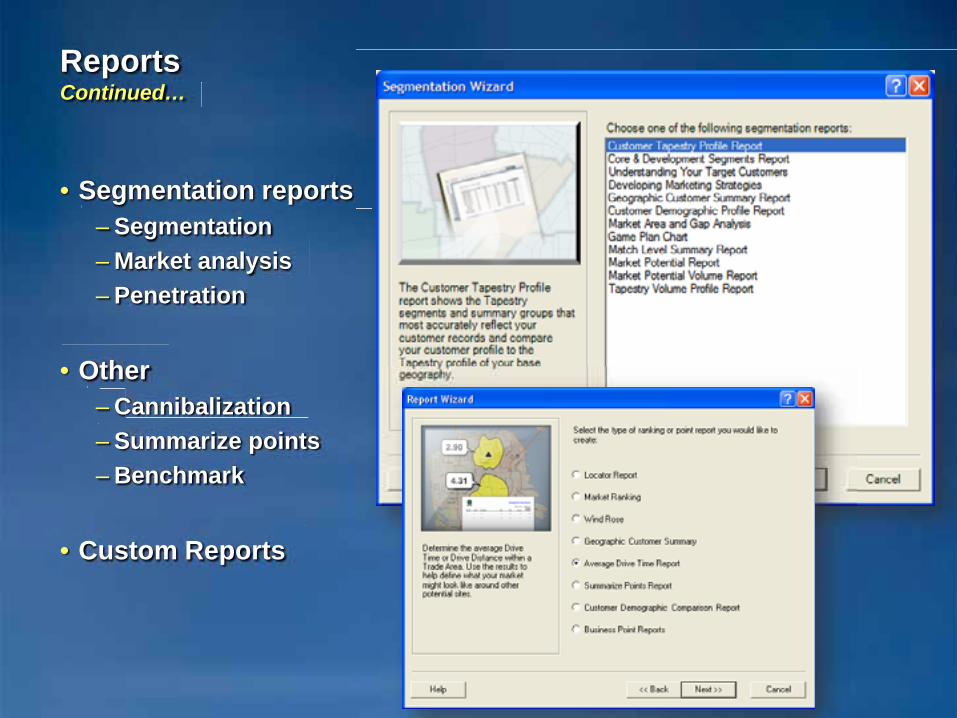
ReportsContinued…
• Segmentation reports– Segmentation– Market analysis– Penetration
• Other– Cannibalization– Summarize points– Benchmark
• Custom Reports

Business AnalystOnline
Business AnalystDesktop
Business AnalystServer
ArcGIS Business Analyst Suite
ArcGIS
AddressCoder
ESRI Data
+ API

How do I select the correct product?
• How many users will you have?
• Casual users or analyst?
• Internal or external facing application?
• Application branding?
• What do you want to find out?

Business Analyst OnlineWhat is it
• Web application for creating quick reports and analysis– Site screening and evaluation– Market analysis– Site comparison
• Three subscription levels– Basic – 17 free reports– Premium – 35 free reports– Per report
onn

Business Analyst OnlineBenefits
• Easy to learn and use
• Built for Non-GIS Professionals– Workflow Driven
• No need to update or install software or data
• Only internet access needed
• Save information– Sites– Application preferences

Business Analyst Online APIWhat is it
• Quick and focused customizable reporting web application– Single site screening and evaluation– Market analysis– Limited geography
• Two subscription levels– Basic – 17 free reports– Premium – 35 free reports
Business Analyst Online APIBenefits
• Self service application
• Branded application
• Only internet access needed
• Created for web developers
• No need to update or install data– Consumes ArcGIS Online Services
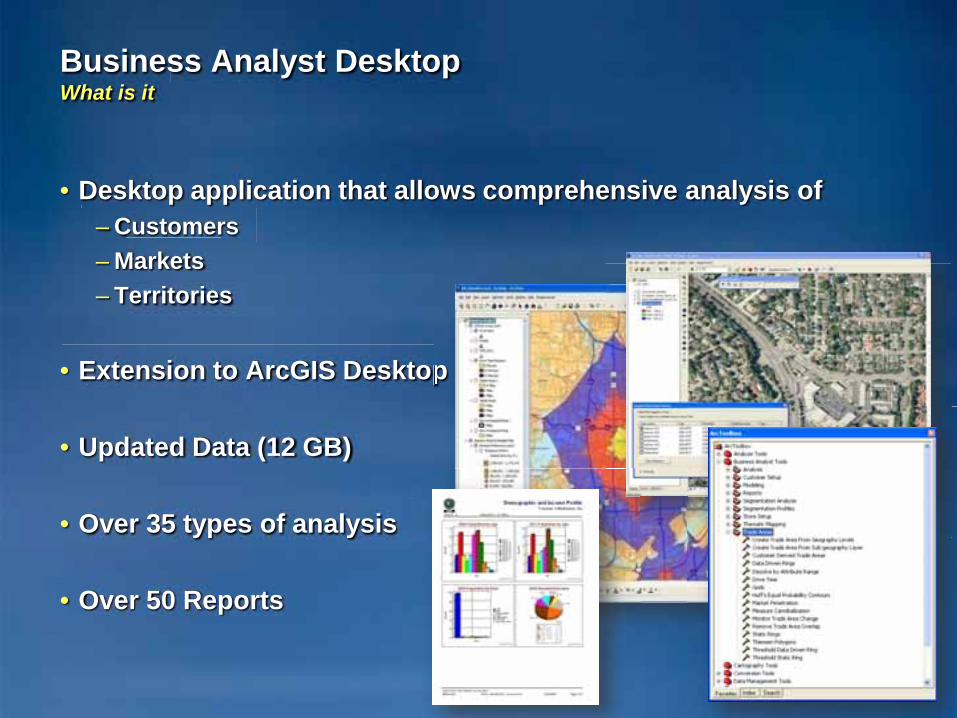
Business Analyst DesktopWhat is it
• Desktop application that allows comprehensive analysis of – Customers– Markets– Territories
• Extension to ArcGIS Desktop
• Updated Data (12 GB)
• Over 35 types of analysis
• Over 50 Reports
pp

Business Analyst DesktopBenefits
• Data– Segmentation module
• Built for analyst– Wizard driven
• Geoprocessing
• Powerful analysis– Predictive sales (Huff model)– Territory balancing

Business Analyst ServerWhat is it
Business AnalystDesktop
Business Analyst Server
Economic Development
Local Businesses
Potential Businesses
ArcGISOnline
Business Data
Land Use
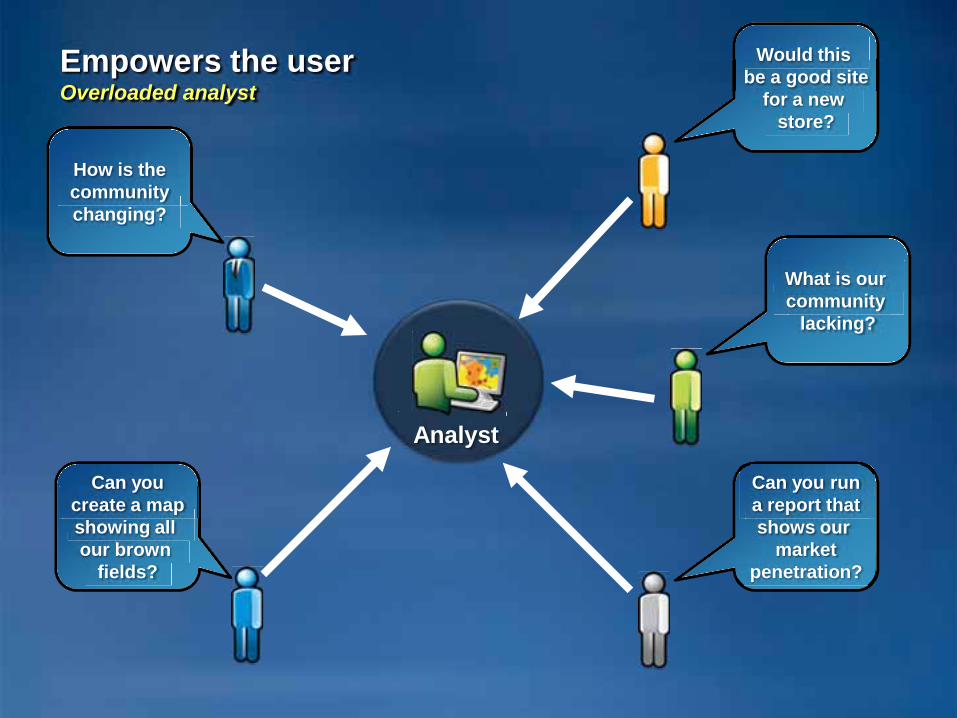
Empowers the userOverloaded analyst
Analyst
Can you runa report thatshows our
marketpenetration?
What is our community
lacking?
How is thecommunity changing?
Can youcreate a mapshowing all our brown
fields?
Would this be a good site
for a new store?
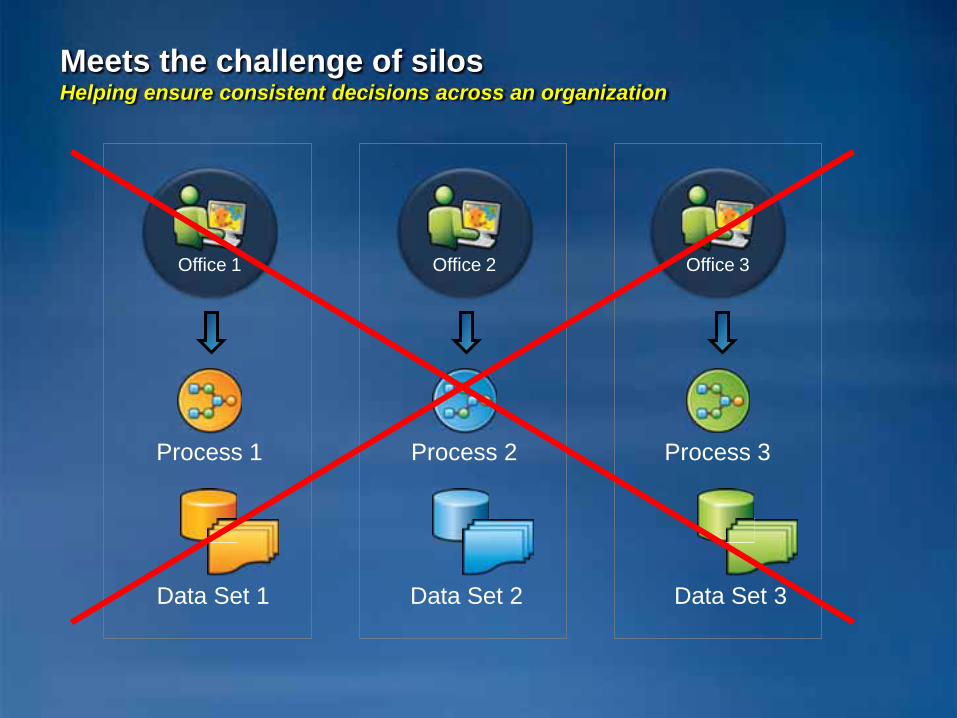
Meets the challenge of silosHelping ensure consistent decisions across an organization
Office 1
Process 1
Data Set 1
Office 2
Process 2
Data Set 2
Office 3
Process 3
Data Set 3

Next Steps…
• Business Analyst Online - bao.esri.com– ESRI Global Account– Day pass– Individual reports– Annual subscription
• Communicate results with departments– Economic development– Planning– GIS
SummaryThrough data, analysis, and reporting
• Attract the correct types of businesses
• Help local businesses be more successful
• Complete understanding of a community
• Improve the quality and stability of a community

Resource Centersresources.esri.com

Resources
• Business Analyst – www.esri.com/arcgisbusinessanalyst• ESRI data – www.esri.com/data/esri_data/index.html
– Types of data– White papers and methodologies
• Economic development - www.esri.com/industries/economic-dev/index.html
• Business Analyst Online product page – www.esri.com/bao• Podcast
– Business Analyst Online for Economic Development– ArcGIS Business Analyst Server
• Instructor led training– Introduction to Business Analyst
• Self study course– Getting Started with ArcGIS Business Analyst
Thank You
Questions
Please fill out survey