leveraging boiler room control data for optimized … · leveraging boiler room control ... boiler...
TRANSCRIPT

Leveraging Boiler Room Control Data for
Optimized Operations
Presented by Steve Connor
May 27, 2015

2
Today’s Topics
Plant Automation Evolution &
Monitoring/Control points
SCADA , the What, How & Why
The Industrial Process Control System
(ICS) & link to the Boiler Room
Leveraging Automated Boiler Room
Control Data for facility optimization
1
2
3
4

The way we were…
3

MA Station & Strip Charts
4
Manual/Auto stations allowed operators to individually
control many elements of the boiler

DDC
5
Note:
Technology started to
advance but operators could
still not get a complete feel
for the total plant operation
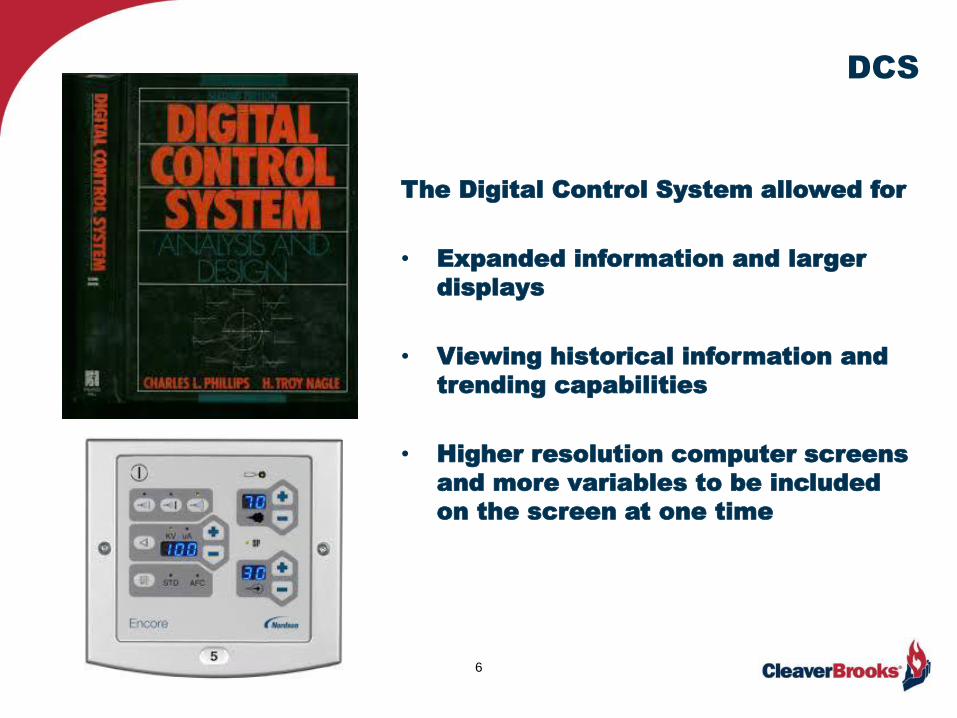
DCS
6
The Digital Control System allowed for
• Expanded information and larger
displays
• Viewing historical information and
trending capabilities
• Higher resolution computer screens
and more variables to be included
on the screen at one time

Fuzzy Logic
7
• Boiler scaling?
• Boiler sooting?
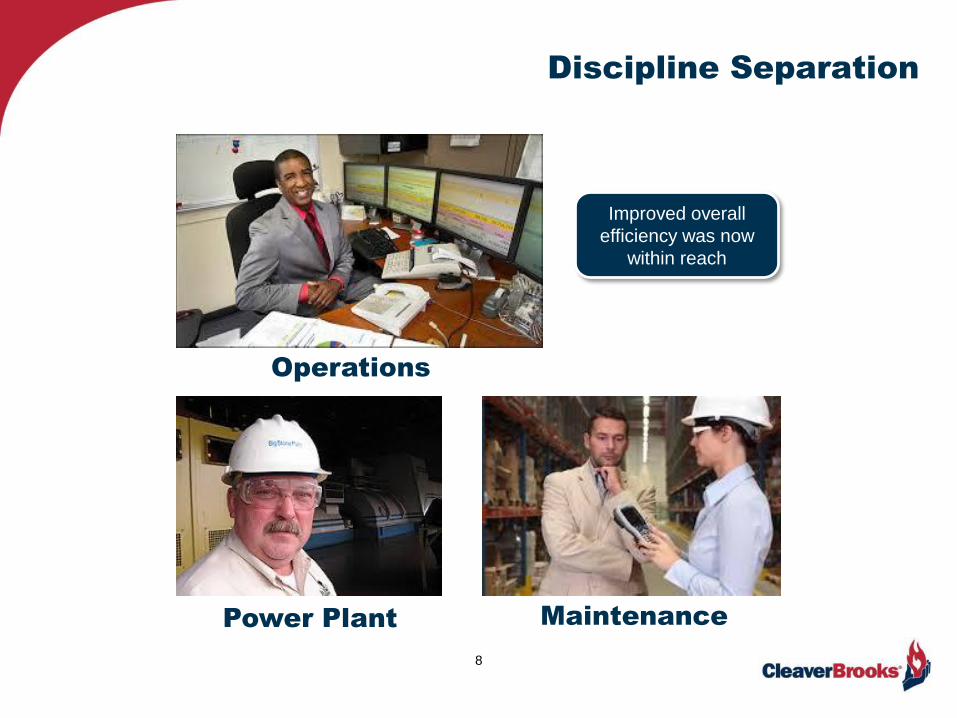
Discipline Separation
8
Maintenance
Operations
Power Plant
Improved overall
efficiency was now
within reach
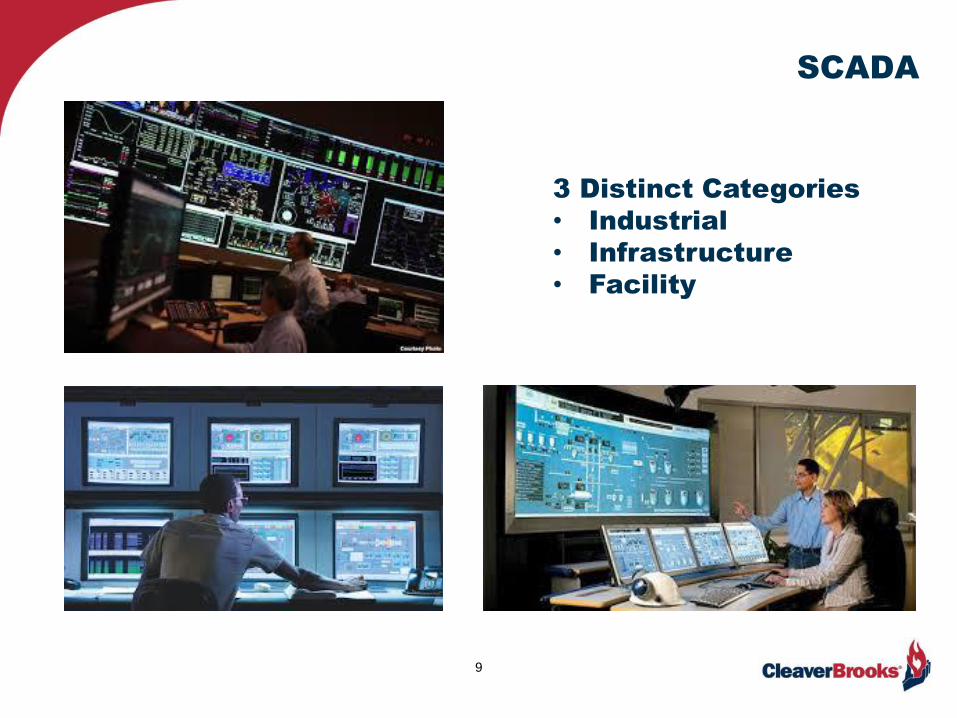
SCADA
9
3 Distinct Categories
• Industrial
• Infrastructure
• Facility

Industrial Control System (ICS)
10
• Manufacturing
• Maintenance & Power Generation
• Power Generation For the Boiler Room
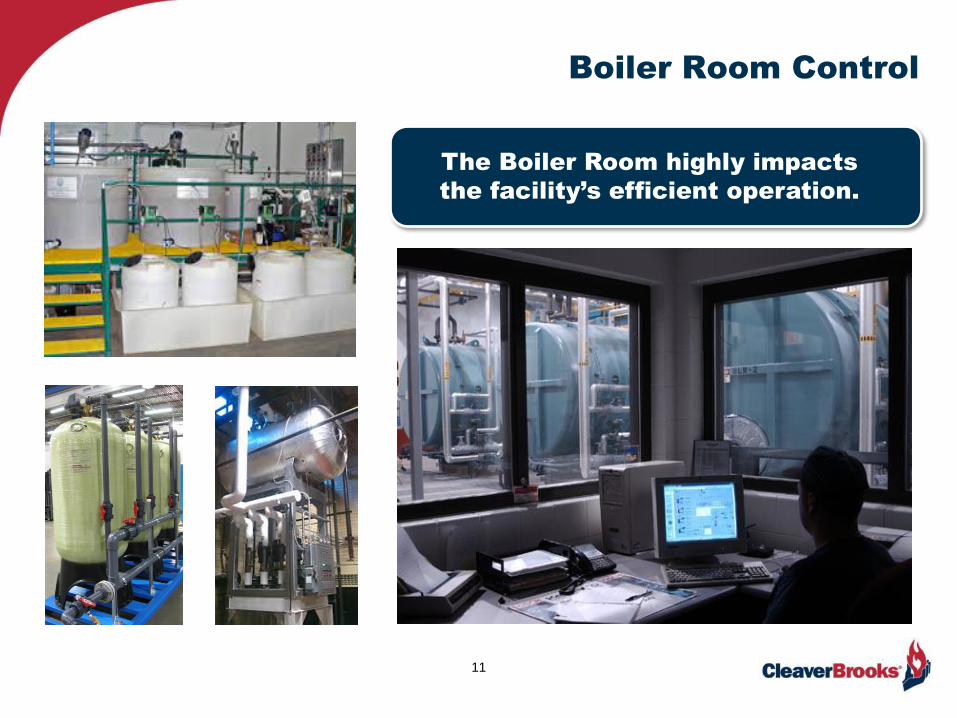
Boiler Room Control
11
The Boiler Room highly impacts
the facility’s efficient operation.
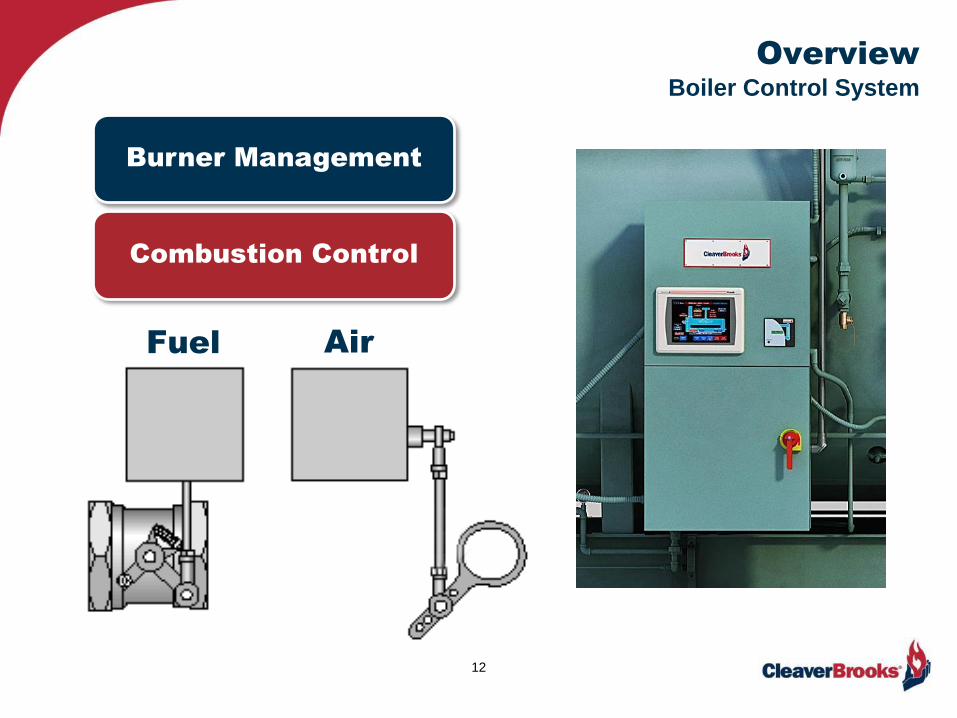
Overview
Boiler Control System
12
Fuel Air
Burner Management
Combustion Control

The Burner Management System (BMS)
13
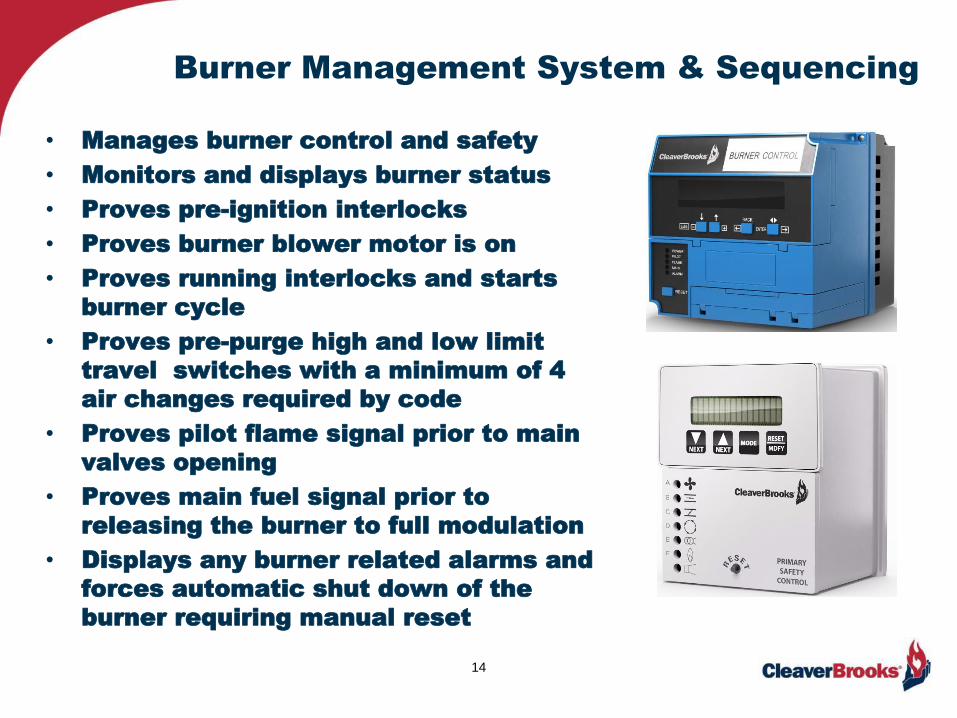
• Manages burner control and safety
• Monitors and displays burner status
• Proves pre-ignition interlocks
• Proves burner blower motor is on
• Proves running interlocks and starts
burner cycle
• Proves pre-purge high and low limit
travel switches with a minimum of 4
air changes required by code
• Proves pilot flame signal prior to main
valves opening
• Proves main fuel signal prior to
releasing the burner to full modulation
• Displays any burner related alarms and
forces automatic shut down of the
burner requiring manual reset
14
Burner Management System & Sequencing
15
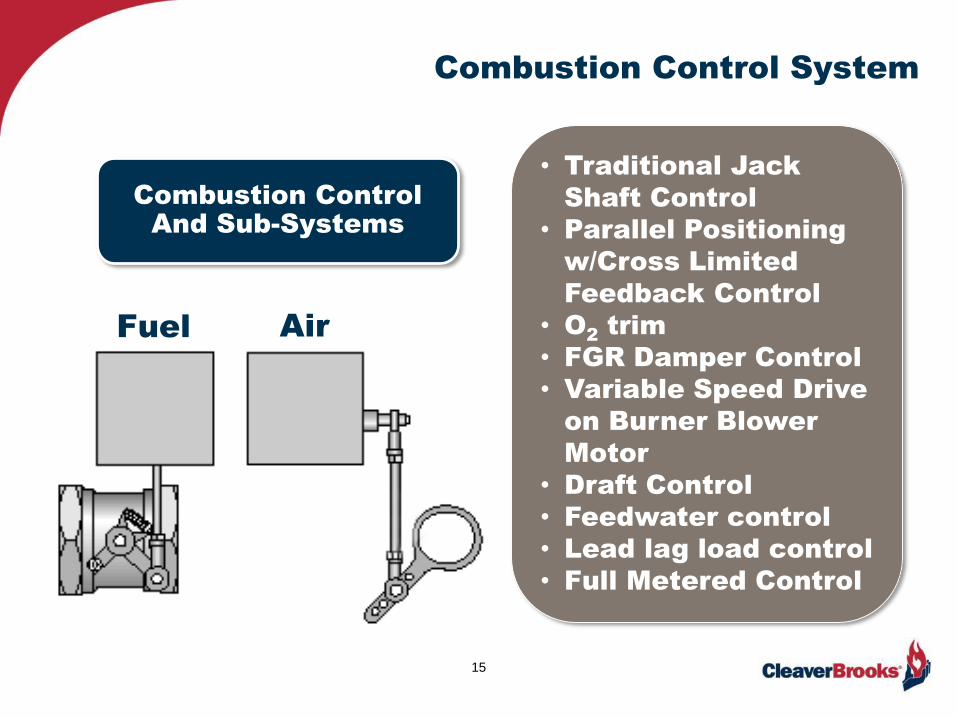
• Traditional Jack
Shaft Control
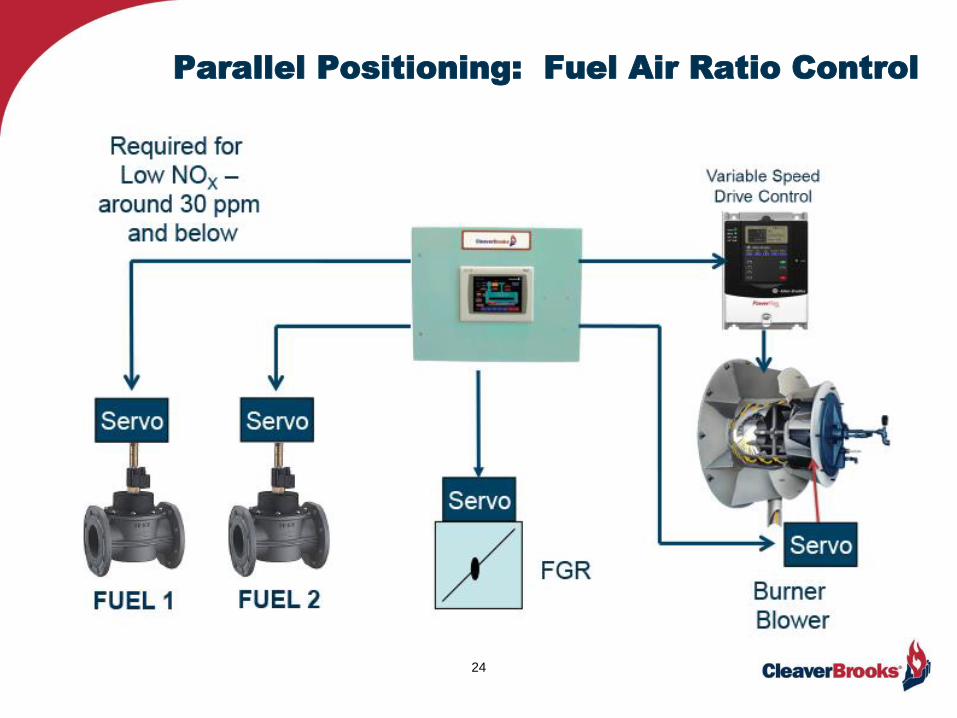
• Parallel Positioning
w/Cross Limited
Feedback Control
• O2
trim
• FGR Damper Control
• Variable Speed Drive
on Burner Blower
Motor
• Draft Control
• Feedwater control
• Lead lag load control
• Full Metered Control
Fuel Air
Combustion Control
And Sub-Systems
Combustion Control System

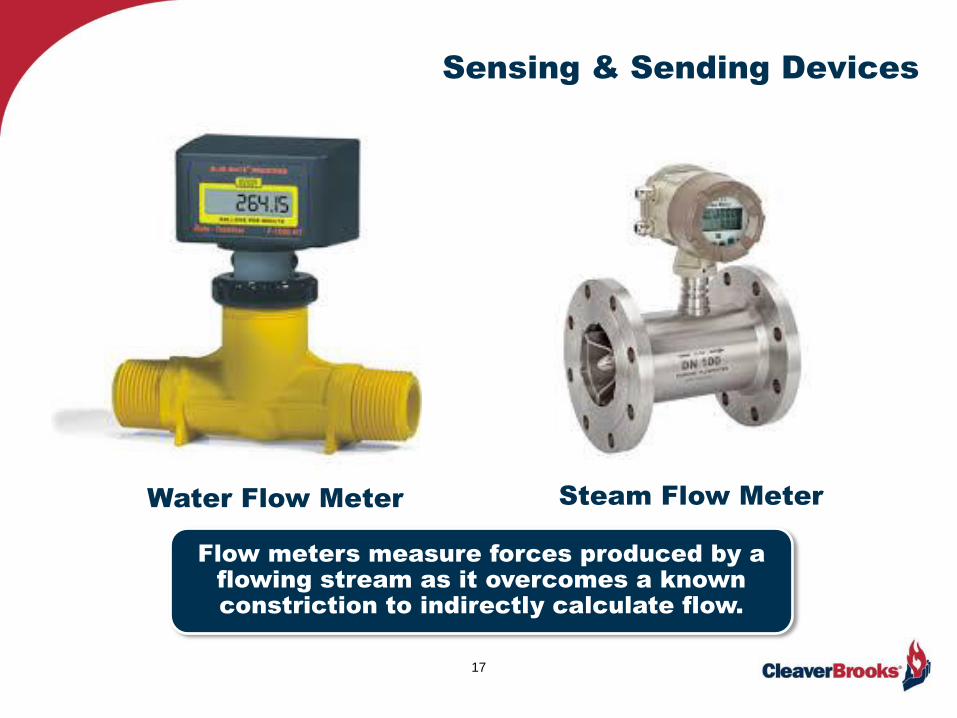
Sensing & Sending Devices
16
RTD
Transducer
Transmitter
Thermistors Thermocouple
Sensing & Sending Devices
17
Water Flow Meter Steam Flow Meter
Flow meters measure forces produced by a
flowing stream as it overcomes a known
constriction to indirectly calculate flow.
18
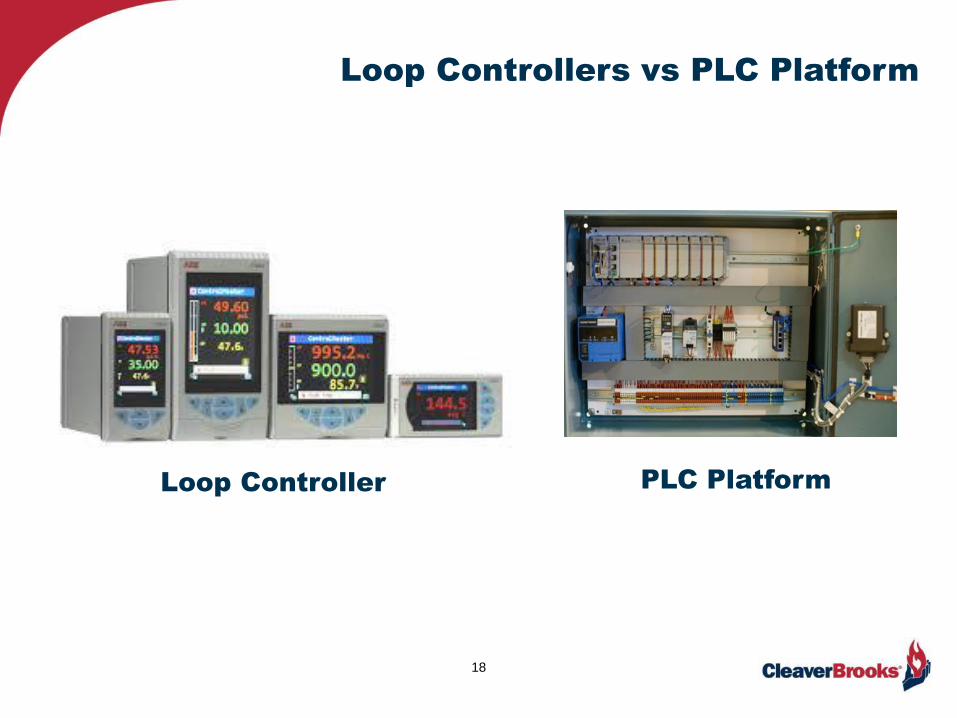
Loop Controllers vs PLC Platform
Loop Controller PLC Platform

19
Firing
Rate
Control
Fuel-Air
Ratio
Control
O2
Trim
Draft
Control
Economizer
ControlVSD
Control
Requires
• Individual loop
controllers
• Separate control
panel
• Interface wiring
for BMS
• Relays and timers
• Extra wiring
• Expert tuning
Multiple Control Loops
Lead/Lag
Control
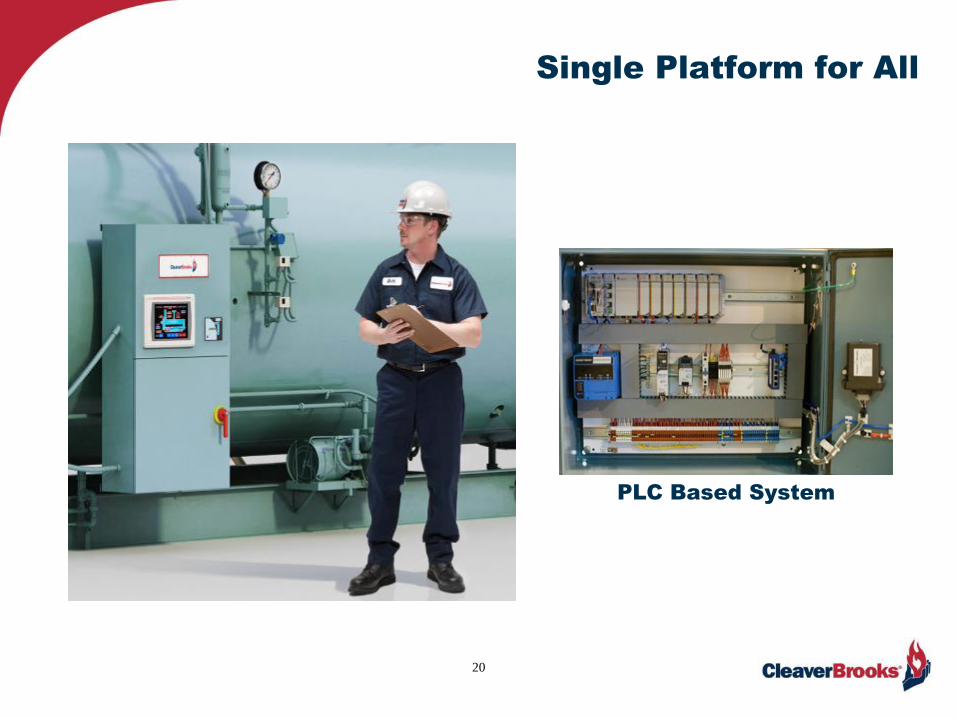
Single Platform for All
20
PLC Based System
21
21
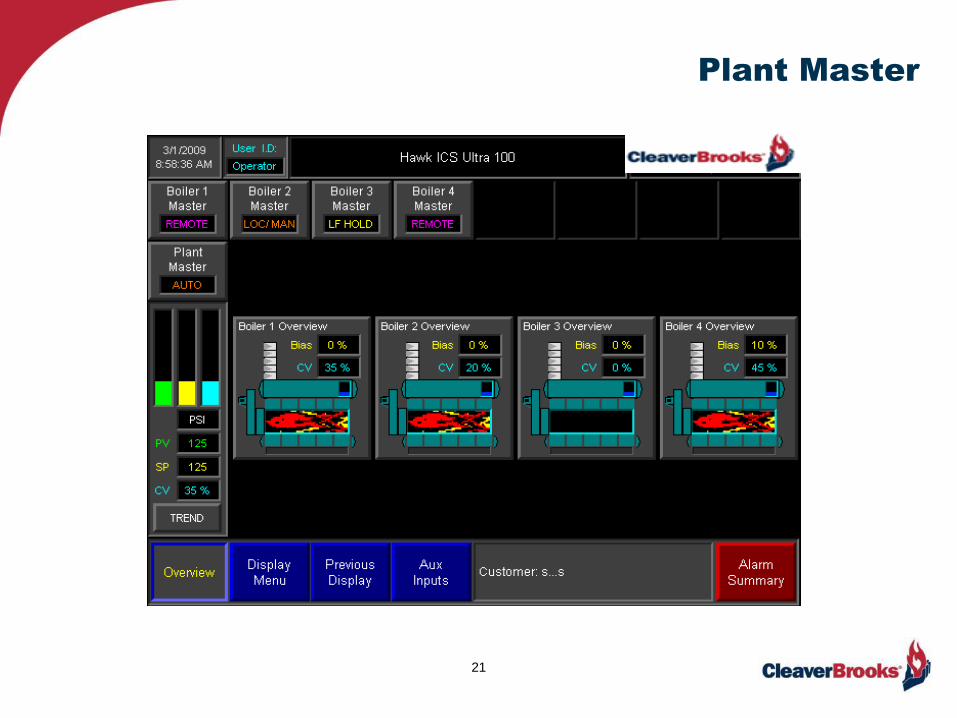
Plant Master
22
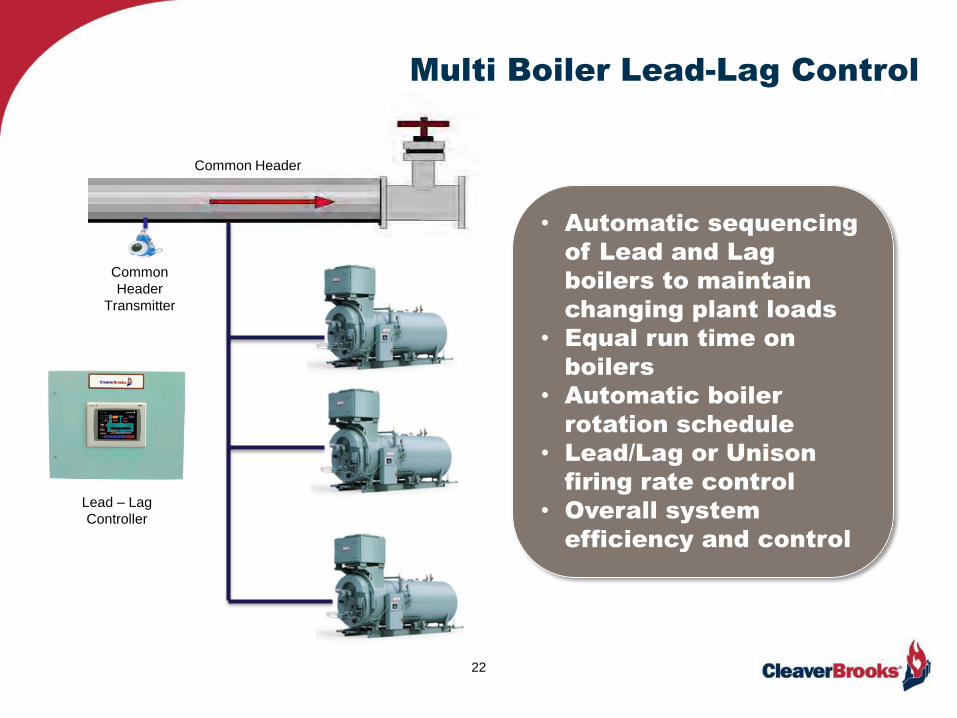
• Automatic sequencing
of Lead and Lag
boilers to maintain
changing plant loads
• Equal run time on
boilers
• Automatic boiler
rotation schedule
• Lead/Lag or Unison
firing rate control
• Overall system
efficiency and control
Common
Header
Transmitter
Lead – Lag
Controller
Common Header
Multi Boiler Lead-Lag Control

23
Ambient Air
Temp
Fuel
O2
Boiler
Exhaust
Gases
Air
O2
Trim Control
24
Parallel Positioning: Fuel Air Ratio Control

25
Stack Draft
Transmitter
Stack Draft Damper
Draft Control

Feed Water Flow
26
Steam flow integration with
modulating feed water control and
firing rate can be used for chemical
treatment monitoring.
Feedwater
Steam
Common Header

Design Engineering
27
SAMA Diagram
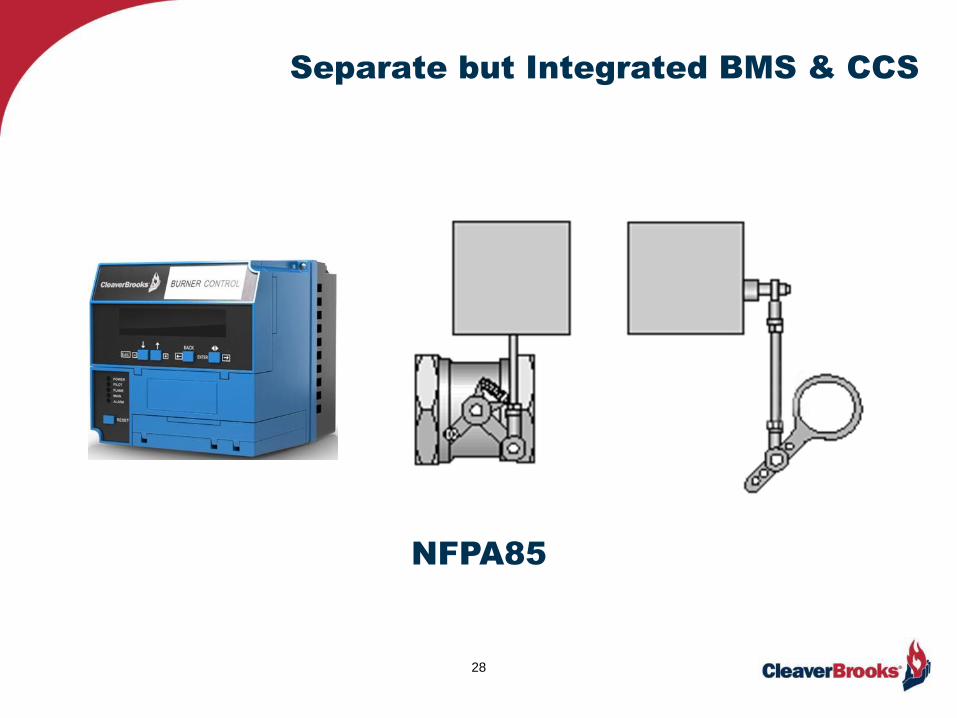
Separate but Integrated BMS & CCS
28
NFPA85

PLC Based System
Typical Status Overview Screen
29
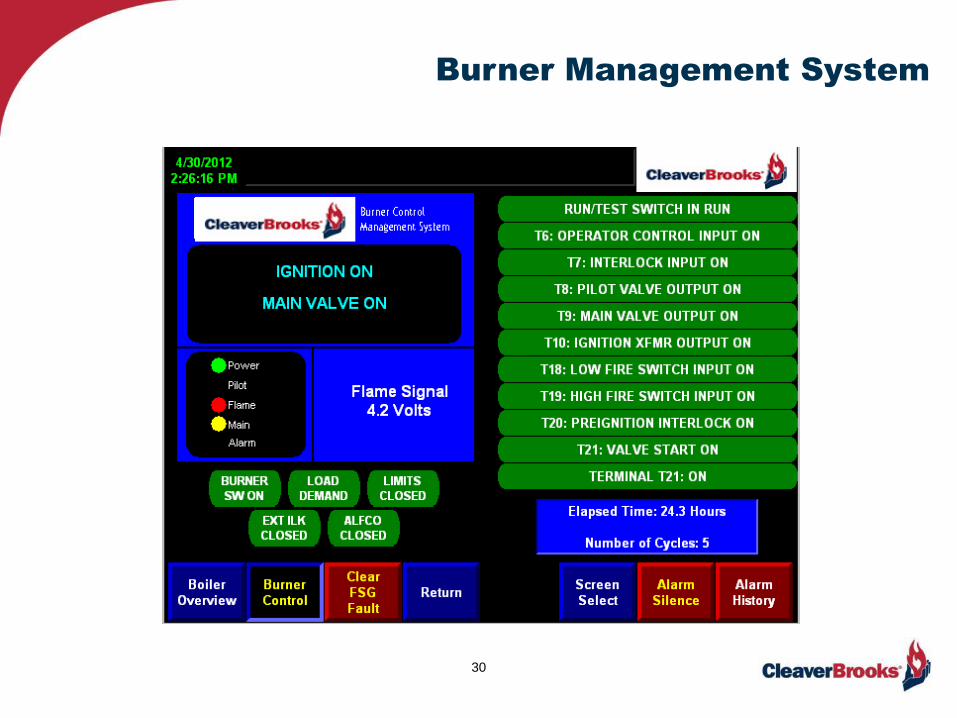
Burner Management System
30

31
Firing Rate Control Screen

32
Natural Gas
Feedwater
Oil
Boiler Draft
Combustion
Air
Boiler Steam
Various Boiler Pressure Points
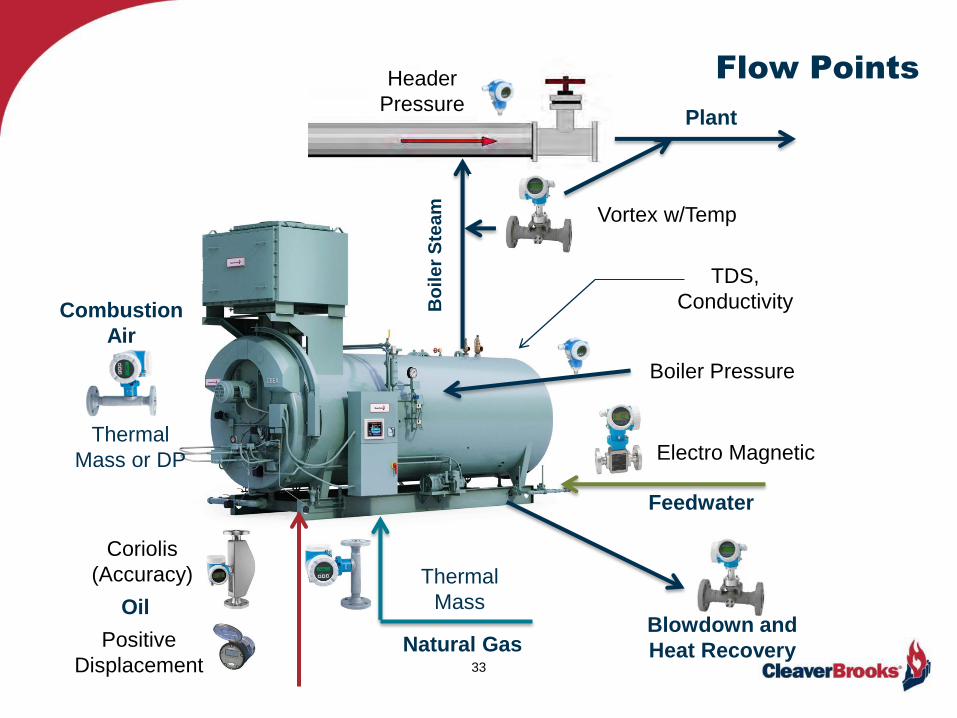
Natural Gas
Feedwater
Header
Pressure
Vortex w/Temp
Boiler Pressure
Electro Magnetic
Thermal
MassOil
Coriolis
(Accuracy)
Positive
Displacement
Bo
ile
r S
tea
m
Plant
Blowdown and
Heat Recovery
Combustion
Air
Thermal
Mass or DP
TDS,
Conductivity
33
Flow Points
34
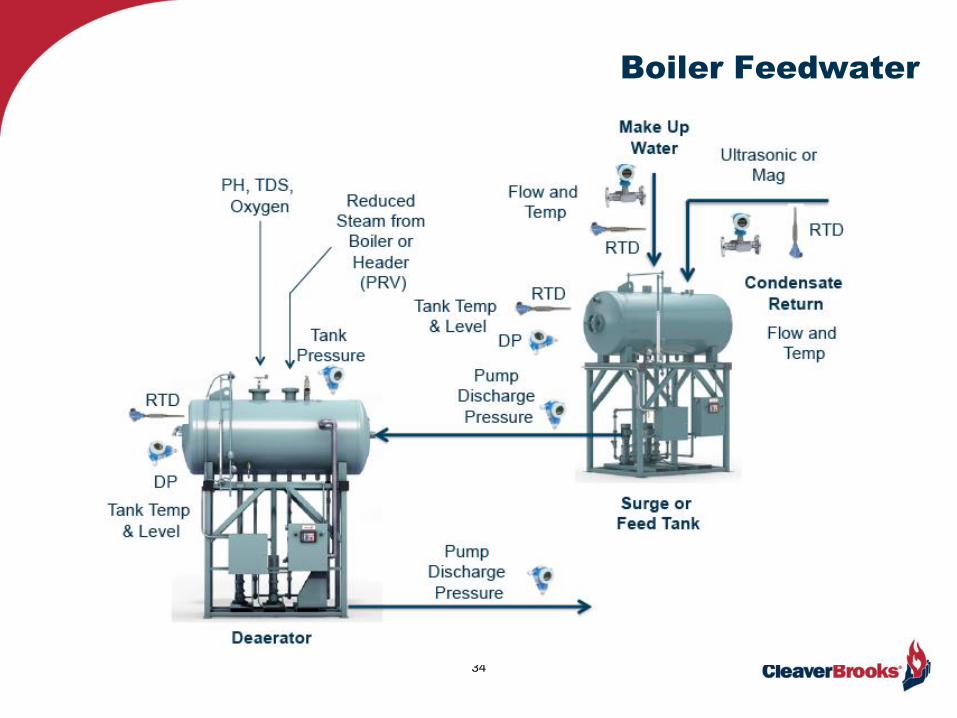
Boiler Feedwater

35
Various Added Boiler Temperature Points
36
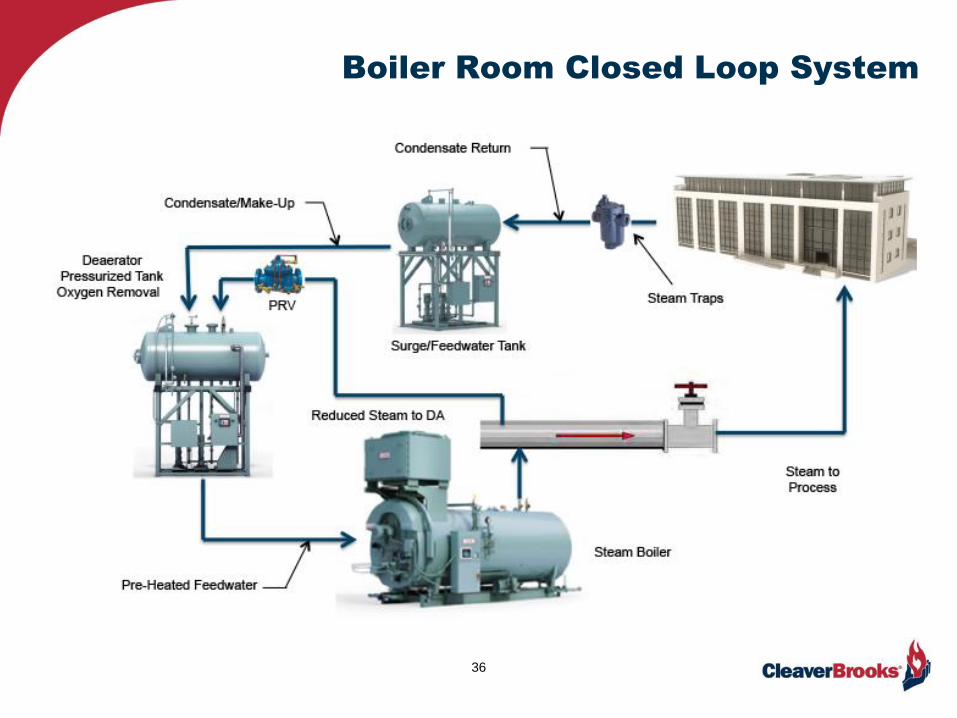
Boiler Room Closed Loop System
37
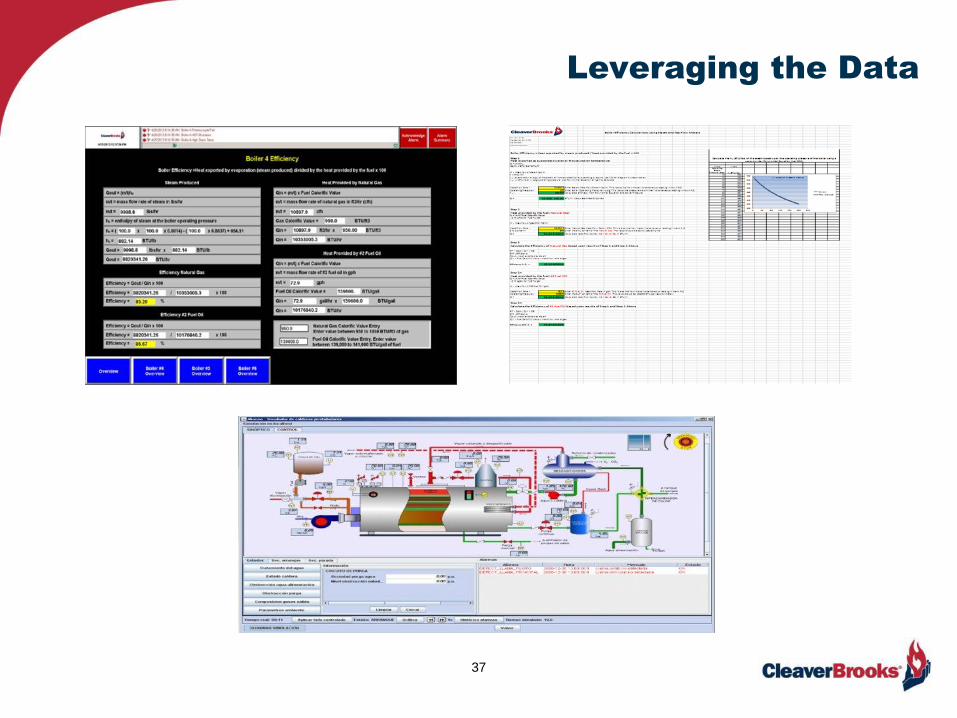
Leveraging the Data

Assessment Cornerstones
38
Efficiency
Sustainability
Reliability
Safety

Steam Flow vs Fuel Flow
39
1,000# of Steam/HR x Fuel Cost = Cost of Steam/1000#
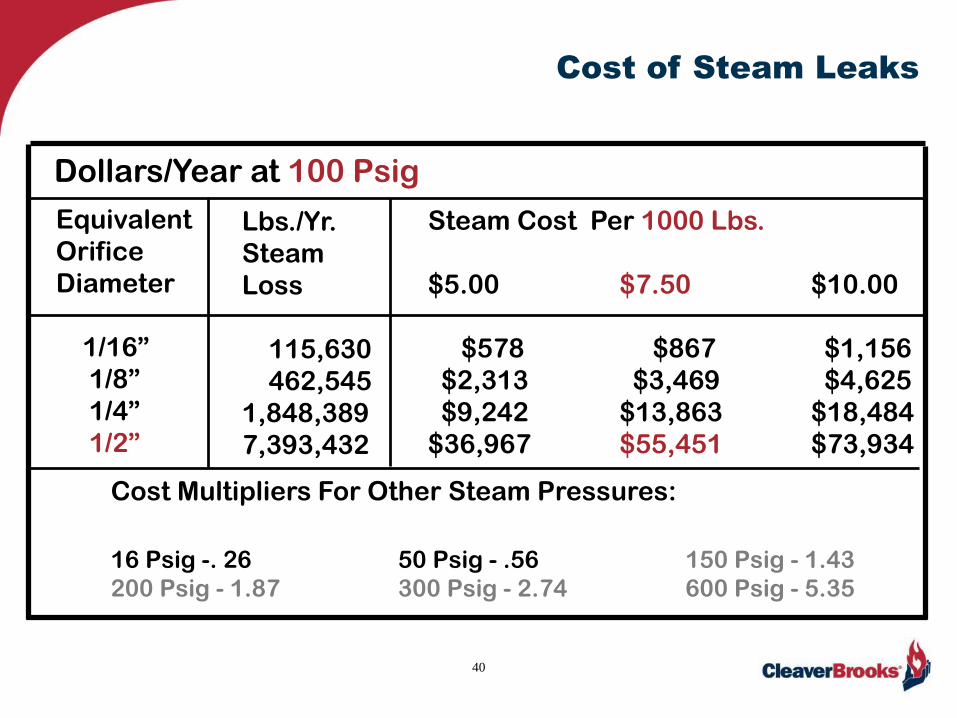
Dollars/Year at 100 Psig
Equivalent
Orifice
Diameter
1/16”
1/8”
1/4”
1/2”
Lbs./Yr.
Steam
Loss
115,630
462,545
1,848,389
7,393,432
Steam Cost Per 1000 Lbs.
$5.00 $7.50 $10.00
$578 $867 $1,156
$2,313 $3,469 $4,625
$9,242 $13,863 $18,484
$36,967 $55,451 $73,934
Cost Multipliers For Other Steam Pressures:
16 Psig -. 26 50 Psig - .56 150 Psig - 1.43
200 Psig - 1.87 300 Psig - 2.74 600 Psig - 5.35
40
Cost of Steam Leaks

Steam Flow & Pressure vs Drum Level
41
Remember: For each pound of steam you evaporate a
pound of water and there’s 8.3 pounds of water in a gallon.

Feed Water Temperature Variance
42
Temperature drop from
227 Deg. F to 200 Deg. F

Steam Header Pressure Decay
43

44
TemperaturePressure
Firing rate controller
Stack Temperature vs
Drum Pressure & Firing Rate
Data points should be gathered,
stored and routinely evaluated.

Stack Temperature
Combustion Efficiency for Natural Gas
45

Combustion Air Temperature Variance
46

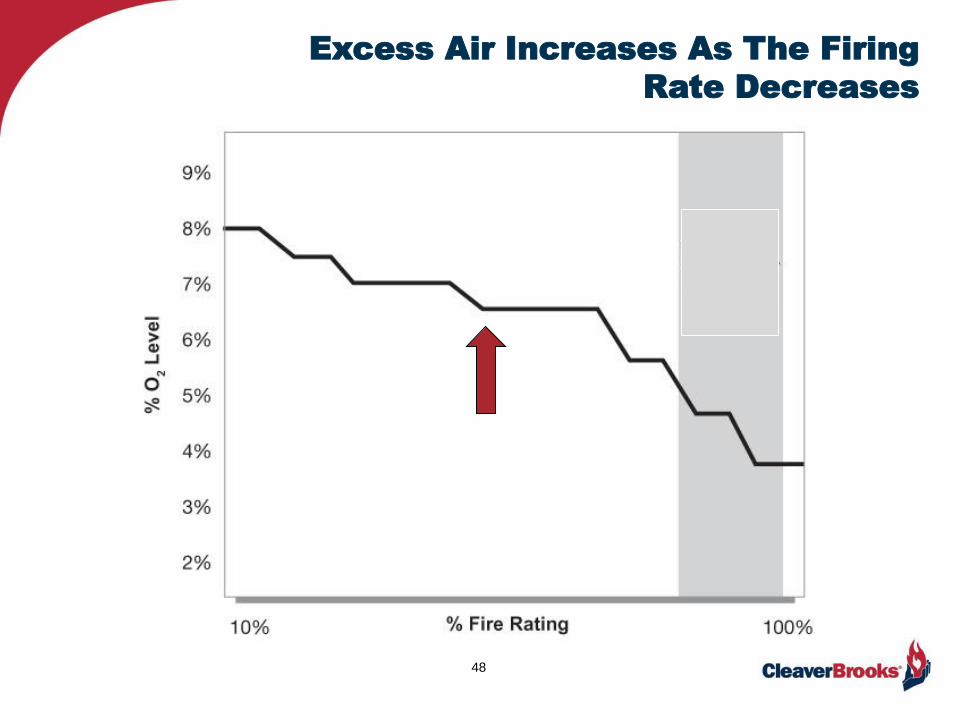
O2 vs Firing Rate
47
O2 Sensing Firing Rate Metering Cam
48
Excess Air Increases As The Firing
Rate Decreases
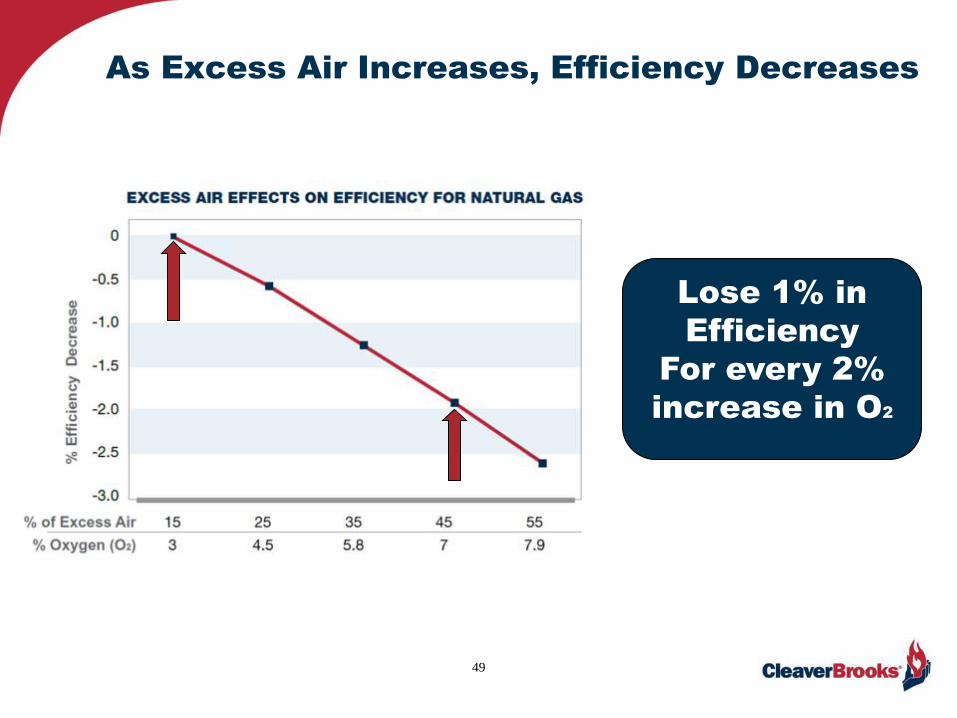
As Excess Air Increases, Efficiency Decreases
49
Lose 1% in
Efficiency
For every 2%
increase in O2
5050
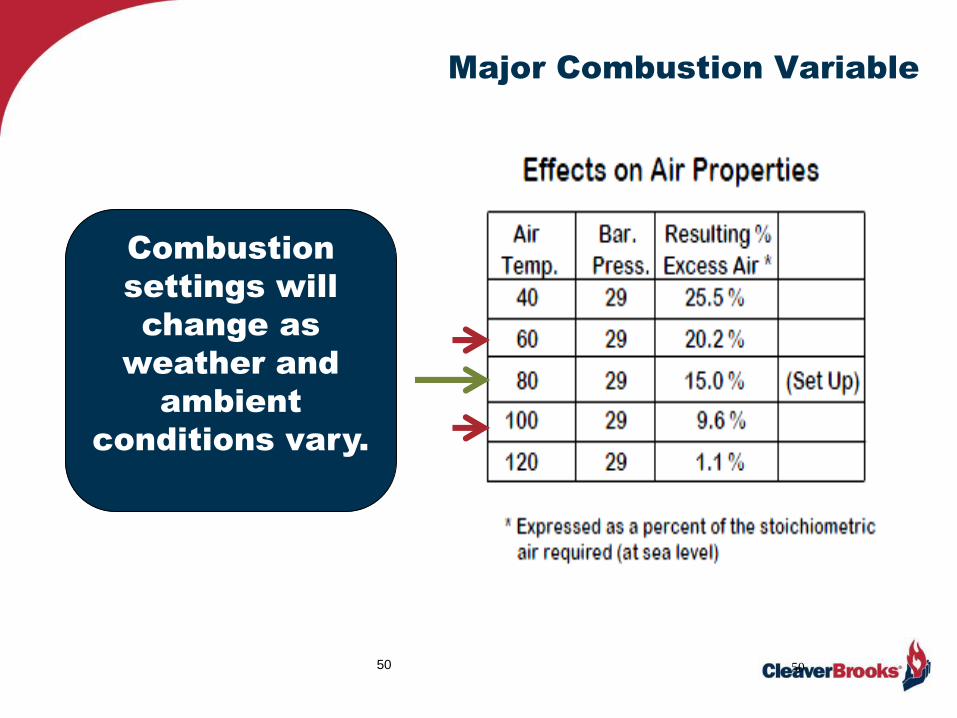
Major Combustion Variable
Combustion
settings will
change as
weather and
ambient
conditions vary.
51
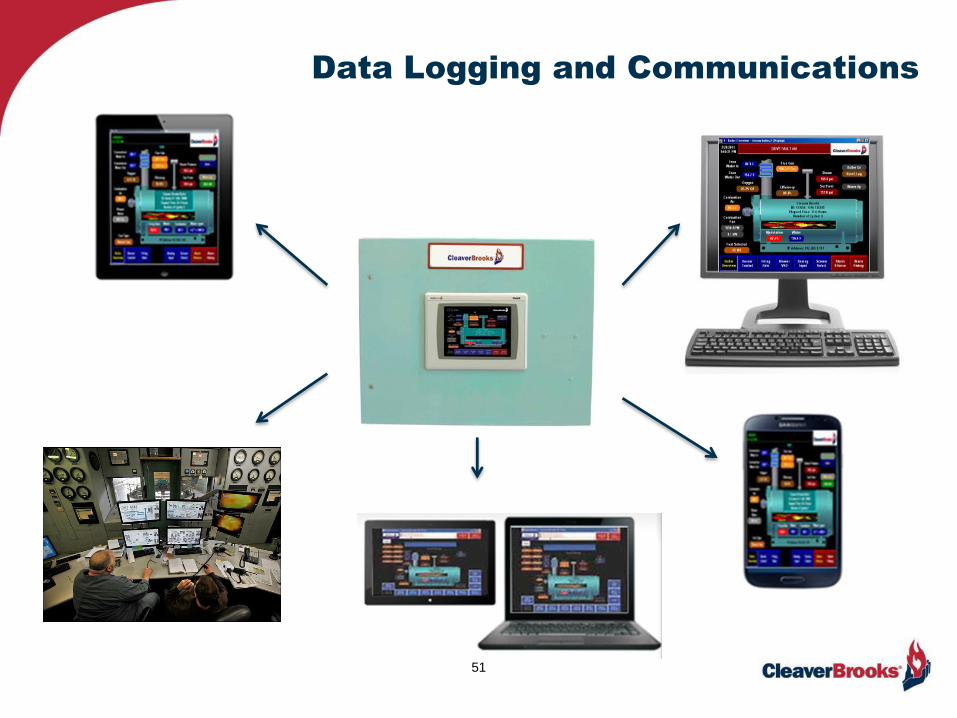
Data Logging and Communications

52
Alarm Printer
Data Printer
Uninterruptabl
e Power
Supply
Data Logging and Communications
53
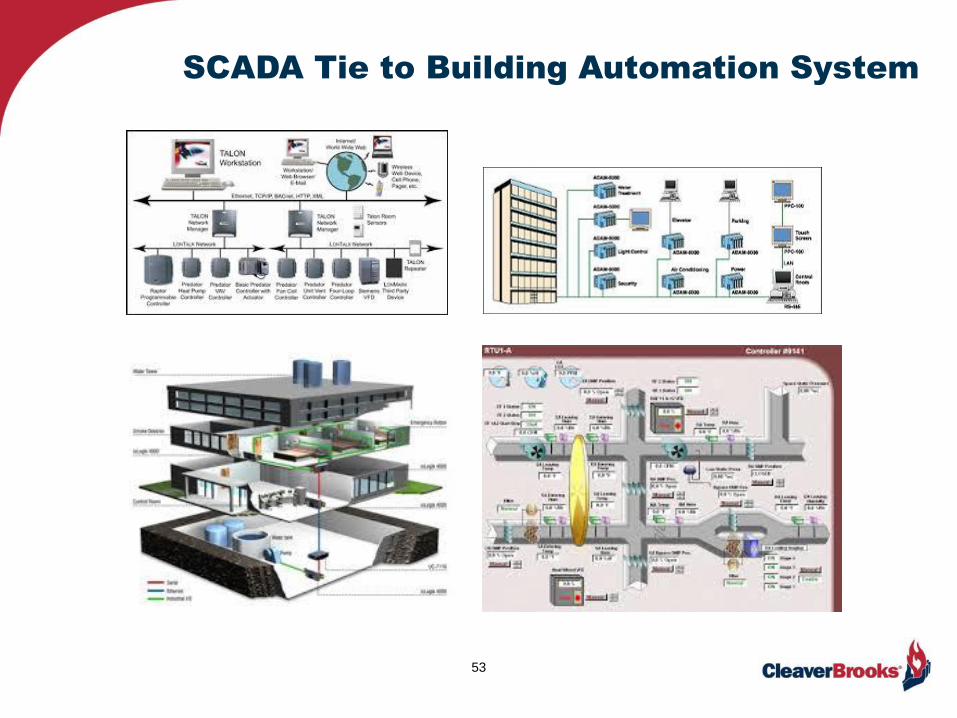
SCADA Tie to Building Automation System

Information & System Control Data
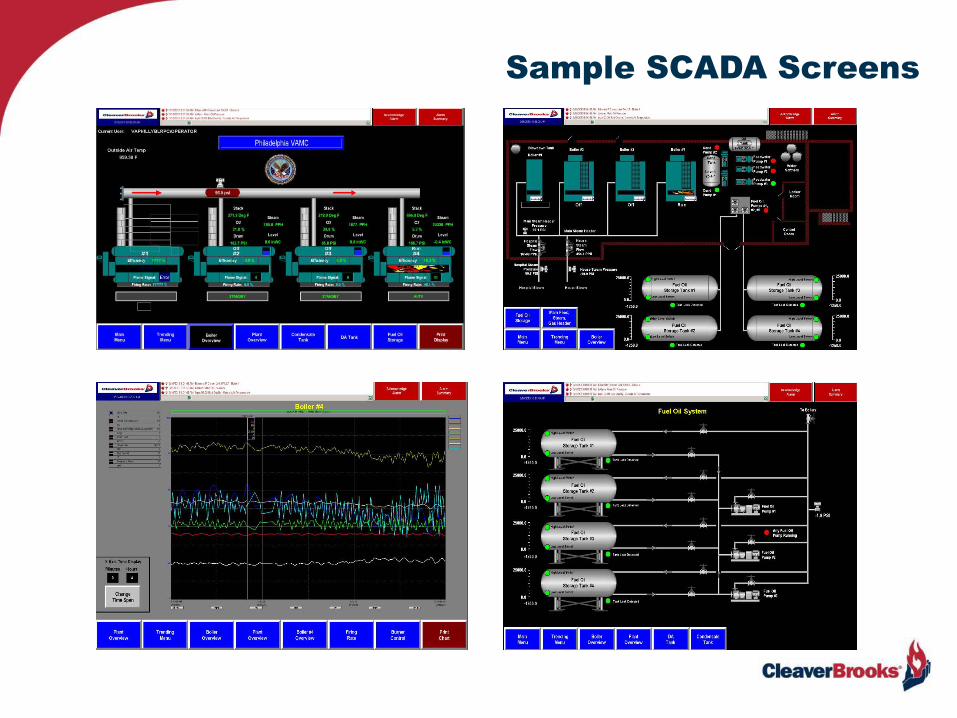
Sample SCADA Screens

Summary
56
• Today’s advanced Industrial Control Systems allow the Power house,
Maintenance and Operations to collaborate and share information.
• SCADA tie-in allows this information to be transmitted globally.
• The Burner Management System controls and sequences the burner.
• The Combustion Control System controls other related functions such as
fuel/air metering, feed water metering, draft, motor speeds, etc.
• The BMS & CCS must be separate per NFPA85, though integrated.
• Boiler control and monitoring can be through loop controllers or a PLC platform
which is becoming the preferred method because of its high degree of
integration and ease of field install.
• The PLC based platform can be expanded to include various controls and
sensors for capturing valuable data for leveraging plant optimization.
• This information should be logged and trended to maximize fuel Efficiency,
Sustainability, Reliability and Safety in the plant and throughout the
organization.

Wendell Pipkin
Conversions Sales Manager
229-229-4408
cleaverbrooks.com
57