leverage of multiple predictive maintenance technologies ... · to achieve reliability of...
TRANSCRIPT
Procedia Engineering 144 ( 2016 ) 351 – 359
Available online at www.sciencedirect.com
1877-7058 © 2016 The Authors. Published by Elsevier Ltd. This is an open access article under the CC BY-NC-ND license (http://creativecommons.org/licenses/by-nc-nd/4.0/).Peer-review under responsibility of the organizing committee of ICOVP 2015doi: 10.1016/j.proeng.2016.05.143
ScienceDirect
12th International Conference on Vibration Problems, ICOVP 2015
Leverage of Multiple Predictive Maintenance Technologies in Root Cause failure analysis of Critical
Machineries
Pramod K Behera, Bhabani S Sahoo*
AGM (Mechanical), National Aluminium Company Limited, Bhubaneswar, Odisha, India
Abstract
Globally, the process/manufacturing industries are undergoing through a traumatic phase of transition from buoyancy few years back, to the paroxysm of low off take, rising input price and an adverse business climate menacing their growth prospect. Maximizing asset productivity and ensuring that the associated processes are as efficient as possible are key aspects for organizations striving to gain their strong financial returns. Maintenance costs are one of the largest factors impacting a plant’s budget. Attempts to reduce these costs have led to the development of several maintenance strategies. To achieve reliability of process/system, effective utilization of predictive maintenance has proven to be very effective and beneficial. Predictive maintenance can contribute a lot in improving the bottom line through eliminating unscheduled outages of machine/processes, optimizing the process parameters, improving reliability and productivity. This paper showcases the odyssey of successful implementation of various Predictive maintenance technologies adopted in critical plant assets. © 2016 The Authors. Published by Elsevier Ltd. Peer-review under responsibility of the organizing committee of ICOVP 2015. Keywords: Maintenance; Vibration; Acoustic; Thermography; MCSA; Lube Oil
1. Introduction
Maintenance engineering is the occupation that uses engineering theories and practices to plan and implement routine maintenance of equipment and machinery. All actions are taken to retain material or to restore it to a specified condition. It includes: inspection, testing, servicing, and classification as to serviceability, repair, rebuilding, and reclamation, which is globally known as Condition Monitoring. This must be done in conjunction with optimizing operating procedures and budgets to attain and sustain the highest levels of reliability and profit. Maintenance costs are one of the largest factors impacting a plant’s budget. Attempts to reduce these costs have led to the development of several maintenance strategies. To achieve reliability of process/system, effective
* Corresponding author.
E-mail address: [email protected]; [email protected].
© 2016 The Authors. Published by Elsevier Ltd. This is an open access article under the CC BY-NC-ND license (http://creativecommons.org/licenses/by-nc-nd/4.0/).Peer-review under responsibility of the organizing committee of ICOVP 2015
352 Pramod K Behera and Bhabani S Sahoo / Procedia Engineering 144 ( 2016 ) 351 – 359
utilization of predictive maintenance has proven to be very effective and beneficial. The goal of predictive maintenance is to reduce operation and maintenance costs and increase equipment reliability. Predictive maintenance tries to extend life and plan the corrective action at the opportune time, which results in greater safety, higher plant/equipment availability, better performance, better Product quality, greater cost effectiveness & reliability.
Over the years the strategy has been well-established with advancements in both hardware and software covering Data acquisition, Signal Processing and Decision making. Field experience has demonstrated that by aptly combining and linking the results of different inspection tools, these professionals can create a synergistic solution. This approach is much more thorough than one based on only one test or on several non-integrated inspection methods. This article will explore how these technologies and tools can work together to achieve far more than when implemented independently. Through this paper, authors intend to address the application of various Predictive Maintenance Tools in combination, to address critical problems of plant equipments.
2. Predictive Maintenance Technologies/Processes:
At one time, most Predictive Maintenance programs included only vibration analysis for their rotating equipments. Vibration analysis tool was employed for machinery health monitoring. No doubt, Vibration analysis is very effective for fans, Compressors, Blowers, Crushers, Gearboxes, Motors, Pumps, Agitators, Mills, Conveyors and Machine tools to name a few. However, when employing additional technologies in conjunction with vibration analysis a more complete picture of the operating conditions and the machinery health will be revealed. It has also been seen that one technology alone can’t fully provide complete picture, & further for rotating equipments, it is desired to use various technologies in conjunction for an effective Pdm program. Besides rotating equipments, vital static equipments, structures also need assessment, which too contribute a lot and equally critical to the process/system. Other equipments include Pipelines, Ducts, Storage tanks, Transformers, Transmission lines, Sub-stations, Chimneys, Pressure vessels, Furnaces, Rails & Tracks etc. Suitable technologies can be implemented for assessing equipment health of these non-rotating equipments too, which is generally overlooked during machinery health monitoring. An effective predictive maintenance along with pro-active approach in conjunction with other applicable technologies will enhance the assets life to a great extent. Use of various technologies for Predictive Maintenance practices are: Sensory Analysis, Vibration analysis, Oil analysis, Acoustic analysis, Temperature monitoring, Current analysis, NDT, Performance monitoring. Few of them are depicted here below before switching over to real life case studies/applications.
2.1. Vibration Analysis
Vibration analysis is used primarily with rotating equipment to find problems such as bearing faults/ misalignment/ unbalance/ looseness/ resonance/ eccentricity/ flow turbulence/ cavitation/ gearing problems/ bent shafts/ belt related/ oil Instability/ electrical associated/ motor Rotor bar condition/ foundation related/ lubrication starvation/ soft Foot etc. Prior to using vibration analysis, maintenance technicians had to wait until a bearing failed to realize there was a problem.
Vibration analysis reduces the amount of reactive/preventive maintenance and ensures the
replacement/maintenance occurs with minimum impact on the production or facility schedule. Scope of Vibration Analysis includes periodic vibration measurement/analysis, comparing with base line reading & specified ISO standard, such as ISO-10816 and reporting. Slow motion studies, advanced cross-phase analysis, Resonance testing, In-situ dynamic balancing, Cascade analysis, Modal shape analysis are integral part of vibration analysis.
353 Pramod K Behera and Bhabani S Sahoo / Procedia Engineering 144 ( 2016 ) 351 – 359
2.2. Oil Analysis
Industrial lube oil analysis is done to find out mechanical wear, what part of the machine and how is it wearing, how bad it is and what should be done about it? Oil analysis is done to find out about contamination in the oil; are there abrasive particles in the oil or water ingress in the oil? Oil analysis is done to find out if the oil chemistry has changed, is the oil fit for continued use, is the right oil being used, oil viscosity is OK, when it needs to be changed. Particle counting, particle size distribution, presence of ferrous/non-ferrous particle, and detailed wear debris analysis are the missing elements of conventional oil analysis that are critical to industrial oil analysis program. Oil analysis determines the condition of a lubricant and wear-particle analysis determines the condition of equipment based on the concentration of wear particles in the lubricant. Oil analysis and vibration analysis are natural partners for machine condition monitoring. Whenever required, vibration analysis in conjunction with oil analysis strengthens the confidence of analysis.
2.3. Acoustic Analysis
Acoustic or noise analysis is the measurement or analysis of sound waves emitted from rubbing of machine components. Noise otherwise called as abnormal sound or simply unwanted sound, is an indication of progressing failure/problematic phenomenon in equipment. Acoustic analysis in industries is done basically for two reasons. One is sound level measurement and another is to find out fault in equipment. Sound level measurement has become an integral part of Industrial tool as far as occupational health and safety of workmen are considered. FFT analysis/ octave band analysis has been carried out to detect causes for rotating equipment degradation. Acoustic analysis has been very much beneficial in determining noise problems pertaining to fans, bearings, gearboxes and a supplementary tool to vibration analysis.
2.4. Motor Current Signature Analysis
Monitoring of Electrical motors, which are the prime movers of all most all rotating equipment in the Industry is very important. Electric motors experience a wide range of mechanical problems common to most machinery, such as, imbalance, misalignment, bearing failures, and resonance in addition to electromagnetically generated faults in the stator and rotor. Electrical motors are a part of regular vibration monitoring schedule. During routine vibration analysis most of the electrical signals go un-noticed and unexpected failures occur. Motor Current Signature Analysis (MCSA) is a popular technique where, data is collected from the windings of a motor by installing a current transformer (CT) around one or more of the conductors which provide power to the motor. Current data captured from the three windings are compared to find the unbalance across phases. High resolution data from one winding is further studied/analyzed by analyst to find out possible rotor bar defects. Problematic motor shows high level peaks (No. of Poles X Slip Frequency) side banded around line frequency data. Trending of the data with actual speed (Slip frequency measurement) authenticate the rotor bar condition of the motor. Rotor bar failure goes unnoticed if the motors are under scanner of vibration monitoring only.
2.5. Infrared Thermography/Temperature monitoring
Temperature is an important parameter in equipment health monitoring. Health of rotating as well as stationary equipments in industries can be assessed by knowing temperature distribution of the object of interest. The same is effectively performed by Infrared Thermography. Infrared Thermal
354 Pramod K Behera and Bhabani S Sahoo / Procedia Engineering 144 ( 2016 ) 351 – 359
Imagers or Cameras measure the temperature at many points over a relatively large area to generate a two-dimensional image, called a THERMOGRAM with each pixel representing a temperature. Thermography can also be used in conjunction with other Pdm technologies in assessing equipment health. With help of Infrared Thermal Imager, numerous problems in industries can be solved.
3. Few cases involving more than one predictive maintenance technology are discussed here.
3.1. Vibration and Oil Analysis
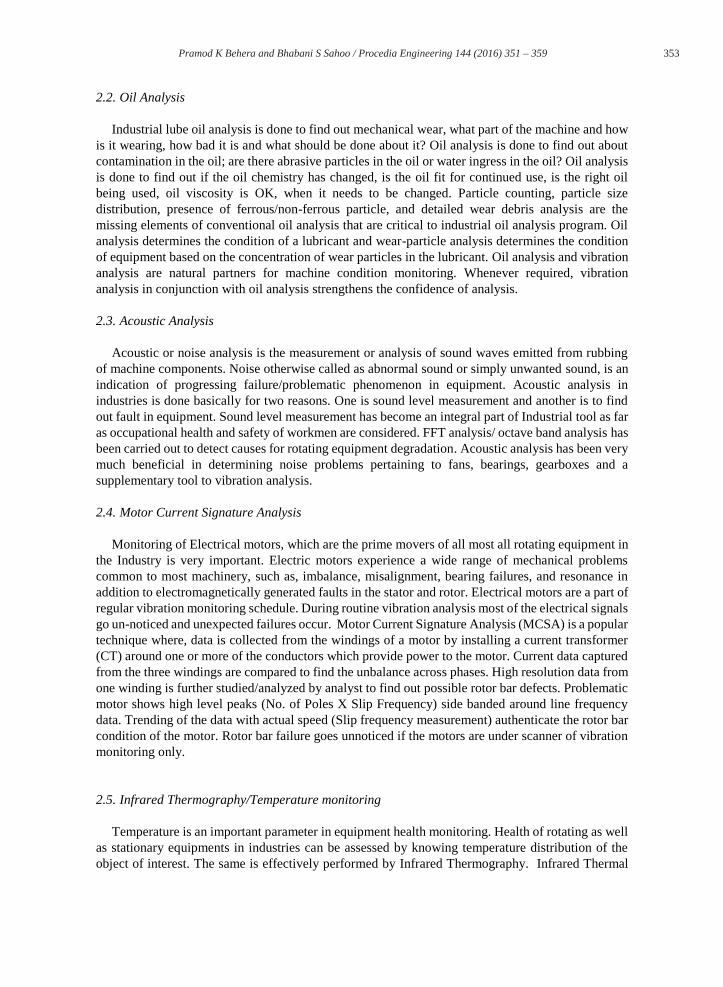
Case Study: Compressor of PTM#19 in Pot Line
Motor-55KW, Rotary Vane Air Compressor: 8 Row x 4 Blades, 1460RPM, Flow: 7.35M3/Min at 7Bar, Lube Oil : Mobil1-5W50
PTM (Pot Tending Machine) is a semi-robotic overhead crane used for operational activities in Aluminium Smelter of Pot Line. All pneumatic operations are done by compressed air from rotary vane compressor that is mounted on the crane itself. Being vital equipment to Aluminium Smelting processes, the Compressor of all the PTMs are under regular vibration as well as oil monitoring programme under Predictive Maintenance activities. Breakdown of the Compressor will stall major activities in Pot Line and has a direct impact on Aluminium production. In recent past, overall vibration readings of the compressor unit measured as below.
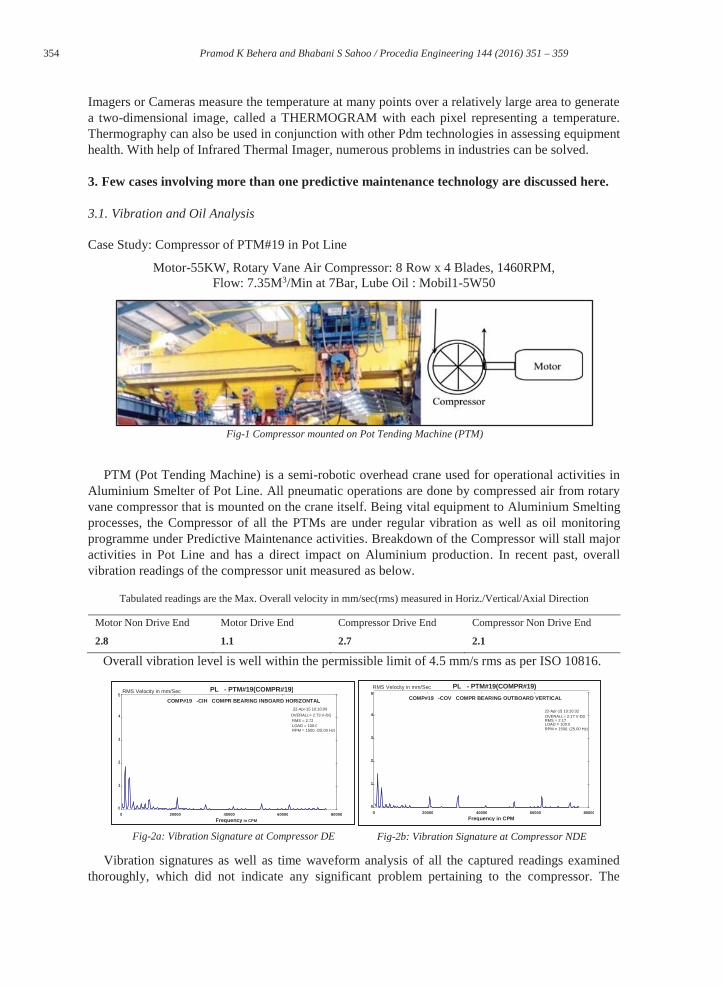
Tabulated readings are the Max. Overall velocity in mm/sec(rms) measured in Horiz./Vertical/Axial Direction
Overall vibration level is well within the permissible limit of 4.5 mm/s rms as per ISO 10816.
Vibration signatures as well as time waveform analysis of all the captured readings examined thoroughly, which did not indicate any significant problem pertaining to the compressor. The
Motor Non Drive End Motor Drive End Compressor Drive End Compressor Non Drive End
2.8 1.1 2.7 2.1
Fig-1 Compressor mounted on Pot Tending Machine (PTM)
Fig-2a: Vibration Signature at Compressor DE Fig-2b: Vibration Signature at Compressor NDE
PL - PTM#19(COMPR#19) COMP#19 -CIH COMPR BEARING INBOARD HORIZONTAL
22-Apr-15 10:10:09
OVERALL= 2.73 V-DG RMS = 2.72 LOAD = 100.0 RPM = 1500. (25.00 Hz)
0 20000 40000 60000 80000 0
1
2
3
4
5
Frequency in CPM
RMS Velocity in mm/Sec PL - PTM#19(COMPR#19) COMP#19 -COV COMPR BEARING OUTBOARD VERTICAL
22-Apr-15 10:10:32OVERALL= 2.17 V-DG
RMS = 2.17RMS 2.17 LOAD = 100.0 RPM = 1500. (25.00 Hz)
0 20000 40000 60000 80000
0
1
2
3
4
5
Frequency in CPM
RMS Velocity in mm/Sec
355 Pramod K Behera and Bhabani S Sahoo / Procedia Engineering 144 ( 2016 ) 351 – 359
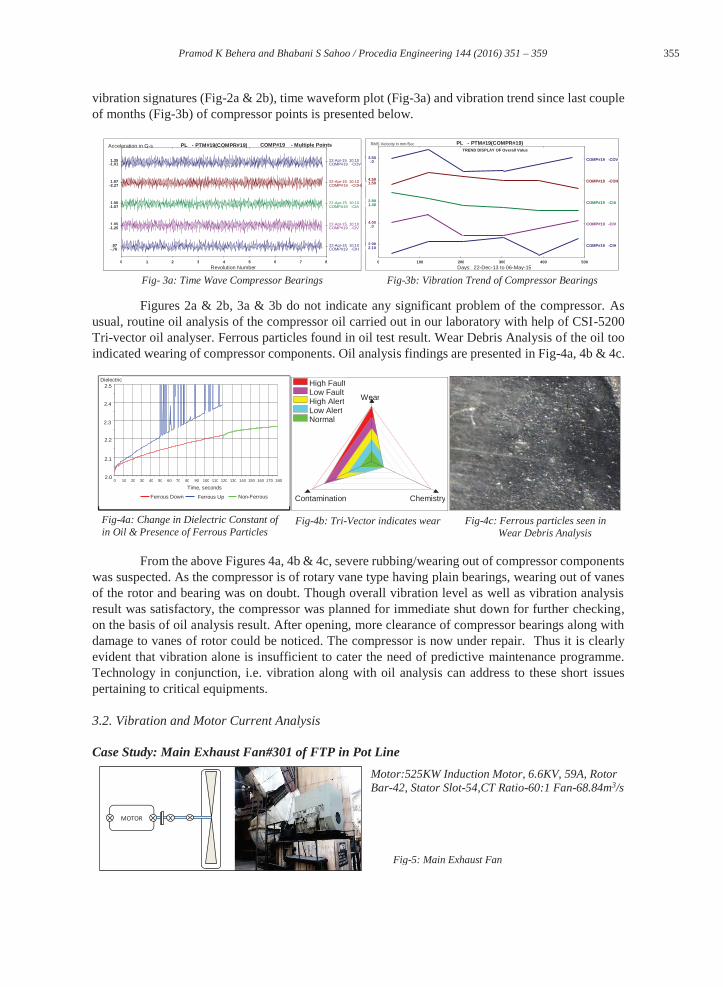
vibration signatures (Fig-2a & 2b), time waveform plot (Fig-3a) and vibration trend since last couple of months (Fig-3b) of compressor points is presented below.
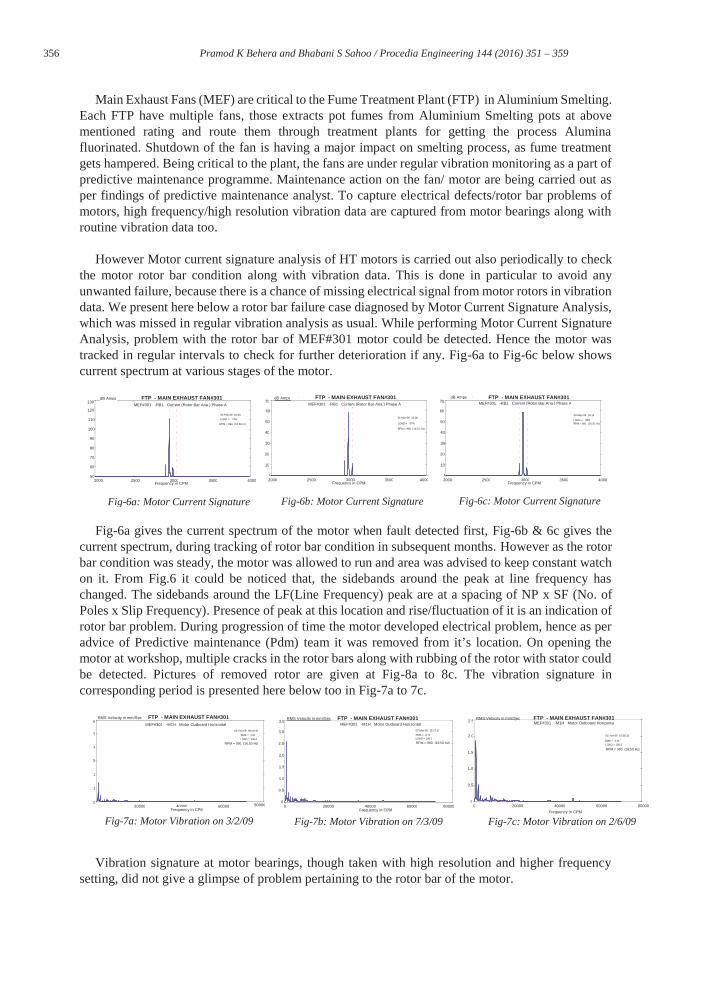
Figures 2a & 2b, 3a & 3b do not indicate any significant problem of the compressor. As usual, routine oil analysis of the compressor oil carried out in our laboratory with help of CSI-5200 Tri-vector oil analyser. Ferrous particles found in oil test result. Wear Debris Analysis of the oil too indicated wearing of compressor components. Oil analysis findings are presented in Fig-4a, 4b & 4c.
From the above Figures 4a, 4b & 4c, severe rubbing/wearing out of compressor components
was suspected. As the compressor is of rotary vane type having plain bearings, wearing out of vanes of the rotor and bearing was on doubt. Though overall vibration level as well as vibration analysis result was satisfactory, the compressor was planned for immediate shut down for further checking, on the basis of oil analysis result. After opening, more clearance of compressor bearings along with damage to vanes of rotor could be noticed. The compressor is now under repair. Thus it is clearly evident that vibration alone is insufficient to cater the need of predictive maintenance programme. Technology in conjunction, i.e. vibration along with oil analysis can address to these short issues pertaining to critical equipments.
3.2. Vibration and Motor Current Analysis
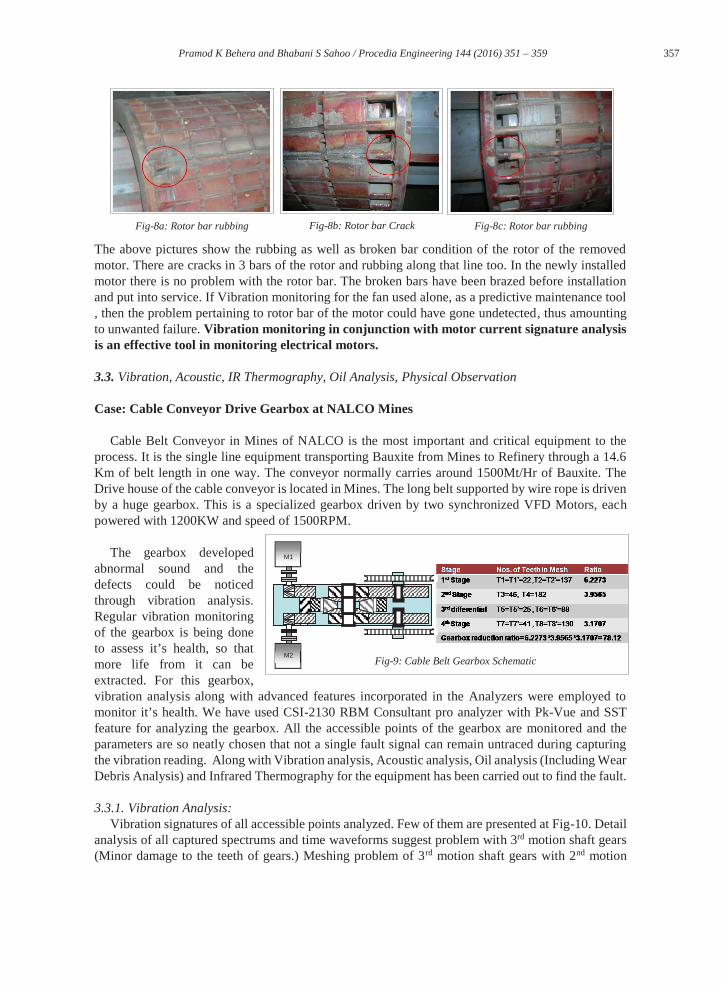
Case Study: Main Exhaust Fan#301 of FTP in Pot Line
Motor:525KW Induction Motor, 6.6KV, 59A, Rotor Bar-42, Stator Slot-54,CT Ratio-60:1 Fan-68.84m3/s
Fig-4a: Change in Dielectric Constant of in Oil & Presence of Ferrous Particles
Fig-4c: Ferrous particles seen in Wear Debris Analysis
Fig-4b: Tri-Vector indicates wear
Fig-5: Main Exhaust Fan
Fig- 3a: Time Wave Compressor Bearings Fig-3b: Vibration Trend of Compressor Bearings
PL - PTM#19(COMPR#19) COMP#19 - Multiple Points
Revolution Number
Acceleration in G-s
0 1 2 3 4 5 6 7 8 .977.97 -.76 22-Apr-15 10:1022 pApr 15 10:10
COMP#19 -CIH
1.05 -1.20 22-Apr-15 10:1022 Apr 15 10:10
COMP#19 -CIV
1.00 -1.07 22-Apr-15 10:10p
COMP#19 -CIA
1.97 -2.27 22-Apr-15 10:10p
COMP#19 -COH
1.35 -1.01 22-Apr-15 10:10p
COMP#19 -COV
PL - PTM#19(COMPR#19) TREND DISPLAY OF Overall Value
0 100 200 300 400 500 Days: 22-Dec-13 to 06-May-15
RMS Velocity in mm/Sec
2.90 2.10 COMP#19 -CIH
4.00 .0 COMP#19 -CIV
2.80 1.40 COMP#19 -CIA
4.50 1.50 COMP#19 -COH
3.50 .0 COMP#19 -COV
2.0 2.1 2.2 2.3 2.4 2.5
0 10 20 30 40 50 60 70 80 90 100 110 120 130 140 150 160 170 180
Dielectric
Time, seconds
Ferrous Down Ferrous Up Non-Ferrous
Wear
Contamination Chemistry
High Fault Low Fault High Alert gLow Alert Normal
MOTOR
356 Pramod K Behera and Bhabani S Sahoo / Procedia Engineering 144 ( 2016 ) 351 – 359
Main Exhaust Fans (MEF) are critical to the Fume Treatment Plant (FTP) in Aluminium Smelting. Each FTP have multiple fans, those extracts pot fumes from Aluminium Smelting pots at above mentioned rating and route them through treatment plants for getting the process Alumina fluorinated. Shutdown of the fan is having a major impact on smelting process, as fume treatment gets hampered. Being critical to the plant, the fans are under regular vibration monitoring as a part of predictive maintenance programme. Maintenance action on the fan/ motor are being carried out as per findings of predictive maintenance analyst. To capture electrical defects/rotor bar problems of motors, high frequency/high resolution vibration data are captured from motor bearings along with routine vibration data too.
However Motor current signature analysis of HT motors is carried out also periodically to check
the motor rotor bar condition along with vibration data. This is done in particular to avoid any unwanted failure, because there is a chance of missing electrical signal from motor rotors in vibration data. We present here below a rotor bar failure case diagnosed by Motor Current Signature Analysis, which was missed in regular vibration analysis as usual. While performing Motor Current Signature Analysis, problem with the rotor bar of MEF#301 motor could be detected. Hence the motor was tracked in regular intervals to check for further deterioration if any. Fig-6a to Fig-6c below shows current spectrum at various stages of the motor.
Fig-6a gives the current spectrum of the motor when fault detected first, Fig-6b & 6c gives the
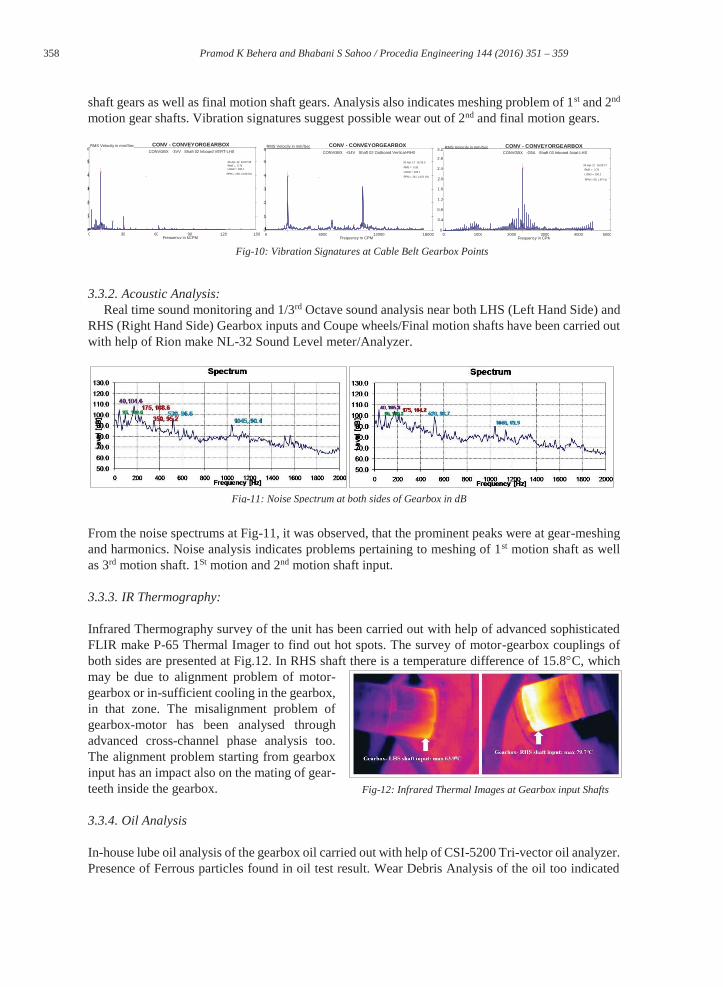
current spectrum, during tracking of rotor bar condition in subsequent months. However as the rotor bar condition was steady, the motor was allowed to run and area was advised to keep constant watch on it. From Fig.6 it could be noticed that, the sidebands around the peak at line frequency has changed. The sidebands around the LF(Line Frequency) peak are at a spacing of NP x SF (No. of Poles x Slip Frequency). Presence of peak at this location and rise/fluctuation of it is an indication of rotor bar problem. During progression of time the motor developed electrical problem, hence as per advice of Predictive maintenance (Pdm) team it was removed from it’s location. On opening the motor at workshop, multiple cracks in the rotor bars along with rubbing of the rotor with stator could be detected. Pictures of removed rotor are given at Fig-8a to 8c. The vibration signature in corresponding period is presented here below too in Fig-7a to 7c.
Vibration signature at motor bearings, though taken with high resolution and higher frequency
setting, did not give a glimpse of problem pertaining to the rotor bar of the motor.
Fig-6a: Motor Current Signature Fig-6b: Motor Current Signature Fig-6c: Motor Current Signature
FTP - MAIN EXHAUST FAN#301MEF#301 -RB1 Current (Rotor Bar Ana.) Phase A
31-Mar-09 16:06
LOAD = 97%
RPM = 990. (16.51 Hz)
2000 2500 3000 3500 40000
10 20 30
40 50
60
70
3000Frequency in CPM
dB Amps FTP - MAIN EXHAUST FAN#301MEF#301 -RB1 Current (Rotor Bar Ana.) Phase A
30-May-09 16:19
LOAD = 95% RPM = 991. (16.51 Hz)
2000 2500 3000 3500 40000
10
20 30
40
50
60 70
03000Frequency in CPM
dB Amps FTP - MAIN EXHAUST FAN#301 MEF#301 -RB1 Current (Rotor Bar Ana.) Phase A
20-Feb-09 10:08
LOAD = 73%
RPM = 994. (16.56 Hz)
2000 2500 3000 3500 4000 50 60 70 80 90
100 110 120 130
3000Frequency in CPM
dB Amps
FTP - MAIN EXHAUST FAN#301 MEF#301 -M1H Motor Outboard Horizontal
02-Jun-09 10:38:25
RMS = 2.08 LOAD = 100.0
RPM = 990. (16.50 Hz)
0 20000 40000 60000 80000 0
0.5
1.0
1.5
2.0
2.5
Frequency in CPM
RMS Velocity in mm/SecFTP - MAIN EXHAUST FAN#301MEF#301 -M1H Motor Outboard Horizontal
07-Mar-09 15:27:16
RMS = 2.79 LOAD = 100.0
RPM = 990. (16.50 Hz)
0 20000 40000 60000 800000
0.5 1.0 1.5 2.0 2.5 3.0 3.5
40000Frequency in CPM
RMS Velocity in mm/Sec FTP - MAIN EXHAUST FAN#301 MEF#301 -M1H Motor Outboard Horizontal
03-Feb-09 09:40:40
RMS = 1.67
LOAD = 100.0
RPM = 990. (16.50 Hz)
20000 40000 60000 800000 1 2 3 4 5 6
40000Frequency in CPM
RMS Velocity in mm/Sec
Fig-7a: Motor Vibration on 3/2/09 Fig-7b: Motor Vibration on 7/3/09 Fig-7c: Motor Vibration on 2/6/09
357 Pramod K Behera and Bhabani S Sahoo / Procedia Engineering 144 ( 2016 ) 351 – 359
The above pictures show the rubbing as well as broken bar condition of the rotor of the removed motor. There are cracks in 3 bars of the rotor and rubbing along that line too. In the newly installed motor there is no problem with the rotor bar. The broken bars have been brazed before installation and put into service. If Vibration monitoring for the fan used alone, as a predictive maintenance tool , then the problem pertaining to rotor bar of the motor could have gone undetected, thus amounting to unwanted failure. Vibration monitoring in conjunction with motor current signature analysis is an effective tool in monitoring electrical motors.
3.3. Vibration, Acoustic, IR Thermography, Oil Analysis, Physical Observation
Case: Cable Conveyor Drive Gearbox at NALCO Mines Cable Belt Conveyor in Mines of NALCO is the most important and critical equipment to the
process. It is the single line equipment transporting Bauxite from Mines to Refinery through a 14.6 Km of belt length in one way. The conveyor normally carries around 1500Mt/Hr of Bauxite. The Drive house of the cable conveyor is located in Mines. The long belt supported by wire rope is driven by a huge gearbox. This is a specialized gearbox driven by two synchronized VFD Motors, each powered with 1200KW and speed of 1500RPM.
The gearbox developed
abnormal sound and the defects could be noticed through vibration analysis. Regular vibration monitoring of the gearbox is being done to assess it’s health, so that more life from it can be extracted. For this gearbox, vibration analysis along with advanced features incorporated in the Analyzers were employed to monitor it’s health. We have used CSI-2130 RBM Consultant pro analyzer with Pk-Vue and SST feature for analyzing the gearbox. All the accessible points of the gearbox are monitored and the parameters are so neatly chosen that not a single fault signal can remain untraced during capturing the vibration reading. Along with Vibration analysis, Acoustic analysis, Oil analysis (Including Wear Debris Analysis) and Infrared Thermography for the equipment has been carried out to find the fault.
3.3.1. Vibration Analysis: Vibration signatures of all accessible points analyzed. Few of them are presented at Fig-10. Detail
analysis of all captured spectrums and time waveforms suggest problem with 3rd motion shaft gears (Minor damage to the teeth of gears.) Meshing problem of 3rd motion shaft gears with 2nd motion
Fig-9: Cable Belt Gearbox Schematic
Fig-8a: Rotor bar rubbing Fig-8b: Rotor bar Crack Fig-8c: Rotor bar rubbing
M1
M2
358 Pramod K Behera and Bhabani S Sahoo / Procedia Engineering 144 ( 2016 ) 351 – 359
shaft gears as well as final motion shaft gears. Analysis also indicates meshing problem of 1st and 2nd motion gear shafts. Vibration signatures suggest possible wear out of 2nd and final motion gears.
3.3.2. Acoustic Analysis: Real time sound monitoring and 1/3rd Octave sound analysis near both LHS (Left Hand Side) and
RHS (Right Hand Side) Gearbox inputs and Coupe wheels/Final motion shafts have been carried out with help of Rion make NL-32 Sound Level meter/Analyzer.
From the noise spectrums at Fig-11, it was observed, that the prominent peaks were at gear-meshing and harmonics. Noise analysis indicates problems pertaining to meshing of 1st motion shaft as well as 3rd motion shaft. 1St motion and 2nd motion shaft input.
3.3.3. IR Thermography: Infrared Thermography survey of the unit has been carried out with help of advanced sophisticated FLIR make P-65 Thermal Imager to find out hot spots. The survey of motor-gearbox couplings of both sides are presented at Fig.12. In RHS shaft there is a temperature difference of 15.8 C, which may be due to alignment problem of motor-gearbox or in-sufficient cooling in the gearbox, in that zone. The misalignment problem of gearbox-motor has been analysed through advanced cross-channel phase analysis too. The alignment problem starting from gearbox input has an impact also on the mating of gear-teeth inside the gearbox.
3.3.4. Oil Analysis In-house lube oil analysis of the gearbox oil carried out with help of CSI-5200 Tri-vector oil analyzer. Presence of Ferrous particles found in oil test result. Wear Debris Analysis of the oil too indicated
Fig-11: Noise Spectrum at both sides of Gearbox in dB
Fig-12: Infrared Thermal Images at Gearbox input Shafts
CONV - CONVEYORGEARBOX CONVGBX -3VV Shaft 02 Inboard VERT-LHS
26-Apr-12 16:07:38 RMS = 5.78 LOAD = 100.0
RPM = 228. (3.80 Hz)
0 30 60 90 120 150 0 1 2 3 4 5 6
90Frequency in kCPM
RMS Velocity in mm/Sec CONV - CONVEYORGEARBOX CONVGBX -G4V Shaft 02 Outboard Vertical-RHS
26-Apr-12 16:18:14
RMS = 5.95
LOAD = 100.0
RPM = 241. (4.01 Hz)
0 6000 12000 18000 0
1
2
3
4
5
6
Frequency in CPM
RMS Velocity in mm/Sec CONV - CONVEYORGEARBOX CONVGBX -G5A Shaft 03 Inboard Axial-LHS
26-Apr-12 16:03:17
RMS = 3.70
LOAD = 100.0
RPM = 58. (.97 Hz)
0 1000 2000 3000 4000 5000 0
0.4
0.8
1.2
1.6
2.0
2.4
2.8
3.2
3000Frequency in CPM
RMS Velocity in mm/Sec
Fig-10: Vibration Signatures at Cable Belt Gearbox Points
359 Pramod K Behera and Bhabani S Sahoo / Procedia Engineering 144 ( 2016 ) 351 – 359
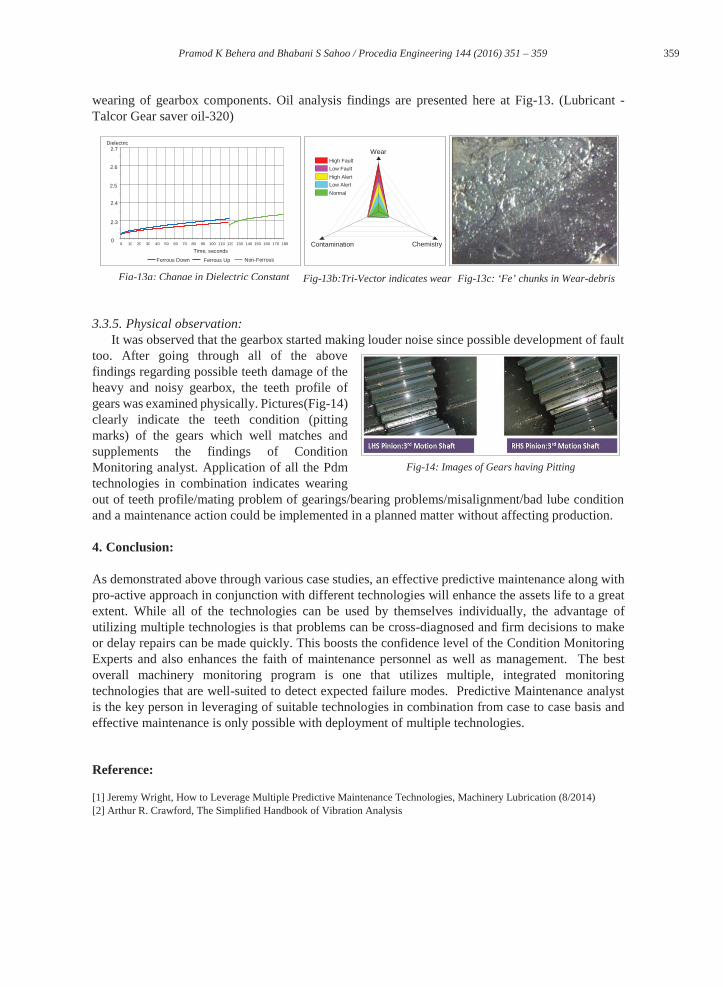
wearing of gearbox components. Oil analysis findings are presented here at Fig-13. (Lubricant - Talcor Gear saver oil-320)
3.3.5. Physical observation: It was observed that the gearbox started making louder noise since possible development of fault
too. After going through all of the above findings regarding possible teeth damage of the heavy and noisy gearbox, the teeth profile of gears was examined physically. Pictures(Fig-14) clearly indicate the teeth condition (pitting marks) of the gears which well matches and supplements the findings of Condition Monitoring analyst. Application of all the Pdm technologies in combination indicates wearing out of teeth profile/mating problem of gearings/bearing problems/misalignment/bad lube condition and a maintenance action could be implemented in a planned matter without affecting production.
4. Conclusion:
As demonstrated above through various case studies, an effective predictive maintenance along with pro-active approach in conjunction with different technologies will enhance the assets life to a great extent. While all of the technologies can be used by themselves individually, the advantage of utilizing multiple technologies is that problems can be cross-diagnosed and firm decisions to make or delay repairs can be made quickly. This boosts the confidence level of the Condition Monitoring Experts and also enhances the faith of maintenance personnel as well as management. The best overall machinery monitoring program is one that utilizes multiple, integrated monitoring technologies that are well-suited to detect expected failure modes. Predictive Maintenance analyst is the key person in leveraging of suitable technologies in combination from case to case basis and effective maintenance is only possible with deployment of multiple technologies.
Reference:
[1] Jeremy Wright, How to Leverage Multiple Predictive Maintenance Technologies, Machinery Lubrication (8/2014) [2] Arthur R. Crawford, The Simplified Handbook of Vibration Analysis
Fig-14: Images of Gears having Pitting
Fig-13a: Change in Dielectric Constant Fig-13b:Tri-Vector indicates wear Fig-13c: ‘Fe’ chunks in Wear-debris
0
2.3 2.4 2.5 2.6 2.7
0 10 20 30 40 50 60 70 80 90 100 110 120 130 140 150 160 170 180
Dielectric
Time, seconds
Ferrous Down Ferrous Up Non-Ferrous
Wear
Contamination Chemistry
High Fault Low Fault High Alert Low Alert Normal