levelling carbon pricing a proposal for an inclusive
TRANSCRIPT
4 2021
The fight against climate change is a global public good and COP 26 is a key appointment to address it. However, while the climate agreement that will be negotiated in COP 26 must be global, its implementation will have to be local as it will be driven by each individual signatory State. In this context, a Global Carbon Price (GCP) has the qualities of a win-win solution, as it is effective, sustainable, addressing climate injustice. Within the Technical WG of the UN High Level Dialogue on Energy 2021, this paper, after reviewing the state-of-the-art of the literature and assessing the results of the empirical research, analyses the relationship between carbon pricing, subsidies and decarbonization. It brings to light the proposal of a GCP including different economic tools -ETS, carbon taxes, excises- feeding a Fair Transition Fund for inclusive development, as a flexible mechanism to reduce global CO2 emissions.
V. T
ER
MIN
I, W
ITH
R. G
IRO
NI,
P. I
OR
IO, M
. MA
SUL
LI,
M. L
. RO
ME
RO
ME
IRA
·
LE
VE
LL
ING
CA
RB
ON
PR
ICIN
G
LEVELLING CARBON PRICINGA proposal for an inclusive, sustainable,modern energy and climate roadmap
Valeria Termini, with Rebecca Gironi, Paolo Iorio, Michele Masulli,Maria Lidia Romero Meira
Collana Centro Rossi-Doria Papers4

Valeria Termini is Full Professor of Economics at the University of Roma Tre. She served asCommissioner of the Italian Authority for Energy and Environment (2011-18) and asVice president of the Council of European Energy Regulators (CEER). She is currently a member of the Technical WG on Finance and Investment of the UN High-Level Dialogue on Energy 2021-COP26. In 2011 she was awarded the International PA Award by the American Society for Public Administration.
Rebecca Gironi Master’s degree in “Environmental and Development Economics”, Roma Tre University. Bachelor’s degree in “International Relations and Diplomatic Affairs”, University of Bologna.
Paolo Iorio Engineer, Executive at the Technip Energies Group. Expert in “Regulation Econo-mics, Energy and Sustainable Deve-lopment”, assisting the course at the Roma Tre University.
Michele Masulli PhD student in Economics at the Department of Economics of Roma Tre University. Director of the Energy Area at the Institute for Competitiveness (I-Com).
Maria Lidia Romero Meira Environmental Manager, Master’s degree in "Environmental and Development Economics", Roma Tre University.
Il Centro Ricerche Economiche e Sociali Manlio Rossi-Doria è un Centro di Eccellenza istituito presso l’Università degli Studi Roma Tre e dedicato alla figura di Manlio Rossi-Doria (1905-1988), uno dei massimi interpreti del pensiero meridionalista.
Il Centro ha la finalità di promuovere e realizzare studi, ricerche e attività di alta formazione e di contribuire all’avanzamento delle conoscenze di temi quali:
• il ruolo dell’agricoltura, la sicurezza alimentare, la sostenibilità ambientale e la questione energetica;
• il commercio, gli investimenti esteri, le relazioni internazionali, le catene globali del valore;
• l’economia italiana, con particolare riferimento al Mezzogiorno;
• la coesione e le politiche di sviluppo; • l’integrazione europea; • l’analisi e la valutazione delle politiche pubbliche.

Università degli Studi Roma TreCentro Rossi-Doria
Rossi Doria 4/21.qxp_Layout 1 28/10/21 10:53 Pagina 3

CenTRo RoSSi-DoRia PaPeRSCollana DiReTTa Da anna GiUnTa
n. 1, luglio 2019Gli accordi commerciali e l’italia: il caso del CeTalUCa SalvaTiCi
n. 2, febbraio 2021international trade and climate changePart of the problem or part of the solution?CeCilia naRDi, DaviDe ConSoli, elena PaGlialUnGa, FeDeRiCa CaPPelli, Giovanni MaRin, ilaRia FUSaCChia, lUCa SalvaTiCi, valeRia CoSTanTini
n. 3, luglio 2021Studio sulla valutazione degli effetti dell’accordo di libero scambio Ue-Mercosur sul commercio estero italiano anna CaRbone, FabRizio De FiliPPiS, ilaRia FUSaCChia, anna GiUnTa, MaRiannaManTUano, Silvia nenCi, CaRlo PieTRobelli, lUCa SalvaTiCi, DaviDe vURChio
Rossi Doria 4/21.qxp_Layout 1 28/10/21 10:53 Pagina 4

Collana Centro Rossi - Doria Papers4
2021
LEVELLING CARBON PRICINGA proposal for an inclusive, sustainable,
modern energy and climate roadmap
Valeria Termini, with Rebecca Gironi, Paolo Iorio, Michele Masulli,Maria Lidia Romero Meira
Università degli Studi Roma TreDipartimento di Economia
Centro Ricerche Economiche e SocialiManlio Rossi-Doria
Rossi Doria 4/21.qxp_Layout 1 28/10/21 10:53 Pagina 5

Collana CenTRo RoSSi-DoRia PaPeRS
diretta da anna Giunta
la Collana Centro Rossi-Doria Papers ospita i rapporti di ricerca e le monografieche presentano i risultati delle attività scientifiche svolte dal Centro Rossi-Doria,Centro di eccellenza, dell’Università Roma Tre. i volumi pubblicati nella Collana sono sottoposti ad una procedura di referaggioin chiaro. i volumi sono liberamente accessibili in formato elettronico sul sitodell’editore Roma Tre-Press. la versione a stampa è acquistabile in modalità‘Print on demand’. le pubblicazioni hanno una numerazione progressiva eeventuali richiami o citazioni ad essi devono riportare la denominazione estesadel contributo a cui si fa riferimento.
Comitato scientifico anna Carbone, Guido Fabiani, Mara Giua, luca SalvaticiCoordinamento redazionale del volume Giacomo Giovanardi
Coordinamento editorialeGruppo di lavoro
Cura editoriale e impaginazione
Roma teseoeditore.it
Elaborazione grafica della copertinamosquitoroma.it
Caratteri grafici utilizzati: Minion Concept Roman; Minion Pro Regular (copertina efrontespizio). Garamond (testo).
edizioni ©
Roma, ottobre 2021iSbn 979-12-5977-049-3http://romatrepress.uniroma3.it Quest’opera è assoggettata alla disciplina Creative Commons attribution 4.0 international licence(CC bY-nC-nD 4.0) che impone l’attribuzione della paternità dell’opera, proibisce di alterarla,trasformarla o usarla per produrre un’altra opera, e ne esclude l’uso per ricavarne un profitto commerciale.
l’attività della è svolta nell’ambito dellaFondazione Roma Tre-education, piazza della Repubblica 10, 00185 Roma.
Rossi Doria 4/21.qxp_Layout 1 28/10/21 10:53 Pagina 6

n. 4
Levelling global carbon pricing.A proposal
for an inclusive, sustainable energy and climate roadmap
by
Valeria Termini*
with Rebecca Gironi, Paolo iorio, Michele Masulli, Maria lidia Romero Meira
Paper prepared for the Un hiGh-level DialoGUe on eneRGY 2021 - CoP26
Technical Working Group 5 - Finance and investment**
May 2, 2021
* Member of the Un high level Dialogue on energy 2021 - Cop26, Technical WorkingGroup 5 – investment and Finance –.** The financial support of the Rossi-Doria Centre is gratefully acknowledged.
Rossi Doria 4/21.qxp_Layout 1 28/10/21 10:53 Pagina 7

Table of contents
The Global Carbon Price (GCP): a proposal for CoP 26 in Glasgow
PaRT one
Carbon pricing in the literature1.1 Why carbon pricing Contributions from economic theory and empirical research
PaRT TWo
Carbon price: assessments of required price levels and those currentlyobserved2.1 Carbon price: the level required2.2 Carbon prices currently observed PaRT ThRee
Decarbonization path and carbon pricing3.1 Carbon emissions from energy use3.2 Carbon pricing revenues and differences across sectors3.3 Decarbonizing economies by levelling carbon pricing in countries
PaRT FoUR
Fossil fuel subsidies4.1 Global fossil fuel subsidies – estimates4.2 Fossil fuel subsidies across countries4.3 Global fossil fuel subsidies phase-out and emissions reduction
PaRT Five
a proposal: Global Carbon Pricing and the Fair Transition Fund5.1 Carbon pricing revenues feeding a Fair Transition Fund (FTF)5.2 Distribution of the Fair Transition Fund’s resources5.3 Carbon pricing revenues supporting a fair energy transition
Reference listannex a – list of countries considered in Part Threeannex b – Carbon pricing in numbers
11
15
15
27
2729
39394245
55556066
67677072
798587
Rossi Doria 4/21.qxp_Layout 1 28/10/21 10:53 Pagina 9

The Global Carbon Price (GCP): a proposal for COP 26 in Glasgow
The fight against climate change is a global public good. While theagreement that will be negotiated in Glasgow can only be global, itsimplementation will have to be local as it will be driven by each individualsignatory State. international institutions are assuming their essential role in promoting theexchange of knowledge and developing tools to spread world energy access(SDG7), foster new sustainable growth, while reducing the levels ofproduction and consumption of energy from fossils fuels. leaders willhave to discuss new goals in Glasgow, urging wealthy industrializedcountries to honor commitments, despite the financial constraints of thecoronavirus pandemic. They must meet the existing one on climatefinance – that is, the yet to be funded $100 billion dollars a year agreed inCopenhagen 2009 – and then go further. Financial assistance is needed fordeveloping countries in the fight against the climate crisis. “voluntarypolicies are insufficient,” writes William nordhaus, nobel laureate ineconomics in 2018 “agreements must be based on obligations andsanctions.” Yet, this vision seems hardly adoptable today. a viable path,matured after the heated debate on the earlier responsibilities ofindustrialized countries and on the current trend of emissions, is topromote shared tools and win-win solutions.
A Global Carbon Price (GCP) – not to be viewed as a tax – has thequalities of a win-win solution. a global carbon price can move the climate policy frontier forward.Three essential elements make it work: 1. it includes negative environmental externalities that are not yetpriced today among the energy costs (as shown in scientific literature,Part one, and also in Parts Two and Three) and, where implemented,carbon price has been found to be effective in reducing CO2 emissions,mainly generating improvements in terms of energy efficiency andrecording the lowest carbon intensity of GDP values in countries wherecarbon pricing is the highest (Part Three); 2. it curbs environmental dumping, since it affects every country, inparticular, the major polluters; it also reduces “carbon leakage” and is fairin terms of rules of international competition since it is applied
11
Rossi Doria 4/21.qxp_Layout 1 28/10/21 10:53 Pagina 11

LEVELLinG GLObAL CArbOn PriCinG.A PrOPOSAL FOr An inCLuSiVE, SuSTAinAbLE EnErGy And CLimATE rOAdmAP
homogeneously worldwide; 3. Finally, (FTF) – considering the 36 billion tons of emissions produceda year (2019), even a low carbon price per ton would generate a significantfinancial contribution. This, in turn, should be calculated to best fit thedifferent levels of development of the regions in which it is applied andrecognizing the results of the policies.
Furthermore, the agreement will have to leave the choice of the tools tobe included in the carbon price to the States, consistently with their fiscaland institutional conditions. The GCP will therefore have to include all theavailable mechanisms (Part one), which are tradable emission permits (theeuropean ETS used more and more around the world), the carbon tax,also widespread, for example, in the nordic countries – in Sweden,Denmark, Canada among others –, and excise duties – high, for example,in italy on gasoline. While excise duties may have been destined for otheruses, they contribute to increasing the carbon price to reach the global levelestablished. Flexibility is the key to implementation by governments, as long asevery ton of carbon emitted is priced the same in the world. a share ofthe revenues from carbon pricing would remain at the country level, whilea flexible share could be directed to the Fair Transition Fund. This sharewould be calculated according to specific countries’ characteristics andparameters. The rationale behind the proposal is that the share of carbonpricing revenue to be periodically assigned to the Fund would beproportional to (i) the countries’ GDP (addressing the financial gap indeveloping countries); (ii) countries’ progress in carbon intensity of GDP,thus rewarding countries that are making efforts on the path towarddecarbonization and (iii) countries’ historical contribution to the overallstock of Co2 in the atmosphere from pre-industrial times.in addition, subsidies for fossil fuels can be gradually reduced andeventually abolished (Part Four), freeing up States resources that can beused, instead, for green and sustainable investments or to compensatecitizens for the costs of mitigation and adaptation.
The Fair Transition Fund from GCP. in a nutshell, the distribution anduses of the fund are essential to creating a new global cooperative spiritand contributing to a decisive green transition in countries at different levels
12
Rossi Doria 4/21.qxp_Layout 1 28/10/21 10:53 Pagina 12

of development – reforestation, adaptation, clean cooking and climate riskscoverage may be among the most direct measures. above all, the FTF willhave to target the unfair consequences of climate change and supportdeveloping countries in activating policies of mitigation, resilience andadaptation to climate change. The distribution of the Fund to developingcountries would depend on their relative population and their socio-economic level, measured in terms of the human Development index,and on their status regarding the three outcome target envisaged by SDG7: the access to affordable, reliable and modern energy services, the shareof renewable energy in the energy mix and the improvement in energyefficiency. The final component to compute the distribution of the Funddepends on countries’ vulnerability to climate change impacts and theirreadiness to face them.The flexibility of the instruments included in the carbon price – eTS,carbon tax, excise – enables the countries contributing to its formation afree and appropriate choice of fiscal policy, while also making it acceptableto large emitters. Finally, a global homogeneous price of carbon wouldavert competitive distortions in international trade. it can be monitored byalready existing supranational institutions The specific aspects of the GCP are detailed in the following 5 parts ofthe paper, offering an analysis of the potential effectiveness of the GCP,based on an empirical comparison of data elaborated from different officialsources.
13
ThE GLObAL CArbOn PriCE (GCP): A PrOPOSAL FOr COP 26 in GLASGOw
Rossi Doria 4/21.qxp_Layout 1 28/10/21 10:53 Pagina 13

15
PArT OnE
Carbon pricing in the literature
Carbon pricing reveals the hidden cost of greenhouse gas pollution•and affects emissions by penalizing emission sources according to theircarbon content. The carbon pricing methods can be traced back tothree main forms: cap-and-trade systems, carbon tax and sanctions(plus, some implicit forms of carbon pricing, such as excise duties onfossil fuels).The carbon pricing level is tied to variables of various orders:•environmental, social, political, technological and economic.in addition to complying with the “polluter pays principle”, carbon•pricing positively influences the behaviour of businesses andconsumers in the direction of reducing Co2 emissions. at the sametime, it stimulates innovation and the creation of green products,processes and clean technologies.Compared to other solutions, carbon pricing shows greater•effectiveness and flexibility in its application to heterogeneous emissionsources, and lower information and transaction costs. Furthermore, itmakes the integration of different mechanisms possible and, if appliedglobally, reduces carbon leakage and dumping without the need forsanctions.
1.1 why carbon pricing. Contributions from economic theory andempirical research
as defined by the World bank, “Carbon pricing is an instrument that capturesthe external costs of greenhouse gas (GHG) emissions – the costs of emissions that thepublic pays for, such as damage to crops, health care costs from heat waves and droughts,and loss of property from flooding and sea level rise – and ties them to their sourcesthrough a price, usually in the form of a price on the carbon dioxide (CO2) emitted”1.Carbon pricing, therefore, creates a financial incentive for companies,consumers and countries to reduce their emissions, moving to moreefficient and cleaner processes, products and technologies. in this way, it
1 World bank, What is carbon pricing?:<https://carbonpricingdashboard.worldbank.org/what-carbon-pricing>.
Rossi Doria 4/21.qxp_Layout 1 28/10/21 10:53 Pagina 15

LEVELLinG GLObAL CArbOn PriCinG.A PrOPOSAL FOr An inCLuSiVE, SuSTAinAbLE EnErGy And CLimATE rOAdmAP
16
harnesses market forces to combat climate change. Climate change, in fact,is regarded by economic theory as a market failure. it entails, for currentand future generations who will suffer its consequences, significant costsand risks, which are not normally reflected in current market prices. Carbonpricing reveals the hidden cost of greenhouse gas pollution and affectsemissions by penalizing emission sources on the basis of their carboncontent.
The carbon pricing methods can be traced back to three main forms:cap-and-trade systems, carbon tax and sanctions.
Cap-and-trade systemsCap-and-trade systems are the major type of emission trading systems
(eTS). They deal with three main issues: the definition of the quantitiesof emissions, the level of permits and the volatility of prices. in fact, cap-and-trade mechanisms require the government to set a limit on the totalamount of emissions allowed. Co2 emitters then either receive permits forfree or have to purchase the right to emit Co2. Companies whose totalemissions are below their cap can choose to sell unused carbon credits tothose who exceed their carbon allocation. emissions trading systems aimfor cost-effective emissions abatement and staying below certain emissionslevels (Driessen, 2018; World bank, 2021). Cost-effectiveness is reachedbecause, under an eTS, the industries that need to comply with emissiontargets can either implement internal abatement measures or acquireemission allowances (or credits), depending on the relative costs of theseoptions (World bank, 2021). in other words, in eTS, polluters can tradetheir emission control obligations to realize cost-effective abatement(Driessen, 2018). one crucial feature of emission trading systems is thecap definition. an insufficiently stringent cap, i.e., an excessive supply ofemission allowances, results in low demand and low prices. This issue wasobserved in the eU eTS (Driessen, 2018; zaman, 2016). Starting anemissions trading system with smaller numbers in terms of allowances,participants, or gases covered, and gradually broadening its scope can limitproblems of oversupply of allowances (zaman, 2016).
a potentially high volatility of allowance prices is a challenge foremissions trading systems. a stable price signal definitively incentivizesfirms to change their investment decisions to favour emissions reduction.With the aim of reducing price volatility, different policy instruments have
Rossi Doria 4/21.qxp_Layout 1 28/10/21 10:53 Pagina 16

1. CArbOn PriCinG in ThE LiTErATurE
17
been proposed to work together with emissions trading systems, such asprice ceilings, price floors (as can be found in the UK and Canada) and anallowance reserve. an example of the eU eTS, a market stability reserve(MSR) was added to the system in its fourth phase to maintain a reasonablystable level of allowance prices. Despite the use of these instruments, acertain level of volatility will remain, as will the need to understand andpredict prices (zhang, 2020).
Carbon taxUnder the carbon tax approach, the government charges Co2 emitters
for each tonne released through a tax or fee. based on their carbon content,the government can impose a carbon tax on the distribution, sale or useof fossil fuels. in this way, a carbon tax guarantees the carbon price in theeconomic system against uncertain outcomes. according to a statementmade by US economists on Carbon Dividends2, “the largest publicstatement of economists in history”, a carbon tax offers the mostaffordable leverage to reduce carbon emissions to the scale and speedneeded. it should increase every year until emission reduction targets aremet and be revenue-neutral in order to avoid debates over the size ofgovernment. Furthermore, a sufficiently robust and gradually increasingcarbon tax will replace the need for various, less efficient carbonregulations. Carbon tax has distributive impacts. in the opinion of theeconomists signatories of the statement, all revenue should be returneddirectly to citizens through equal flat rate rebates, to maximize fairnessand the political viability of a rising carbon tax. Ultimately, mosthouseholds, including the most vulnerable, will receive more “carbondividends” than they pay with rising energy prices. Therefore, they willbenefit financially from carbon tax.
The Stanford energy Modelling Forum recently completed a study onthe economic results of introducing a carbon tax in the United States. itturns out that a carbon tax is effective in reducing carbon pollution,although the structure of the tax – namely the price and the rate at whichit increases – is important. a tax implemented in 2020 at USD 25 per tCo2emitted from fossil fuels would reduce annual emissions by approximately6-18% in the short term, mainly due to the substitution of coal for natural
2 <https://clcouncil.org/economists-statement/>.
Rossi Doria 4/21.qxp_Layout 1 28/10/21 10:53 Pagina 17

LEVELLinG GLObAL CArbOn PriCinG.A PrOPOSAL FOr An inCLuSiVE, SuSTAinAbLE EnErGy And CLimATE rOAdmAP
18
gas to produce electricity. The study also notes that the rate of increase ofthe carbon tax is more important than the starting price. For example, atax of USD 50 per tCo2 that increases by 5% per year would reducecarbon pollution by 33-56% in 2040. a tax of $ 25/tCo2 that increases by5% per year would cut carbon pollution by 25-50% over the same period.Conversely, policies that include a tax increase of just 1% per year wouldonly result in a short-term reduction. Carbon pollution would then remainstable at those levels. These results suggest that the most effective carbontax could start relatively low to allow taxpayers to adjust, but shouldincrease rapidly over time.
Driessen (2018) emphasizes that governments usually use a pollutiontax or an emissions trading program in conjunction with other programs.however, the interaction of these instruments with other mechanismsproduces different results regarding additional emission reductions. in thepresence of emissions trading, an additional program aiming to reduceemissions will often not add emission reductions. Since the emitter has thelegal right to sell emission allowances, if emissions are reduced throughthe additional program and the respective allowances are sold, there is nonet emissions decrease. “a new program will only reliably generateadditional progress if those realizing the reductions generated under thatnew program cannot sell credits” (Driessen, 2018: 57).
Differently, in the context of a pollution tax, a supplementalenvironmental program addressing pollution usually results in net pollutionreductions. From the polluter’s point of view, pollution taxes may evenencourage the adoption of additional programs since the reduction inemissions will decrease the amount of tax paid (Driessen, 2018).
Sanctions and excisesCarbon pricing concerns measures that impose an explicit price on
GhG emissions, for example a price expressed as a value per tonne ofcarbon dioxide equivalent. The sanctions are instead applied to companiesand countries that do not adopt climate policies or have too low emissionsor environmental standards. as carbon pricing entails an explicit price onGhG emissions, for example a price expressed as a value per tonne of acarbon dioxide equivalent, other measures, notably excises and subsidies,can be considered “implicit carbon pricing” (World bank, 2019). in PartTwo and Three of this report, data on this type of implicit pricing will be
Rossi Doria 4/21.qxp_Layout 1 28/10/21 10:53 Pagina 18

1. CArbOn PriCinG in ThE LiTErATurE
19
discussed. The very low excise duties and taxes on gasoline and diesel inthe United States – about one fifth of the total price – are believed to playan important role in per capita emissions, which are about two to threetimes those observed in europe, where taxes account for about 60% ofthe consumer’s fuel price (burggraeve et al., 2020).
The fact that excise duties are an implicit form of carbon pricing alsoemerges from some national experiences. around 2000, Swedenstrengthened its carbon taxation mechanism. at the same time, it re-labelledsome of its existing fuel taxes as a carbon tax, which neutralized the effectof the carbon tax increase on the total fuel price. The future path of thecarbon tax was also clearly announced at that time. The French governmentacted similarly by fully offsetting the introduction of the carbon tax in 2014with a cut equivalent to an existing indirect tax, allowing for a smoothtransition. again, the fiscal path was clearly communicated (burggraeve etal., 2020). an important distinguishing feature of a carbon tax comparedto a normal excise tax is clearly tracing and communicating the tax’s growthpath toward.
on the contrary, subsidies reduce the price of carbon or morespecifically reduce the final-user cost of products containing carbon. Forthese reasons, subsidies for fossil fuel production or use, which lead toemissions of carbon dioxide or tax exemptions, can be considered formsof implicit negative carbon pricing.
Carbon pricingThe idea of global carbon pricing has long been a recurrent topic in
the climate policy debate at various levels. in recent years, carbon priceshave increasingly been adopted to combat the risks of climate change. bythe end of 2020, however, they covered about 16% of global emissions(World bank, 2020). Furthermore, current carbon price levels are generallytoo low to substantially reduce the risks of climate change (United nations,2018). The price of carbon is related to numerous variables of differentorders: environmental, social, political, technological and economic. Forexample:
Cross-national studies show that countries with greater public distrust•in politicians and higher perceived corruption persistently show weakerclimate policies and higher greenhouse gas emissions. Specifically, thereis a negative correlation between public distrust or perceived corruption
Rossi Doria 4/21.qxp_Layout 1 28/10/21 10:53 Pagina 19

LEVELLinG GLObAL CArbOn PriCinG.A PrOPOSAL FOr An inCLuSiVE, SuSTAinAbLE EnErGy And CLimATE rOAdmAP
20
and carbon price levels (baranzini et al. 2014, Rafaty 2018, Klenert etal., 2018);on the contrary, as income grows, the willingness to pay for•environmental protection also seems to increase. Skovgaard et al. (2019)have shown an effect of income on the early adoption of the carbonprice;Similarly, education contributes positively to awareness of climate risks•(lee et al., 2015);Conversely, there are significant negative effects of per capita coal•reserves on carbon price and carbon tax intensity (best and zhang,2020). This is because coal is the most carbon-intensive fossil fuel andlarger reserves can contribute to carbon price resistance where thereare strong vested interests;Furthermore, the size of internal credit stocks, rather than the flow of•annual income, is correlated with higher carbon pricing (best andzhang, 2020). in fact, stocks seem to be of greater importance forlong-term changes in energy systems (best, 2017). Greater economicresources can provide countries with a greater capacity to undertake amore challenging climate policy that addresses capital-intensive energysectors.
There are numerous empirical studies that testify to the effectivenessof carbon pricing, both conducted from an international perspective andon individual countries and specific sectors. best et al. (2020), for example,using data over a two-decade period for 142 countries – 43 of which havingimplemented carbon prices at the national or lower level at the end of thestudy period – found that the average annual growth rate of Co2 emissionsfrom fuel combustion was about 2 percentage points lower in countrieswith a carbon price than in countries without. all other things being equal,an extra euro per tonne of Co2 in the carbon price is associated with areduction in the subsequent annual growth rate of emissions byapproximately 0.3 percentage points. andersson (2019), analyzing theimplementation of a carbon tax and a value added tax on transport fuel inSweden, found that carbon dioxide emissions from transport fell by nearly11%, with the higher share due to the carbon tax alone, compared to a
Rossi Doria 4/21.qxp_Layout 1 28/10/21 10:53 Pagina 20

1. CArbOn PriCinG in ThE LiTErATurE
21
synthetic control unit built by a comparable group of oeCD countries3. a world carbon price was discarded by the 2009 Copenhagen
Conference of the Parties, but it still formed part of the deliberations fora climate deal in subsequent years. There remains, however, resistance tothe implementation of such a measure, and among those in favor, adiversity of views on the best instruments to adopt (essentially, whether acarbon tax or emissions trading systems) and on which emissions to applypricing (for example, whether only to emissions deriving from energy usesor to a generality of polluting sources).
There is certainly no lack of reasons for using carbon pricing, both interms of economic efficiency and environmental effectiveness (baranziniet al., 2016). by contrast, actions to reduce polluting emissions representglobal public goods and involve costs that are as high as the establishedCo2 abatement threshold. For these reasons, free riding behaviours on thepart of some states may allow them to reap benefits without compromisingthe competitiveness of national companies. it is therefore necessary tocoordinate actions in the international forum to prevent leakage anddumping of carbon emissions at a global level and to guarantee a faircompetition among countries.
Polluter Pays Principleas stated by the european association of environmental and
Resource economists (eaeRe) “A price on carbon offers the most cost-effectivelever to reduce carbon emissions at the scale and speed that is necessary. By correctinga well-known market failure, a carbon price sends a powerful signal, steering economicactors towards a low-carbon future. This encourages technological innovation, large-scale infrastructure development, as well as the diffusion of carbon-efficient goods andservices”. The main reason for resorting to carbon pricing identified byeconomic theory is the need to internalize the environmental costs ofemissions, in compliance with the “polluter pays” principle. Carbontaxation, in fact, changes relative prices. Therefore, companies andconsumers, when making decisions that cause carbon emissions, will beforced to go beyond their own benefits and costs, and consider the direct
3 Furthermore, the carbon tax elasticity of gasoline demand is estimated to be three timesgreater than the price elasticity. Policy assessments of carbon taxes that use price elasticityto simulate emission reductions can significantly underestimate their true effect.
Rossi Doria 4/21.qxp_Layout 1 28/10/21 10:53 Pagina 21

LEVELLinG GLObAL CArbOn PriCinG.A PrOPOSAL FOr An inCLuSiVE, SuSTAinAbLE EnErGy And CLimATE rOAdmAP
22
and indirect social costs of carbon emissions generated over the cycle ofthe product, from raw material to waste. if the carbon price were highenough to steer businesses and consumers toward making the necessaryadjustments, energy systems and the economy could considerably reducethe carbon intensity of the economy4.
Carbon pricing and innovation policiesCarbon pricing integrates well with technological innovation policies
(acemoglu et al., 2012). by increasing the costs of more carbon-intensiveactivities, companies are incentivized to invest in research and developmentof green processes and products. There is a positive relationship in theliterature between higher energy prices and the adoption of cleantechnologies (ambec et al., 2012). For example, in australia, during theenforcement period of a carbon pricing scheme (from July 2012 to July2014), companies accelerated the adoption of cleaner technologies(bakhtiari, 2018). Much of this growth is due to companies lagging intechnology and failing to catch up with the frontier. While front runningfacilities have constantly improved their technologies and the carbon pricehas only pushed them to move faster, less innovative facilities tend to lagbehind in the absence of carbon prices and are later compelled to catchup with the front running facilities only upon application of the carbonprice. The reallocation of activities, mostly within electricity, gas & utilitiessector companies, towards cleaner and more efficiently scaled facilitieshave led toward a reduction of emissions. all of these activities cease whenthe carbon price is abolished. These patterns are strongly linked to theintroduction or abrogation of carbon pricing; there is a clear correlationbetween the carbon price and observed changes. aghion et al. (2012),through company-wide data on automotive industry innovation,distinguishing between “dirty” (internal combustion engine) and “clean”(e.g., electric and hybrid) patents in 80 countries over several decades, showthat companies tend to innovate relatively more in clean technologies whenfaced with higher tax-inclusive fuel prices. boqiang and Wesseh (2020),analyzing China’s national emissions trading scheme, found a significant
4 in 2018, compared to a world average of 2.4 tCo2/toe, the Co2 intensity of the energymix was 3 for China, 2.2 for the United States and 2 for the european Union - 28 (source:iea).
Rossi Doria 4/21.qxp_Layout 1 28/10/21 10:53 Pagina 22

1. CArbOn PriCinG in ThE LiTErATurE
23
and positive effect on R&D investment, especially R&D intensity. Withoutprices that internalize the costs of pollution, technological innovationwould not be oriented in the socially desirable direction.
Carbon pricing and consumersThe incentive also works on the demand side, as consumers would
increase the demand for sustainable solutions. it emerges from sectorstudies that the generality of consumers, despite growing environmentalawareness, is not very attentive to choices with an environmental impactin their purchasing. This is also because the single action has negligibleeffects on larger phenomena. Without assuming that economic agents actin a virtuous or altruistic way, by intervening on the price, one imagines todirect individual choices more effectively. on the other hand, social learningtheories are highlighting the importance of imitative factors for thediffusion of sustainable behaviours among people and also amongcompanies (van der linden, Maibach and leiserowitz, 2015, Saleem et al.,2021). Generally, the participation of citizens and a higher sense of civicduty (as found in the countries of northern europe) positively influenceenvironmental sensitivity and behavior.
Carbon pricing flexibilityFurthermore, if compared to other instruments, carbon pricing shows
an appropriate flexibility to deal with such a complex phenomenon as Co2emissions. in fact, it lends itself to addressing the wide heterogeneity ofsources of greenhouse gas emissions and, in this way, is functional tominimizing the costs of containing pollution. The heterogeneity is due, forexample, to industries’ different sizes, types of organization, andproduction technologies – a variability that is reflected in several marginalcosts of reducing emissions. according to orthodox economic theory,assuming a context of perfect information and rationality of economicagents, emitters should identify the level of emissions reduction at the pointwhere the marginal cost of a tonne of carbon equals its price. by imagininga system that imposes a single carbon price, it follows that the costs ofCo2 abatement would be identical for all polluters. on this basis, a givenCo2 reduction target would be obtained by minimizing global costs.
Rossi Doria 4/21.qxp_Layout 1 28/10/21 10:53 Pagina 23

LEVELLinG GLObAL CArbOn PriCinG.A PrOPOSAL FOr An inCLuSiVE, SuSTAinAbLE EnErGy And CLimATE rOAdmAP
24
Carbon pricing efficiencyalthough these optimal conditions are impossible to obtain (due to
lack of information and rationality of individuals and operators, as well asgaps in the knowledge of production and abatement technologies and therelated associated costs), the literature on this topic shows that mechanismsother than carbon pricing are less effective, that is, they have higheremission abatement costs. For example, if carbon pricing constitutes asystem that can be easily applied to new types of emissions, other carbon-reducing solutions, such as technical production and emissions standards,cannot be universally applied to the myriad of technologies available ormay be too costly to adopt. For example, eco-labelling systems require life-cycle analysis to account for the actual carbon content of products andservices. in this way, carbon pricing appears to reduce information andtransaction costs. For Pizer (2002) uncertainty about compliance costscauses otherwise equivalent price and quantity controls to work differentlyand leads to divergent welfare consequences. he concludes that pricecontrols are more efficient. The expected welfare gain from an effectivepricing policy is estimated to be five times higher than the expected gainfrom the most effective quantity policy. at the same time, for Pizer (2002),a hybrid policy is an attractive alternative to either a pure price or quantitysystem. Fischer and newell (2008) compare various policies to reducecarbon dioxide emissions and support the spread of renewable energy andinnovation, specifically emissions price, emissions performance standard,fossil power tax, renewables share requirement, renewables subsidy andR&D subsidy. They highlight that for anything beyond very small emissionreduction targets, the price of emissions is the single most efficient policyfor reducing emissions, as it simultaneously offers incentives for fossilenergy producers to reduce emissions intensity, consumers to conserve,producers of renewable energy to expand production and invest inknowledge to reduce costs. in their view, the most effective policy portfolioincludes an emissions price and subsidies for research and technologicaldevelopment and learning.
Carbon leakage and dumping preventionin addition, as previously mentioned, a carbon pricing system applied
internationally would prevent carbon leakage and dumping. if some States,however, fail to introduce pricing, trade sanctions could be applied to free
Rossi Doria 4/21.qxp_Layout 1 28/10/21 10:53 Pagina 24

1. CArbOn PriCinG in ThE LiTErATurE
25
riding polluters, as suggested in current literature (nordhaus, 2015).Sanctions could also take the form of carbon tax at the border, to beapplied to imports from non-compliant countries or with inadequateemission standards (an example is the Carbon adjustment borderMechanism prposed by the european Commission). nevertheless, ameasure of this kind does not automatically guarantee the globalimplementation of an adequate climate policy. in fact, alternative policiesbased on technology transfer from developed to developing economiesmight be more effective as a solution to carbon leakage and do not raiseconcerns about equity in distribution of mitigation responsibilities(Cappelli et al., 2021).
Furthermore, carbon pricing could be more effective than othermethods in dealing with the Jevons paradox and, in general, with therebound effects (van den bergh, 2011). The savings achieved throughadvances in energy efficiency would be directed less towards cheaperproducts and technologies with a high carbon content.
Carbon pricing revenuesThe revenue from carbon pricing could be used by States in various
ways, from promoting sustainable development to reducing labor taxes;investing in research and development to combatting the social anddistributive impacts of carbon pricing (see Part Four of this report). Theallocation of the proceeds of carbon pricing and issues of equity anddistributive effects are a major concern for citizens with regard to carbonpricing (Maestre-andrés et al., 2019). To cope with the distributive impactof a higher price of fossil fuels, the concept of equal per capita dividendsis also gaining ground (boyce, 2018). according to various estimates, thecarbon price could raise funding to meet the investment needs for basicinfrastructure. in this way, carbon pricing revenues could fill infrastructureaccess gaps, helping to cover infrastructure investment needs in mostcountries (Jakob, Chen, Fuss et al., 2016).
Rossi Doria 4/21.qxp_Layout 1 28/10/21 10:53 Pagina 25

27
PART TWO
Carbon price: assessments of required price levels andthose currently observed
Paragraph 2.1 illustrates carbon price level estimates that would be requiredto be in line with the Paris agreement goals. Paragraph 2.2 shows currentlevels of different carbon pricing instruments that could inform theimplementation of a minimum global carbon price.
Main findings are the following:The iPCC, the high-level Commission on Carbon Prices and the iea•have proposed carbon price levels compatible with the objectives ofthe Paris agreement. These levels range from $ 40-80 in 2020 to $ 50-6,050/tCo2 in 2030, depending on the policy context.however, prices observable today vary considerably, and most prices•remain far from the proposed ranges. even countries that sustainrelatively high carbon prices do not price all of their emissions.Moreover, it is estimated that approximately 60% of Co2 emissionsfrom energy use are not priced, considering 44 oeCD and G20countries responsible for 80% of global emissions from energy use.
2.1 Carbon price: the level requiredThe carbon price is a price per tonne of Co2 and Co2 equivalent
(Co2e) that can be applied to Greenhouse Gas (GhG) emissions. estimates of the carbon price level required to be in line with the Paris
agreement vary significantly across models and scenarios. The price levelincreases with mitigation efforts and decreases with the support of otherpolicies, such as regulatory measures (iPCC, 2018).
Table 2.1 summarizes carbon price findings from three internationalreports.
Rossi Doria 4/21.qxp_Layout 1 28/10/21 10:53 Pagina 27

LEVELLinG GLObAL CArbOn PriCinG.A PrOPOSAL FOr An inCLuSiVE, SuSTAinAbLE EnErGy And CLimATE rOAdmAP
28
Table 2.1 shows that lower carbon price ranges imply that othermeasures and policies are applied.
Carbon price estimates higher than $ 80-100/tCo2 in the period 2020-30 usually make more pessimistic assumptions regarding the pace oftechnological advancement and the impact of socioeconomic trends.higher price ranges also assume an unsupportive policy environment andless support from other policies (Stern & Stiglitz, 2017).
The oeCD (2018b) observes that estimates of $ 40-80/tCo2 by 2020and of $ 50-100/tCo2 by 2030 are low because they assume that carbonprices are introduced in a context where policies are well aligned withclimate objectives.
according to the iea (2017) carbon pricing should be in the range of$ 75-100/tCo2 by 2030, depending on the country. This scenario assumesthe use of standards and regulations coupled with support for technologydevelopment and deployment to make emerging low-carbon technologiescompetitive.
!"#"$"%&"'()*+,)'-,$./%0'1&"%,$/*'
2*)/&3'&*%4"54'6,$+*%'7$/&"'*8"$'49"'3",$1'
:;<46=>?'
>@>@' >@A@' >@B@' >@C@'
D/09EF"8")'6*../11/*%'*%'6,$+*%'2$/&"1':G4"$%'H'G4/0)/4IJ'>@KL?'
>M6'
N/49'*49"$'7*)/&3'.",1O$"1''
PQ9"'7$/&/%0'7*)/&3'/1'&*.7)"."%4"R'-/49'4,$0"4"R',&4/*%1',%R','1O77*$4/8"'/%8"14."%4'&)/.,4"'S'/%'49"',+1"%&"'*#'49"1"'")"."%41J'49"'&,$+*%'7$/&"'$,%0"'$"TO/$"R'/1')/U")3'4*'+"'9/09"$V':7W'C@?'
B@EX@' C@EK@@' %W,W' %W,W'
Y266':>@KX?' KWCM6' N/49*O4'*49"$'7*)/&3'.",1O$"1' %W,W' KACEZ@C@' %W,W' >BCEKBA@@'
Y266':>@KX?'D/09"$E>M6'
N/49*O4'*49"$'7*)/&3'.",1O$"1' %W,W' KCE>>@' %W,W' BCEK@C@'
Y[\':>@KL?' >M6'
N/49'*49"$'7*)/&3'.",1O$"1'
:P14,%R,$R1',%R'$"0O),4/*%1',$"'O1"R',1'-"))'S',1'"%"$03'"##/&/"%&3'14,%R,$R1'EJ'&*O7)"R'-/49'1O77*$4'#*$'4"&9%*)*03'R"8")*7."%4',%R'R"7)*3."%4'4*'.,U"'"."$0/%0')*-E&,$+*%'4"&9%*)*0/"1'&*.7"4/4/8"V?W'
%W,W' LCEK@@' K>C'E'KB@' %W,W'
'
Table 2.1 CaRbon PRiCe in DiFFeRenT Global WaRMinG SCenaRioS,
YeaRS anD PoliCY ConTexTS ($ PeR tCo2)
Source: Stern & Stiglitz (2017); IPCC (2018); IEA (2017)
Rossi Doria 4/21.qxp_Layout 1 28/10/21 10:53 Pagina 28

2. CArbOn PriCE: ASSESSmEnTS OF rEquirEd PriCE LEVELS
And ThOSE CurrEnTLy ObSErVEd
29
2.2 Carbon prices currently observedApproximately 60% of CO2 emission from energy use are not
priced, considering 44 oeCD and G20 countries responsible for 80% ofglobal emissions from energy use (oeCD, 2021e).
Share of global emissions covered by eTS and carbon taxes and theirprice levelThe iMF (2019) has calculated the global average price of carbon to
be only about $ 2/tCo25.
in 2020, approximately 16% of global GhG emissions were coveredby carbon taxes or emission trading systems already in place6: 10.7% wereunder an emission trading system and 5.6% were covered by carbontaxes. The Chinese eTS to be implemented in 2021 may add 6% ofemission coverage (World bank, 2021).
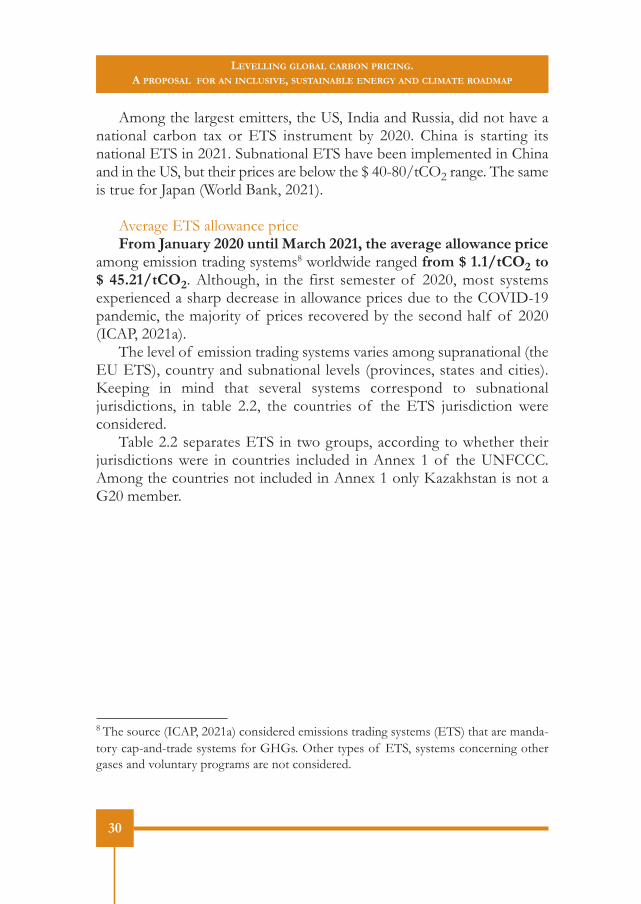
Globally, in 2020, carbon prices from the eTS and carbon taxes rangedfrom less than US$ 1/t Co2e to US$ 119/tCo2e, with almost half of thecovered emissions priced at less than uS$ 10/tCO2e. among theemissions under a carbon tax or an eTS, less than 5% are in line withthe estimated $ 40-80/tCO2 2020 price range (World bank, 2020).
Up until 2020, only six european countries7 had a carbon pricinginstrument with prices within or above the $ 40-80/tCo2 range – notably,a carbon tax. however, there is still a high share of emissions in thesecountries that are not covered by a pricing instrument (World bank, 2020).in 2021, the price of eU eTS allowances has surpassed $ 40/tCo2 (iCaP,2021b).
5 The iMF report does not provide details as to how this average value was calculated.The report explains that its discussion on carbon pricing was based on the World bankreport “State and Trends of Carbon Pricing 2018” (iMF, 2019). The World bank reportitself does not compute an average global carbon price. it provides the carbon price ofsingle carbon pricing initiatives and the price range for a given portion (per cent) of emis-sions (World bank; ecofys, 2018). We did not find other computations for a global aver-age price of carbon among our references.6 The World bank analyzed country-level carbon pricing initiatives in 29 countries. Subna-tional initiatives in Canada, China and the US were also active, beyond the eU eTS, whichis supranational.7 norway (upper price rate: $ 53), France ($ 49), Finland (transport fuels price rate: $ 68;other fossil fuels price rate: $58), Switzerland ($ 99), liechtenstein ($ 99), Sweden ($ 119).
Rossi Doria 4/21.qxp_Layout 1 28/10/21 10:53 Pagina 29
LEVELLinG GLObAL CArbOn PriCinG.A PrOPOSAL FOr An inCLuSiVE, SuSTAinAbLE EnErGy And CLimATE rOAdmAP
30
among the largest emitters, the US, india and Russia, did not have anational carbon tax or eTS instrument by 2020. China is starting itsnational eTS in 2021. Subnational eTS have been implemented in Chinaand in the US, but their prices are below the $ 40-80/tCo2 range. The sameis true for Japan (World bank, 2021).
average eTS allowance price From January 2020 until march 2021, the average allowance price
among emission trading systems8 worldwide ranged from $ 1.1/tCO2 to$ 45.21/tCO2. although, in the first semester of 2020, most systemsexperienced a sharp decrease in allowance prices due to the CoviD-19pandemic, the majority of prices recovered by the second half of 2020(iCaP, 2021a).
The level of emission trading systems varies among supranational (theeU eTS), country and subnational levels (provinces, states and cities).Keeping in mind that several systems correspond to subnationaljurisdictions, in table 2.2, the countries of the eTS jurisdiction wereconsidered.
Table 2.2 separates eTS in two groups, according to whether theirjurisdictions were in countries included in annex 1 of the UnFCCC.among the countries not included in annex 1 only Kazakhstan is not aG20 member.
8 The source (iCaP, 2021a) considered emissions trading systems (eTS) that are manda-tory cap-and-trade systems for GhGs. other types of eTS, systems concerning othergases and voluntary programs are not considered.
Rossi Doria 4/21.qxp_Layout 1 28/10/21 10:53 Pagina 30

2. CArbOn PriCE: ASSESSmEnTS OF rEquirEd PriCE LEVELS
And ThOSE CurrEnTLy ObSErVEd
31
Source: Authors’ own elaboration on data by ICAP (2021a, 2021b)
in 2021, a country level eTS will be implemented in Germany, with afixed allowance price of $ 28.55/tCo2. a national Chinese eTS will alsobe effective in 2021, but allowance prices are not yet available.
Carbon pricing scoreThe carbon pricing score (CPS) of countries is a measure developed by the
oeCD to evaluate the extent to which countries have reached the goal ofpricing all energy related carbon emissions at certain benchmark values forcarbon costs. The benchmark values are 30, 60 and 120 eUR9 (oeCD, 2021b).
9 For example, «a CPS of 100% against a eUR 30/tCo2 benchmark means that the coun-
Table 2.2 aveRaGe eTS alloWanCe PRiCe oF SYSTeMS aCTive in 2020
a) Cap-and-trade systems in jurisdictions that are part of Annex 1 countries
b) Cap-and-trade systems in other jurisdictions
Initiative Average* allowance price in 2020 ($/tCO2)
Initiative Average allowance price in 2020 ($/tCO2)
European Union** 28.28 Korea 27.62
Switzerland 28.45 Beijing 12.62
New Zealand 19.99 Shanghai 5.81
Nova Scotia 18.16 Guangdong 4.09
California 17.40 Hubei 3.94
Québec 16.97 Chongqing 3.82
RGGI (Regional Greenhouse Gas Initiative – includes 11 US States) 7.06 Shenzhen 3.46
Massachusetts 7.00 Tianjin 3.28
Tokyo 5.06 Fujian 2.50
Kazakhstan 1.10
Notes: Prices are not directly comparable across systems, given differences in ETS design. Other than these initiatives, the Saitama ETS and the Mexico pilot ETS were also active in 2020. However, no 2020 average allowance price was available for them. * Average allowance prices in 2020 provided in USD by ICAP (2021a). ** In 2021 the EU ETS entered its 4th phase, which significantly altered the allowance price level. From January to March 2021, the average allowance price of the EU ETS was $45.21/tCO2 (The 2021 average price was provided in EUR by ICAP (2021b) and converted by the authors in USD using an average exchange rate of 1.2048 for the period from January to March 2021).
!
Rossi Doria 4/21.qxp_Layout 1 28/10/21 10:53 Pagina 31

LEVELLinG GLObAL CArbOn PriCinG.A PrOPOSAL FOr An inCLuSiVE, SuSTAinAbLE EnErGy And CLimATE rOAdmAP
32
in 2018, 44 oeCD and G20 countries, responsible for 80% of energy-related Co2 emissions globally, reached together a Carbon Pricing Scoreof 19% at the 60 eUR benchmark (CPS60). This means that these countriesreached only 19% of the carbon pricing goal of 60 eUR for all energyrelated carbon emissions. The oeCD considered carbon taxes, eTSpermits prices, and specific taxes on fossil fuels to compute global carbonrates (oeCD, 2021b).
Considering the largest emitters, the US reached a CPS60 (CPSconsidering a eUR 60 benchmark) of 22%; China’s CPS60 was even lower(9%); but the introduction of a national emission trading system (eTS) in2021 is expected to increase the share of emissions priced. Japan’s CPS60was 24%; Russia’s 7%, while india recorded a 13% CPS.
in the 23 eU countries studied in the oeCD report, emission permit“prices have increased since 2018 and trade above eUR 30/tCo2 sinceearly January 2021” (oeCD, 2021b: 26). at permit prices in the eU eTSof eUR 30, the CPS60 increases from 44% in 2018 to 52%. according tothe oeCD, in order to close the carbon pricing gap entirely «carbon priceswould also need to increase in sectors that are currently not covered by theeU eTS and that have low effective carbon rates» (oeCD, 2021b: 26), asin the residential and commercial sectors.
if these sectors were included, together with industry, the CPS60 wouldincrease to 61%; moreover, if permit prices were raised to at least eUR60/tCo2, the CPS60 would reach 84% and the remaining pricing gap wouldbe due mainly to biofuels (oeCD, 2021b).
Carbon taxes and fuel excise taxes in different groups of countriesStarting from carbon tax and fuel excise tax10 data provided for 60
try prices all carbon emissions in its territory from energy use at eUR 30 or more. a CPSof 0% means that the country does not impose a carbon price on emissions at all. an in-termediate CPS between 0% and 100% means that some but not all emissions are pricedat or above the benchmark price». eUR 30/tCo2. is an historic low-end price benchmarkof carbon costs; eUR 60/tCo2 is a low-end estimate of carbon costs in 2030 and a mid-range benchmark of carbon costs in 2020. The eUR 120 benchmark price is a “centralestimate of the carbon costs in 2030” (oeCD, 2021b: 19). 10 We chose to show only carbon tax and fuel excise tax, excluding eTS, for a few reasons:first, significant eTS are active at a supranational or subnational level, thus making it dif-ficult to make cross-country comparisons; second, data on eTS are less extended, detailed
Rossi Doria 4/21.qxp_Layout 1 28/10/21 10:53 Pagina 32

2. CArbOn PriCE: ASSESSmEnTS OF rEquirEd PriCE LEVELS
And ThOSE CurrEnTLy ObSErVEd
33
countries11 (oeCD 2019; 2021c), we calculated12 the average carbon price($/tCo2) applied on energy use in each country, to see how close theircarbon prices are to the various benchmarks described in table 2.1.
While the World bank (2020) describes higher carbon taxes for somecountries than those provided by the oeCD (2019), for the purpose ofour study, it was important to use oeCD’s carbon tax and fuel excise taxdata, since they follow the same calculations. The oeCD also providesdetailed information on the amount of emissions covered by each tax rate,allowing for the computation of the following average carbon prices. Whilethe oeCD data does not include eTS allowance prices, we assumed thatexcluding eTS from the following analysis would not change theconclusion, that is, when fuel excise taxes are considered, they representthe highest share of carbon pricing within a country. emission TradingSystems cover approximately 10% of global GhG emissions across alleconomic sectors. The eU eTS alone accounts for more than 4% of it.as mentioned before in this chapter, other major emitting countries do
and systematized than taxes data, hindering the comparison between sectors and emissionscovered by carbon taxes, fuel excise taxes and eTS.11 oeCD data for 45 oeCD and G20 countries are provided in Taxing Energy Use 2019,while oeCD data for 15 countries not belonging to the oeCD or to the G20 are pro-vided by the oeCD Stats database available at: <https://stats.oecd.org/index.aspx?DataSetCode=TeUSDCbR>, a dataset that is part of the report Taxing energy Use forSustainable Development (oeCD, 2021d).12 Fuel excise and explicit carbon taxes are converted by oeCD (2019, 2021c) into effec-tive carbon tax rates per tonne of Co2 based on the carbon content of the fuels.as regards the 45 oeCD and G20 countries studied in Taxing Energy Use 2019, we usedthe data provided in “annex 3.a Carbon Tax Profiles”. in order to find the average car-bon tax and the average excise tax, we started by calculating the revenue from carbon taxand fuel excise tax in each country, multiplying the various tax rates for each sector by theemissions caused by the relative sector; then, we divided the carbon tax revenue by thetotal emissions, and we did the same for the excise tax revenue. in this way, we found theaverage carbon tax and fuel excise tax of each country. The graphs show the average car-bon price as the sum of the average carbon tax and average excise tax. Data in eUR wereconverted in US$ with the average 2018 exchange rate provided by the european Centralbank: 1.181.Regarding the 15 countries outside of the oeCD and G20, average fuel excise taxes werealready provided in the oeCD stats database; these countries do not have a carbon tax,so the carbon pricing reflects the fuel excise tax only.
Rossi Doria 4/21.qxp_Layout 1 28/10/21 10:53 Pagina 33

LEVELLinG GLObAL CArbOn PriCinG.A PrOPOSAL FOr An inCLuSiVE, SuSTAinAbLE EnErGy And CLimATE rOAdmAP
34
not have a national eTS (World bank, 2020). average carbon prices provide an understanding of the level of carbon
pricing for all of the countries’ energy-related emissions. however, countryaverages do not give indications as to the variations of the carbon ratewithin a country, nor do they show which portions of emissions are pricedat various rates (oeCD 2018b).
Figures 2.1, 2.2 and 2.3 show that fuel excise represented the largestshare of carbon pricing in 2018 for all countries taken into consideration.also, the figures corroborate the above conclusion: major emitter countrieshave carbon price levels that are below $ 60, even when excise taxes areconsidered, with the exception of a few european countries.
in the following graphs, countries are divided into three groups: thefirst group (fig. 2.1) comprises countries included in UnFCCC annex 113;the second group (fig. 2.2) comprises non-annex 1 countries that belongeither to the oeCD or to the G20; the third group (fig. 2.3) includes 15developing countries that are neither G20 nor oeCD members.
13 UnFCCC country classification: <https://unfccc.int/process/parties-non-party-stake-holders/parties-convention-and-observer-states>.
Rossi Doria 4/21.qxp_Layout 1 28/10/21 10:53 Pagina 34

2. CArbOn PriCE: ASSESSmEnTS OF rEquirEd PriCE LEVELS
And ThOSE CurrEnTLy ObSErVEd
35
Source: Authors’ own elaboration of OECD (2019) data14
14 To find the average excise tax of a country, first the various tax rates for each sectorwere multiplied by the emissions from the relative sector. The result of this operation isthe revenue from fuel excise tax in that country. The fuel excise tax revenue was then di-vided by the country’s total emissions from energy use. The same for the average carbontax. in this way, we found the average carbon tax and fuel excise tax of each country. Thegraphs show the average carbon price as the sum of the average carbon tax and averageexcise tax. Data in eUR were converted in USD with the average 2018 exchange rate pro-vided by the eCb: eUR 1= USD 1.181.
FiGURe 2.1aveRaGe CaRbon PRiCe (exClUDinG eTS) in 33 annex 1 CoUnTRieS (2018)
Rossi Doria 4/21.qxp_Layout 1 28/10/21 10:53 Pagina 35

LEVELLinG GLObAL CArbOn PriCinG.A PrOPOSAL FOr An inCLuSiVE, SuSTAinAbLE EnErGy And CLimATE rOAdmAP
36
Source: Authors’ own elaboration of OECD (2019) data 15
15 See footnote 14.
FiGURe 2.2aveRaGe CaRbon PRiCe (exClUDinG eTS) in non-annex 1 CoUnTRieS
WhiCh aRe eiTheR MeMbeRS oF The G20 oR oF The oeCD (2018)
Rossi Doria 4/21.qxp_Layout 1 28/10/21 10:53 Pagina 36

2. CArbOn PriCE: ASSESSmEnTS OF rEquirEd PriCE LEVELS
And ThOSE CurrEnTLy ObSErVEd
37
Source: Authors’ own elaboration of OECD Stats (2021c) data
next, the carbon price levels shown in the figures above are comparedwith a benchmark price of $ 60/tCo2. The $ 60 price level, used by theoeCD in some analyses, is a middle-point price in the $ 40-80/tCo2 rangeproposed by the high-level Commission on Carbon Prices (see table. 2.1).
among annex 1 countries, most european countries are close or abovethe $ 60/tCo2 benchmark. The US’ average carbon pricing was $15.70/tCo2, while Japan had a far higher level of $ 34.67tCo2. Conversely,Russia stands close to 0 ($ 0.01/tCo2). however, the oeCD analysis of2021 puts Russia’s CPS60 at 7%.
among european countries, the largest emitters are close or above the$ 60 level, with Germany reaching $ 54.70/tCo2, the UK $ 94.49, italy$ 93.46 and France $ 100.78.
looking at the countries in figure 2.2, the highest results are in israel($ 98.65 the only country outside europe to reach an average carbon price
FiGURe 2.3aveRaGe CaRbon PRiCe (exClUDinG eTS) in non-annex 1 CoUnTRieS
WhiCh aRe neiTheR PaRT oF G20 oR oF oeCD (2018)
Rossi Doria 4/21.qxp_Layout 1 28/10/21 10:53 Pagina 37

LEVELLinG GLObAL CArbOn PriCinG.A PrOPOSAL FOr An inCLuSiVE, SuSTAinAbLE EnErGy And CLimATE rOAdmAP
38
above 60 eUR), Korea ($ 39.93) and Mexico ($ 32.84). The highest emitterspresent lower results, with China reaching $ 7.36/tCo2 and india $ 11.52.
The oeCD (2021d) studied the fossil fuel taxes of the 15 countries offigure 2.3 because they had shown an initial interest in energy tax and fossilfuel subsidy reform. These countries do not have a carbon tax, so thecarbon pricing reflects just the fuel excise tax, which is typically only appliedto certain fuels, e.g., gasoline used for road transport (oeCD, 2021d).
Countries in figure 2.3 form a heterogeneous group, sharing the needto increase energy access, (whereas oeCD countries mostly need tomaintain universal access). in this context, “fossil fuels used for heating,cooking and lighting are often taxed at lower rates or subsidized. Raisingrates on these fuels requires particular caution because of an elevated riskof unintended side effects, e.g., charcoal-switching that could worsenhealth; environmental and fiscal outcomes. in addition, affordability is aprime concern” (oeCD, 2021d:16).
The main source of energy-related Co2 emissions in countries offigure 2.3 is biofuel use, primary solid biofuels and charcoal, accounting inaverage for 45.5% of energy-related Co2 emissions. in oeCD countriesbiofuel use accounts, on average, for 18.5% of energy-related Co2emissions (oeCD, 2021d).
Rossi Doria 4/21.qxp_Layout 1 28/10/21 10:53 Pagina 38

39
PART THREE
Decarbonization path and carbon pricing
Part Three discusses the impact of various sectors on emissions from energyuse and carbon pricing revenues, highlighting their respective characteristics.Furthermore, it shows the relationship between carbon pricing mechanismsand methods to reduce the carbon intensity of the GDP.
Main findings are:The “RoaD SeCToR” presents higher levels of carbon pricing but•lower levels of carbon emissions from energy use compared to “alloTheR SeCToRS”. Conversely, “all oTheR SeCToRS” presentlower levels of carbon pricing but are responsible for the highest shareof emissions. as a result, the “RoaD SeCToR” contributes more tocarbon pricing revenues.Countries with higher carbon pricing are further ahead in the•decarbonization of their economies, proven by their low values ofcarbon intensity of GDP.in recent decades, countries have made significant progress in reducing•the energy intensity of their GDP and carbon intensity of energy,mainly cutting down the former. Carbon pricing thus proves to be auseful tool to abate carbon intensity of energy, fostering economies’decarbonization.
3.1 Carbon emissions from energy useCarbon emissions from energy use account for almost the total of
global Co2 emissions. We must urgently reverse the current situation,where the lion’s share of global emissions is unpriced. Pricing carbonemissions promotes infra & intergenerational equity and strengthenscountries’ capacity for economies decarbonization. levelling global carbonpricing supports these objectives, while leaving countries the flexibility tochoose their best fitting carbon pricing policies.
Moreover, levelling carbon pricing constitutes a global instrument thatcan raise financial resources and public funds, support the developmentof green and sustainable finance, and actions for climate change mitigation
Rossi Doria 4/21.qxp_Layout 1 28/10/21 10:53 Pagina 39

LEVELLinG GLObAL CArbOn PriCinG.A PrOPOSAL FOr An inCLuSiVE, SuSTAinAbLE EnErGy And CLimATE rOAdmAP
40
and adaptation.Figures 3.1 and 3.2 show Co2 emissions from energy use by the
following five selected economies, which together account for more thantwo-thirds of global emissions:– eU-27 (21 eU and oeCD Countries accounting for more than 97% of eU GDP);– China;– india;– United States;– Japan.
To highlight the different impacts of sectors in terms of emissions andcarbon pricing revenues, emission data have been organized into two main sets:
1 “RoaD SeCToR” carbon emissions from energy use;
2 “all oTheR SeCToRS” carbon emissions from energy use.according to the oeCD (2019) definition, “all oTheR SeCToRS”includes “off road”, “industry”, “agriculture & Fisheries”, “Residential& Commercial” and “electricity” sectors.
First, China’s share of total carbon emissions from energy use almostdoubles that of the United States’ and triples that of the eU-27 or india’scarbon emissions share (Figure 3.1). China’s emissions are eight timeshigher than Japanese emissions.
Moreover, the emissions from the “RoaD SeCToR” represent avariable share of total emissions. it is always less than 30% of the totalcarbon emissions from energy use: this share accounts, respectively, forabout 7% and 8% in China and india, doubling to 15% in Japan and risingup to 23% in eU-27 and 30% in the United States (figure 3.2).
Rossi Doria 4/21.qxp_Layout 1 28/10/21 10:53 Pagina 40

3. dECArbOnizATiOn PATh And CArbOn PriCinG
41
Source: Author’s own elaboration of OECD (2019) data
FiGURe 3.1CaRbon eMiSSionS FRoM eneRGY USe (2018)
Rossi Doria 4/21.qxp_Layout 1 28/10/21 10:53 Pagina 41

LEVELLinG GLObAL CArbOn PriCinG.A PrOPOSAL FOr An inCLuSiVE, SuSTAinAbLE EnErGy And CLimATE rOAdmAP
42
values in the columns correspond to MtCo2, as shown in figure 3.1Source: Author’s own elaboration of OECD (2019) data
in conclusion, both in absolute and in percentage values, “alloTheR SeCToRS” are responsible for the greater share of carbonemissions from energy use. The “RoaD SeCToR” emissions representpercentages ranging from less than 10% of total emissions from energyuse (india and China) to 30% (United States).
3.2 Carbon pricing revenues and differences across sectorsas illustrated in Part one, across different carbon pricing mechanisms,
carbon pricing is the sum of three addenda:– explicit carbon tax (whose rate is explicitly related to the carboncontent of the fuel).– Specific tax on energy use (especially fuel excise taxes, which are leviedon fuels and are not carbon taxes).
FiGURe 3.2CaRbon eMiSSionS FRoM eneRGY USe (%, 2018)
Rossi Doria 4/21.qxp_Layout 1 28/10/21 10:53 Pagina 42

3. dECArbOnizATiOn PATh And CArbOn PriCinG
43
– emission Permit Price (price of tradable emissions permits, also calledemissions allowances, regardless of the permit allocation method,representing the opportunity cost of emitting an extra unit of Co2).
Figure 3.3 provides an overview of carbon pricing by energy use forthe same group of countries and sectors considered above for the carbonemission analysis. based on the available data (oeCD, 2019), due to a lackof homogeneity of the emission Permit Price16 data and their low sharein the total carbon price, only “explicit carbon taxes” and “fuel excise taxes”have been taken into account for the following carbon pricing evaluation.
as shown in Figure 3.3, the selected economies vary in their capacityto obtain revenues through carbon pricing: eU-27 carbon pricing revenuesreach $ 213.8 billion17; United States follows with $ 83 billion and Chinawith $ 74.4 billion.
The “Fuel excise tax” fully dominates carbon pricing revenues: itaccounts for 100% in China, india and the United States. in the europeanUnion and Japan “Fuel excise tax” accounts for 92.9%, while 7.1% comesthrough “explicit carbon tax” revenues.
16 based on data from the World bank (2021) for 2018, we estimated that the eTS of 21 ofthese countries covered together 5.2 Gt Co2 eq, corresponding to 9.6% of global GhGemissions across all economic sectors. Data on eTS are also not very homogeneous andsometimes refer to pilot projects or subnational schemes; therefore, data are not very suitablefor generalizations, national estimates and comparison among countries. For these reasons,carbon pricing revenues resulting from eTS have been excluded from the analysis.17 For the eUR-US dollar conversion, the average exchange rate for the year 2018 equalling1.181 US dollars per euro was used.
Rossi Doria 4/21.qxp_Layout 1 28/10/21 10:53 Pagina 43

LEVELLinG GLObAL CArbOn PriCinG.A PrOPOSAL FOr An inCLuSiVE, SuSTAinAbLE EnErGy And CLimATE rOAdmAP
44
Source: Author’s own elaboration of OECD (2019) data
Carbon pricing of the “RoaD SeCToR” represents the largest partof total carbon pricing: it accounts for 67% in india and 97% in the UnitedStates, while in China, Japan and eU-27, carbon pricing of the “RoaDSeCToR” represents 75%, 79% and 84% respectively (Figure 3.4). Carbonemissions distribution across the RoaD SeCToRs of these countriesshows a reversed situation, since “all oTheR SeCToRS” contributethe most to emissions in all the countries and region selected (Figure 3.2).
The “RoaD SeCToR”, which accounts for the smallest part ofcarbon emissions compared to “all oTheR SeCToRS”, is the mostcarbon priced sector. in other words, the “RoaD SeCToR” contributesless to overall emissions from energy use. Still, it weighs heavily on carbonpricing revenues in comparison with – and opposition to – “all oTheRSeCToRS”.
FiGURe 3.3CaRbon PRiCinG RevenUeS FRoM eneRGY USe eMiSSionS (2018)
Rossi Doria 4/21.qxp_Layout 1 28/10/21 10:53 Pagina 44

3. dECArbOnizATiOn PATh And CArbOn PriCinG
45
values in the columns correspond to $ billions, as shown in Figure 3.3Source: Author’s own elaboration of OECD (2019) data
3.3 decarbonizing economies by levelling carbon pricing in countriesThe following paragraphs illustrate how countries with higher overall
carbon pricing lead to a decarbonization of their economies. The followingFigures 3.5, 3.6 and 3.7 couple iea data regarding carbon intensity ofGDP and oeCD with the average carbon pricing by countries ($/tCo2).The energy intensity of GDP (MJ/$ 2015 PPP) is represented on thehorizontal x-axis, while the carbon intensity of energy (tCo2/TJ) isrepresented on the vertical y-axis.
Going into greater detail in the analysis and results obtained for thecountries listed in annex a, the highest carbon intensity of energy valueswas measured in South africa, australia, China, Poland and Greece, rangingbetween 65 and 76 tCo2/TJ, while the lowest carbon intensity of energywas measured in iceland (8.5 tCo2/TJ) and Sweden (16.56 tCo2/TJ).
FiGURe 3.4CaRbon PRiCinG RevenUeS FRoM eneRGY USe eMiSSionS (%, 2018)
Rossi Doria 4/21.qxp_Layout 1 28/10/21 10:53 Pagina 45

LEVELLinG GLObAL CArbOn PriCinG.A PrOPOSAL FOr An inCLuSiVE, SuSTAinAbLE EnErGy And CLimATE rOAdmAP
46
Source: Author’s own elaboration of IEA (2020)
Regarding the energy intensity of GDP, the highest values wererecorded in iceland (13.7 MJ/$ PPP), Russia (8.65 MJ/$ PPP), South africa(7.50 MJ/$ PPP) and Canada (7.34 MJ/$ PPP). Conversely, ireland,Switzerland, Colombia, Denmark and luxembourg (all rangingbetween 1.46 and 2.5 MJ/$ PPP) have the lowest energy intensity of GDPvalues.
Data within the diagram measure the carbon intensity of GDP in 2018:the carbon intensity of GDP (CO2 emissions) is the result of multiplying thecarbon intensity of energy (CO2 emissions) by the energy intensity of GDP(energy use).
Figure 3.5 shows that countries with the highest carbon intensity of
FiGURe 3.5CaRbon inTenSiTY oF eneRGY anD eneRGY inTenSiTY oF GDP (2018)
GDPenergy useGDP
Rossi Doria 4/21.qxp_Layout 1 28/10/21 10:53 Pagina 46

3. dECArbOnizATiOn PATh And CArbOn PriCinG
47
GDP are South africa (0.57 kg Co2/$ PPP), Russia (0.43 kg Co2/$ PPP)and China (0.40 kg Co2/$ PPP) while Switzerland and Sweden (both0.06 kg Co2/$ PPP), and ireland (0.09 kg Co2/$ PPP) have the leastcarbon intensity of GDP.
“iso-carbon” lines show equal values for the carbon intensity of GDP.The carbon intensity of GDP decreases towards the origin of the axis;lower values of the “iso-carbon” line are closer to the origin/axes andimply lower carbon intensity of GDP value.
Decarbonization goals require that climate neutrality (set at 2050 forthe european Union and 2060 for China), i.e., net-zero emissions ofgreenhouse gases, should be reached in the coming decades. net-zeroemissions imply that either the carbon intensity of energy or the energyintensity of GDP – or both together – should shift to zero. as highlightedby the oeCD, despite necessary energy efficiency and energy reductionpolicies, it would seem difficult for energy intensities of GDP to declinetowards zero. Thus, for economies to decarbonize, countries need to movevertically towards the x-axis, reducing their carbon intensity of energy.
Figure 3.6 aligns the carbon intensity of GDP with the average explicitcarbon tax rate18 ($/tCo2). it shows that countries having a smaller – ornull – average explicit carbon tax rate (shown by small or null bubblediameter) are farther from the axis/origin of the diagram. it highlights thatthey are set back in decarbonizing their economies and have higher valuesof the carbon intensity of their GDPs. Conversely, countries with a highexplicit carbon tax tend to have a low carbon intensity of GDP and to bemore carbon-efficient.
18 The average explicit carbon tax rate is calculated as the ratio between the total revenuefrom “explicit carbon tax” and the total Co2 emissions by energy use.
Rossi Doria 4/21.qxp_Layout 1 28/10/21 10:53 Pagina 47

LEVELLinG GLObAL CArbOn PriCinG.A PrOPOSAL FOr An inCLuSiVE, SuSTAinAbLE EnErGy And CLimATE rOAdmAP
48
Note: bubble sizes indicate the average explicit carbon tax rate consistency.The more a country is closer to the axis/origin of the diagram, the lower its carbon intensity ofGDP (product of “Carbon intensity of energy” by “Energy intensity of GDP”). For each country,the average explicit carbon tax rate is the ratio between the total amount of explicit carbon taxfor all sectors and the total amount of CO2 emissions (for all sectors).
Source: Author’s own elaboration of OECD (2019) and IEA (2020) data
Carbon pricing raises the price of carbon-intensive energy. itencourages agents to switch to a more carbon-efficient energy mix, movingup-to-down with respect to the horizontal axis (x-axis) of the graph. atthe same time, carbon pricing, increasing the price of the carbon contentof energy, increases energy prices and encourages energy savings, movingright-to-left with respect to the vertical axis (y-axis).
These findings are confirmed and reinforced by adding and includingthe specific tax on energy use in carbon pricing. Using the average carbon
FiGURe 3.6CaRbon inTenSiTY oF GDP anD aveRaGe exPliCiT CaRbon Tax RaTe (2018)
Rossi Doria 4/21.qxp_Layout 1 28/10/21 10:53 Pagina 48

3. dECArbOnizATiOn PATh And CArbOn PriCinG
49
rate19 ($/tCo2) for the countries listed in annex a, Figure 3.7 gives similarresults to the ones shown in Figure 3.6 (bubbles increase in number andsize because, as seen previously, “fuel excise taxes” are much higher thanthe “explicit carbon taxes”, which are null in many countries).
Source: Author’s own elaboration of OECD (2019) and IEA (2020) data
The following picture immediately shows the link between low carbonintensity of GDP (country carbon-efficiency) joining together theisocarbon lines (see fig. 3.5) and the “average carbon rates” values (seebubbles diameters in fig. 3.7).
19 The average carbon rate is calculated as the ratio between the total revenue from theexplicit carbon tax and fuel excise tax and the total Co2 emissions by energy use.
FiGURe 3.7CaRbon inTenSiTY oF GDP anD aveRaGe CaRbon RaTe (2018)
Rossi Doria 4/21.qxp_Layout 1 28/10/21 10:53 Pagina 49

LEVELLinG GLObAL CArbOn PriCinG.A PrOPOSAL FOr An inCLuSiVE, SuSTAinAbLE EnErGy And CLimATE rOAdmAP
50
Source: Author’s own elaboration of OECD (2019) and IEA (2020) data
FiGURe 3.8CaRbon inTenSiTY oF GDP anD aveRaGe CaRbon RaTe (2018) oveR iSoCaRbon lineS
Rossi Doria 4/21.qxp_Layout 1 28/10/21 10:53 Pagina 50
3. dECArbOnizATiOn PATh And CArbOn PriCinG
51
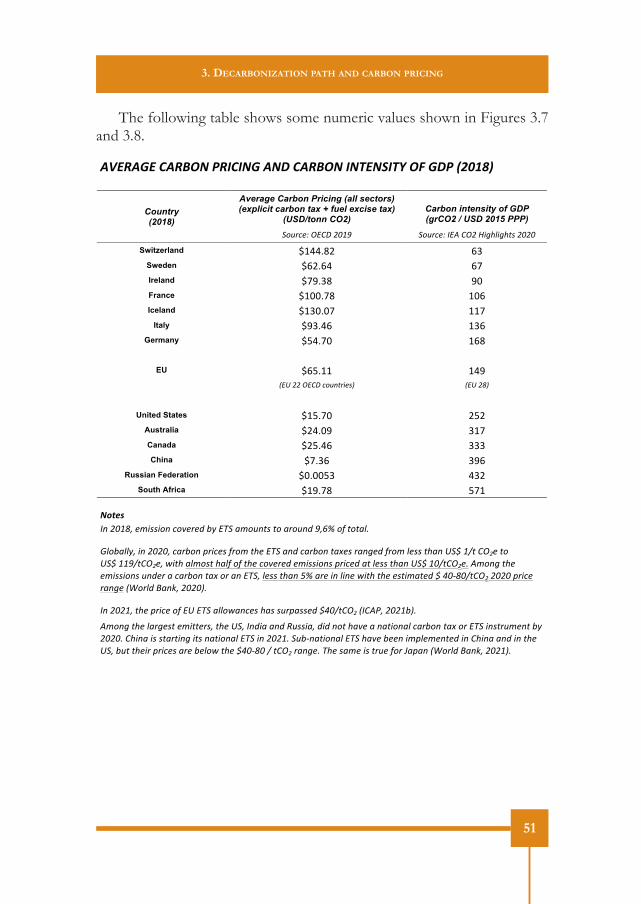
The following table shows some numeric values shown in Figures 3.7and 3.8.
!"#$!%#&'!$()*&+$,',*%&!*-&'!$()*&,*.#*/,.0&)1&%-+&234567&
& Country (2018)
Average Carbon Pricing (all sectors) (explicit carbon tax + fuel excise tax)
(USD/tonn CO2) Carbon intensity of GDP (grCO2 / USD 2015 PPP)
!"#$%&'()*+,(-./0( !"#$%&'(1*2(+)-(3456745689(-.-.(
Switzerland !"##$%&' ()'Sweden !(&$(#' (*'Ireland !*+$)%' +,'France !",,$*%' ",('Iceland !"),$,*' ""*'
Italy !+)$#(' ")('Germany !-#$*,' "(%'
' EU !(-$""' "#+'
':*;(--()*+,(%"#<8$4&9=( :*;(->=(
( United States !"-$*,' &-&'
Australia !&#$,+' )"*'Canada !&-$#(' )))'China !*$)(' )+('
Russian Federation !,$,,-)' #)&'South Africa !"+$*%' -*"'
''
'
*89:;&& 1<(-./>?(&@4994"<(%"A&$&B(CD(*E!(F@"#<89(8"(F$"#<B(0?GH("I(8"8F7J(
K7"CF77D?(4<(-.-.?(%F$C"<(L$4%&9(I$"@(86&(*E!(F<B(%F$C"<(8FM&9($F<5&B(I$"@(7&99(86F<(;!N(/O8(+)-&(8"(;!N(//0O8+)-&?(P486(F7@"98(6F7I("I(86&(%"A&$&B(&@4994"<9(L$4%&B(F8(7&99(86F<(;!N(/.O8+)-&J(2@"<5(86&(&@4994"<9(#<B&$(F(%F$C"<(8FM("$(F<(*E!?(7&99(86F<(QH(F$&(4<(74<&(P486(86&(&984@F8&B(N(R.S>.O8+)-(-.-.(L$4%&($F<5&(:T"$7B(UF<V?(-.-.=J(((
1<(-.-/?(86&(L$4%&("I(*;(*E!(F77"PF<%&9(6F9(9#$LF99&B(NR.O8+)-(:1+2W?(-.-/C=J((2@"<5(86&(7F$5&98(&@488&$9?(86&(;!?(1<B4F(F<B(X#994F?(B4B(<"8(6FA&(F(<F84"<F7(%F$C"<(8FM("$(*E!(4<98$#@&<8(CD(-.-.J(+64<F(49(98F$84<5(489(<F84"<F7(*E!(4<(-.-/J(!#CS<F84"<F7(*E!(6FA&(C&&<(4@L7&@&<8&B(4<(+64<F(F<B(4<(86&(;!?(C#8(86&4$(L$4%&9(F$&(C&7"P(86&(NR.S>.(O(8+)-($F<5&J(E6&(9F@&(49(8$#&(I"$(YFLF<(:T"$7B(UF<V?(-.-/=J(
'
Rossi Doria 4/21.qxp_Layout 1 28/10/21 10:53 Pagina 51

LEVELLinG GLObAL CArbOn PriCinG.A PrOPOSAL FOr An inCLuSiVE, SuSTAinAbLE EnErGy And CLimATE rOAdmAP
52
Figure 3.9 shows that both the “average explicit carbon tax rate” andthe “average carbon rate”20 have a negative correlation with the carbonintensity of GDP: thus, the higher the carbon pricing, the more advancedthe country is in its decarbonization.
Note: the correlation coefficient between carbon intensity of GDP and carbon pricing is equalto -0.41 when considering the “average explicit carbon tax rate” (Figure 3.9, left) and grows to-0.59 when relating to the “average carbon rate”(Figure 3.9, right). Therefore, the correlationincreases when implicit forms of carbon pricing are included.
Source: Author’s own elaboration of OECD (2019) and IEA (2020) data
it could be inferred that countries that increase and broaden carbonpricing could also move closer to the axis/origin. Carbon pricing could bebroadened if it is first expanded to “all oTheR SeCToRS” emissionsfrom energy use. This approach would contribute to level carbon pricesamong sectors, considering that the “RoaD” sector faces higher carbonprices.
Regarding advancements in decarbonization, between 1990 and 2018,Figure 3.10 shows that the group of selected countries has made significantprogress. They moved closer to the origin of the axes, mainly improvingtheir efficiency in terms of energy intensity of GDP (moving right-to-leftwith respect to the vertical y-axis). Much progress has been achieved , butmore efforts – also using carbon pricing – must be done.
20 See footnote 19.
FiGURe 3.9CaRbon inTenSiTY oF GDP anD CaRbon PRiCinG (2018)
Rossi Doria 4/21.qxp_Layout 1 28/10/21 10:53 Pagina 52

3. dECArbOnizATiOn PATh And CArbOn PriCinG
53
Source: Author’s own elaboration of IEA data (2020)
FiGURe 3.10CaRbon inTenSiTY oF eneRGY anD eneRGY inTenSiTY oF GDP (1990, 2018)
Rossi Doria 4/21.qxp_Layout 1 28/10/21 10:53 Pagina 53


55
PART FOURFossil fuel subsidies
as stated in Part one, fossil fuel subsidies reduce the price of carbon,working as an implicit negative carbon pricing, and thus hindering the pathtowards energy transition. This chapter presents fossil fuel subsidy analysisand discusses the importance of carbon pricing in reducing emissions evenin a scenario in which fossil fuel subsidies are removed.
Main findings:Subsidies remain a significant cause of the low cost of fossil fuels.•according to a joint estimate by the oeCD and the iea, fossil fuelsubsidies amounted to $ 467.7 billion in 2019. both the gradual removalof fossil fuel subsidies and carbon pricing contribute to the sameobjective of encouraging the use of less polluting forms of energy.From a global perspective, removing fossil fuel subsidies alone would•reduce Co2 emissions by less than what countries have committed toin their nDCs. Therefore, removing fossil fuel subsidies is necessary,but not sufficient, to reduce GhG emissions as required by the Parisagreement. internalizing the cost of the negative externalities of fossilfuels in their price is key to reducing the carbon intensity of globaleconomies.
4.1 Global fossil fuel subsidies – estimatesThere is a lack of an established definition for “subsidy”, which makes
the assessment of public support and cross-country comparisons difficult.among international organizations, the oeCD, the iea, and the iMF havecollected data on fossil fuel subsidies systematically, but with differentmethodologies (european Union, 2017) and different country coverage.
as a result, subsidies estimates among these organizations usually differsignificantly. This is due mainly to the exclusion or inclusion of the negativeexternalities in the computation of subsidy levels. The iMF calculates post-tax subsidies that include externalities and pre-tax subsidies that do notinclude them. Diversely, the oeCD and iea do not include externalitiesin their computation.
The gap between estimates is so deep that, if externalities are excludedcoal would prove to be the least subsidized fuel product (as the oeCD-
Rossi Doria 4/21.qxp_Layout 1 28/10/21 10:53 Pagina 55
LEVELLinG GLObAL CArbOn PriCinG.A PrOPOSAL FOr An inCLuSiVE, SuSTAinAbLE EnErGy And CLimATE rOAdmAP
56
iea estimates show), while if externalities are included it would prove tobe the most subsidized fuel (as shown by the iMF post-tax methodology).For this reason, the various methodologies accounting for fossil fuelsubsidies must be taken into consideration to provide a broaderunderstanding of the current situation. The current paragraph specificallyaddresses this issue.
Fossil fuel subsidies level according to oeCD-iea and the “iMF pre-tax” methodologyThe oeCD and the iea produced a joint estimation of fossil fuel
subsidies worldwide. They reconciled their estimates, worked throughoverlaps and discrepancies providing aggregated fossil fuel support datafor 81 countries21 from 2010 to 2019 by energy product, presented inFigure 4.1 (oeCD, 2021a). in 2019, fossil fuels support measuresamounted to $ 467.7 billion; in 2017, the total amount was $ 482.3 billion.in 2016 it was $ 458 billion, and in 2012 it was $ 733 billion.
21 The oeCD uses the term “support measures for fossil fuels” in its analysis. We use“fossil fuel support”, “support measures” and “subsidies” interchangeably. Countries cov-ered in Figure 4.1 include oeCD countries (australia, austria, belgium, Canada, Chile,Colombia, Czech Republic, Germany, Denmark, Spain, estonia, Finland, France, Greece,hungary, ireland, iceland, israel, italy, Japan, Korea, latvia, lithuania, luxembourg, Mex-ico, netherlands, norway, new zealand, Poland, Portugal, Slovak Republic, Slovenia,Sweden, Switzerland, Turkey, United Kingdom, United States); oeCD partner economiesand countries covered by the iea: angola, argentina, armenia, azerbaijan, algeria,bangladesh, bahrain, belarus, bolivia, brunei Darussalam, brazil, Chinese Taipei, ecuador,egypt, el Salvador, Gabon, Georgia, Ghana, indonesia, india, islamic Republic of iran,iraq, Kazakhstan, Kuwait, libya, Malaysia, Moldova, nigeria, oman, Pakistan, People’sRepublic of China, Qatar, Russian Federation, Saudi arabia, South africa, Sri lanka,Thailand, Turkmenistan, Trinidad and Tobago, Ukraine, United arab emirates, Uzbek-istan, venezuela, vietnam.
Rossi Doria 4/21.qxp_Layout 1 28/10/21 10:53 Pagina 56

4. FOSSiL FuEL SubSidiES
57
Source: OECD (2021a)
Coal subsidies remained almost constant in the period observed andrepresented 4% or less of the total amount. Conversely, support measuresfor petroleum represented the highest share, from 60% (2014) to 49%(2017) of total subsidies (50% in 2019).
oil subsidies have historically followed the level of oil prices, althoughpart of the decrease in subsidies could also be a sign of subsidies reform(Jewell et al., 2018). The changes in the value of support measures forpetroleum have driven the overall shift in subsidy values.
The electricity subsidies represented between 16% and 21% of the total(20% in 2019). Those for natural gas represented between 19% and 31%of the total (28% in 2019).
according to the oeCD/iea estimation, coal is the least subsidizedfuel. however, the following paragraph will show how, instead, coal couldbe the most subsidized fuel, if subsidies covered environmental and otherexternalities.
Data in Figure 4.1 align oeCD and iea methodologies. The oeCDconsiders as “support measures for fossil fuels” the direct budgetarytransfers and tax expenditures that confer a benefit or preference for fossil-fuel production or consumption relative to alternatives (oeCD, 2018a).The iea compares the end-use prices paid by fuel consumers withinternational reference prices (i.e., prices that would prevail in a competitive
FiGURe 4.1FoSSil FUel SUPPoRT bY eneRGY PRoDUCT FRoM 2010 To 2019 FoR 81 CoUnTRieS
(oeCD-iea CoMbineD eSTiMaTeS, 2019 $ billion)
Rossi Doria 4/21.qxp_Layout 1 28/10/21 10:53 Pagina 57

LEVELLinG GLObAL CArbOn PriCinG.A PrOPOSAL FOr An inCLuSiVE, SuSTAinAbLE EnErGy And CLimATE rOAdmAP
58
market). The difference between the consumer price and the referenceprice is the price gap, and subsidy removal would equal its elimination (iea,2021)22.
one of the methodologies used by the iMF estimates the amount ofpre-tax subsidies, calculated as the difference between the amount consu-mers actually pay for fuel use and the corresponding opportunity cost ofsupplying the fuel (iMF, 2019). according to the iMF’s estimates for191 countries, pre-tax subsidies composed $ 296 billion of total globalsubsidies in 2017, while they were $ 269 billion in 2016 and $ 572 billionin 2012 (iMF, 2019).
Fossil fuel subsidies level when externalities are consideredThe iMF uses a second definition of subsidy, the “post-tax subsidy”,
for which the calculation methodology is remarkably different from thoseof the oeCD and the iea in estimating fossil fuel subsidies. This secondmethodology, in fact, includes the environmental externalities produced byfossil fuels in its subsidy calculations. Results from this methodology areimportant because, as methodology differs greatly, findings will also differgreatly, and can provide a broader understanding of subsidy size.
The iMF computes the subsidies as a “price-gap” between actual fossilfuel prices and a reference price, which includes the fossil fuel supply cost,environmental externalities, and consumption taxes as applied to otherconsumption goods in general23 (iMF, 2019).
22 on the one hand, the iea estimates paint a clear picture of “the magnitude of policiesthat reduce domestic fuel prices, hence subsidizing their consumption.” (oeCD, 2018:20).on the other hand, iea data do not necessarily capture policies that support fossil fuels’production without directly affecting end-user prices; or policies that also confer benefitsto consumers, such as direct budgetary transfers to consumers or reduced excise taxes”(oeCD, 2018:21). Those measures are captured by oeCD inventory. Combining the two datasets provides a single estimate of the magnitude of support forfossil fuels for both production and consumption. however, because iea data do notcapture support for producers of fossil fuels, the combined database would still be missinginformation on producer support for countries not covered by the oeCD inventory.(oeCD, 2018) i.e., total final estimates and estimates for countries covered only by ieadata may be lower than actual subsidy values.23 The iMF compared actual and reference prices for 191 countries in 2015, for coal andnatural gas use in power generation, gasoline, and road diesel. The difference between ac-
Rossi Doria 4/21.qxp_Layout 1 28/10/21 10:53 Pagina 58
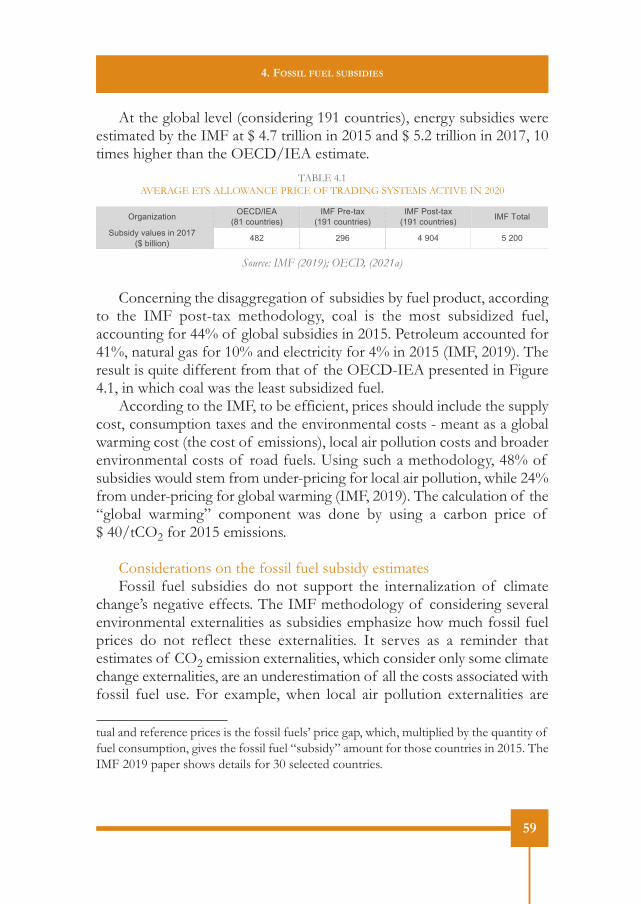
4. FOSSiL FuEL SubSidiES
59
at the global level (considering 191 countries), energy subsidies wereestimated by the iMF at $ 4.7 trillion in 2015 and $ 5.2 trillion in 2017, 10times higher than the oeCD/iea estimate.
Source: IMF (2019); OECD, (2021a)
Concerning the disaggregation of subsidies by fuel product, accordingto the iMF post-tax methodology, coal is the most subsidized fuel,accounting for 44% of global subsidies in 2015. Petroleum accounted for41%, natural gas for 10% and electricity for 4% in 2015 (iMF, 2019). Theresult is quite different from that of the oeCD-iea presented in Figure4.1, in which coal was the least subsidized fuel.
according to the iMF, to be efficient, prices should include the supplycost, consumption taxes and the environmental costs - meant as a globalwarming cost (the cost of emissions), local air pollution costs and broaderenvironmental costs of road fuels. Using such a methodology, 48% ofsubsidies would stem from under-pricing for local air pollution, while 24%from under-pricing for global warming (iMF, 2019). The calculation of the“global warming” component was done by using a carbon price of$ 40/tCo2 for 2015 emissions.
Considerations on the fossil fuel subsidy estimatesFossil fuel subsidies do not support the internalization of climate
change’s negative effects. The iMF methodology of considering severalenvironmental externalities as subsidies emphasize how much fossil fuelprices do not reflect these externalities. it serves as a reminder thatestimates of Co2 emission externalities, which consider only some climatechange externalities, are an underestimation of all the costs associated withfossil fuel use. For example, when local air pollution externalities are
tual and reference prices is the fossil fuels’ price gap, which, multiplied by the quantity offuel consumption, gives the fossil fuel “subsidy” amount for those countries in 2015. TheiMF 2019 paper shows details for 30 selected countries.
Table 4.1 aveRaGe eTS alloWanCe PRiCe oF TRaDinG SYSTeMS aCTive in 2020
Organization OECD/IEA (81 countries)
IMF Pre-tax (191 countries)
IMF Post-tax (191 countries) IMF Total
Subsidy values in 2017 ($ billion) 482 296 4 904 5 200
Rossi Doria 4/21.qxp_Layout 1 28/10/21 10:53 Pagina 59

LEVELLinG GLObAL CArbOn PriCinG.A PrOPOSAL FOr An inCLuSiVE, SuSTAinAbLE EnErGy And CLimATE rOAdmAP
60
considered – as in the iMF post-tax subsidies methodology – coal is themost subsidized fuel, while without considering these externalities – as inthe oeCD-iea methodology – it is the least subsidized.
however, the oeCD and iea approach to subsidies (understood asgovernment support for the consumption or production of fossil fuelsthat lowers their prices below normal market prices) is more consolidated.it can draw information from databases of multiple years and,consequently, is more widely used. For these characteristics, we will followthis approach, but also take into account the iMF’s results as a reminderthat fossil fuel externalities and cost go beyond climate change.
4.2 Fossil fuel subsidies across countriesRegarding disaggregated subsidy data by country, the most extensive
coverage completed by the oeCD is from 2015. The data covers76 economies (oeCD Stats, 2019), responsible for 93% of globalemissions from fossil fuel combustion (authors’ computation based on databy iea, 2020).
FiGURe 4.2 ConTRibUTion (%) oF SeleCTeD eConoMieS To The ToTal valUe
oF FoSSil FUel SUbSiDieS in 7624 CoUnTRieS in 2015 ($ 467 billion)
Source: Authors’ own elaboration of data from OECD Stats (2019)
24 Countries covered in Figure 4.2: eU 27-oeCD group are countries which belong both to oeCD and eU 27, covered by
Rossi Doria 4/21.qxp_Layout 1 28/10/21 10:53 Pagina 60

4. FOSSiL FuEL SubSidiES
61
Figure 4.2 shows the contribution of selected economies to the totalfossil fuel subsidies value reached by 76 countries in 2015. The countriesor group of countries pictured in Figure 4.2 were those that represented5% or more of total subsidies in 2015. Together, 7 economies added up to56% of world subsidies in 2015.
From the economies in the “Rest of countries” category, brazil,indonesia and venezuela reached 4% of total subsidies each; algeria,egypt and italy reached 3%; Mexico, the United Kingdom, the UnitedStates and the United arab emirates reached 2% of total subsidies. othercountries remained below 2%.
the dataset: austria, belgium, Czech Republic, Denmark, estonia, Finland, France, Ger-many, Greece, hungary, ireland, italy, latvia, luxembourg, netherlands, Poland, Portugal,Slovak Republic, Slovenia, Spain, Sweden. other oeCD countries: australia, Canada, Chile, Colombia, iceland, israel, Japan, Korea,Mexico, norway, new zealand, Switzerland, Turkey, United Kingdom, United States. non oeCD countries: algeria, angola, argentina, azerbaijan, bahrain, bangladesh, bo-livia, brazil, brunei Darussalam, China, ecuador, egypt, el Salvador, Gabon, Ghana,india, indonesia, iran, iraq, Kazakhstan, Kuwait, libya, Malaysia, nigeria, oman, Pakistan,Qatar, Russia, Saudi arabia, South africa, Sri lanka, Chinese Taipei, Thailand, Trinidadand Tobago, Turkmenistan, Ukraine, United arab emirates, Uzbekistan, venezuela, viet-nam.
Rossi Doria 4/21.qxp_Layout 1 28/10/21 10:53 Pagina 61

LEVELLinG GLObAL CArbOn PriCinG.A PrOPOSAL FOr An inCLuSiVE, SuSTAinAbLE EnErGy And CLimATE rOAdmAP
62
Fossil fuel subsidies compared with emissions from fossil fuel combustion
Dots along country lines represent different years from 2008 to 2015. UE27-OECD emissionsand subsidies represent the sum of the 21 UE27-OECD countries, as listed in note 24.
Source: Authors’ own elaboration of subsidies data from OECD Stats (2019) and emission data from IEA(2020)
Figure 4.3 compares the amount of fossil fuel subsidies in selectedcountries with their respective emissions from fossil fuel combustion. Thegraph shows that some of the countries with higher subsidy levels (iran,Saudi arabia, argentina) emit at relatively lower levels than the top emitters(China, the US, oeCD-europe). Thus, removing their subsidies may havea diminished effect at the global level on emissions reduction. China is an
FiGURe 4.3FoSSil FUel SUbSiDieS anD Co2 eMiSSionS FRoM FoSSil FUel CoMbUSTion
FoR SeleCTeD CoUnTRieS (2008-2015)
Rossi Doria 4/21.qxp_Layout 1 28/10/21 10:53 Pagina 62

4. FOSSiL FuEL SubSidiES
63
exception, since it is both a large subsidizer and a large emitter. india andRussia are also interesting, since their subsidy levels are similar to those ofiran and Saudi arabia in certain years, but with the difference that indiaand Russia emit more.
effects of fossil fuel subsidies removal on reducing emissions indifferent regionsindeed, removing fossil fuel subsidies would have different effects on
reducing emissions depending on the region taken in consideration.Subsidies removal results in higher emission reduction in high-subsidizing,high-income, oil and gas exporting regions (Middle east & north africa;latin america; Russia & former Soviet Union countries). in other regions,phasing out fossil fuel subsidies would not be enough to reach thenationally Determined Contributions (nDCs) (Jewell et al., 201825).
low oil prices (as in 2015) provide “a unique political opportunity toremove subsidies precisely where it would have the largest effect onemissions and affect a comparatively small number of people living below$ 3.10 per day”, because “low oil prices pressure energy-exporting statesto reduce spending as government revenues shrink” (Jewell et al.2018:232).
25 Jewell et al. (2018) considered in their paper the iea and oeCD definition of fossilfuel subsidies as «government support of the consumption or production of oil, gas orcoal that lowers their prices below normal market prices» (p. 229). They compiled subsidydata from these organizations plus data from the Deutsche Gesellschaft fu�r internationalezusammenarbeit (Giz). The authors “used five integrated assessment Models (iaMs)to evaluate the global and regional effects of removing fossil fuel subsidies on emissions,the energy mix and energy demand under both low and high oil prices” (Jewell et al., 2018:229). The period evaluated by the study was from 2020 to 2050. The authors also foundthat “removing fossil fuel subsidies would lower global energy demand. The decrease inenergy demand is caused by increasing energy prices and ranges between 5 eJ and 26 eJper year or 1%-4% in 2030. Under high oil prices, the decrease in demand is larger, reach-ing up to 30 eJ per year or 7% in 2030” (:232). Regarding the emissions reduction, thepaper states that “subsidy removal would lead to a small decrease in global Co2 emissions:0.5-2 gigatons of carbon dioxide (Gt Co2) or 1%-4% by 2030 under both low and highoil prices” (:231).
Rossi Doria 4/21.qxp_Layout 1 28/10/21 10:53 Pagina 63

LEVELLinG GLObAL CArbOn PriCinG.A PrOPOSAL FOr An inCLuSiVE, SuSTAinAbLE EnErGy And CLimATE rOAdmAP
64
Comparison of emissions and emissions per capita across countriesFigures 4.4, 4.5 and 4.6 provide a comparison between absolute
emissions from fuel combustion of selected countries, their globalemissions share and their emissions per capita.
oil-exporting and high-subsidizer countries in the Middle east reachconsiderably high emissions per capita levels in comparison with largeremitters pictured in Figure 4.3, such as the U.S. and China.
*OECD Europe includes: Austria, Belgium, Czech Republic, Denmark, Estonia, Finland, France,Germany, Greece, Hungary, Iceland, Ireland, Italy, Latvia, Lithuania, Luxembourg, Netherlands,Norway, Poland, Portugal, Slovak Republic, Slovenia, Spain, Sweden, Switzerland, Turkey, UnitedKingdom.
Source: Authors’ own elaboration of IEA (2020) data
FiGURe 4.4Co2 eMiSSionS FRoM FUel CoMbUSTion FoR SeleCTeD CoUnTRieS, 2018
(Million tCo2)*
Rossi Doria 4/21.qxp_Layout 1 28/10/21 10:53 Pagina 64

4. FOSSiL FuEL SubSidiES
65
Source: Authors’ own elaboration of IEA (2020) data
Source: Authors’ own elaboration of IEA (2020) data
*OECD Europe includes: Austria, Belgium, Czech Republic, Denmark, Estonia, Finland, France,Germany, Greece, Hungary, Iceland, Ireland, Italy, Latvia, Lithuania, Luxembourg, Netherlands,Norway, Poland, Portugal, Slovak Republic, Slovenia, Spain, Sweden, Switzerland, Turkey, UnitedKingdom.
FiGURe 4.5Global ShaRe oF Co2 eMiSSionS FRoM FUel CoMbUSTion
FoR SeleCTeD CoUnTRieS, 2018 (%)*
FiGURe 4.6PeR CaPiTa Co2 eMiSSionS
FoR SeleCTeD CoUnTRieS in 2018 (tCo2/CaPiTa)*
Rossi Doria 4/21.qxp_Layout 1 28/10/21 10:54 Pagina 65

LEVELLinG GLObAL CArbOn PriCinG.A PrOPOSAL FOr An inCLuSiVE, SuSTAinAbLE EnErGy And CLimATE rOAdmAP
66
4.3 Global fossil fuel subsidies phase-out and emissions reductionFrom a global perspective, removing fossil fuel subsidies alone would
lead to a smaller decrease in global Co2 emissions compared to the sumof nDCs. More specifically, subsidy removal would lead to a decrease inglobal Co2 emissions of 0.5-2 Gt Co2 by 2030, under both low and highoil prices. The nDCs from the Paris agreement add up to a decrease of4-8 Gt Co2 from fossil fuels and industry (Jewell et al., 2018).
This result must be contextualized in the study on the effects of subsidyremoval only. To reach more ambitious emission results, subsidy removalwould need to be accompanied by other policies.
Removing fossil fuel subsidies supports higher carbon price signals.however, by itself, it is not sufficient to decrease GhG emissions asrequired by the Paris agreement. internalizing the cost of fossil fuelsexternalities in their price, as mentioned in Part one of this document, isimportant to reduce the carbon intensity of the economy.
in addition, subsidy removal could disproportionately harm the poorin some countries. in this sense, subsidy removal in low-income regionswould lead to smaller emission reductions and probably affect more peopleliving below the poverty line. To avoid or reduce the impact of high oilprices on poor households, specific policies with this aim are necessary(Jewell et al., 2018). The rise of fossil fuel prices should be accompaniedby measures to compensate low-income households for the resulting higherenergy prices and to support workers who might lose their jobs in energy-intensive industries (Parry, 2018).
Conversely, removing fossil fuel subsidies result in higher revenues that,together with the revenues resulting from carbon pricing, can enhanceinvestment and access to sustainable energy. both fossil fuel subsidiesremoval and carbon pricing contribute to the same objective ofencouraging the use of less polluting forms of energy.
Rossi Doria 4/21.qxp_Layout 1 28/10/21 10:54 Pagina 66

67
PArT FiVE
A proposal: Global Carbon Pricing and the Fair Transition Fund
Part five contains proposals concerning the contributions to a Global FairTransition Fund and the distribution of the Fund resources to supportaffordable access and investment in clean energy in developing countries,mitigation and adaptation policies as specified in SDG 7.
Main proposals are the following:Part of the revenues from global carbon pricing could feed a global•and inclusive Fair Transition Fund that would be expected to respondto redistribution policies towards developing countries. The Fundresources should be used to finance an inclusive transition, to increasesustainable investment and support policies closely related to theachievement of SDG 7, e.g. through the promotion of universal accessto modern energy, including energy for clean cooking, the increase ofthe share of renewable energy in the energy mix and the improvementin energy efficiency.both the contributions to the Fund and the distribution of its resources•would depend on equity, efficiency and sustainability criteria. Theyshould promote carbon neutrality and consider the socio-economicdevelopment of countries and their improvements in energy efficiency.To benefit from existing structures and expertise, the fund could be•part of the Financial Mechanism of the UnFCCC, for exampleintegrating the Green Climate Fund. Results monitoring could alsobenefit from the expertise of iRena.
5.1 Carbon pricing revenues feeding a Fair Transition Fund (FTF)a share of the revenues from carbon pricing would remain at the
country level, while a flexible share could be directed to the Fair TransitionFund (FTF). This share would be calculated according to specific countries’characteristics and parameters.
The contributions to the Fund would depend on the domestic productof a given country, on the results of its efforts towards decarbonizationand would also consider its historical contributions to global climate-changeemissions.
Rossi Doria 4/21.qxp_Layout 1 28/10/21 10:54 Pagina 67

LEVELLinG GLObAL CArbOn PriCinG.A PrOPOSAL FOr An inCLuSiVE, SuSTAinAbLE EnErGy And CLimATE rOAdmAP
68
The rationale behind the proposal is that the share of carbon pricingrevenues to be periodically assigned to the Fund could be proportional to:– the countries’ GdP (addressing the financial gap in developingcountries);– countries’ progress in carbon intensity of GdP, thus rewardingcountries that are making efforts on the path toward decarbonization (asshown in Figures 3.5, 3.6 and 3.7 in Part Three);– countries’ historical contribution to the overall stock of CO2
26 inthe atmosphere from pre-industrial times.
For each country at period “t”, the amount of revenues to be given tothe Fair Transition Fund (FTF) could be calculated by using the followingEquATiOn 1:
(EquATiOn 1)
where:
is the Revenue from Carbon Pricing of Country “i”;is the carbon intensity of GDP of Country “i”;is the historical carbon responsibility of Country “i”;
< 1 is a fixed amount of carbon pricing revenues of Country“i” to be devoted to the Fund;is the contribution proportional to Country “i” GDP;is the reduction of the contribution due to progress in de-creasing carbon intensity of GPD of Country “i”;is the contribution proportional to Country “i” historicalcarbon responsibility.
Detailing equation 1:
26 Similarly, the historical contribution of emissions of all Greenhouse Gases (GhG)could be considered rather than just carbon dioxide (Co2).
!"!!"#$%&'! ! !"#! ! !! ! ! !"#! ! ! ! !"! ! ! ! !"!!"! !
!!!"!!!"#$%&'! !! !"#! ! !!! ! !!! ! !"#!!"#!"# !!! !!! ! !"!!!!!"# !!!!!!!!! !"!!!!!"# !!!!!!!"!!!!!"# !!!!!!!! ! ! ! !! ! ! !! ! ! ! !! !! !! ! ! !!! ! ! !!!! ! !!! !! !!! !"!!!"#$$#%&$!!!"!!!"#$$#%&$!"# !!!! ! !
!"#! !!"! !!"!!"! !! !! !! ! !! !
Rossi Doria 4/21.qxp_Layout 1 28/10/21 10:54 Pagina 68

5. A PrOPOSAL: GLObAL CArbOn PriCinG And ThE FAir TrAnSiTiOn Fund
69
where:
“Contribution to the Fair Transition Fund” is the amount of revenues to be assigned to the Fund by country “i”;
“Revenues from Carbon Pricing” is the amount of revenues levied from total Carbon Pricing in country “i”; is the GDP of Country “i”; is the World GDP;
is the carbon intensity of GDP of Country “i” at previous period (t-1);
is the carbon intensity of GDP of Country “i” at current period (t);
is the country “i” contribution to Co2 emissions in the atmosphere in a certain period of time t-t0;
is the total quantity of Co2 released in atmosphere by all countries in the same period t-t0;
, , and are factors to balance each of the addenda (“ ” must be ≤ “ ” → the overall
factor in brackets {...} are ≤ 1; in particular < 1).
hence, the total amount for the Fund is simply given by:
Countries that have lower emissions intensity of GDP in the currentperiod with respect to the previous one will lower the quota to deliver tothe Fund by a factor of . , thus obtaining a rewardfor their efforts.
Parameters , , and are set in such a way that the share of reve-nues going to the fund is below the total revenue from carbon pricing inthe country: accordingly, while feeding the Fund, a share of the totalrevenues shall remain inside the country.
Some developing countries would be exempt from transfer to the Fundsince, given their characteristics, they would be eligible to receive a higheramount than the one they would transfer to the Fund.
!!!"!!!"#$%&'! ! ! ! !! !! !! ! ! !!! ! ! !!!! ! !!! ! ! ! !! ! ! !! ! !"#! ! ! !! !! !! ! ! !!! ! ! !!!! ! !!! ! ! ! !! ! ! !! ! ! ! !! !"#! !! !! ! ! !!! ! ! !!!! ! !!! ! ! ! !! ! ! !! ! ! ! !! !"#!"# !! !! ! ! !!! ! ! !!!! ! !!! ! ! ! !! ! ! !! ! ! ! !! !! !! ! ! !!! ! ! !!!!"!!!!!"# !!!!!!!! ! ! ! !! ! ! !! ! ! ! !! !! !! ! ! !!! ! ! !!!!"!!!!!"# !!!!!! ! ! ! !! ! ! !! ! ! ! !! !! !! ! ! !!! ! ! !!!! ! !!! ! ! ! !"!!!"#$$#%&$!! ! ! !! ! ! ! !! !! !! ! ! !!! ! ! !!!! ! !!! ! ! ! !!!"!!!"#$$#%&$!"# ! !! ! ! ! !! !! !! ! ! !!! ! ! !!!! ! !!! ! !!! !! ! ! !! ! !!! !! !! !! ! ! !!! ! ! !!!! ! !!! ! ! ! !! ! ! !! ! ! ! !!! !! !! ! ! !!! ! ! !!!! ! !!! ! ! ! !! ! ! !! ! ! ! !! !! !!! ! ! !!! ! ! !!!! ! !!! ! ! ! !! ! ! !!!!"!!!"#$%&'! ! ! ! !! !! !! ! ! !!! ! ! !!!! ! !!! ! ! ! !! ! ! !! ! !"#! ! ! !! !! !! ! ! !!! ! ! !!!! ! !!! ! ! ! !! ! ! !! ! !!! !! !! !! ! ! !!! ! ! !!!! ! !!! ! ! ! !! ! ! !
!!!"!!!"!#$ ! !!!"!!!"#$%&'!! !!"!!!!!"# !!!!!!!! ! !"!!!!!"# !!!!!!!"!!!!!"# !!!!!!!! !! ! ! ! !! !! !!! ! ! !!! ! ! !!!! ! !!! ! ! ! !! ! ! !! ! ! ! !! !! !! ! ! !!! ! ! !!!! ! !!! ! !!! !! ! ! !! ! !!! !! !! !! ! ! !!! ! ! !!!! ! !!! ! ! ! !! ! ! !! ! ! ! !!! !! !! ! ! !!! ! ! !!!! ! !!! ! ! ! !! ! ! !! ! ! ! !! !! !!! ! ! !!! ! ! !!!! ! !!! ! ! ! !! ! ! !
Rossi Doria 4/21.qxp_Layout 1 28/10/21 10:54 Pagina 69
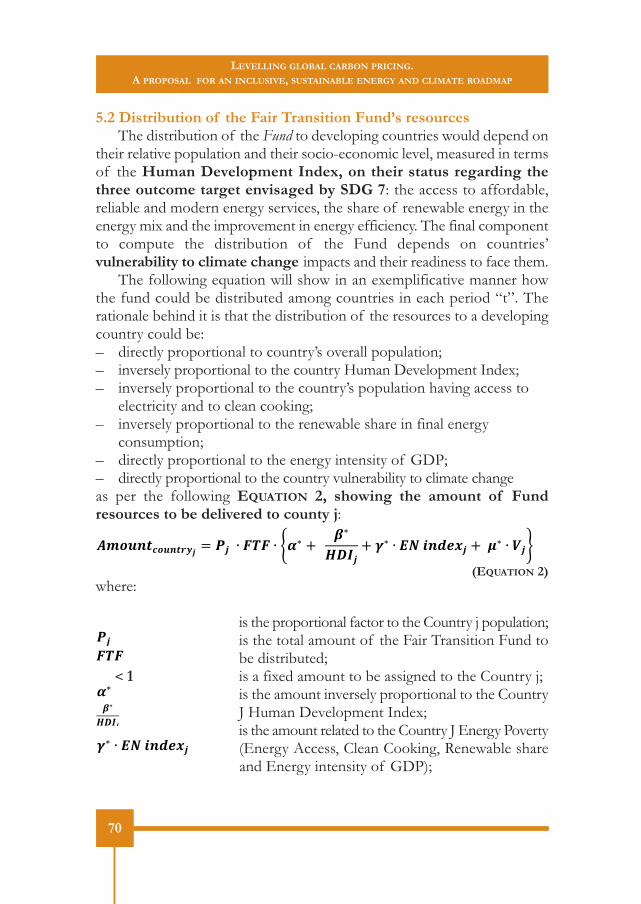
LEVELLinG GLObAL CArbOn PriCinG.A PrOPOSAL FOr An inCLuSiVE, SuSTAinAbLE EnErGy And CLimATE rOAdmAP
70
5.2 distribution of the Fair Transition Fund’s resourcesThe distribution of the Fund to developing countries would depend on
their relative population and their socio-economic level, measured in termsof the human development index, on their status regarding thethree outcome target envisaged by SdG 7: the access to affordable,reliable and modern energy services, the share of renewable energy in theenergy mix and the improvement in energy efficiency. The final componentto compute the distribution of the Fund depends on countries’vulnerability to climate change impacts and their readiness to face them.
The following equation will show in an exemplificative manner howthe fund could be distributed among countries in each period “t”. Therationale behind it is that the distribution of the resources to a developingcountry could be:– directly proportional to country’s overall population; – inversely proportional to the country human Development index;– inversely proportional to the country’s population having access to electricity and to clean cooking;– inversely proportional to the renewable share in final energy consumption;– directly proportional to the energy intensity of GDP;– directly proportional to the country vulnerability to climate changeas per the following EquATiOn 2, showing the amount of Fundresources to be delivered to county j:
(EquATiOn 2)where:
is the proportional factor to the Country j population; is the total amount of the Fair Transition Fund to
be distributed;< 1 is a fixed amount to be assigned to the Country j;
is the amount inversely proportional to the Country J human Development index;
is the amount related to the Country J energy Poverty (energy access, Clean Cooking, Renewable share and energy intensity of GDP);
!"#$%&!"#$%&'! ! !!! ! !"! ! !! ! ! !!!"#! ! !! ! !"!!"#$%! ! !!! ! !! !!!! ! ! ! !! !"! ! ! ! !! !! ! ! ! !
! ! !! ! !"!!"#$%! ! ! !! ! !!!"#! ! ! !
Rossi Doria 4/21.qxp_Layout 1 28/10/21 10:54 Pagina 70

5. A PrOPOSAL: GLObAL CArbOn PriCinG And ThE FAir TrAnSiTiOn Fund
71
is the amount related to the country “j” clima vul- nerability.
Detailing equation 2:
where:
“Distribution of the Fair Transition Fund” is the amount to be given by the Fund to emerging or developing country “j”; is the population in emerging or developing country “j”; is the total population of all the “j” emerging or deve-
loping countries; is the latest “Human Development Index”27 value for country “j”; “Electricity Access”28 is the proportion of the population with access to electricity in country “j”29; “Clean Cooking”26 is the proportion of the population with access to clean cooking in country “j”30; “Renewable Energy Share”31 is the renewable share in total
27 The human Development index was developed by the United nation DevelopmentProgramme, and encompasses health, education and income indicators. indicators canbe found at the following link: <http://hdr.undp.org/en/content/human-development-index-hdi>.28 among the indicators of SDG 7, there are: (i) Proportion of population with access toelectricity (ii); Proportion of population with primary reliance on clean fuels and tech-nology; (iii) Renewable energy share in the total final energy consumption; (iv) energyintensity measured in terms of primary energy and GDP.29 iea, World bank database.30 Data from World health organization.31 iea database.
! ! ! !!! ! !! !!!!"!!!"#$%&'! ! !"#!!!"!! ! !!!"!!!"!#$!""
! !! ! !!!"#! ! !!! ! ! !!!!"! ! ! !!!!!!! ! !!! ! ! !!!!"#! ! !!! !"!!"#!!"!!"#!"# !!!! !""!"#$%&'! !
!!!"!!!"#$%&'! ! ""
! !"#! ! ""! !!"!! ! ""
!"#! ! ! ! !!!!"! ! ! !! !!!!! ! !! ! !!!"#! !
Rossi Doria 4/21.qxp_Layout 1 28/10/21 10:54 Pagina 71

LEVELLinG GLObAL CArbOn PriCinG.A PrOPOSAL FOr An inCLuSiVE, SuSTAinAbLE EnErGy And CLimATE rOAdmAP
72
final energy consumption (SDG 7.2) in country “j”; energy intensity of GDP of country “j”; World energy intensity of GDP; “Vulnerability and Readiness Index”32 is a vulnerability/rea- diness for climate change factor of country “j”33; among countries (with < 1); is the factor balancing the residuals amounts in order to guarantee that
5.3 Carbon pricing revenues supporting a fair energy transitionRevenues from carbon pricing can be used differently, irrespective of
the origin of the revenues – whether they come from a national carbonpricing or from the proposed international climate fund. For example, theycan be used to enhance programs, reforms, investment plans, activities thatcontribute to certain environmental and social objectives.
Carbon pricing revenues supporting the energy transition and climate change adaptation and mitigation
in order to be entitled to spend the share assigned to them by the fund,countries would have to submit investment plans, projects and reformsthat will have to comply with specific criteria. The fund will financeenvironmentally sustainable economic activities that: provide a substantialcontribution to at least one of the environmental objectives; do not causesignificant harm to any of the other environmental objectives; comply with
32 The nD-Gain Country index uses 45 indicators to annually rank 181 countries ac-cording to two key dimensions of adaptation to climate change: vulnerability and readi-ness. The higher the ranking, the better. The vulnerability component measures countries’vulnerability considering six life-supporting sectors: food, water, health, ecosystem service,human habitat, and infrastructure. The readiness component measures a country’s abilityto leverage investments and convert them to adaptation actions. The 45 indicators to cal-culate countries’ vulnerability and readiness can be found at the following link:<https://gain.nd.edu/our-work/country-index/methodology/indicators/>.33 UnFCCC refers to the nD-Gain index – University of notre Dame Global adap-tation index, where values are ranging between 0 and 100, where 100 is the best valueand 0 is the worst.
! ! ! !"!!"#! !! ! ! !"!!"#!"# ! !! ! !
!"#$%&'! !! ! ! !!!!! ! ! ! !!! ! ! ! !!!! ! ! ! !
! ! !!! !
,, and are factors to reach the fairest distribution of the fund!! ! ! ! !!!!"!!!"#$%&'! ! ""! !!!"!!!"!#$!""! ! ! ""! ! ! ""
Rossi Doria 4/21.qxp_Layout 1 28/10/21 10:54 Pagina 72

5. A PrOPOSAL: GLObAL CArbOn PriCinG And ThE FAir TrAnSiTiOn Fund
73
robust and science-based technical screening criteria and with minimumsocial and governance safeguards.
Specifically, the environmental objectives could be: climate changemitigation, climate change adaptation, sustainable use and protection ofwater and marine resources, transition to a circular economy, pollutionprevention and control, protection and restoration of biodiversity andecosystem.
For these reasons, the Fair Transition Fund would only finance:activities that in and of themselves contribute substantially to one of theenvironmental objectives; transitional activities where there are notechnologically and economically feasible low-carbon alternatives, but thatsupport the transition to a climate-neutral economy in a manner which isconsistent with Paris agreement’s goal, for example by phasing outgreenhouse gas emissions; fostering activities that enable other activitiesto make a substantial contribution to one or more of the objectives andwhere that activity does not cause a lock-in in assets that compromise long-term environmental goals and has a substantial positive environmentalimpact on the basis of lifecycle analysis34.
The Fair Transition Fund could be used to cover the still existing gap toensure universal access to affordable, reliable and modern energy for all by2030. The fund revenues could be a precious addition to the publicfinancial support needed, for example, to increase investment and accessto electricity and clean cooking and to support off-grid energy solutionsand renewable energy infrastructure in general.
in order to bridge the investment gap, revenues could also be orientedto attract private financing by de-risking investments in clean energy, e.g.,through tax policies and financial instruments (grants, loans, guarantees)on a project-by-project basis.
by 2030 both developed and developing countries need to invest in lowcarbon technologies. Revenues from the Fair Transition Fund could be spenton carbon pricing-complementary environmental policies; in fact, carbonpricing is just one of the instruments that governments can put in place toundertake a cost-effective transition to a low-carbon world. a broad policy
34 For the considerations on the environmental objectives and on the criteria on the in-vestments to be financed with the Fund, we have taken as an example the european UnionTaxonomy for sustainable activities regulation and subsequent acts.
Rossi Doria 4/21.qxp_Layout 1 28/10/21 10:54 Pagina 73

LEVELLinG GLObAL CArbOn PriCinG.A PrOPOSAL FOr An inCLuSiVE, SuSTAinAbLE EnErGy And CLimATE rOAdmAP
framework is needed, including a coherent, inter-related set of measures(bowen, 2015; Stern & Stiglitz, 2017), which requires financial support.investments are necessary to finance low-carbon R&D, to support thedeployment of renewable energy and improvements in energy efficiency.investment in R&D will be essential to speeding up clean energydeployment in sectors where electrification is not feasible or cost-effective,and where low-carbon technologies innovation is still at early-stageimplementation. iRena (2020) suggests, during the recovery phase (2021-2023), an investment in energy transition technologies of $ 2 trillion peryear, increased to $ 4.5 trillion for 2024-2030. investment in low-carbontechnologies will also serve the purpose of ensuring that these technologiesare absorbed into power systems. Regarding energy efficiency, expenditurein energy efficiency improvements is necessary to make reducedconsumption and rising energy demand compatible. The approach of usingglobal carbon price revenues to support complementary environmentalpolicies is shared, for example, by the eU, whose eTS Directive requires“that Member States should use at least 50% of auctioning revenues orthe equivalent in financial value for climate and energy-related purposes”(eU Commission).
economic impact of carbon pricing policies on households To support a just transition, in line with the principle of leaving no one
behind, carbon pricing effects on households must be considered. a variety of factors, often country-specific, influence the distributional
outcomes of carbon pricing policies (ohlendorf et al., 2021). The incomelevel of countries is one among them (ohlendorf et al., 2021; Dorband etal., 2019).
in lower-income countries, especially for very poor or unequal nations,the distributional impact of market-based policies that affect the price offossil fuels is more likely progressive than in wealthier countries for allmarket-based policies that influence the price of fossil fuels, e.g., carbontax, emission trading systems and excises taxes on fuels (ohlendorf et al.2021)35. Such results could be explained by «low carbon intensities of the
35 ohlendorf et al. (2021) conducted a meta-analysis of 53 empirical studies of carbonpricing distributional impacts in 39 countries, resulting in 183 effects in total (144 effectsfor high-income countries and 39 effects for low, lower-middle and upper-middle income
74
Rossi Doria 4/21.qxp_Layout 1 28/10/21 10:54 Pagina 74
5. A PrOPOSAL: GLObAL CArbOn PriCinG And ThE FAir TrAnSiTiOn Fund
consumption baskets of poor households in lower-income countries,resulting from a higher share of subsistence consumption, a low access tomodern energy services, or the lack of affordability of energy» (ohlendorfet al. 2021: 3).
Focusing on low – and middle – income countries, on average carbonpricing can be expected to display progressive effects in poorer countrieswhile having regressive effects in countries with per capita incomes ofabove roughly USD 15,000. The domestic distribution of carbon priceslargely depends on the relative direct energy consumption patterns of thepoor. Countries in which carbon pricing would be progressive exhibit lowerthan the national average energy expenditure shares among the pooresthouseholds. Due to the methodology applied, their results can be consi-dered short-term estimates of the impact of carbon prices on householdincome (Dorband et al. 2019)36.
in developed economies, on the other hand, more regressi-ve distributional impacts of carbon pricing policies are observed in theliterature (Dorband et al. 2019, Wang et al. 2016). For example, a carbontax without revenue recycling tends to be regressive, but to a rather weakextent (Wang et al. 2016). it can be explained by the more carbon-intensiveconsumption patterns of poorer households. low-income households indeveloped countries spend a larger share of income on energy goods, suchas electricity and gas for cooking and heating (bowen, 2015). in developedeconomies, lower-income households bear a higher carbon tax burden(Wang et al., 2016: 1127).
Furthermore, carbon pricing policies in the transport sector have ahighly increased likelihood of progressive outcomes compared toeconomy-wide carbon pricing policies. (ohlendorf et al. (2021). Still, this
countries). The authors highlighted the smaller number of studies concerning developingcountries in comparison to developed countries as a research limitation, although theoverall validity of the findings was confirmed by several robustness checks. The study didnot analyse the size of the distributive impact and recommend that country-specific con-text must guide policy formulation and implementation.36 Dorband et al. (2019) investigated the distributional impact of a either a globally uniformcarbon price or a domestic price in combination with border-tax adjustment for emissionsthat were generated to produce imports. They assumed the coexistence of this carbonprice with existing subsidies and tax regimes. The carbon price level considered was ofUSD 30/tCo2.
75
Rossi Doria 4/21.qxp_Layout 1 28/10/21 10:54 Pagina 75
LEVELLinG GLObAL CArbOn PriCinG.A PrOPOSAL FOr An inCLuSiVE, SuSTAinAbLE EnErGy And CLimATE rOAdmAP
result is sensitive to specific country characteristics. indeed, there areambiguous literature conclusions in this regard which mostly showprogressive but also regressive impacts of transport carbon pricing policiesin high-income countries.
For example, in developed countries, «when distinguishing betweendomestic energy (cooking, heating and lighting, etc.) and transport fuels,the carbon tax burdens attributable to domestic energy consumption tendto be regressive, whereas those to the transport fuels are weaklyprogressive» (Wang et al., 2016: 1127). Some oeCD countries «showprogressive effects of taxes on transport fuels, whereas others eitherexperience more proportional effects or tend to place the highest-burdenon middle expenditure deciles» (Wang et al. 2016: 1127).
because the economic impact of carbon pricing on householdsdepends on the carbon intensity of their consumption, it is important toconsider the effect of a particular carbon price level on the price of fossilfuels commercial units. in annex b, we describe the price adjustment forthe commercial unit of several fossil fuels at different carbon price levels,considering the fuel carbon content.
For example, a carbon price of $ 60/tCo2 corresponds to 16.18 $cent/liter of diesel fuel, 13.92 $ cent/liter of motor gasoline, 9.0 $cent/liter of liquefied Petroleum Gases and 7.07 $ cent/liter of liquefiednatural gas.
The possible progressive impact of carbon pricing in general and onthe transport sector contrasts with public perception. The public debateusually focuses on the distributional effect of consumer expenditures. atthe same time, it underestimates or ignores the usually progressive impactof revenue recycling schemes that can be associated with carbon pricingpolicies (ohlendorf et al., 2021).
Using carbon pricing revenues to mitigate the impact of carbon pricingpolicies on low-income households and citizenseven in countries where carbon pricing can have a progressive effect,
it increases consumer prices and causes loss of income for low-incomehouseholds. The poorest in middle-income economies suffer moresignificant impacts on income than those in lower-income countries.
it is fundamental to keep the electricity and clean cooking affordable.it could be done, for example, by using the revenues from carbon pricing
76
Rossi Doria 4/21.qxp_Layout 1 28/10/21 10:54 Pagina 76

5. A PrOPOSAL: GLObAL CArbOn PriCinG And ThE FAir TrAnSiTiOn Fund
to provide financial support to low-income households (ohlendorf et al.,2021; Dorband et al.2019; Stern & Stiglitz et al., 2017; Wang et al. 2016;bowen, 2015; oeCD et al., 2015; lee, 2011).
The negative distributional effects of carbon pricing can be fullyneutralized or even reversed (meaning that poorer households may evenbenefit from such policies) through lump-sum transfers, lower socialsecurity or other labour charges, or a reduction of value-added tax (vaT).beyond that, expenditures to offset the negative impacts of carbon pricingon low-income households are usually lower than the revenues raised bycarbon pricing (oeCD et al., 2015: 38).
in the case of a regressive distributional impact of carbon pricing,recycling part of the revenues can make the policy progressive.
Some countries have already integrated their carbon pricing schemeswith instruments to protect less wealthy families (bowen, 2015). amongthe various instruments that can be used, targeted cash transfer isconsidered as a valuable supplementary policy to carbon pricing. in britishColumbia, for example, the population was given a credit according to theirincome category. in 2010, the bottom decile received a credit of $ 122while paying $ 129 for the carbon tax, while the top decile paid $ 795 forthe carbon tax and received a credi of $ 45 (lee, 2011: 16-18).
beyond direct measures that balance the regressive impacts of carbonpricing, it is interesting to note that there are some additional benefitsderiving from the reduction of emissions that would benefit the poor in ahigher proportion: e.g. reduced particulate and local pollution, reducedtraffic congestion and increased energy efficiency (bowen, 2015:10).
To conclude, countries would contribute and receive from the FairTransition Fund according to the suggestions made with equations 1 and2 (see part 5.1).
in any case and as per factor α (a fixed amount of carbon pricingrevenues of country i to be devoted to the Fund) in the previous equation1, it has been provided that some countries contribute to the Fund whilekeeping a share of the revenues at their disposal, while some developingcountries only receive from the fund. irrespective of the origin of thefunds (the Fair Transition Fund or the single country’s revenues), a possibleuse would be to divide them into actions to support the environmentalobjectives mentioned previously and, if needed, the compensation ofcarbon pricing’s economic impacts on low-income households. Since the
77
Rossi Doria 4/21.qxp_Layout 1 28/10/21 10:54 Pagina 77

LEVELLinG GLObAL CArbOn PriCinG.A PrOPOSAL FOr An inCLuSiVE, SuSTAinAbLE EnErGy And CLimATE rOAdmAP
effects of carbon pricing vary among countries, each country can decidehow best to compensate for the impact and the share of revenues directedto compensation and mitigation. Following this approach allows honouringthe principle of Just Transition both at the international and at the nationallevel.
78
Rossi Doria 4/21.qxp_Layout 1 28/10/21 10:54 Pagina 78

reference list
acemoglu, D., aghion, P., bursztyn, l., and hemous, D. (2012). “Theenvironment and Directed Technical Change.” american economicReview 102 (1): 131-166.
aghion, P., Dechezleprêtre, a., hemous, D., Martin, R., and van Reenen,J. (2012). “Carbon Taxes, Path Dependency and Directed TechnicalChange: evidence from the auto industry.” nbeR Working Papers.
ambec, S., Cohen, M.a., elgie, S., and lanoie, P. (2013). “The Porterhypothesis at 20: Can environmental Regulation enhance innovationand Competitiveness?” Review of environmental economics andPolicy 7 (1): 2-22.
andersson, J.J. (2019). “Carbon Taxes and Co2 emissions: Sweden as a CaseStudy.” american economic Journal: economic Policy, 11 (4): 1-30.
auffhammer, M. (2018). Quantifying economics damages from climatechange. Journal of economic Perspectives – volume 32, number 4 -Fall 2018: 33-52. https://doi.org/10.1257/jep.32.4.33.
bakhtiari, S. (2018). Coming out Clean: australian Carbon Pricing and CleanTechnology adoption, ecological economics, volume 154: 238-246.
baranzini, a., van den bergh, J., Carattini, S., howarth, R., Padilla, e., Roca,J. (2016). “Seven reasons to use carbon pricing in climate policy,” GRiWorking Papers 224, Grantham Research institute on Climate Changeand the environment.
baranzini, a., Caliskan, M., Carattini, S. (2014). “economic Prescriptionsand Public Responses to Climate Policy”.
best, R. (2017). Switching towards coal or renewable energy? The effectsof financial capital on energy transitions, energy econ., 63: 75-83
best, R., burke, P.J. & Jotzo, F. (2020). Carbon Pricing efficacy: Cross-Country evidence. environ Resource econ., 77: 69-94.
best, R., zhang, Q.Y. (2020). What explains carbon-pricing variationbetween countries?, energy Policy, volume 143.
boyce, J.K. (2018). Carbon Pricing: effectiveness and equity, ecologicaleconomics, volume 150: 52-61.
bowen, a. (2015). Carbon pricing: how best to use the revenue? Policybrief, november 2015. Grantham Research institute on ClimateChange and the environment; Global Green Growth institute.
burggraeve, K., De Mulder, J., de Walque, G. (2020). Fighting global
79
Rossi Doria 4/21.qxp_Layout 1 28/10/21 10:54 Pagina 79

warming with carbon pricing: how it works, field experiments andelements for the belgian economy, economic Review, issue iv, 31.
Cappelli, F., Consoli, D., Costantini, v., Fusacchia, i., Marin, G., nardi, C.,Paglialunga, e., Salvatici, l. (2021). international trade and climatechange. Part of the problem or part of the solution?, Collana CentroRossi-Doria Papers, RomaTre Press.
Climate leadership Council, economists’ Statement on Carbon Dividends(2019). available at: https://clcouncil.org/economists-statement/.
Dorband, i.i., Jakob, M., Kalkuhl, M., Steckel, J.C. (2019). Poverty anddistributional effects of carbon pricing in low – and middle – incomecountries – a global comparative analysis. World Development, 115,246-257, https://doi.org/10.1016/j.worlddev.2018.11.015.
Driesen, D. (2018). emission Trading versus Pollution Taxes: Playing“niCe” With other instruments. environmental law, 48(1), 29-80.
european association of environmental and Resource economists(eaeRe) (2019). economists’ Statement on Carbon Pricing. availableat: http://www.eaere.org/statement/.
eU Commission website, auctioning. available at: https://ec.europa.eu/clima/policies/ets/auctioning_en#:~:text=in%202019%20alone%2C%20the%20generated,climate%20and%20energy%2Drelated%20purposes.
european Union (2017) Fossil Fuel Subsidies in-depth analysis. Doi:10.2861/35393. https://op.europa.eu/en/publication-detail/-/publication/0d274101-50ad-11e7-a5ca-01aa75ed71a1/language-en.
Fischer, C., and newell R.G. (2008). “environmental and TechnologyPolicies for Climate Mitigation.” Journal of environmental economicsand Management 55 (2): 142-162.
iCaP (2021a). emissions Trading Worldwide: Status Report 2021. berlin:international Carbon action Partnership.
iCaP (2021b). allowance price explorer. available at https://icapcarbonaction.com/en/ets-prices.
iea (2021). energy subsidies: Tracking the impact of fossil-fuel subsidies.Web page at https://www.iea.org/topics/energy-subsidies.
iea (2020). Co2 emissions from Fuel Combustion 2020: highlights.https://webstore.iea.org/co2-emissions-from-fuel-combustion-2020-highlights.
iea (2017). Real-world policy packages for sustainable energy transitions– shaping energy transition policies to fit national objectives and
80
Rossi Doria 4/21.qxp_Layout 1 28/10/21 10:54 Pagina 80

constraints. available at: https://www.iea.org/reports/real-world-policy-packages-for-sustainable-energy-transitions.
iMF (2019). Global fossil fuel subsidies remain large: an update based oncountry-level estimates prepared by David Coady, ian Parry, nghia-Piotr le, and baoping Shang.
iPCC (2018). Global Warming of 1.5°C. an iPCC Special Report on theimpacts of global warming of 1.5°C above pre-industrial levels andrelated global greenhouse gas emission pathways, in the context ofstrengthening the global response to the threat of climate change,sustainable development, and efforts to eradicate poverty [Masson-Delmotte, v., P. zhai, h.-o. Pörtner, D. Roberts, J. Skea, P.R. Shukla,a. Pirani, W. Moufouma-okia, C. Péan, R. Pidcock, S. Connors, J.b.R.Matthews, Y. Chen, x. zhou, M.i. Gomis, e. lonnoy, T. Maycock, M.Tignor, and T. Waterfield (eds.)]. available at: https://www.ipcc.ch/sr15/download/.
iRena (2020), The post-CoviD recovery: an agenda for resilience,development and equality, international Renewable energy agency,abu Dhabi. iSbn 978-92-9260-245-1. available at: https://www.irena.org/publications/2020/Jun/Post-CoviD-Recovery.
Jakob, M., Chen, C., Fuss, S., Marxen, a., Rao, n.D., edenhofer, o. (2016).Carbon Pricing Revenues Could Close infrastructure access Gaps,World Development, volume 84: 254-265.
Jewell, J., McCollum, D., emmerling, J. et al (2018). limited emissionreductions from fuel subsidy removal except in energy-exportingregions. nature 554, 229-233 https://doi.org/10.1038/nature25467.
Klenert, D., Mattauch, l., Combet, e., edenhofer, o., hepburn, C., Rafaty,R., Stern, n. (2018). Making Carbon Pricing Work for Citizens. natureClimate Change 8, 669-677.
lee, T.M., Markowitz, e.M., howe, P.D., Ko, C., leiserowitz, a.a. (2015).Risk perception around the world, nat. Clim. Change, 5.
lee, M. (2011), “Fair and effective carbon pricing: lessons from bC”,February 2011, CCPa-bC and Sierra Club bC (revised January 2013).
boqiang, l., Wesseh, P.K. (2020). on the economics of carbon pricing:insights from econometric modeling with industry-level data, energyeconomics, volume 86.
Maestre-andrés, S., Drews, S., van den bergh, J. (2019). Perceived fairnessand public acceptability of carbon pricing: a review of the literature,
81
Rossi Doria 4/21.qxp_Layout 1 28/10/21 10:54 Pagina 81

Climate Policy, 19:9, 1186-1204.noleppa, S. (2013). economic approaches for assessing climate change
adaptation options under uncertainty. excel tools for Cost-benefit andMulti-Criteria analysis. Published by Deutsche Gesellschaft fürinternationale zusammenarbeit (Giz) Gmbh.
nordhaus, W. (2015). “Climate Clubs: overcoming Free-Riding in interna-tional Climate Policy.” american economic Review 105 (4): 1339-1370.
oeCD (2021a). Fossil-fuel support by energy product. available at:https://www.oecd.org/fossil-fuels/.
oeCD (2021b). effective Carbon Rates 2021. available at: https://www.oecd-ilibrary.org/taxation/effective-carbon-rates-2021_0e8e24f5-en
oeCD (2021c). Database of Taxing energy Use for SustainableDevelopment, available at: https://stats.oecd.org/index.aspx?DataSetCode=TeUSDCbR.
oeCD (2021d). Taxing energy Use for Sustainable Development. oeCDPublishing, Paris. available at https://www.oecd.org/tax/tax-policy/taxing-energy-use-for-sustainable-development.htm
oeCD (2021e), Effective Carbon Rates 2021: Pricing Carbon Emissions throughTaxes and Emissions Trading, oeCD Publishing, Paris, https://doi.org/10.1787/0e8e24f5-en.
oeCD (2019). Taxing energy Use 2019: Using taxes for Climate action,oeCD Publishing, Paris. http://doi.org/10.1787/058ca239.
oeCD (2018a). oeCD Companion to the inventory of Support Measuresfor Fossil Fuels 2018, oeCD Publishing, Paris. http://dx.doi.org/10.1787 /9789264286061-en.
oeCD (2018b). effective Carbon Rates 2018. Pricing Carbon emissionsThrough Taxes and emissions Trading. https://doi.org/10.1787/9789264305304-en.
oeCD/iea/nea/iTF (2015). aligning Policies for a low-carboneconomy, oeCD Publishing, Paris. http://dx.doi.org/10.1787/9789264233294-en.
oeCD Stats (2019). Support Measures for Fossil Fuels. available at:https://stats.oecd.org/.
ohlendorf, n., Jakob, M., Minx, J.C. et al. (2021). Distributional impactsof Carbon Pricing: a Meta-analysis. environ Resource econ 78, 1-42.https://doi.org/10.1007/s10640-020-00521-1.
Parry, i. (2018). Fossil-fuel subsidies assessed. “Research news & views”,
82
Rossi Doria 4/21.qxp_Layout 1 28/10/21 10:54 Pagina 82

nature (london), 554(7691), 175-176. https://doi.org/10.1038/d41586-018-01495-3.
Pizer, W.a. (2002). “Combining Price and Quantity Controls to MitigateGlobal Climate Change.” Journal of Public economics 85 (3): 409-434.
Rafaty, R. (2018). “Perceptions of Corruption, Political Distrust, and theWeakening of Climate Policy”, Global environmental Politics, vol. 18,no. 3.
Saleem, M., Qadeer, F., Mahmood, F., han, h., Giorgi, G., ariza-Montes,a. (2021). inculcation of Green behavior in employees: a MultilevelModerated Mediation approach. int. J. environ. Res. Public health,18, 331.
Skovgaard, J. (2017). The devil lies in the definition: competing approachesto fossil fuel subsidies at the iMF and the oeCD. int environagreements 17, 341-353.
Skovgaard, J., S.S. Ferrari, Å. Knaggård (2019). Mapping and clustering theadoption of carbon pricing policies: what polities price carbon andwhy? Clim. Pol., 19, 1173-1185.
Stern, n., Stiglitz, J.e., et al. (2017). Report of the high-level Commissionon Carbon Prices. Carbon Pricing leadership Coalition, Washington,DC: World bank. accessibleat https://www.carbonpricingleadership.org/report-of-the-highlevel-commission-on-carbon-prices/.
United nations (2018). The emissions Gap Report 2018, United nationsenvironment Programme, nairobi.
van den bergh, J.C.J.M. (2011). “energy Conservation More effective WithRebound Policy.” environmental and Resource economics 48 (1): 43-58.
van der linden, S., Maibach, e., leiserowitz, a. (2015). improving Publicengagement With Climate Change: Five “best Practice” insights FromPsychological Science. Perspectives on Psychological Science. 10. 758-763.
Wang Q., hubacek K., Feng K., Wei Y.-M., liang Q.-M. (2016)Distributional effects of carbon taxation. appl energy 184:1123-1131.
World bank (2021). Carbon Pricing Dashboard from the World bank.https://carbonpricingdashboard.worldbank.org/. accessed on 11 april2021.
World bank (2020). State and Trends of Carbon Pricing 2020. Washington,DC: World bank. © World bank. available at: https://openknowledge.worldbank.org/handle/10986/33809 license: CC bY 3.0 iGo.
World bank (2019). State and Trends of Carbon Pricing 2019. Washington,
83
Rossi Doria 4/21.qxp_Layout 1 28/10/21 10:54 Pagina 83

DC: World bank. © World bank. available at: https://openknowledge.worldbank.org/handle/10986/31755 license: CC bY 3.0 iGo.
World bank; ecofys. (2018). State and Trends of Carbon Pricing 2018.Washington, DC: World bank. © World bank. https://openknowledge.worldbank.org/handle/10986/29687 license: CC bY 3.0 iGo.
zaman, P. (2016). learning from the lessons of others: a Guide foremerging emissions Trading Markets. Carbon & Climate law Review,10(3), 227-234.
zhang, x., löschel, a., lewis, J., zhang, D., & Yan, J. (2020). emissionstrading systems for global low carbon energy and economictransformation. applied energy, 279.
84
Rossi Doria 4/21.qxp_Layout 1 28/10/21 10:54 Pagina 84

ANNEX AList of countries considerd in part three
21 countr i e s EU 27 (OECD Countr i es of EU 27)
austria1belgium2Czech Republic3Denmark4estonia5Finland6France7Germany8Greece9hungary10ireland11italy12latvia13luxembourg14netherlands15Poland16Portugal17Slovak Republic18Slovenia19Spain20Sweden21
Other OECD Countr i es and partne r e conomie s
argentina1australia2brazil3Canada4Chile5China6Colombia7
85
Rossi Doria 4/21.qxp_Layout 1 28/10/21 10:54 Pagina 85

iceland8india9indonesia10israel11Japan12Korea13Mexico14new zealand15norway16Russian Federation17South africa18Switzerland19Turkey20United Kingdom21United States22
86
Rossi Doria 4/21.qxp_Layout 1 28/10/21 10:54 Pagina 86

ANNEX BCarbon Pricing in Numbers
linking together stoichiometric ratios of fossil fuel combustions (in termsof the quantity of Co2 generated per unit of fuel, related to its carboncontent) and the targeted carbon pricing level ($/tCo2) to be levied, it ispossible to evaluate the incidence of the carbon pricing amount and toobtain:a. the total amount of the economic resources expected by carbon pricing to feed the Fair Transition Fund devoted to green growth;b. the level of the price adjustment for the physical unit of the considered fuel, measuring the real impact of carbon pricing (datum a certain level of pricing: i.e., 30 $/tCo2).
The table indicates the price adjustment to reach the carbon pricing level of:– 30 $/tCo2;– 60 $/tCo2;– 90 $/tCo2.for several and different fuels (including main fossil fuels).
For quick reference, the carbon pricing level of 30, 60, 90 $/tCo2 percommercial unit of fossil fuel in figures means:
87
!
!"#$%&'((#)%&*+)% ,"-.'$%/-#,#$0%)+1+)%&'-%,'22+-,#")%*$#3%'&%&'((#)%&*+)%% 4567%8%9%3:;<=% 45>7%8%9%3:;<=% 45?7%8%9%3:;<=%
!"#$%&'(#)*+,&-* ./0*1*')"#*2*34* 56/75*1*')"#*2*34* 78/.5*1*')"#*2*34*9):(;<&-*=<)-*>(-* ./?@*1*')"#*2*-(#)%* 56/.0*1*')"#*2*-(#)%* 70/6?*1*')"#*2*-(#)%*A():)-*=<)-* ./B?*1*')"#*2*-(#)%* 50/5.*1*')"#*2*-(#)%* 7C/76*1*')"#*2*-(#)%*D)#*=<)-*E3)%,:)")*#FG)H* 6/6@*1*')"#*2*-(#)%* 58/C8*1*')"#*2*-(#)%* 7@/5.*1*')"#*2*-(#)%*I,#,%*J&:,-(")* 0/?0*1*')"#*2*-(#)%* 5@/?7*1*')"#*2*-(#)%* 7B/.6*1*')"#*2*-(#)%*K(L<)M();*N)#%,-)<O*J&:):*EKNJH* C/8*1*')"#*2*-(#)%* ?/B*1*')"#*2*-(#)%* 5@/8*1*')"#*2*-(#)%*K(L<)M();*P&#<%&-*J&:*EKPJH* @/8@*1*')"#*2*-(#)%* 6/B6*1*')"#*2*-(#)%* 5B/0*1*')"#*2*-(#)%*+,OG%)::);*P&#<%&-*J&:*E+PJH* 8/66*1*')"#*2*:'O* 55/88*1*')"#*2*:'O* 56/@7*1*')"#*2*:'O**
Rossi Doria 4/21.qxp_Layout 1 28/10/21 10:54 Pagina 87

Valeria Termini is Full Professor of Economics at the University of Roma Tre. She served asCommissioner of the Italian Authority for Energy and Environment (2011-18) and asVice president of the Council of European Energy Regulators (CEER). She is currently a member of the Technical WG on Finance and Investment of the UN High-Level Dialogue on Energy 2021-COP26. In 2011 she was awarded the International PA Award by the American Society for Public Administration.
Rebecca Gironi Master’s degree in “Environmental and Development Economics”, Roma Tre University. Bachelor’s degree in “International Relations and Diplomatic Affairs”, University of Bologna.
Paolo Iorio Engineer, Executive at the Technip Energies Group. Expert in “Regulation Econo-mics, Energy and Sustainable Deve-lopment”, assisting the course at the Roma Tre University.
Michele Masulli PhD student in Economics at the Department of Economics of Roma Tre University. Director of the Energy Area at the Institute for Competitiveness (I-Com).
Maria Lidia Romero Meira Environmental Manager, Master’s degree in "Environmental and Development Economics", Roma Tre University.
Il Centro Ricerche Economiche e Sociali Manlio Rossi-Doria è un Centro di Eccellenza istituito presso l’Università degli Studi Roma Tre e dedicato alla figura di Manlio Rossi-Doria (1905-1988), uno dei massimi interpreti del pensiero meridionalista.
Il Centro ha la finalità di promuovere e realizzare studi, ricerche e attività di alta formazione e di contribuire all’avanzamento delle conoscenze di temi quali:
• il ruolo dell’agricoltura, la sicurezza alimentare, la sostenibilità ambientale e la questione energetica;
• il commercio, gli investimenti esteri, le relazioni internazionali, le catene globali del valore;
• l’economia italiana, con particolare riferimento al Mezzogiorno;
• la coesione e le politiche di sviluppo; • l’integrazione europea; • l’analisi e la valutazione delle politiche pubbliche.

4 2021
The fight against climate change is a global public good and COP 26 is a key appointment to address it. However, while the climate agreement that will be negotiated in COP 26 must be global, its implementation will have to be local as it will be driven by each individual signatory State. In this context, a Global Carbon Price (GCP) has the qualities of a win-win solution, as it is effective, sustainable, addressing climate injustice. Within the Technical WG of the UN High Level Dialogue on Energy 2021, this paper, after reviewing the state-of-the-art of the literature and assessing the results of the empirical research, analyses the relationship between carbon pricing, subsidies and decarbonization. It brings to light the proposal of a GCP including different economic tools -ETS, carbon taxes, excises- feeding a Fair Transition Fund for inclusive development, as a flexible mechanism to reduce global CO2 emissions.
V. T
ER
MIN
I, W
ITH
R. G
IRO
NI,
P. I
OR
IO, M
. MA
SUL
LI,
M. L
. RO
ME
RO
ME
IRA
·
LE
VE
LL
ING
CA
RB
ON
PR
ICIN
G
LEVELLING CARBON PRICINGA proposal for an inclusive, sustainable,modern energy and climate roadmap
Valeria Termini, with Rebecca Gironi, Paolo Iorio, Michele Masulli,Maria Lidia Romero Meira
Collana Centro Rossi-Doria Papers4