leptin ameliorates insulin resistance and hepatic … mouse/rat diet 7002 from harlan teklad premier...
TRANSCRIPT
276 Journal of Lipid Research Volume 55, 2014
Copyright © 2014 by the American Society for Biochemistry and Molecular Biology, Inc.
This article is available online at http://www.jlr.org
The relevance of white adipose tissue (WAT) as an en-docrine organ rather than a mere passive fat depot was unveiled by the discovery of leptin, a 167-amino acid pep-tide hormone predominantly secreted by mature adipo-cytes ( 1 ). This adipokine regulates multiple functions ranging from energy homeostasis to sexual maturation, bone mass accrual, and innate and acquired immune func-tion ( 2 ). Leptin plasma levels are directly correlated with total body adiposity ( 3 ).
Leptin acts on cell surface receptors located throughout the central nervous system (CNS) ( 4, 5 ) and on a variety of peripheral tissues, including lungs, kidneys, skeletal mus-cle, heart, and liver ( 6 ). The relevance of central versus peripheral leptin receptor has been addressed in recent years by several investigators ( 7, 8 ). Reduced leptin signal-ing is observed in leptin-defi cient ( ob/ob) and leptin recep-tor-defi cient ( db/db) mice. Humans with mutations in the leptin and leptin receptor gene ( 9–11 ) have markedly in-creased food intake (hyperphagia), reduced energy ex-penditure, early-onset morbid obesity, lack of pubertal development and infertility, insulin resistance, diabetes mellitus, and fatty liver. Notably, peripheral administra-tion of leptin into both the ob / ob mice ( 12–14 ) and hu-mans with congenital leptin defi ciency ( 15, 16 ) reverses most of the above-mentioned complications, unequivo-cally demonstrating the key role of this adipokine in whole-body metabolic regulation ( 17 ).
The leptin receptor (LepR) belongs to the interleukin-6 receptor family of class 1 cytokine receptors ( 6 ). There are six identifi ed LepR isoforms, named LepRa to LepRf, due
Abstract Leptin is essential for energy homeostasis and regulation of food intake. Patients with congenital general-ized lipodystrophy (CGL) due to mutations in 1-acylglycer-ol-3-phosphate- O -acyltransferase 2 ( AGPAT2 ) and the CGL murine model ( Agpat2 � / � mice) both have severe insulin re-sistance, diabetes mellitus, hepatic steatosis, and low plasma leptin levels. In this study, we show that continuous leptin treatment of Agpat2 � / � mice for 28 days reduced plasma in-sulin and glucose levels and normalized hepatic steatosis and hypertriglyceridemia. Leptin also partially, but signifi -cantly, reversed the low plasma thyroxine and high corticos-terone levels found in Agpat2 � / � mice. Levels of carbohydrate response element binding protein (ChREBP) were reduced, whereas lipogenic gene expression were increased in the liv-ers of Agpat2 � / � mice, suggesting that deregulated ChREBP contributed to the development of fatty livers in these mice and that this transcription factor is a target of leptin’s ben-efi cial metabolic action. Leptin administration did not change hepatic fatty acid oxidation enzymes mRNA levels in Agpat2 � / � mice. The selective deletion of leptin receptors only in hepatocytes did not prevent the positive metabolic actions of leptin in Agpat2 � / � mice, supporting the notion that the majority of metabolic actions of leptin are depen-dent on its action in nonhepatocyte cells and/or the central nervous system. —Cortés, V. A., K. M. Cautivo, S. Rong, A. Garg, J. D. Horton, and A. K. Agarwal. Leptin ameliorates insulin resistance and hepatic steatosis in Agpat2 � / � lipodystrophic mice independent of hepatocyte leptin receptors. J. Lipid Res. 2014. 55: 276–288.
Supplementary key words acyltransferase • phospholipids • diabetes mellitus
This work was supported by FONDECYT (Fondo nacional de ciencia y tecnologia) Grant 11100168 (V.A.C.), CONICYT-PAI (consejo nacional de ciencia y tec-nologia programa de atraccion e insercion en la academia) Grant 79100018 (V.A.C.), and American Heart Association Grant 09POST2010154 (V.A.C.); and by National Institutes of Health Grants DK081181 (S.R.), DK081182 (S.R.), UL1DE019584 (J.D.H.), and DK54387 (A.G. and A.K.A.).
Manuscript received 19 November 2013.
Published, JLR Papers in Press, November 30, 2013 DOI 10.1194/jlr.M045799
Leptin ameliorates insulin resistance and hepatic steatosis in Agpat2 � / � lipodystrophic mice independent of hepatocyte leptin receptors
Víctor A. Cortés, * ,† Kelly M. Cautivo, * ,† Shunxing Rong, * Abhimanyu Garg, §, ** Jay D. Horton, * ,†† and Anil K. Agarwal 1, §, **
Department of Molecular Genetics,* Division of Nutrition and Metabolic Diseases, § Center for Human Nutrition,** and Division of Gastroenterology, †† Department of Internal Medicine, University of Texas Southwestern Medical Center , Dallas, TX ; and Department of Nutrition, Diabetes and Metabolism, † School of Medicine, Pontifi cia Universidad Católica de Chile , Santiago, Chile
Abbreviations: BAT, brown adipose tissue; CGL, congenital gener-alized lipodystrophy; ChIP, chromatin immunoprecipitation; ChREBP, carbohydrate response element-binding protein; LepR, leptin recep-tor; WAT, white adipose tissue.
1 To whom correspondence should be addressed. e-mail: [email protected]
The online version of this article (available at http://www.jlr.org) contains supplementary data in the form of one table.
by guest, on June 24, 2018w
ww
.jlr.orgD
ownloaded from
.html http://www.jlr.org/content/suppl/2013/11/30/jlr.M045799.DC1Supplemental Material can be found at:
Leptin, hepatic steatosis, and insulin resistance in Agpat2 � / � mice 277
an animal model system to further explore the role of lep-tin in insulin sensitivity and energy balance in a medically relevant murine model of lipodystrophy.
As a step forward in understanding the molecular mechanism(s) involved in the insulin sensitizing effect of leptin, we here describe the metabolic and molecular effects of leptin replacement in Agpat2 � / � mice and determine the functional relevance of hepatic LepR for metabolic ac-tions of leptin in Agpat2 � / � mice by selectively deleting it from hepatocytes.
RESEARCH DESIGN AND METHODS
Animals Generation of Agpat2 � / � mouse and genotyping is described
elsewhere ( 25 ). Mice were housed in colony cages (four per cage) and maintained on a 12 h light/12 h dark cycle and fed Teklad Mouse/Rat Diet 7002 from Harlan Teklad Premier Labo-ratory Diets (Madison, WI). Animals were euthanized at the end of the dark cycle by isofl urane overdose; blood and tissues were harvested in less than 1 min. All mouse housing, breeding, surgi-cal procedures, euthanasia, and tissue collection were conducted in conformity with Public Health Service (PHS) policy and per-formed with the approval of the Institutional Animal Care and Use Committee at the University of Texas Southwestern Medical Center. All efforts were made to minimize animal suffering.
Generation of Agpat2 � / � ; Lepr f/f ; Alb-cre + ( Agpat2 � / � ; LepR hepato-ko ) mice
To generate mice that lacked leptin receptor in liver on the Agpat2 null background, Lepr fl oxed ( Lepr f/f ) mice ( 7 ) were fi rst crossed to mice that expressed Cre recombinase under the tran-scriptional control of albumin promoter ( Alb-Cre ) (obtained from Jackson Laboratory). Resulting Lepr f/f ; Alb-cre+ and Lepr f/f ; Alb-cre- mice were bred to Agpat2 +/ � mice to obtain Agpat2 +/ � ; Lepr f/f ; Alb-cre+ and Agpat2 +/ � ; Lepr f/f ; Alb-cre- mice. These mice were bred to pro-duce the Agpat2 +/+ ; Lepr f/f ; Alb-cre +, Agpat2 +/+ ; Lepr f/f ; Alb-cre -, Agpat2 � / � ; Lepr f/f ; Alb-cre + (now referred to as Agpat2 � / � ; LepR hepato-ko ) and Agpat2 � / � ; Lepr f/f ; Alb-cre - (now referred to as Agpat2 � / � ; LepR hepato-wt ) mice which were used in these reported experiments.
Leptin infusion Mouse recombinant leptin (Sigma, St. Louis, MO) was dissolved
in phosphate saline buffer (1 mg/ml, release rate of ~0.25/µg/h), and 100 µl was loaded into osmotic minipumps (model 1002, Alzet, Cupertino, CA). Leptin was delivered at a rate of 0.25 ± 0.05 µg/h. The pumps were subcutaneously inserted in the interscapular space under isofl urane general anesthesia. The surgical wound was closed with metal clips and the animals were allowed to recover on a heating pad. Control mice were implanted with minipumps fi lled with PBS. The minipumps were removed and replaced with new ones after two weeks. At the end of the fourth week, the ani-mals were euthanized and blood and liver were harvested for analysis.
Pair feeding and indirect calorimetry For pair-feeding studies in Agpat2 � / � mice, food intake was re-
stricted in the saline-infused Agpat2 � / � mice to the same level as that of leptin-infused ones. For this, individual animals were housed in calorimetric cages (CLAMS, Columbus Instruments, Columbus, OH) and allowed to acclimate for one week. Basal food and water intake, VO 2 , VCO 2 , and locomotor activity were
to the alternative splicing of a single common transcript ( 18 ). The four short-forms (LepRa, LepRc, LepRd, and LepRf) and the one long-form (LepRb) share the extracel-lular and transmembrane domains as well as the fi rst 29 amino acids of the intracellular domain. Only the intracel-lular domain of LepRb contains a sequence motif for the binding of JAK protein kinases that is crucial for leptin signaling ( 18, 19 ). The db/db mice, which exclusively lack the LepRb isoform ( 18, 20 ), have an identical metabolic phenotype to that observed in db 3J / db 3J mice that lack all the LepR isoforms ( 21 ) and ob / ob mice, which primarily lack leptin ( 1 ), indicating that LepRb mediates most, if not all, metabolic actions of leptin.
The role of WAT in whole-body metabolic regulation has been further addressed by the observation that severe WAT defi ciency associates with the same metabolic complications of obesity. In fact, both the congenital generalized lip-odystrophy (CGL) patients ( 22 ) and lipodystrophic mouse model, including aP2-tg- Srebp1c, A- ZIP/F-1 , and Agpat2 � / � mice ( 23–25 ), develop hyperinsulinemia, diabetes mellitus, dyslipidemia, and fatty liver, indicating that both extremes of adiposity might share common pathophysiologic path-ways that lead to same fi nal metabolic derangement.
The missing link in CGL patients and lipodystrophy mouse models could be the abnormal levels of some adi-pokines, such as leptin, due to lack of adipose tissue. This is in contrast to elevated circulating levels of leptin in obese subjects in whom the action of this hormone in the CNS appears to be impaired and is referred to as “leptin-resistance” state ( 26 ). CGL is characterized by very low lev-els of plasma leptin as a consequence of primary WAT defi ciency. Seminal studies reported by Brown and Gold-stein ( 27 ) demonstrated that leptin supplementation re-sults in remarkable amelioration of hyperphagia, plasma insulin, and glucose and liver triglyceride concentrations in their hypoleptinemic aP2-tg- Srebp1c lipodystrophy mouse model ( 27 ). The clinical relevance of these observations was later corroborated by leptin supplementation in se-verely hypoleptinemic lipodystrophic patients ( 28 ). These subjects responded dramatically and favorably to leptin treatment, signifi cantly improving insulin resistance and liver and plasma triglyceride levels. However, such improve-ments have failed to be observed in common obese sub-jects when infused with leptin, most likely due to resistance to the metabolic actions of this hormone ( 29 ).
The mechanism(s) underlying leptin’s insulin-sensitizing actions in both leptin-defi cient humans and rodents and the reason why obese individuals develop leptin resistance remains obscure. We recently generated and character-ized a murine model of human CGL type 1 syndrome, the Agpat2 � / � mouse ( 25 ). The AGPATs are intermediate en-zymes in the pathway for the biosynthesis of glycerophos-pholipids (GPL) and triacylglycerol (TAG) ( 30 ). AGPATs esterify the sn-2 position of 1-acylglycerol-3-phosphate (lysophosphatidic acid or LPA) to phosphatidic acid (PA) ( 31–33 ). Mutations in AGPAT2 cause congenital general-ized lipodystrophy in humans ( 34 ), and Agpat2 � / � mice recapitulate all the features of lipodystrophy observed in humans, including severe hypoleptinemia, thus providing
by guest, on June 24, 2018w
ww
.jlr.orgD
ownloaded from
.html http://www.jlr.org/content/suppl/2013/11/30/jlr.M045799.DC1Supplemental Material can be found at:
278 Journal of Lipid Research Volume 55, 2014
The primers used for amplifi cation were: L-pk promoter: forward, 5 ′ -GAAGGATGCCCACTACAGCC-3 ′ and reverse, 5 ′ -TGCC TT-TGTCAGTGGGATGG-3. As a negative control, albumin pro moter was amplifi ed with the primers: forward, 5 ′ -CAAGGCC CACAC-TGA AATGC-3 ′ and reverse, 5 ′ -TGTGTGCAGAAAGA CTCGCTC-3 ′ .
Detection of glycosylated ChREBP in the liver by immunoblotting
To measure posttranslation modifi cation for ChREBP, this transcription factor was immunoprecipitated and immunoblot-ted with an antibody specifi c for O -linked � - N -acetylglucosamine ( O -GlcNAcylation). Whole-liver protein extracts were prepared from 100 mg of individual livers (n = 4–6 per group) by homog-enization in RIPA buffer (20 mM Tris-HCl pH 7.5, 150 mM NaCl, 1 mM EGTA, 1 mM EDTA, 1% NP-40, 1% sodium deoxycholate) supplemented with phosphatase inhibitors (2.5 mM Na 3 VO 4 and 2.5 mM Na 4 P 2 O 7 ) and protease inhibitor cocktail (Roche). One milligram of pooled proteins was immunoprecipitated with a ChREBP antibody (NB400–135, Novus Biologicals). Immune complexes were recovered after addition of 50 ml of protein A/G agarose-PLUS (Santa Cruz Biotechnology) and gentle centrifu-gation. Bound proteins were visualized by immunoblot analysis using a monoclonal antibody directed against O -linked � -N-acetylglucosamine (MMS-248R, Covance).
Biochemical and hormone determinations Liver triglycerides and cholesterol as well as plasma triglycerides,
cholesterol, glucose, insulin, and leptin were measured as previously described ( 25 ) at UT Southwestern Medical Center Mouse Meta-bolic Phenotyping Core. Liver glycogen was quantifi ed by colorimet-ric detection of free glucose (Glucose Autokit from Wako, Richmond, VA) after amyloglucosidase (Sigma, Saint Louis, MO) digestion of liver homogenates, as described by Grefhorst et al. ( 38 ). Total thy-roxine (T4) was determined with Mouse/Rat Thyroxine ELISA Kit (Calbiotech, Spring Valley, CA). Corticosterone was measured with Corticosterone EIA Kit (Enzo Life Sciences, Plymouth Meeting, PA) following manufacturer instructions.
Statistical analysis Plasma leptin, insulin, glucose and liver tissue triglycerides,
cholesterol, and glycogen were compared by one-way ANOVA followed by Bonferroni’s multiple comparison test using Graph-Pad Prism version 5.0 (San Diego, CA). Gene expression analy-sis was initially performed in pooled samples. For this, equal amounts of RNA for each experimental group were pooled and the fold change relative to control groups was determined. If the resulting fold change was greater than 1.5 or less than 0.7, individual RT-PCR was performed to determine the statistical signifi cance of these differences. Individual sample results are presented as mean ± SEM. The number of animals used for ex-perimentation was limited because more than 80% of Agpat2 � / � and Agpat2 � / � ;LepR hepato-ko mice die before the time of weaning, possibly because of severe hyperglycemia and dehydration ( 25 ). For this reason, some experimental groups had only three ani-mals. However, both the physiological determinations and the gene expression analysis show that the inter-individual variabil-ity is minimal and the differences among experimental groups are statistically signifi cant.
RESULTS
Leptin normalizes glucose, insulin, and liver triglycerides and glycogen in Agpat2 � / � mice
Agpat2 � / � mice lack both WAT and brown adipose tissue (BAT) and develop insulin resistance, diabetes mellitus,
determined during this period. Osmotic minipumps, fi lled either with leptin (1 mg/ml, n = 6) or a saline solution (PBS, n = 6), were implanted in Agpat2 � / � mice at the beginning of the second week. Animals were replaced in their original calorimetric cages with unrestricted food access. In the next three weeks, food ac-cess was unlimited for the leptin-treated mice, whereas it was limited for the saline-infused ones. For the food restriction experiment, the feeders of the food-restricted group were refi lled at the be-ginning of the dark phase, and the amount of food consumed was calculated on the basis of individual mice body weight to that of the leptin-treated mice.
Gene expression analysis by RT-PCR Total RNA was prepared from the mouse livers using RNA
STAT-60 kit (Tel-Test Inc., Friendswood, TX). Genomic DNA in the RNA samples was eliminated by RNase free DNase digestion (Ambion, Austin, TX). cDNA was generated using TaqMan® re-verse transcription kit (Applied Biosystems-Roche, Branchburg, NJ). Real-time PCR was carried out in 384-well plates, read, and analyzed using the ABI PRISM 7900HT Sequence Detection Sys-tem (Applied Biosystems, Foster City, CA). PCR conditions and primers used were previously reported ( 25 ). Primers sequences are presented in supplementary Table I. Q-PCR expression levels were normalized to the expression level of cyclophilin and the fold change was estimated by the � � C T method.
Antibodies and immunoblot analysis For ACC-1, FAS, IR, PI3K, AKT (total and phosphorylated),
GSK3 � (total and phosphorylated), ERK1/2 (total and phospho-rylated), AMPK � (total and phosphorylated), and RAP immuno-blot analysis, whole-liver protein extracts were prepared from individual animals as described ( 35 ). Equal aliquots of total pro-tein from each liver were pooled, and 30 µg was separated in 8% SDS-PAGE, transferred onto nitrocellulose membranes, blocked, and incubated with primary and secondary antibodies. For SREBP-1, total membranes and nuclear extracts were prepared from individual mice as described ( 25 ). Equal aliquots from each animal were pooled and separated in 8% SDS-PAGE, transferred onto nitrocellulose membranes, blocked, and incubated with pri-mary and secondary antibodies as described ( 25 ). The primary antibodies used were insulin receptor (IR) subunit � (BD Trans-duction Laboratories, San Jose, CA), PI3K subunit p85 (Upstate, Lake Placid, NY), SREBP-1 ( 36 ), ChREBP (Novus Biologicals, Saint Louis, MI), and FAS and ACC1 (Genepia, Seoul, South Korea). The primary antibodies against AKT, phospho-AKT (Ser473), GSK3 � , phospho-GSK3 � (Ser9), � AMPK, phospho- � AMPK (Thr172), ERK1/2 and phospho-ERK1/2 (Thr202, Tyr204) were all ob-tained from Cell Signaling Technology. Secondary peroxidase-conjugated donkey anti-mouse and anti-rabbit IgG were obtained from Jackson Immunoresearch (West Grove, PA) and GE Health-care (Little Chalfont, UK), respectively. All immunoblots were visualized by SuperSignal® West Pico Chemiluminiscent Sub-strate (Pierce, Rockford, IL).
ChIP assay for mouse liver pyruvate kinase ( L-pk ) promoter occupancy by ChREBP
Chromatin immunoprecipitation (ChIP) assays were performed as described before ( 37 ). Proteins were crosslinked to DNA by addition of 1% formaldehyde to � 70 mg of mouse whole-liver tissue by incubating for 10 min at room temperature. Sonication was performed by eight pulses of 10 s each. Immunoprecipita-tion was performed with a ChREBP antibody (NB400–135, Novus Biologicals). Immune complexes were pulled down with 60 � l of Protein A/G PLUS-agarose (Santa Cruz Biotechnology). DNA fragments were amplifi ed by PCR and separated in agarose gels.
by guest, on June 24, 2018w
ww
.jlr.orgD
ownloaded from
.html http://www.jlr.org/content/suppl/2013/11/30/jlr.M045799.DC1Supplemental Material can be found at:
Leptin, hepatic steatosis, and insulin resistance in Agpat2 � / � mice 279
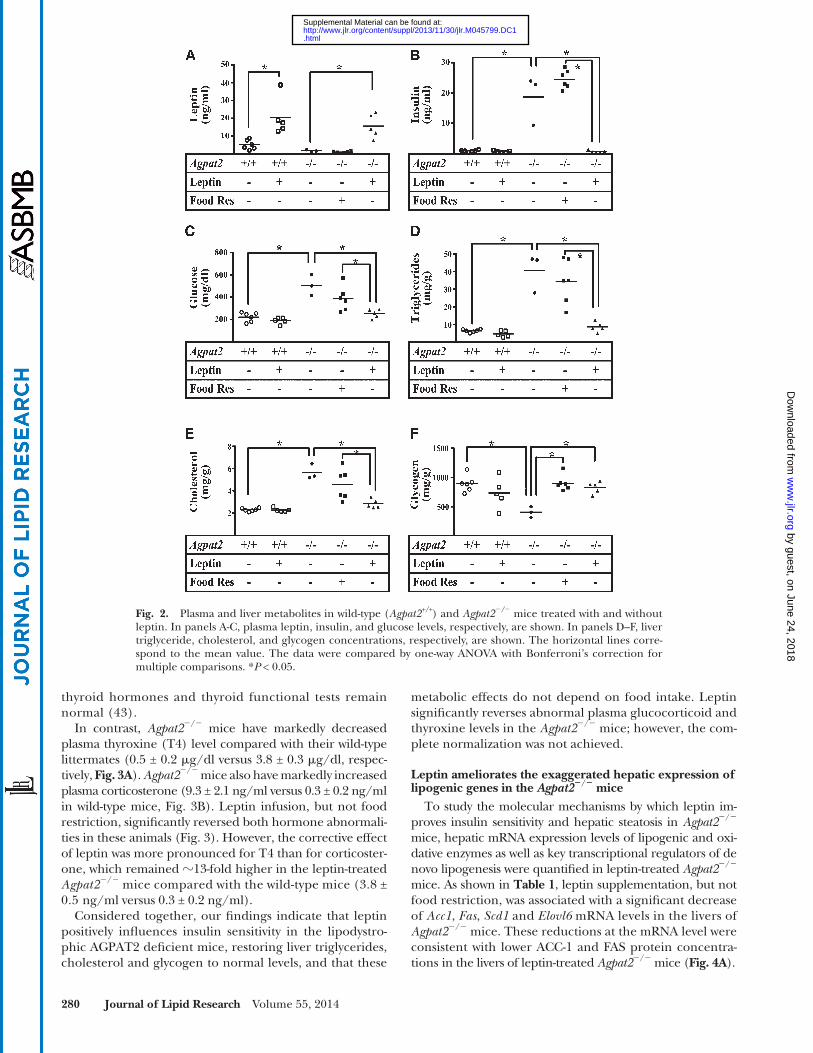
Agpat2 � / � mice ( Fig. 2B, C ). Food restriction did not modify any of these parameters in Agpat2 � / � mice, and leptin sup-plementation did not change insulin or glucose in wild-type mice ( Fig. 2B, C ). Leptin administration to Agpat2 � / � mice was also associated with signifi cant decreases in liver triglycerides and cholesterol concentrations ( Fig. 2D, E ) and signifi cant increases in hepatic glycogen content ( Fig. 2F ). Food restriction did not change liver triglycerides or cho-lesterol, but it did signifi cantly elevate glycogen levels in Agpat2 � / � mice ( Fig. 2F ).
Leptin partially normalizes corticosterone and thyroxine plasma levels in Agpat2 � / � mice
Murine models of leptin defi ciency have altered levels of plasma corticosterone and thyroid hormone levels. Leptin defi cient ob / ob mouse has adrenal hypertrophy ( 39 ), increased levels of circulating corticosterone ( 40 ), low thyroidal rates of radioactive iodine uptake ( 41 ) and reduced thyroptropin and thyroid hormones circu-lating levels ( 42 ). Lipodystrophic A-ZIP/F-1 mice also have elevated corticosterone levels ( 43 ); however, their
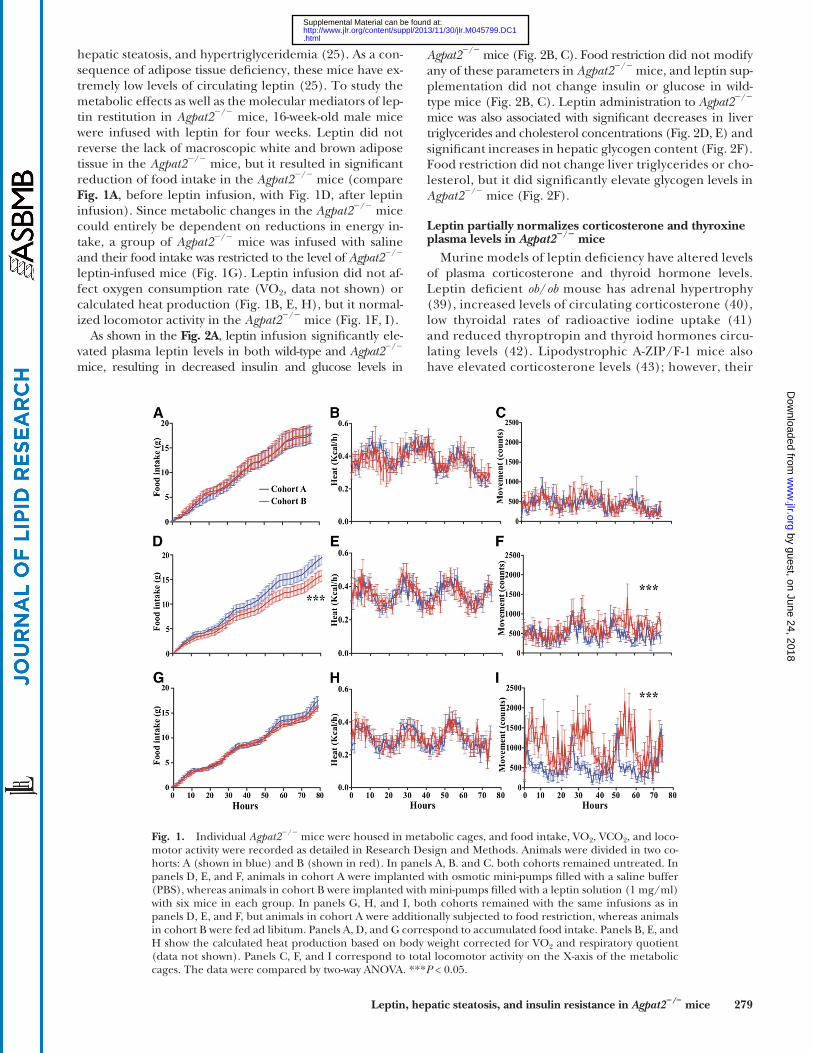
hepatic steatosis, and hypertriglyceridemia ( 25 ). As a con-sequence of adipose tissue defi ciency, these mice have ex-tremely low levels of circulating leptin ( 25 ). To study the metabolic effects as well as the molecular mediators of lep-tin restitution in Agpat2 � / � mice, 16-week-old male mice were infused with leptin for four weeks. Leptin did not reverse the lack of macroscopic white and brown adipose tissue in the Agpat2 � / � mice, but it resulted in signifi cant reduction of food intake in the Agpat2 � / � mice (compare Fig. 1A , before leptin infusion, with Fig. 1D , after leptin infusion). Since metabolic changes in the Agpat2 � / � mice could entirely be dependent on reductions in energy in-take, a group of Agpat2 � / � mice was infused with saline and their food intake was restricted to the level of Agpat2 � / � leptin-infused mice ( Fig. 1G ). Leptin infusion did not af-fect oxygen consumption rate (VO 2 , data not shown) or calculated heat production ( Fig. 1B, E, H ), but it normal-ized locomotor activity in the Agpat2 � / � mice ( Fig. 1F, I ).
As shown in the Fig. 2A , leptin infusion signifi cantly ele-vated plasma leptin levels in both wild-type and Agpat2 � / � mice, resulting in decreased insulin and glucose levels in
Fig. 1. Individual Agpat2 � / � mice were housed in metabolic cages, and food intake, VO 2 , VCO 2 , and loco-motor activity were recorded as detailed in Research Design and Methods. Animals were divided in two co-horts: A (shown in blue) and B (shown in red). In panels A, B. and C. both cohorts remained untreated. In panels D, E, and F, animals in cohort A were implanted with osmotic mini-pumps fi lled with a saline buffer (PBS), whereas animals in cohort B were implanted with mini-pumps fi lled with a leptin solution (1 mg/ml) with six mice in each group. In panels G, H, and I, both cohorts remained with the same infusions as in panels D, E, and F, but animals in cohort A were additionally subjected to food restriction, whereas animals in cohort B were fed ad libitum. Panels A, D, and G correspond to accumulated food intake. Panels B, E, and H show the calculated heat production based on body weight corrected for VO 2 and respiratory quotient (data not shown). Panels C, F, and I correspond to total locomotor activity on the X-axis of the metabolic cages. The data were compared by two-way ANOVA. *** P < 0.05.
by guest, on June 24, 2018w
ww
.jlr.orgD
ownloaded from
.html http://www.jlr.org/content/suppl/2013/11/30/jlr.M045799.DC1Supplemental Material can be found at:
280 Journal of Lipid Research Volume 55, 2014
metabolic effects do not depend on food intake. Leptin signifi cantly reverses abnormal plasma glucocorticoid and thyroxine levels in the Agpat2 � / � mice; however, the com-plete normalization was not achieved.
Leptin ameliorates the exaggerated hepatic expression of lipogenic genes in the Agpat2 � / � mice
To study the molecular mechanisms by which leptin im-proves insulin sensitivity and hepatic steatosis in Agpat2 � / � mice, hepatic mRNA expression levels of lipogenic and oxi-dative enzymes as well as key transcriptional regulators of de novo lipogenesis were quantifi ed in leptin-treated Agpat2 � / � mice. As shown in Table 1 , leptin supplementation, but not food restriction, was associated with a signifi cant decrease of Acc1 , Fas , Scd1 and Elovl6 mRNA levels in the livers of Agpat2 � / � mice. These reductions at the mRNA level were consistent with lower ACC-1 and FAS protein concentra-tions in the livers of leptin-treated Agpat2 � / � mice ( Fig. 4A ).
thyroid hormones and thyroid functional tests remain normal ( 43 ).
In contrast, Agpat2 � / � mice have markedly decreased plasma thyroxine (T4) level compared with their wild-type littermates (0.5 ± 0.2 � g/dl versus 3.8 ± 0.3 � g/dl, respec-tively, Fig. 3A ). Agpat2 � / � mice also have markedly increased plasma corticosterone (9.3 ± 2.1 ng/ml versus 0.3 ± 0.2 ng/ml in wild-type mice, Fig. 3B ). Leptin infusion, but not food restriction, signifi cantly reversed both hormone abnormali-ties in these animals ( Fig. 3 ). However, the corrective effect of leptin was more pronounced for T4 than for corticoster-one, which remained � 13-fold higher in the leptin-treated Agpat2 � / � mice compared with the wild-type mice (3.8 ± 0.5 ng/ml versus 0.3 ± 0.2 ng/ml).
Considered together, our fi ndings indicate that leptin positively infl uences insulin sensitivity in the lipodystro-phic AGPAT2 defi cient mice, restoring liver triglycerides, cholesterol and glycogen to normal levels, and that these
Fig. 2. Plasma and liver metabolites in wild-type ( Agpat2 +/+ ) and Agpat2 � / � mice treated with and without leptin. In panels A-C, plasma leptin, insulin, and glucose levels, respectively, are shown. In panels D–F, liver triglyceride, cholesterol, and glycogen concentrations, respectively, are shown. The horizontal lines corre-spond to the mean value. The data were compared by one-way ANOVA with Bonferroni’s correction for multiple comparisons. * P < 0.05.
by guest, on June 24, 2018w
ww
.jlr.orgD
ownloaded from
.html http://www.jlr.org/content/suppl/2013/11/30/jlr.M045799.DC1Supplemental Material can be found at:

Leptin, hepatic steatosis, and insulin resistance in Agpat2 � / � mice 281
Mgat1 mRNA levels ( Table 1 ), suggesting that this hor-mone could also reduce liver triglycerides by decreasing DAG availability.
The above results indicate that leptin may decrease liver triglycerides in AGPAT2 defi cient mice by ameliorating both exaggerated de novo lipogenesis and DAG formation. Our results do not support the hypothesis that leptin increases liver fatty acid oxidation rates in absence of AGPAT2.
Transcriptional activity of ChREBP is increased in livers of Agpat2 � / � mice and is normalized by leptin infusion
The molecular basis of the exaggerated hepatic de novo lipogenesis in the livers of Agpat2 � / � mice remains unclear. Srebp-1c , an endoplasmic reticulum membrane bound tran-scription factor that transcriptionally activates hepatic de novo lipogenesis in response to insulin stimulation, is ele-vated in the liver of both ob/ob and lipodystrophic Tg-aP2- -Srebp-1c hyperinsulinemic mice ( 48 ). Paradoxically, despite massive plasma insulin elevations, Agpat2 � / � mice have no increase in hepatic nuclear Srebp-1c protein levels ( 25 ). In the current study, we corroborated that Srebp-1c remained unchanged in the livers of Agpat2 � / � saline-infused mice, at both mRNA and protein levels and leptin treatment did not modify hepatic Srebp-1c , in either Agpat2 � / � or wild-type mice ( Table 1 , Fig. 4C ), supporting the lack of role for Srebp-1c in the exaggerated hepatic de novo lipogenesis of Agpat2 � / � mice.
Chrebp is a basic helix-loop-helix transcription factor that also regulates hepatic lipogenesis ( 49 ). In contrast to Srebp-1c , Chrebp is not regulated by insulin but rather it responds to changes in pentose phosphate pathway metabolites levels ( 49 ) and glucose level. Importantly, al-though the transcriptional program regulated by ChREBP extensively overlaps with that of SREBP-1c ( 49 ), liver pyruvate kinase ( L-pk) is exclusively regulated by ChREBP and can be used to discriminate the actions of one tran-scription factor over the other.
In Agpat2 � / � mice, hepatic ChREBP is decreased at both mRNA and total nuclear protein levels and leptin adminis-tration is associated with higher ChREBP protein levels in these animals, with a more pronounced normalizing effect on
It has been reported that leptin activates fatty acid oxi-dation, thus decreasing hepatic triglyceride concentration ( 44, 45 ). To evaluate whether enhanced fatty acid oxida-tion rates explained the diminished liver triglyceride levels of leptin-treated Agpat2 � / � mice, mRNA levels of several genes involved in mitochondrial and peroxisomal fatty acid oxidation pathways were quantifi ed. No differences were detected in Cpt1a , Lcad , Mcad , or Acox1 mRNA levels between leptin and saline-infused Agpat2 � / � mice ( Table 1 ). Furthermore, leptin supplementation resulted in lower mRNA levels of hepatic Ucp2 in Agpat2 � / � mice compared with saline-infused Agpat2 � / � mice, suggesting that liver fatty acid oxidation rates could actually be diminished by leptin. Expression of several transcription factors associ-ated with liver lipid metabolism remained unchanged ( Table 1 ). Liver mRNA levels of Fgf21 , a recently identifi ed hormone associated with starvation-feeding cycle, was in-creased 70.4-fold in the saline-treated Agpat2 � / � relative to saline-infused wild-type mice; leptin supplementation was associated with a 23-fold decrease of Fgf21 mRNA levels in Agpat2 � / � mouse livers ( Table 1 ).
In skeletal muscle, leptin promotes fatty acid oxidation by stimulating phosphorylation and activation of AMP-activated protein kinase (AMPK). AMPK activation results in decreased ACC-1 activity, lower malonyl-CoA levels and enhanced mitochondrial fatty acid � -oxidation ( 46 ). To as-sess the effects of leptin on hepatic AMPK levels in Agpat2 � / � mice, phosphorylation of � catalytic subunit of AMPK ( � AMPK) was examined by immunoblot analysis. As shown in Fig. 4B , infusion of leptin did not change hepatic levels of phospho- � AMPK, suggesting that in AGPAT2 defi cient mice leptin did not repress ACC-1 activity by AMPK-dependent mechanisms and that it did not stimulate fatty acid oxida-tion. Others have reported similar lack of AMPK-effects of leptin in cardiac muscle ( 47 ) and liver ( 45 ).
Mgat1 (also known as Mogat1 ), which catalyzes sn -1 ( 3 )- and sn -2-monoacylgycerol acylation is not expressed in the normal adult mouse liver but is detectable in the livers of Agpat2 � / � mice, providing an alternative pathway for he-patic diacylglycerol (DAG) and, ultimately, triacylglycerol synthesis ( 25 ). In these mice, leptin signifi cantly reduced
Fig. 3. Plasma total thyroxine and corticosterone levels in wild-type ( Agpat2 +/+ ) and Agpat2 � / � mice. Plasma total thyroxine (T4) (panel A) and corticosterone (panel B) in wild-type and Agpat2 � / � mice treated with and without leptin or food restriction. The horizontal lines correspond to the mean value. The data were compared by one-way ANOVA with Bonferroni’s correction for multiple comparisons. * P < 0.05.
by guest, on June 24, 2018w
ww
.jlr.orgD
ownloaded from
.html http://www.jlr.org/content/suppl/2013/11/30/jlr.M045799.DC1Supplemental Material can be found at:
282 Journal of Lipid Research Volume 55, 2014
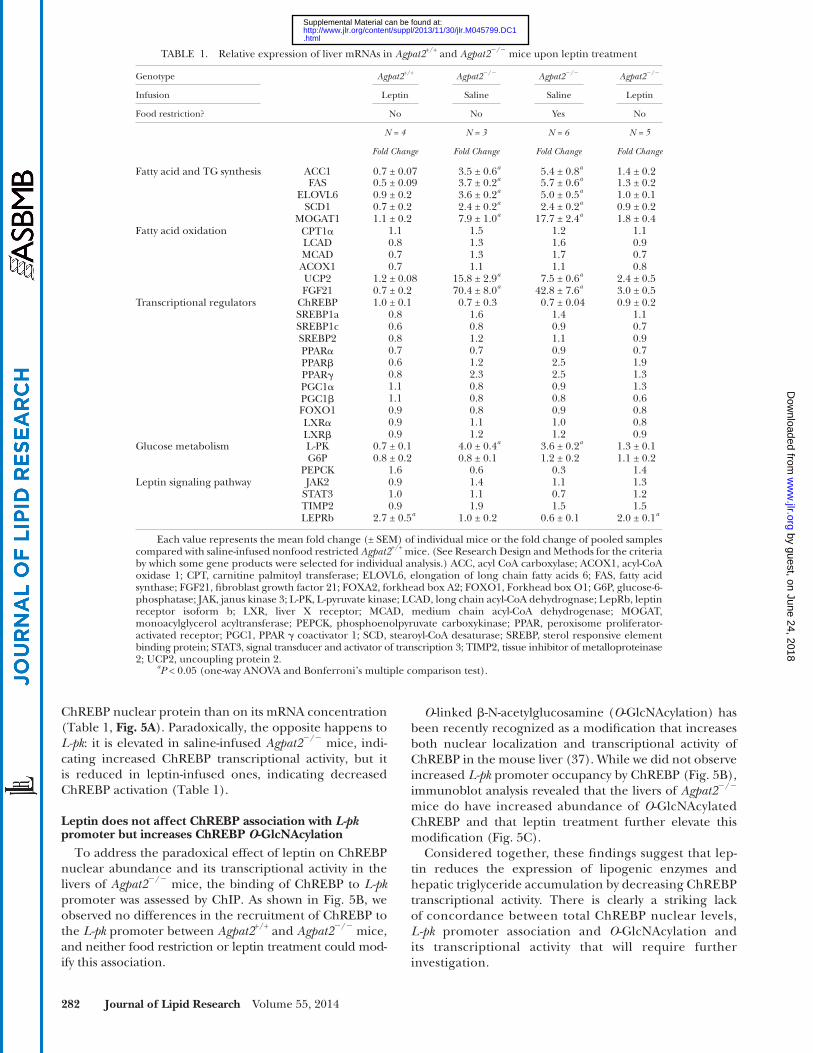
O -linked � -N-acetylglucosamine ( O -GlcNAcylation) has been recently recognized as a modifi cation that increases both nuclear localization and transcriptional activity of ChREBP in the mouse liver ( 37 ). While we did not observe increased L-pk promoter occupancy by ChREBP ( Fig. 5B ), immunoblot analysis revealed that the livers of Agpat2 � / � mice do have increased abundance of O -GlcNAcylated ChREBP and that leptin treatment further elevate this modifi cation ( Fig. 5C ).
Considered together, these fi ndings suggest that lep-tin reduces the expression of lipogenic enzymes and hepatic triglyceride accumulation by decreasing ChREBP transcriptional activity. There is clearly a striking lack of concordance between total ChREBP nuclear levels, L-pk promoter association and O -GlcNAcylation and its transcriptional activity that will require further investigation.
ChREBP nuclear protein than on its mRNA concentration ( Table 1 , Fig. 5A ). Paradoxically, the opposite happens to L-pk : it is elevated in saline-infused Agpat2 � / � mice, indi-cating increased ChREBP transcriptional activity, but it is reduced in leptin-infused ones, indicating decreased ChREBP activation ( Table 1 ).
Leptin does not affect ChREBP association with L-pk promoter but increases ChREBP O -GlcNAcylation
To address the paradoxical effect of leptin on ChREBP nuclear abundance and its transcriptional activity in the livers of Agpat2 � / � mice, the binding of ChREBP to L-pk promoter was assessed by ChIP. As shown in Fig. 5B , we observed no differences in the recruitment of ChREBP to the L-pk promoter between Agpat2 +/+ and Agpat2 � / � mice, and neither food restriction or leptin treatment could mod-ify this association.
TABLE 1. Relative expression of liver mRNAs in Agpat2 +/+ and Agpat2 � / � mice upon leptin treatment
Genotype Agpat2 +/+ Agpat2 � / � Agpat2 � / � Agpat2 � / �
Infusion Leptin Saline Saline Leptin
Food restriction? No No Yes No
N = 4 N = 3 N = 6 N = 5
Fold Change Fold Change Fold Change Fold Change
Fatty acid and TG synthesis ACC1 0.7 ± 0.07 3.5 ± 0.6 a 5.4 ± 0.8 a 1.4 ± 0.2FAS 0.5 ± 0.09 3.7 ± 0.2 a 5.7 ± 0.6 a 1.3 ± 0.2
ELOVL6 0.9 ± 0.2 3.6 ± 0.2 a 5.0 ± 0.5 a 1.0 ± 0.1SCD1 0.7 ± 0.2 2.4 ± 0.2 a 2.4 ± 0.2 a 0.9 ± 0.2
MOGAT1 1.1 ± 0.2 7.9 ± 1.0 a 17.7 ± 2.4 a 1.8 ± 0.4Fatty acid oxidation CPT1 � 1.1 1.5 1.2 1.1
LCAD 0.8 1.3 1.6 0.9MCAD 0.7 1.3 1.7 0.7ACOX1 0.7 1.1 1.1 0.8UCP2 1.2 ± 0.08 15.8 ± 2.9 a 7.5 ± 0.6 a 2.4 ± 0.5FGF21 0.7 ± 0.2 70.4 ± 8.0 a 42.8 ± 7.6 a 3.0 ± 0.5
Transcriptional regulators ChREBP 1.0 ± 0.1 0.7 ± 0.3 0.7 ± 0.04 0.9 ± 0.2SREBP1a 0.8 1.6 1.4 1.1SREBP1c 0.6 0.8 0.9 0.7SREBP2 0.8 1.2 1.1 0.9PPAR � 0.7 0.7 0.9 0.7PPAR � 0.6 1.2 2.5 1.9PPAR � 0.8 2.3 2.5 1.3PGC1 � 1.1 0.8 0.9 1.3PGC1 � 1.1 0.8 0.8 0.6FOXO1 0.9 0.8 0.9 0.8LXR � 0.9 1.1 1.0 0.8LXR � 0.9 1.2 1.2 0.9
Glucose metabolism L-PK 0.7 ± 0.1 4.0 ± 0.4 a 3.6 ± 0.2 a 1.3 ± 0.1G6P 0.8 ± 0.2 0.8 ± 0.1 1.2 ± 0.2 1.1 ± 0.2
PEPCK 1.6 0.6 0.3 1.4Leptin signaling pathway JAK2 0.9 1.4 1.1 1.3
STAT3 1.0 1.1 0.7 1.2TIMP2 0.9 1.9 1.5 1.5LEPRb 2.7 ± 0.5 a 1.0 ± 0.2 0.6 ± 0.1 2.0 ± 0.1 a
Each value represents the mean fold change (± SEM) of individual mice or the fold change of pooled samples compared with saline-infused nonfood restricted Agpat2 +/+ mice. (See Research Design and Methods for the criteria by which some gene products were selected for individual analysis.) ACC, acyl CoA carboxylase; ACOX1, acyl-CoA oxidase 1; CPT, carnitine palmitoyl transferase; ELOVL6, elongation of long chain fatty acids 6; FAS, fatty acid synthase; FGF21, fi broblast growth factor 21; FOXA2, forkhead box A2; FOXO1, Forkhead box O1 ; G6P, glucose-6-phosphatase; JAK, janus kinase 3; L-PK, L-pyruvate kinase; LCAD, long chain acyl-CoA dehydrognase; LepRb, leptin receptor isoform b; LXR, liver X receptor; MCAD, medium chain acyl-CoA dehydrogenase; MOGAT, monoacylglycerol acyltransferase; PEPCK, phosphoenolpyruvate carboxykinase; PPAR, peroxisome proliferator-activated receptor; PGC1, PPAR � coactivator 1; SCD, stearoyl-CoA desaturase; SREBP, sterol responsive element binding protein; STAT3, signal transducer and activator of transcription 3; TIMP2, tissue inhibitor of metalloproteinase 2; UCP2, uncoupling protein 2.
a P < 0.05 (one-way ANOVA and Bonferroni’s multiple comparison test).
by guest, on June 24, 2018w
ww
.jlr.orgD
ownloaded from
.html http://www.jlr.org/content/suppl/2013/11/30/jlr.M045799.DC1Supplemental Material can be found at:
Leptin, hepatic steatosis, and insulin resistance in Agpat2 � / � mice 283
mRNA levels in the skeletal muscle compared with the wild-type mice ( Table 2 ). Leptin, as well as food restric-tion, signifi cantly lowered Acc1 mRNA expression in Agpat2 � / � mice compared with the saline-infused Agpat2 � / � mice ( Table 2 ). Skeletal muscle mRNA levels for Mcad and Ucp2 were unchanged in saline-treated Agpat2 � / � mice and Ucp2 transcript was signifi cantly decreased by leptin treatment. In contrast, the Lcad mRNA was elevated in the Agpat2 � / � mice. Unlike the liver, treatment with leptin did not alter Pk and Chrebp mRNA levels in the skeletal muscle of the Agpat2 � / � mice. Pepck mRNA levels were signifi -cantly lower in saline-infused Agpat2 � / � mice compared with saline-infused wild-type mice and leptin did not cor-rect this abnormality ( Table 2 ). Taken together these fi nd-ings suggest that Agpat2 � / � mice have decreased basal skeletal muscle fatty acid synthesis rate and that leptin fur-ther reduces it.
Hepatocyte specifi c gene deletion of LepR does not affect metabolic actions of leptin in Agpat2 � / � mice
Leptin receptors are present at the CNS and several pe-ripheral tissues, including the liver ( 6 ). To explore whether the action of leptin was mediated by direct signaling in the
Leptin reduces hepatic levels of phosphorylated-active AKT in Agpat2 � / � mice
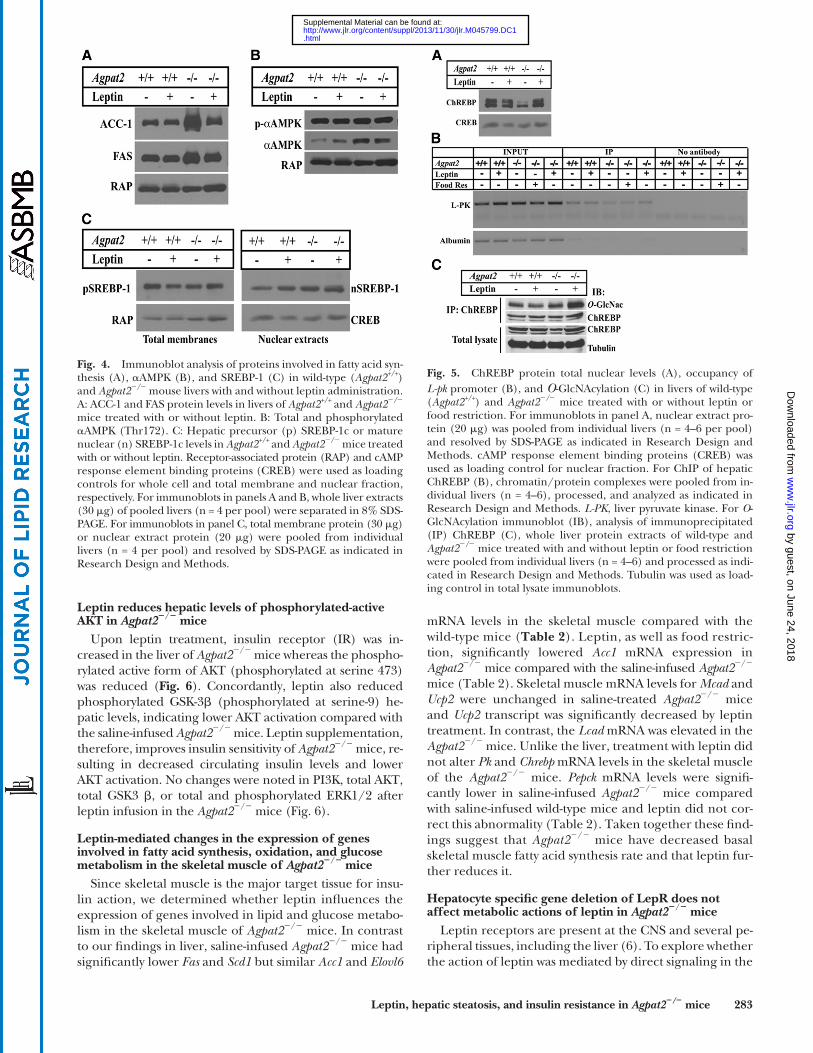
Upon leptin treatment, insulin receptor (IR) was in-creased in the liver of Agpat2 � / � mice whereas the phospho-rylated active form of AKT (phosphorylated at serine 473) was reduced ( Fig. 6 ). Concordantly, leptin also reduced phosphorylated GSK-3 � (phosphorylated at serine-9) he-patic levels, indicating lower AKT activation compared with the saline-infused Agpat2 � / � mice. Leptin supplementation, therefore, improves insulin sensitivity of Agpat2 � / � mice, re-sulting in decreased circulating insulin levels and lower AKT activation. No changes were noted in PI3K, total AKT, total GSK3 � , or total and phosphorylated ERK1/2 after leptin infusion in the Agpat2 � / � mice ( Fig. 6 ).
Leptin-mediated changes in the expression of genes involved in fatty acid synthesis, oxidation, and glucose metabolism in the skeletal muscle of Agpat2 � / � mice
Since skeletal muscle is the major target tissue for insu-lin action, we determined whether leptin infl uences the expression of genes involved in lipid and glucose metabo-lism in the skeletal muscle of Agpat2 � / � mice. In contrast to our fi ndings in liver, saline-infused Agpat2 � / � mice had signifi cantly lower Fas and Scd1 but similar Acc1 and Elovl6
Fig. 4. Immunoblot analysis of proteins involved in fatty acid syn-thesis (A), � AMPK (B), and SREBP-1 (C) in wild-type ( Agpat2 +/+ ) and Agpat2 � / � mouse livers with and without leptin administration. A: ACC-1 and FAS protein levels in livers of Agpat2 +/+ and Agpat2 � / � mice treated with or without leptin. B: Total and phosphorylated � AMPK (Thr172). C: Hepatic precursor (p) SREBP-1c or mature nuclear (n) SREBP-1c levels in Agpat2 +/+ and Agpat2 � / � mice treated with or without leptin. Receptor-associated protein (RAP) and cAMP response element binding proteins (CREB) were used as loading controls for whole cell and total membrane and nuclear fraction, respectively. For immunoblots in panels A and B, whole liver extracts (30 � g) of pooled livers (n = 4 per pool) were separated in 8% SDS-PAGE. For immunoblots in panel C, total membrane protein (30 � g) or nuclear extract protein (20 � g) were pooled from individual livers (n = 4 per pool) and resolved by SDS-PAGE as indicated in Research Design and Methods.
Fig. 5. ChREBP protein total nuclear levels (A), occupancy of L-pk promoter (B), and O -GlcNAcylation (C) in livers of wild-type ( Agpat2 +/+ ) and Agpat2 � / � mice treated with or without leptin or food restriction. For immunoblots in panel A, nuclear extract pro-tein (20 � g) was pooled from individual livers (n = 4–6 per pool) and resolved by SDS-PAGE as indicated in Research Design and Methods. cAMP response element binding proteins (CREB) was used as loading control for nuclear fraction. For ChIP of hepatic ChREBP (B), chromatin/protein complexes were pooled from in-dividual livers (n = 4–6), processed, and analyzed as indicated in Research Design and Methods. L-PK , liver pyruvate kinase. For O -GlcNAcylation immunoblot (IB), analysis of immunoprecipitated (IP) ChREBP (C), whole liver protein extracts of wild-type and Agpat2 � / � mice treated with and without leptin or food restriction were pooled from individual livers (n = 4–6) and processed as indi-cated in Research Design and Methods. Tubulin was used as load-ing control in total lysate immunoblots.
by guest, on June 24, 2018w
ww
.jlr.orgD
ownloaded from
.html http://www.jlr.org/content/suppl/2013/11/30/jlr.M045799.DC1Supplemental Material can be found at:
284 Journal of Lipid Research Volume 55, 2014
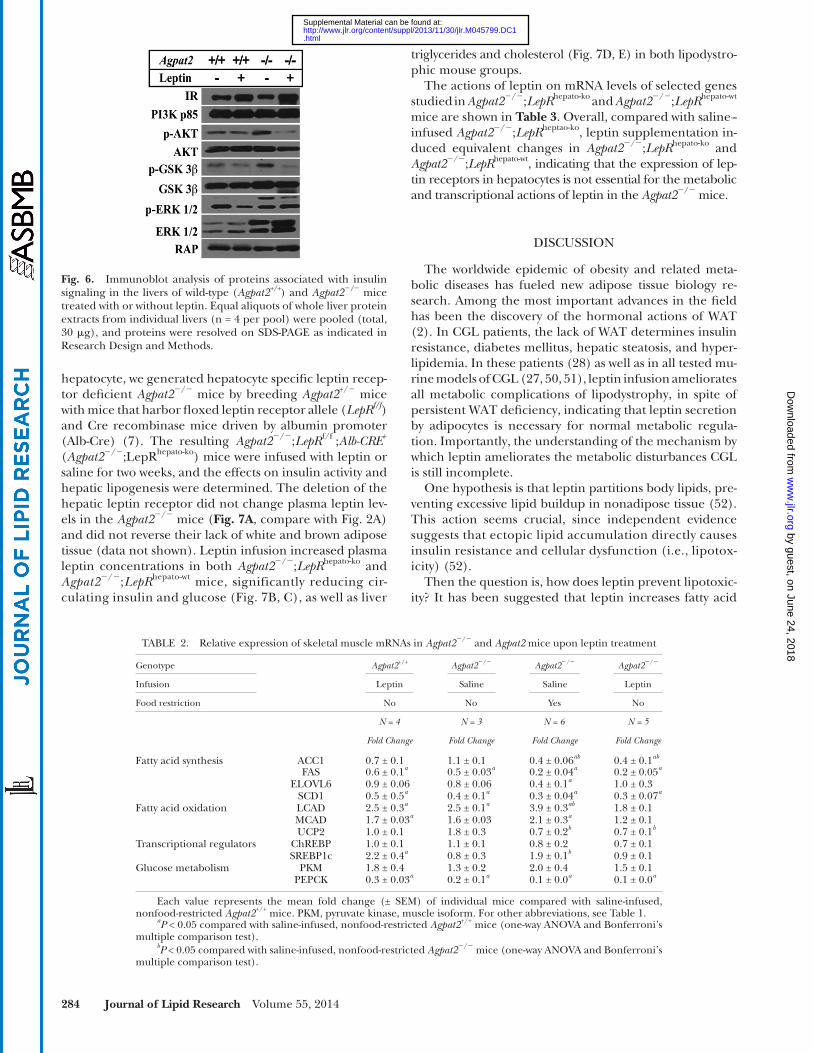
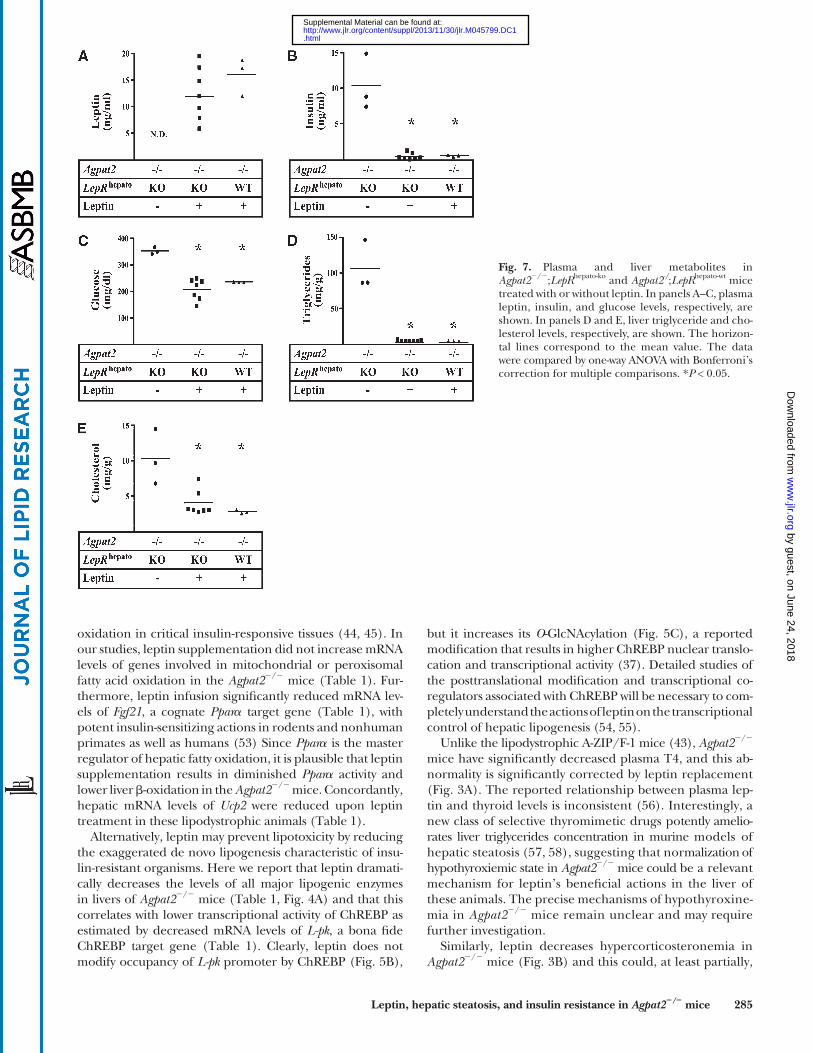
triglycerides and cholesterol ( Fig. 7D, E ) in both lipodystro-phic mouse groups.
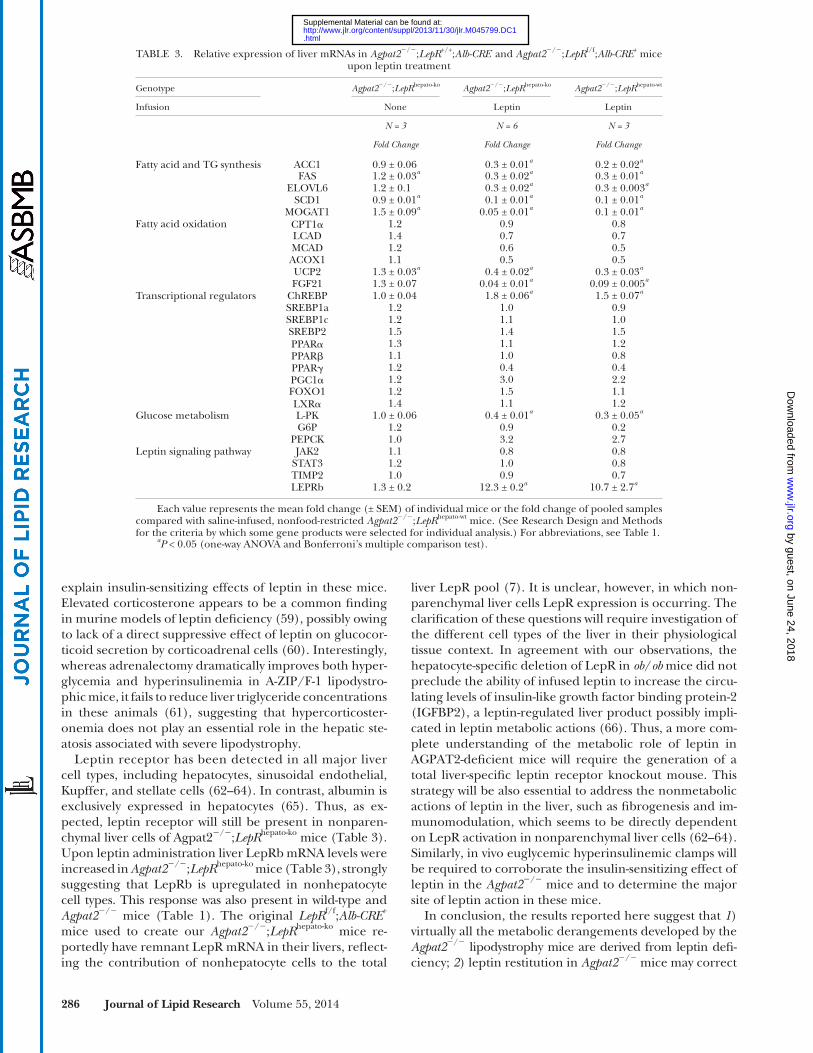
The actions of leptin on mRNA levels of selected genes studied in Agpat2 � / � ; LepR hepato-ko and Agpat2 � / � ; LepR hepato-wt mice are shown in Table 3 . Overall, compared with saline - -infused Agpat2 � / � ; LepR heptao-ko , leptin supplementation in-duced equivalent changes in Agpat2 � / � ; LepR hepato-ko and Agpat2 � / � ; LepR hepato-wt , indicating that the expression of lep-tin receptors in hepatocytes is not essential for the metabolic and transcriptional actions of leptin in the Agpat2 � / � mice.
DISCUSSION
The worldwide epidemic of obesity and related meta-bolic diseases has fueled new adipose tissue biology re-search. Among the most important advances in the fi eld has been the discovery of the hormonal actions of WAT ( 2 ). In CGL patients, the lack of WAT determines insulin resistance, diabetes mellitus, hepatic steatosis, and hyper-lipidemia. In these patients ( 28 ) as well as in all tested mu-rine models of CGL ( 27, 50, 51 ), leptin infusion ameliorates all metabolic complications of lipodystrophy, in spite of persistent WAT defi ciency, indicating that leptin secretion by adipocytes is necessary for normal metabolic regula-tion. Importantly, the understanding of the mechanism by which leptin ameliorates the metabolic disturbances CGL is still incomplete.
One hypothesis is that leptin partitions body lipids, pre-venting excessive lipid buildup in nonadipose tissue ( 52 ). This action seems crucial, since independent evidence suggests that ectopic lipid accumulation directly causes insulin resistance and cellular dysfunction (i.e., lipotox-icity) ( 52 ).
Then the question is, how does leptin prevent lipotoxic-ity? It has been suggested that leptin increases fatty acid
hepatocyte, we generated hepatocyte specifi c leptin recep-tor defi cient Agpat2 � / � mice by breeding Agpat2 +/ � mice with mice that harbor fl oxed leptin receptor allele ( LepR f/f ) and Cre recombinase mice driven by albumin promoter (Alb-Cre) ( 7 ). The resulting Agpat2 � / � ; LepR f/f ; Alb-CRE + ( Agpat2 � / � ;LepR hepato-ko ) mice were infused with leptin or saline for two weeks, and the effects on insulin activity and hepatic lipogenesis were determined. The deletion of the hepatic leptin receptor did not change plasma leptin lev-els in the Agpat2 � / � mice ( Fig. 7A , compare with Fig. 2A ) and did not reverse their lack of white and brown adipose tissue (data not shown). Leptin infusion increased plasma leptin concentrations in both Agpat2 � / � ; LepR hepato-ko and Agpat2 � / � ; LepR hepato-wt mice, significantly reducing cir-culating insulin and glucose ( Fig. 7B, C ), as well as liver
Fig. 6. Immunoblot analysis of proteins associated with insulin signaling in the livers of wild-type ( Agpat2 +/+ ) and Agpat2 � / � mice treated with or without leptin. Equal aliquots of whole liver protein extracts from individual livers (n = 4 per pool) were pooled (total, 30 � g), and proteins were resolved on SDS-PAGE as indicated in Research Design and Methods.
TABLE 2. Relative expression of skeletal muscle mRNAs in Agpat2 � / � and Agpat2 mice upon leptin treatment
Genotype Agpat2 +/+ Agpat2 � / � Agpat2 � / � Agpat2 � / �
Infusion Leptin Saline Saline Leptin
Food restriction No No Yes No
N = 4 N = 3 N = 6 N = 5
Fold Change Fold Change Fold Change Fold Change
Fatty acid synthesis ACC1 0.7 ± 0.1 1.1 ± 0.1 0.4 ± 0.06 ab 0.4 ± 0.1 ab FAS 0.6 ± 0.1 a 0.5 ± 0.03 a 0.2 ± 0.04 a 0.2 ± 0.05 a
ELOVL6 0.9 ± 0.06 0.8 ± 0.06 0.4 ± 0.1 a 1.0 ± 0.3SCD1 0.5 ± 0.5 a 0.4 ± 0.1 a 0.3 ± 0.04 a 0.3 ± 0.07 a
Fatty acid oxidation LCAD 2.5 ± 0.3 a 2.5 ± 0.1 a 3.9 ± 0.3 ab 1.8 ± 0.1MCAD 1.7 ± 0.03 a 1.6 ± 0.03 2.1 ± 0.3 a 1.2 ± 0.1UCP2 1.0 ± 0.1 1.8 ± 0.3 0.7 ± 0.2 b 0.7 ± 0.1 b
Transcriptional regulators ChREBP 1.0 ± 0.1 1.1 ± 0.1 0.8 ± 0.2 0.7 ± 0.1SREBP1c 2.2 ± 0.4 a 0.8 ± 0.3 1.9 ± 0.1 b 0.9 ± 0.1
Glucose metabolism PKM 1.8 ± 0.4 1.3 ± 0.2 2.0 ± 0.4 1.5 ± 0.1PEPCK 0.3 ± 0.03 a 0.2 ± 0.1 a 0.1 ± 0.0 a 0.1 ± 0.0 a
Each value represents the mean fold change (± SEM) of individual mice compared with saline-infused, nonfood-restricted Agpat2 +/+ mice. PKM, pyruvate kinase, muscle isoform. For other abbreviations, see Table 1 .
a P < 0.05 compared with saline-infused, nonfood-restricted Agpat2 +/+ mice (one-way ANOVA and Bonferroni’s multiple comparison test).
b P < 0.05 compared with saline-infused, nonfood-restricted Agpat2 � / � mice (one-way ANOVA and Bonferroni’s multiple comparison test).
by guest, on June 24, 2018w
ww
.jlr.orgD
ownloaded from
.html http://www.jlr.org/content/suppl/2013/11/30/jlr.M045799.DC1Supplemental Material can be found at:
Leptin, hepatic steatosis, and insulin resistance in Agpat2 � / � mice 285
but it increases its O -GlcNAcylation ( Fig. 5C ), a reported modifi cation that results in higher ChREBP nuclear translo-cation and transcriptional activity ( 37 ). Detailed studies of the posttranslational modifi cation and transcriptional co-regulators associated with ChREBP will be necessary to com-pletely understand the actions of leptin on the transcriptional control of hepatic lipogenesis ( 54, 55 ).
Unlike the lipodystrophic A-ZIP/F-1 mice ( 43 ), Agpat2 � / � mice have signifi cantly decreased plasma T4, and this ab-normality is signifi cantly corrected by leptin replacement ( Fig. 3A ). The reported relationship between plasma lep-tin and thyroid levels is inconsistent ( 56 ). Interestingly, a new class of selective thyromimetic drugs potently amelio-rates liver triglycerides concentration in murine models of hepatic steatosis ( 57, 58 ), suggesting that normalization of hypothyroxiemic state in Agpat2 � / � mice could be a relevant mechanism for leptin’s benefi cial actions in the liver of these animals. The precise mechanisms of hypothyroxine-mia in Agpat2 � / � mice remain unclear and may require further investigation.
Similarly, leptin decreases hypercorticosteronemia in Agpat2 � / � mice ( Fig. 3B ) and this could, at least partially,
oxidation in critical insulin-responsive tissues ( 44, 45 ). In our studies, leptin supplementation did not increase mRNA levels of genes involved in mitochondrial or peroxisomal fatty acid oxidation in the Agpat2 � / � mice ( Table 1 ). Fur-thermore, leptin infusion signifi cantly reduced mRNA lev-els of Fgf21 , a cognate Ppar � target gene ( Table 1 ), with potent insulin-sensitizing actions in rodents and nonhuman primates as well as humans ( 53 ) Since Ppar � is the master regulator of hepatic fatty oxidation, it is plausible that leptin supplementation results in diminished Ppar � activity and lower liver � -oxidation in the Agpat2 � / � mice. Concordantly, hepatic mRNA levels of Ucp2 were reduced upon leptin treatment in these lipodystrophic animals ( Table 1 ).
Alternatively, leptin may prevent lipotoxicity by reducing the exaggerated de novo lipogenesis characteristic of insu-lin-resistant organisms. Here we report that leptin dramati-cally decreases the levels of all major lipogenic enzymes in livers of Agpat2 � / � mice ( Table 1 , Fig. 4A ) and that this correlates with lower transcriptional activity of ChREBP as estimated by decreased mRNA levels of L-pk , a bona fi de ChREBP target gene ( Table 1 ). Clearly, leptin does not modify occupancy of L-pk promoter by ChREBP ( Fig. 5B ),
Fig. 7. Plasma and liver metabolites in Agpat2 � / � ; LepR hepato-ko and Agpat2 -/ ; LepR hepato-wt mice treated with or without leptin. In panels A–C, plasma leptin, insulin, and glucose levels, respectively, are shown. In panels D and E, liver triglyceride and cho-lesterol levels, respectively, are shown. The horizon-tal lines correspond to the mean value. The data were compared by one-way ANOVA with Bonferroni’s correction for multiple comparisons. * P < 0.05.
by guest, on June 24, 2018w
ww
.jlr.orgD
ownloaded from
.html http://www.jlr.org/content/suppl/2013/11/30/jlr.M045799.DC1Supplemental Material can be found at:
286 Journal of Lipid Research Volume 55, 2014
liver LepR pool ( 7 ). It is unclear, however, in which non-parenchymal liver cells LepR expression is occurring. The clarifi cation of these questions will require investigation of the different cell types of the liver in their physiological tissue context. In agreement with our observations, the hepatocyte-specifi c deletion of LepR in ob / ob mice did not preclude the ability of infused leptin to increase the circu-lating levels of insulin-like growth factor binding protein-2 (IGFBP2), a leptin-regulated liver product possibly impli-cated in leptin metabolic actions ( 66 ). Thus, a more com-plete understanding of the metabolic role of leptin in AGPAT2-defi cient mice will require the generation of a total liver-specifi c leptin receptor knockout mouse. This strategy will be also essential to address the nonmetabolic actions of leptin in the liver, such as fi brogenesis and im-munomodulation, which seems to be directly dependent on LepR activation in nonparenchymal liver cells ( 62–64 ). Similarly, in vivo euglycemic hyperinsulinemic clamps will be required to corroborate the insulin-sensitizing effect of leptin in the Agpat2 � / � mice and to determine the major site of leptin action in these mice.
In conclusion, the results reported here suggest that 1 ) virtually all the metabolic derangements developed by the Agpat2 � / � lipodystrophy mice are derived from leptin defi -ciency; 2 ) leptin restitution in Agpat2 � / � mice may correct
explain insulin-sensitizing effects of leptin in these mice. Elevated corticosterone appears to be a common fi nding in murine models of leptin defi ciency ( 59 ), possibly owing to lack of a direct suppressive effect of leptin on glucocor-ticoid secretion by corticoadrenal cells ( 60 ). Interestingly, whereas adrenalectomy dramatically improves both hyper-glycemia and hyperinsulinemia in A-ZIP/F-1 lipodystro-phic mice, it fails to reduce liver triglyceride concentrations in these animals ( 61 ), suggesting that hypercorticoster-onemia does not play an essential role in the hepatic ste-atosis associated with severe lipodystrophy.
Leptin receptor has been detected in all major liver cell types, including hepatocytes, sinusoidal endothelial, Kupffer, and stellate cells ( 62–64 ). In contrast, albumin is exclusively expressed in hepatocytes ( 65 ). Thus, as ex-pected, leptin receptor will still be present in nonparen-chymal liver cells of Agpat2 � / � ; LepR hepato-ko mice ( Table 3 ). Upon leptin administration liver LepRb mRNA levels were increased in Agpat2 � / � ; LepR hepato-ko mice ( Table 3 ), strongly suggesting that LepRb is upregulated in nonhepatocyte cell types. This response was also present in wild-type and Agpat2 � / � mice ( Table 1 ). The original LepR f/f ; Alb-CRE + mice used to create our Agpat2 � / � ; LepR hepato-ko mice re-portedly have remnant LepR mRNA in their livers, refl ect-ing the contribution of nonhepatocyte cells to the total
TABLE 3. Relative expression of liver mRNAs in Agpat2 � / � ; LepR +/+ ; Alb-CRE - and Agpat2 � / � ; LepR f/f ; Alb-CRE + mice upon leptin treatment
Genotype Agpat2 � / � ; LepR hepato-ko Agpat2 � / � ; LepR hepato-ko Agpat2 � / � ; LepR hepato-wt
Infusion None Leptin Leptin
N = 3 N = 6 N = 3
Fold Change Fold Change Fold Change
Fatty acid and TG synthesis ACC1 0.9 ± 0.06 0.3 ± 0.01 a 0.2 ± 0.02 a FAS 1.2 ± 0.03 a 0.3 ± 0.02 a 0.3 ± 0.01 a
ELOVL6 1.2 ± 0.1 0.3 ± 0.02 a 0.3 ± 0.003 a SCD1 0.9 ± 0.01 a 0.1 ± 0.01 a 0.1 ± 0.01 a
MOGAT1 1.5 ± 0.09 a 0.05 ± 0.01 a 0.1 ± 0.01 a Fatty acid oxidation CPT1 � 1.2 0.9 0.8
LCAD 1.4 0.7 0.7MCAD 1.2 0.6 0.5ACOX1 1.1 0.5 0.5UCP2 1.3 ± 0.03 a 0.4 ± 0.02 a 0.3 ± 0.03 a FGF21 1.3 ± 0.07 0.04 ± 0.01 a 0.09 ± 0.005 a
Transcriptional regulators ChREBP 1.0 ± 0.04 1.8 ± 0.06 a 1.5 ± 0.07 a SREBP1a 1.2 1.0 0.9SREBP1c 1.2 1.1 1.0SREBP2 1.5 1.4 1.5PPAR � 1.3 1.1 1.2PPAR � 1.1 1.0 0.8PPAR � 1.2 0.4 0.4PGC1 � 1.2 3.0 2.2FOXO1 1.2 1.5 1.1LXR � 1.4 1.1 1.2
Glucose metabolism L-PK 1.0 ± 0.06 0.4 ± 0.01 a 0.3 ± 0.05 a G6P 1.2 0.9 0.2
PEPCK 1.0 3.2 2.7Leptin signaling pathway JAK2 1.1 0.8 0.8
STAT3 1.2 1.0 0.8TIMP2 1.0 0.9 0.7LEPRb 1.3 ± 0.2 12.3 ± 0.2 a 10.7 ± 2.7 a
Each value represents the mean fold change (± SEM) of individual mice or the fold change of pooled samples compared with saline-infused, nonfood-restricted Agpat2 � / � ; LepR hepato-wt mice. (See Research Design and Methods for the criteria by which some gene products were selected for individual analysis.) For abbreviations, see Table 1 .
a P < 0.05 (one-way ANOVA and Bonferroni’s multiple comparison test).
by guest, on June 24, 2018w
ww
.jlr.orgD
ownloaded from
.html http://www.jlr.org/content/suppl/2013/11/30/jlr.M045799.DC1Supplemental Material can be found at:
Leptin, hepatic steatosis, and insulin resistance in Agpat2 � / � mice 287
O’Rahilly . 1999 . Effects of recombinant leptin therapy in a child with congenital leptin defi ciency. N. Engl. J. Med. 341 : 879 – 884 .
16 . Farooqi , I. S. , G. Matarese , G. M. Lord , J. M. Keogh , E. Lawrence , C. Agwu , V. Sanna , S. A. Jebb , F. Perna , S. Fontana , et al . 2002 . Benefi cial effects of leptin on obesity, T cell hyporesponsiveness, and neuroendocrine/metabolic dysfunction of human congenital leptin defi ciency. J. Clin. Invest. 110 : 1093 – 1103 .
17 . Gautron , L. , and J. K. Elmquist . 2011 . Sixteen years and count-ing: an update on leptin in energy balance. J. Clin. Invest. 121 : 2087 – 2093 .
18 . Lee , G. H. , R. Proenca , J. M. Montez , K. M. Carroll , J. G. Darvishzadeh , J. I. Lee , and J. M. Friedman . 1996 . Abnormal splic-ing of the leptin receptor in diabetic mice. Nature . 379 : 632 – 635 .
19 . Tartaglia , L. A. 1997 . The leptin receptor. J. Biol. Chem. 272 : 6093 – 6096 .
20 . Chen , H. , O. Charlat , L. A. Tartaglia , E. A. Woolf , X. Weng , S. J. Ellis , N. D. Lakey , J. Culpepper , K. J. Moore , R. E. Breitbart , et al . 1996 . Evidence that the diabetes gene encodes the leptin receptor: identifi cation of a mutation in the leptin receptor gene in db/db mice. Cell . 84 : 491 – 495 .
21 . Lee , G. , C. Li , J. Montez , J. Halaas , J. Darvishzadeh , and J. M. Friedman . 1997 . Leptin receptor mutations in 129 db3J/db3J mice and NIH facp/facp rats . Mamm. Genome . 8 : 445 – 447 .
22 . Garg , A. 2011 . Clinical review#: Lipodystrophies: genetic and ac-quired body fat disorders. J. Clin. Endocrinol. Metab. 96 : 3313 – 3325 .
23 . Shimomura , I. , R. E. Hammer , J. A. Richardson , S. Ikemoto , Y. Bashmakov , J. L. Goldstein , and M. S. Brown . 1998 . Insulin resis-tance and diabetes mellitus in transgenic mice expressing nuclear SREBP-1c in adipose tissue: model for congenital generalized lip-odystrophy. Genes Dev. 12 : 3182 – 3194 .
24 . Kim , J. K. , O. Gavrilova , Y. Chen , M. L. Reitman , and G. I. Shulman . 2000 . Mechanism of insulin resistance in A-ZIP/F-1 fatless mice. J. Biol. Chem. 275 : 8456 – 8460 .
25 . Cortes , V. A. , D. E. Curtis , S. Sukumaran , X. Shao , V. Parameswara , S. Rashid , A. R. Smith , J. Ren , V. Esser , R. E. Hammer , et al . 2009 . Molecular mechanisms of hepatic steatosis and insulin resistance in the AGPAT2-defi cient mouse model of congenital generalized lipodystrophy. Cell Metab. 9 : 165 – 176 .
26 . Myers , M. G. , Jr ., R. L. Leibel , R. J. Seeley , and M. W. Schwartz . 2010 . Obesity and leptin resistance: distinguishing cause from ef-fect. Trends Endocrinol. Metab. 21 : 643 – 651 .
27 . Shimomura , I. , R. E. Hammer , S. Ikemoto , M. S. Brown , and J. L. Goldstein . 1999 . Leptin reverses insulin resistance and diabetes mellitus in mice with congenital lipodystrophy. Nature . 401 : 73 – 76 .
28 . Oral , E. A. , V. Simha , E. Ruiz , A. Andewelt , A. Premkumar , P. Snell , A. J. Wagner , A. M. DePaoli , M. L. Reitman , S. I. Taylor , et al . 2002 . Leptin-replacement therapy for lipodystrophy. N. Engl. J. Med. 346 : 570 – 578 .
29 . Heymsfield , S. B. , A. S. Greenberg , K. Fujioka , R. M. Dixon , R. Kushner , T. Hunt , J. A. Lubina , J. Patane , B. Self , P. Hunt , et al . 1999 . Recombinant leptin for weight loss in obese and lean adults: a randomized, controlled, dose-escalation trial. JAMA . 282 : 1568 – 1575 .
30 . Coleman , R. A. , and D. P. Lee . 2004 . Enzymes of triacylglycerol synthesis and their regulation. Prog. Lipid Res. 43 : 134 – 176 .
31 . Agarwal , A. K. , and A. Garg . 2003 . Congenital generalized lip-odystrophy: signifi cance of triglyceride biosynthetic pathways. Trends Endocrinol. Metab. 14 : 214 – 221 .
32 . Takeuchi , K. , and K. Reue . 2009 . Biochemistry, physiology, and ge-netics of GPAT, AGPAT, and lipin enzymes in triglyceride synthe-sis. Am. J. Physiol. Endocrinol. Metab. 296 : E1195 – E1209 .
33 . Agarwal , A. K. 2012 . Lysophospholipid acyltransferases: 1-acylglycerol-3-phosphate O-acyltransferases. From discovery to disease. Curr. Opin. Lipidol. 23 : 290 – 302 .
34 . Agarwal , A. K. , E. Arioglu , S. De Almeida , N. Akkoc , S. I. Taylor , A. M. Bowcock , R. I. Barnes , and A. Garg . 2002 . AGPAT2 is mutated in congenital generalized lipodystrophy linked to chromosome 9q34. Nat. Genet. 31 : 21 – 23 .
35 . Kerouz , N. J. , D. Horsch , S. Pons , and C. R. Kahn . 1997 . Differential regulation of insulin receptor substrates-1 and -2 (IRS-1 and IRS-2) and phosphatidylinositol 3-kinase isoforms in liver and muscle of the obese diabetic (ob/ob) mouse. J. Clin. Invest. 100 : 3164 – 3172 .
36 . Shimano , H. , J. D. Horton , R. E. Hammer , I. Shimomura , M. S. Brown , and J. L. Goldstein . 1996 . Overproduction of choles-terol and fatty acids causes massive liver enlargement in trans-genic mice expressing truncated SREBP-1a. J. Clin. Invest. 98 : 1575 – 1584 .
fatty liver by decreasing de novo hepatic lipogenesis and by elevating thyroxine levels; 3 ) the main transcriptional regulator mediating fatty liver in Agpat2 � / � mice is likely ChREBP, and leptin normalizes its nuclear levels, reduces its transcriptional activity, and increases its glycosylation level but does not change its abundance in the L-pk pro-moter of these mice; and 4 ) the benefi cial metabolic ac-tions of leptin in Agpat2 � / � mice do not depend on LepR signaling in hepatocytes.
The authors thank Dr. Jeffrey Friedman (Rockefeller University) for providing us the Lepr fl oxed mice used in this study.
REFERENCES
1 . Zhang , Y. , R. Proenca , M. Maffei , M. Barone , L. Leopold , and J. M. Friedman . 1994 . Positional cloning of the mouse obese gene and its human homologue. Nature . 372 : 425 – 432 .
2 . Friedman , J. M. 2010 . A tale of two hormones. Nat. Med. 16 : 1100 – 1106 .
3 . Considine , R. V. , M. K. Sinha , M. L. Heiman , A. Kriauciunas , T. W. Stephens , M. R. Nyce , J. P. Ohannesian , C. C. Marco , L. J. McKee , T. L. Bauer , et al . 1996 . Serum immunoreactive-leptin concentra-tions in normal-weight and obese humans. N. Engl. J. Med. 334 : 292 – 295 .
4 . Fei , H. , H. J. Okano , C. Li , G. H. Lee , C. Zhao , R. Darnell , and J. M. Friedman . 1997 . Anatomic localization of alternatively spliced lep-tin receptors (Ob-R) in mouse brain and other tissues. Proc. Natl. Acad. Sci. USA . 94 : 7001 – 7005 .
5 . Elmquist , J. K. , C. Bjorbaek , R. S. Ahima , J. S. Flier , and C. B. Saper . 1998 . Distributions of leptin receptor mRNA isoforms in the rat brain. J. Comp. Neurol. 395 : 535 – 547 .
6 . Tartaglia , L. A. , M. Dembski , X. Weng , N. Deng , J. Culpepper , R. Devos , G. J. Richards , L. A. Campfi eld , F. T. Clark , J. Deeds , et al . 1995 . Identifi cation and expression cloning of a leptin receptor, OB-R. Cell . 83 : 1263 – 1271 .
7 . Cohen , P. , C. Zhao , X. Cai , J. M. Montez , S. C. Rohani , P. Feinstein , P. Mombaerts , and J. M. Friedman . 2001 . Selective deletion of leptin receptor in neurons leads to obesity. J. Clin. Invest. 108 : 1113 – 1121 .
8 . Guo , K. , J. E. McMinn , T. Ludwig , Y-H. Yu , G. Yang , L. Chen , D. Loh , C. Li , S. Chua , and Y. Zhang . 2007 . Disruption of peripheral leptin signaling in mice results in hyperleptinemia without associ-ated metabolic abnormalities. Endocrinology . 148 : 3987 – 3997 .
9 . Montague , C. T. , I. S. Farooqi , J. P. Whitehead , M. A. Soos , H. Rau , N. J. Wareham , C. P. Sewter , J. E. Digby , S. N. Mohammed , J. A. Hurst , et al . 1997 . Congenital leptin defi ciency is associated with severe early-onset obesity in humans. Nature . 387 : 903 – 908 .
10 . Clement , K. , C. Vaisse , N. Lahlou , S. Cabrol , V. Pelloux , D. Cassuto , M. Gourmelen , C. Dina , J. Chambaz , J. M. Lacorte , et al . 1998 . A mutation in the human leptin receptor gene causes obesity and pituitary dysfunction. Nature . 392 : 398 – 401 .
11 . Farooqi , I. S. , T. Wangensteen , S. Collins , W. Kimber , G. Matarese , J. M. Keogh , E. Lank , B. Bottomley , J. Lopez-Fernandez , I. Ferraz-Amaro , et al . 2007 . Clinical and molecular genetic spectrum of congenital defi ciency of the leptin receptor. N. Engl. J. Med. 356 : 237 – 247 .
12 . Pelleymounter , M. A. , M. J. Cullen , M. B. Baker , R. Hecht , D. Winters , T. Boone , and F. Collins . 1995 . Effects of the obese gene product on body weight regulation in ob/ob mice. Science . 269 : 540 – 543 .
13 . Halaas , J. L. , K. S. Gajiwala , M. Maffei , S. L. Cohen , B. T. Chait , D. Rabinowitz , R. L. Lallone , S. K. Burley , and J. M. Friedman . 1995 . Weight-reducing effects of the plasma protein encoded by the obese gene. Science . 269 : 543 – 546 .
14 . Campfi eld , L. A. , F. J. Smith , Y. Guisez , R. Devos , and P. Burn . 1995 . Recombinant mouse OB protein: evidence for a peripheral signal linking adiposity and central neural networks. Science . 269 : 546 – 549 .
15 . Farooqi , I. S. , S. A. Jebb , G. Langmack , E. Lawrence , C. H. Cheetham , A. M. Prentice , I. A. Hughes , M. A. McCamish , and S.
by guest, on June 24, 2018w
ww
.jlr.orgD
ownloaded from
.html http://www.jlr.org/content/suppl/2013/11/30/jlr.M045799.DC1Supplemental Material can be found at:
288 Journal of Lipid Research Volume 55, 2014
37 . Guinez , C. , G. Filhoulaud , F. Rayah-Benhamed , S. Marmier , C. Dubuquoy , R. Dentin , M. Moldes , A. F. Burnol , X. Yang , T. Lefebvre , et al . 2011 . O-GlcNAcylation increases ChREBP protein content and transcriptional activity in the liver. Diabetes . 60 : 1399 – 1413 .
38 . Grefhorst , A. , M. Schreurs , M. H. Oosterveer , V. A. Cortes , R. Havinga , A. W. Herling , D. J. Reijngoud , A. K. Groen , and F. Kuipers . 2010 . Carbohydrate-response-element-binding protein (ChREBP) and not the liver X receptor alpha (LXRalpha) medi-ates elevated hepatic lipogenic gene expression in a mouse model of glycogen storage disease type 1. Biochem. J. 432 : 249 – 254 .
39 . Edwardson , J. A. , and C. A. Hough . 1975 . The pituitary-adrenal system of the genetically obese (ob/ob) mouse. J. Endocrinol. 65 : 99 – 107 .
40 . Herberg , L. , and H. K. Kley . 1975 . Adrenal function and the effect of a high-fat diet on C57BL/6J and C57BL/6J-ob/ob mice . Horm. Metab. Res. 7 : 410 – 415 .
41 . Otto , W. , T. G. Taylor , and D. A. York . 1976 . Glycerol release in vitro from adipose tissue of obese (ob/ob) mice treated with thy-roid hormones. J. Endocrinol. 71 : 143 – 155 .
42 . Mobley , P. W. , and P. U. Dubuc . 1979 . Thyroid hormone levels in the developing obese-hyperglycemic syndrome . Horm. Metab. Res. . 11 : 37 – 39 .
43 . Gavrilova , O. , L. R. Leon , B. Marcus-Samuels , M. M. Mason , A. L. Castle , S. Refetoff , C. Vinson , and M. L. Reitman . 1999 . Torpor in mice is induced by both leptin-dependent and -independent mechanisms. Proc. Natl. Acad. Sci. USA . 96 : 14623 – 14628 .
44 . Shimabukuro , M. , K. Koyama , G. Chen , M-Y. Wang , F. Trieu , Y. Lee , C. B. Newgard , and R. H. Unger . 1997 . Direct antidiabetic effect of leptin through triglyceride depletion of tissues. Proc. Natl. Acad. Sci. USA . 94 : 4637 – 4641 .
45 . Huang , W. , N. Dedousis , A. Bandi , G. D. Lopaschuk , and R. M. O’Doherty . 2006 . Liver triglyceride secretion and lipid oxidative metabolism are rapidly altered by leptin in vivo. Endocrinology . 147 : 1480 – 1487 .
46 . Minokoshi , Y. , Y. B. Kim , O. D. Peroni , L. G. Fryer , C. Muller , D. Carling , and B. B. Kahn . 2002 . Leptin stimulates fatty-acid oxidation by activating AMP-activated protein kinase. Nature . 415 : 339 – 343 .
47 . Atkinson , L. L. , M. A. Fischer , and G. D. Lopaschuk . 2002 . Leptin activates cardiac fatty acid oxidation independent of changes in the AMP-activated protein kinase-acetyl-CoA carboxylase-malonyl-CoA axis. J. Biol. Chem. 277 : 29424 – 29430 .
48 . Shimomura , I. , Y. Bashmakov , and J. D. Horton . 1999 . Increased levels of nuclear SREBP-1c associated with fatty livers in two mouse models of diabetes mellitus. J. Biol. Chem. 274 : 30028 – 30032 .
49 . Uyeda , K. , and J. J. Repa . 2006 . Carbohydrate response element binding protein, ChREBP, a transcription factor coupling hepatic glucose utilization and lipid synthesis. Cell Metab. 4 : 107 – 110 .
50 . Ebihara , K. , Y. Ogawa , H. Masuzaki , M. Shintani , F. Miyanaga , M. Aizawa-Abe , T. Hayashi , K. Hosoda , G. Inoue , Y. Yoshimasa , et al . 2001 . Transgenic overexpression of leptin rescues insulin resistance and diabetes in a mouse model of lipoatrophic diabetes. Diabetes . 50 : 1440 – 1448 .
51 . Asterholm , I. W. , N. Halberg , and P. E. Scherer . 2007 . Mouse mod-els of lipodystrophy key reagents for the understanding of the met-abolic syndrome. Drug Discov. Today Dis. Models . 4 : 17 – 24 .
52 . Unger , R. H. , and P. E. Scherer . 2010 . Gluttony, sloth and the meta-bolic syndrome: a roadmap to lipotoxicity. Trends Endocrinol. Metab. 21 : 345 – 352 .
53 . Potthoff , M. J. , S. A. Kliewer , and D. J. Mangelsdorf . 2012 . Endocrine fi broblast growth factors 15/19 and 21: from feast to famine. Genes Dev. 26 : 312 – 324 .
54 . Nakagawa , T. , Q. Ge , R. Pawlosky , R. M. Wynn , R. L. Veech , and K. Uyeda . 2013 . Metabolite regulation of nucleo-cytosolic traffi cking of carbohydrate response element-binding protein (ChREBP): role of ketone bodies. J. Biol. Chem. 288 : 28358 – 28367 .
55 . Iizuka , K. 2013 . Recent progress on the role of ChREBP in glucose and lipid metabolism. Endocr. J. 60 : 543 – 555 .
56 . Feldt-Rasmussen , U. 2007 . Thyroid and leptin. Thyroid . 17 : 413 – 419 .
57 . Cable , E. E. , P. D. Finn , J. W. Stebbins , J. Z. Hou , B. R. Ito , P. D. van Poelje , D. L. Linemeyer , and M. D. Erion . 2009 . Reduction of he-patic steatosis in rats and mice after treatment with a liver-targeted thyroid hormone receptor agonist. Hepatology . 49 : 407 – 417 .
58 . Arrese , M. 2009 . Burning hepatic fat: therapeutic potential for liver-specifi c thyromimetics in the treatment of nonalcoholic fatty liver disease. Hepatology . 49 : 348 – 351 .
59 . Khan , S. M. , O. P. R. Hamnvik , M. Brinkoetter , and C. S. Mantzoros . 2012 . Leptin as a modulator of neuroendocrine function in humans. Yonsei Med. J. 53 : 671 – 679 .
60 . Pralong , F. P. , R. Roduit , G. Waeber , E. Castillo , F. Mosimann , B. Thorens , and R. C. Gaillard . 1998 . Leptin inhibits directly glu-cocorticoid secretion by normal human and rat adrenal gland. Endocrinology . 139 : 4264 – 4268 .
61 . Haluzik , M. , K. R. Dietz , J. K. Kim , B. Marcus-Samuels , G. I. Shulman , O. Gavrilova , and M. L. Reitman . 2002 . Adrenalectomy improves diabetes in A-ZIP/F-1 lipoatrophic mice by increasing both liver and muscle insulin sensitivity. Diabetes . 51 : 2113 – 2118 .
62 . Wang , J. , I. Leclercq , J. M. Brymora , N. Xu , M. Ramezani–Moghadam , R. M. London , D. Brigstock , and J. George . 2009 . Kupffer cells me-diate leptin-induced liver fi brosis . Gastroenterology . 137 : 713 – 723 .e711.
63 . Saxena , N. K. , K. Ikeda , D. C. Rockey , S. L. Friedman , and F. A. Anania . 2002 . Leptin in hepatic fi brosis: evidence for increased collagen production in stellate cells and lean littermates of ob/ob mice. Hepatology . 35 : 762 – 771 .
64 . Ikejima , K. , Y. Takei , H. Honda , M. Hirose , M. Yoshikawa , Y. J. Zhang , T. Lang , T. Fukuda , S. Yamashina , T. Kitamura , et al . 2002 . Leptin receptor-mediated signaling regulates hepatic fi brogenesis and remodeling of extracellular matrix in the rat. Gastroenterology . 122 : 1399 – 1410 .
65 . Saber , M. A. , P. M. Novikoff , and D. A. Shafritz . 1990 . Albumin and collagen mRNA expression in normal and analbuminemic rodent liver: analysis by in situ hybridization using biotinylated probes. J. Histochem. Cytochem. 38 : 199 – 207 .
66 . Levi , J. , F. K. Huynh , H. C. Denroche , U. H. Neumann , M. M. Glavas , S. D. Covey , and T. J. Kieffer . 2012 . Hepatic leptin signal-ling and subdiaphragmatic vagal efferents are not required for lep-tin-induced increases of plasma IGF binding protein-2 (IGFBP-2) in ob/ob mice. Diabetologia . 55 : 752 – 762 .
by guest, on June 24, 2018w
ww
.jlr.orgD
ownloaded from
.html http://www.jlr.org/content/suppl/2013/11/30/jlr.M045799.DC1Supplemental Material can be found at: