leopard survey in sangare ranch conservancy, kenya, using ... · using noninvasive techniques we...
TRANSCRIPT

Leopard survey in Sangare Ranch Conservancy,Kenya, using noninvasive methods includingindividual identification from faecal DNA
Henrik Svengren
Degree project in biology, Master of science (2 years), 2008Examensarbete i biologi 30 hp till masterexamen, 2008Biology Education Centre and Institution of ecology and evolution, Zoology, Uppsala UniversitySupervisor: Mats Björklund

1 (12)
Abstract Sangare Ranch Conservancy constitutes a newly formed (2007) private conservancy with an alternative management method. Using noninvasive techniques we identified 13 individual leopards on the 20 km-2 sample area, 28 leopard signs per 100km walked, a predicted carrying capacity of 8.7-9.1 leopards 100km-2 and a predation pressure on neighboring goat stock of 5.3%. We conclude that the conservancy plays an important role for leopard ecology and comprises a geographical bridge between other protected wild habitats in the region. We aimed for a low survey cost realistic to be used in practice for future private surveys and also suggest more effective methods for similar studies. Introduction Kenya has in the last decades experienced a rapid increase in human population from 11.2 million year 1970 to predicted 40.6 million year 2010 (UN), relatively, the utilization of land has increased. Woodroffe (2000) established strong association between high human density and the loss of carnivore population from a region. The sub Saharan African leopard (Panthera pardus pardus) is not endangered by IUCN but subject to local depletion through exploitation and loss of habitat. The overall loss of wildlife habitat in Africa impose that the rate of which new protected habitats are formed must increase rapidly; hence non-governmental alternatives of protection are of great importance. The survival of protective land is poor if it cannot sustain itself economically, which may be the major obstacle for non-governmental land owners who wish to transform their land to a conservancy. It is unlikely for a small size conservancy to rely on visitor generated income, such as entry fees or lodging due to competition of large conservancies and national parks. An alternative way of protecting land is implemented in the newly formed Sangare Ranch Conservancy, Aberdares, Kenya. The livestock ranch has, together with neighbouring land owners, re-established the land as a conservancy. Potential house sites for quality recreation were identified on the ranch where investors could purchase land, according to the Kenyan law, and where the total investment at a minimum corresponded to the value of the whole land on the ranch. Therefore the land has been redeemed economically to the former ranch owners. A non-profit company was set up run the conservancy constituted by former landowners and new investors, and it is financially run by splitting the expenses among the investors to a self-cost level. The conservancy is therefore economically self sustainable, and additional economic activity may be implemented within the legal regulations of a Kenyan conservancy, such as tourism. The leopard’s trophic position constrains it to live in low population densities and practice a predation pressure on wild animals as well as livestock. Conflict with people on reserve borders is the major cause of mortality in small populations of large carnivores, so that the border represents a population sink, known as the edge effect (Woodroffe and Ginsberg 1998). When managing a relatively small size conservancy that is fenced or situated in hostile environment it is of interest to detect and minimize the risk of conflict with neighbouring landowners and livestock owners (Kolowski and Holekamp 2006, Woodroffe 2000) as well as evaluating the carrying capacity of predators such as the leopard to avoid deterioration of prey (Hayward et al. 2007). The aim of this study was to use a noninvasive, low cost and efficient survey method to investigate the occurrence of leopards in a small size conservancy including individual identification. We also investigated the potential predation

2 (12)
pressure on surrounding livestock, and the carrying capacity of leopard in the conservancy and its vicinity. Material and Methods Study site Sangare Ranch Conservancy (S0 18.148, E36 57.830) comprises 20km2 and is located 13km north of Nyeri town, between the Aberdare mountain range and Mt. Kenya (figure 1). The conservancy shares part of the north-west boundary with Solio Game Reserve which comprises approximately 70km2; part of the north-west boundary to a national forest reserve approximately 4km2 in size; and part of the south west boundary with Aberdare Country Club, approximately 5.2km2 in size. In other directions local farms and ranches of different sizes neighbour the conservancy and utilize the land for livestock and agriculture, this neighbouring land is henceforth referred to as the vicinity and covers approximately 15km2 reaching up to 2km away from the Sangare RC boundary. The landscape where Sangare RC is situated constitutes a plateau and high level structural plain which is flat to gently undulating with slopes in general less than 8% (Ministry of Agriculture, Kenya 1980). The altitude of the plain is around 1850m and have crossing rivers cut down in the bedrock with a topography ranging from 1779m in the deepest river gorge to 2008m on the highest hill. Sangare RC is classified in the moisture availability zone IV; semi-humid to semi-arid with an annual rainfall of 600-1100mm (Ministry of Agriculture, Kenya 1980). The temperature zone is classified as lower highlands (1850-2150m altitude), with a mean annual temperature of 16-18C° and an absolute minimum of 2-4 C°, night frost is very rare (Ministry of Agriculture, Kenya 1980). The soil is well drained, moderately deep to deep (50-120cm) dark brown, firm clay with thick humic topsoil developed on tertiary basic and ultra basic igneous rocks and classified as ortho-luvic PHAEOZEMS according to FAO-Unesco 1974 soil classification units (Ministry of Agriculture, Kenya 1980). The vegetation ranges from dry woodland and bush land (Ministry of Agriculture, Kenya 1980) to scattered tree grassland of Acacia-Themeda type (Edwards and Bogdan 1951). The Sangare Ranch Conservancy director has monitored the herbivore population for more than 5 decades by sightings and provided us with reliable estimations of herbivore populations, species relevant for this study are presented in table 1. For carnivores he has observed cheetahs on the eastern grass plain and rarely single stray hyenas. A population of hyena is considered to be absent, with the possible reason that it is heavily and easily persecuted by man in surrounding cultivated landscape. Most of the ranch border is electrically fenced which restricts movements of larger herbivores. Carnivores may jump the fence and move freely, small animals may also find their way through the fence. The neighbouring Solio Game Reserve and Aberdare Country Club share the similarity of landscape, vegetation, wildlife and utilization, with the exception of Aberdare Country Club that does not ranch livestock. The national forest reserve remain today only with sparse low bush. Field setup A tracking team of three people, one researcher (H.S.) and two rangers, patrolled trails, roads and bush searching for faeces, scratch marks, tracks and carcasses (Henschel and Ray
3 (12)
2003). The distance between the trackers varied between a few meters up to 200m. Walking distance and findings was recorded in a GPS receiver. When searching for faeces along trails and roads, the ground was thoroughly searched up to 5 meters distance from the trail or road. All findings were reported to one person (H.S) for consistency of determination, and photographed. A questionnaire was used when the two local rangers interviewed neighbouring livestock owners and their herders in the vicinity. Questions asked were how many goats they had their disposal, and how many carcasses or skeletons of killed goats they had found from 1st January 2007 to the time of the survey, mid November 2007. Genetic sampling Each individual faeces sample was collected with a pair of new sterile disposable gloves and put in sterile vials using sterile disposable surgeon knives to avoid cross contamination. 1-4cm3 of surface matter was stored in 15ml vials containing 95% ethanol in 1:4 ratios. The faeces location was recorded in GPS receiver and notes were made on the date, location relative to roads or trails and the approximate age. The same person (H.S.) estimated the age to avoid differences in appreciation: only fresh (0-1 day) and relatively fresh (1-3 days) were sampled to minimize genotyping problems. At the evening of a sample day, each vial were kept in -20°C until DNA extraction, except from two different days of transport where the vials were kept in an isolated freezing bag with freezing clamps. Laboratory analysis DNA extraction for the faecal samples was performed using QiaAmp DNA Stool Mini Kit (Qiagen) following the manufacturer’s protocol. One negative extraction control (without DNA) was added to the 14 faecal samples. Two different extractions was performed; A) 0.18-0.22 g of the wet tissue was sliced and directly used for extraction; B) the faecal sample was first air dried 6 hrs in a fume hood to evaporate the ethanol, then oven dried 30min in 105°C and grained in a mortar to a fine powder and finally weighed 0.18-0.20g of the dry tissue for extraction. In the latter, the same mortar was used for all the samples and after the final sample 2 ml of double distilled water was put in the mortar and grained for 2 minutes to be used as a negative control confirming the cleaning procedure. After the extraction B), the extracted DNA was precipitated by adding NaOAc to a final concentration of 0.3M, adding 2,5 volumes 96% ethanol, cooled on ice for 30 min, centrifuged 10 min at 15000g and decanted supernatant. The remaining pellet was washed by adding 1 ml 70% ethanol, centrifuged 10min at 15000g and decanted supernatant. Washing was repeated three times. The pellet was then dried and re-suspended in 0.2 ml Quagien buffer AE. The samples were genotyped for five microsatellite markers (FCA026, FCA126, FCA232, FCA506 and F115) constructed for domestic cats (Menotti-Raymond et al. 1999). Polymerase chain reactions (PCR) amplifications were performed in 10µl reactions. Each reaction tube contained: 4 μl DNA, 1 μl 10 X PCR buffer (Quiagen), 0.8 μl (25 mM) MgCl2, 1 μl (10 mM) dNTP´s, 0.08 μl (5u/μl) Hot Star TAQ-Polymerase (Quiagen), 0.05 μl (1mg/ml) bovine serum albumin (Quiagen), 0.4 μl (10μM) primer F, 0.4 μl (10μM) primer R and 2.27 μl ddH2O. Amplification conditions were as follows: initial denaturation at 94°C for 10 min, followed by 35 cycles of 94°C for 30 s, 52°C for 45 s and 72°C for 1 min, followed by a final extension at 72°C for 10 min. The PCR products were visualized using an ABI 377 instrument (Applied Biosystems)

4 (12)
and analyzed using GENESCAN and GENOTYPER software (Applied Biosystems). Pre- and post-PCR work was conducted in different laboratories. Data analysis The probability of identity for genotypes from the study population (PI) was calculated to assess if the number of markers in the study was large enough to separate the different individuals. The leopards may be related to some extent, therefore the probability of identity for siblings (PIsibs) was calculated (Taberlet and Luikart 1999):
PIsibs = 0.25 + (0.5Σp2i) + [0.5(Σp2
i)2] - (0.25Σp4
i)
where pi is the frequency of the ith allele. The faeces were grouped according to quality (age) to check if this had any effect on the success in DNA amplification using the Mann Whitney U-test. Biomass and carrying capacity calculations Biomass of wild and domestic animals was calculated using mean body masses from Coe et al. (1976) unless indicated in table 1. To count for young individuals of large animals half of the average adult body mass was calculated. The estimated number of wild animals at the time of the study was given of the director and former ranch owner whom has followed the prey populations by sightings over more than five decades. Hayward et al. (2007) found a strong relationship between leopard density and the preferred prey species biomass and preferred prey weight range biomass, they considered this their best method of predicting carrying capacity for leopard. The preferred prey species was limited to impala, bush buck and bush duiker, and preferred prey weight ranged between 10-40kg (Hayward et al. 2007). Species used for preferred prey weight range calculation are presented in table 3. The predicted carrying capacity expressed as leopard density (D) in individuals km-2 was calculated (Hayward et al. 2007):
log10 D = -2.248 + 0.405log10xsp where xsp is the preferred prey species biomass in kg km-2, and log10 D = -2.455 + 0.456log10xwr where xwr is the preferred prey weight range biomass in kg km-2.
Results Field results 11 days of tracking in the field was used, between the 25 October and the 13 November 2007. The total distance of tracking was 360,6 km (figure 1). In total 100 signs was found; 71 faeces, 5 sets of prints, 5 scratch marks, and 19 carcasses. The total number of leopard signs per distance was 28 signs per 100km and number of faeces was 20 faeces per 100km.

5 (12)
Percentage of faeces found in or less than 1m from the trail or road was 89%. The questionnaire included 162 interviewed people who stated a total of 3945 goats to the disposal of 77 owners in the vicinity to Sangare RC which gives an average of 51.2 goats per owner. In total 219 skeletons from goats were reported, which gives a loss rate of 5.3 percent. This represents kills of goats mainly during daytime since goat herders reported to mainly have lost them during herding. Goats are kept in closed environment during night time that offers various protections against predation. Biomass and carrying capacity
A total biomass of 18424 kg km-2 was estimated on Sangare RC, when excluding large prey usually avoided by leopard such as adult: buffalo, eland, giraffe and cattle, it remained a biomass of 3769 kg km-2 directly available for leopard (table 1). The carrying capacity in Sangare RC using preferred prey species method was 9.1 individuals 100km-2, while using the preferred prey weight range resulted in 8.7 individuals 100km-2. Using the preferred prey weight range for calculating the carrying capacity in the vicinity to Sangare RC resulted in 19.7 individuals 100km-2. In the calculation of carrying capacity for leopard the biomasses presented in table 3 was used. Extraction method When viewing the graphs produced in GENOTYPER software the extraction method B produced less noise and a visually more distinct allelic peak graphs compared to the extraction A. Quality of faeces, genetic markers and individual identification 14 of the 71 leopard faeces were recognized to be less than three days old and sampled for DNA analysis (figure 1). Complete genotypes for all five microsatellite markers was obtained from eight faecal DNA extracts, while 4 faecal DNA extracts genotyped for four various markers and two faecal DNA extracts genotyped for three markers (Table 2). Allelic dropout rate was 11.4% excluding possible false homozygote. Of the 14 samples, two were identically genotyped for all five loci and determined to originate from the same individual. The remaining twelve samples could all be differentiated from each other, resulting in 13 individual leopards (Table 2). The probability of identity for siblings (PIsibs) was 0.0066, therefore the five selected loci seem to have enough power to differentiate between most individuals in the area. The age of the sample showed no difference in DNA amplification success (U=21.0; p=0.76) between fresh (<1 day old) and relatively fresh (1-3 days old) faeces samples. All controls were negative. Discussion The proportion of faeces found at a maximum distance of 1 m from the trail or road (89%) was high and the overall proportion of faeces (71%) to other signs was also high. We therefore suggest that a following study may limit the search to trails and roads scanning up to one meter aside to efficiently reduce time and costs. The questionnaire used in the study

6 (12)
was simple with two direct questions to minimize the error that might result by misunderstanding, suspicion towards the interviewers aim, and the risk of including goats lost by theft or irresponsible herding blamed on the leopard, which often may be the case. The loss for a farmer with 51 goats (average in this study) over a period of 11 months is 2.7 goats, or, expressed in monetary terms 54 Euro, at a market price of 20 Euro per goat by the time of the study. Faeces in environments with high temperature and humidity degenerates and a way to minimize costs for DNA analysis is to focus the study on higher quality samples. The quality of maximum 3 days old sample in this study showed a high DNA amplification success and an allelic dropout rate which falls within the range of other studies of large cats (Ernest et al. 2000). There was no difference between fresh and relatively fresh samples which indicates they are both suitable for sampling. 1-6 leopards were theoretically expected to range in this relatively small size conservancy (table 4) therefore five markers were initially considered to be enough to differentiate between siblings. Although the number of identified individuals was higher (13 individuals) than expected, calculations of PI indicated that the five markers were sufficient to differentiate individuals even between siblings. Allelic dropout may have caused the homozygocity results but does not affect the differentiation between individuals since different alleles still was obtained. The five markers had in an earlier study by Spong et al. (2000) shown a higher allelic diversity and amplification success than other markers used and therefore selected in this study. The visibly better result of extraction method B in this study can be recommended in future studies.
The biomasses found in Sangare RC directly available to leopard in table 1 (3769 kg km-2) is higher than the biomass directly available to leopard in a similar livestock ranch in Laikipia, approximately 60 km north of Sangare RC, at 988 kg km-2 estimated by Mizutani and Jewell (1998) where the density was 12,5 leopards 100 km-2. A hypothetical interpolation of these figures allows 3.8 times higher density in Sangare RC to Laikipia which would be 47.5 leopards 100 km-2, an unrealistic figure but still an indication that the Sangare RC has a capability of high density of leopard. The predicted carrying capacity for leopards in Sangare RC (8.7-9.1 leopards 100 km-2), densities in table 4 and the figures above indicates that all of the 13 identified leopards are not resident in Sangare RC. Further looking into the vicinity to Sangare RC, a biomass of 6875 kg km-2 was found available to the leopard (table 3) explained by the many goats grazing in this type of land utilization and a loss rate of 5,3% goats indicates that predation does occur and that the vicinity represents a food source for leopards. Stander et al. (1997) found that female leopards with cubs had the highest foraging returns (2.45 kg km-1 day-1) compared to single females (0.28 kg km-1 day-1) and males (0.35 kg km-1 day-1). One female leopard was reported to be sighted a few hundred meters outside Sangare RC at the eastern border at the time of the study, an example of a situation that may effect in predation pressure of goats in the vicinity. The predicted carrying capacity calculated for in the vicinity (19.7 individuals 100 km-2) is practically too high since the goats are not available to the leopard during night, which is the main hunting time for the nocturnal animal. Daytime they are close to humans during herding which probably repel the hunting of goats compared to other prey, still the figure indicate the potential of prey reserve that may be exploited by leopards. Further, the
7 (12)
occurrence of 13 individuals identified in Sangare RC is a remarkably high number in comparison to density studies (table 4) where a maximum density of 30.3 leopards for 100 km2 was determined in thick riverine forest in Krueger national park (Bailey 1993). In Sangare RC the many rivers cut down in the bedrock have created valleys with similar habitat and suggests that Sangare RC may be on the higher scale of density range. Bailey (1993) concludes that the land occupancy of leopards can be described as three layers of home ranges, where resident females have the most important layer of home ranges. The second layer of larger home ranges of males overlay the mosaic of female’s home ranges. The third layer constitutes the most undetermined home ranges occupied by transients that may be young leopards that have not yet dispersed from their natal home ranges or leopards temporarily passing through to find vacancies. Marker and Dickman (2005) suggested that home range may overlap by up to 70%, and the leopard may use half at a time. Sangare RC can from this perspective be included in several home ranges; numerous studies report home ranges (table 5) larger than the area of Sangare RC. In rainy season, which was the case for the study, movements for leopard are higher (Marker and Dickman 2005). Hunting grounds are favourable in Sangare RC, and a study by Balme et al (2007) shows that the greatest chance of a kill taking place was in habitats with medium woody cover levels, a habitat comparable to the one in Sangare RC. The Aberdares and Mt Kenya account for large, unique intact and protected African highland habitats for wild animals, and considering the plain in between, where Sangare RC is situated approximately in the middle, the total distance between the very edges of forest between Aberdare National Park and Mt Kenya Reserve is merely 18 km, a distance sometimes ranged by a leopard over one night (Hamilton 1976 in Kingdon 1977). The geographic location of Sangare RC, Solio Game Reserve and Aberdare Country Club makes them parts of an imaginary fragmented corridor where leopards can move over islands of preferred habitat, surrounded by hostile environment of cultivated landscape still providing a relatively large prey source of livestock. Therefore, it is possible that a concentration of ranging leopards occurs to preferred habitats, such as Sangare RC. A concluding suggestion is that Sangare RC has a position where habitat suitability, available prey biomass, home range overlapping and transient movement of leopards from the region contributes to the high number of identified leopards in this study. The importance of this area as a conservancy is highlighted in this perspective, and it should be encouraged to other private landowners in the region to protect land for wildlife so that a true corridor could be formed between the two large forest areas of Aberdare NP and Mt Kenya for sustainability of the whole ecosystem. The conservancy setup and management method in Sangare RC can serve as an example for future private conservancies. It is important to minimize conflicts with neighbouring livestock owners (Mizutani et al. 2005). Kolowski and Holekamp (2006) found that different methods of how the herding of livestock is carried out had impact on the rate of loss. Livestock carefully attended by a group of herdsmen had lower loss to predators than livestock herded by young boys with various intensity in herding; the latter is often the case in reality. Education on the benefits of proper herding of the goats may therefore significantly reduce the loss of livestock to predators. This is an example of a simple method that can be implemented; the most important is to keep a continuous dialogue between the wildlife conservancies and surrounding livestock and land owners.

8 (12)
The cost of this study was purposely kept at a minimum to set an example of what a survey like this may cost to carry out. The costs for extracting DNA from faecal samples, genotyping and amplifying 5 microsatellite markers and finally analyzed and evaluated was in a quotation by a Swedish commercial company available at 200 euro per sample, at 14 samples. 3 people used 11 days of tracking in the field and one GPS. Additional 5 days were used by 2 people conducting interviews in the vicinity. Assuming that the knowledge to organize a survey such as this one is available for free, the total estimated cost is approximately 3450 euro divided in 650 euro in labour and 2800 euro for 14 DNA analyzes. The cost of casualty labour in Kenya for one tracker is estimated at 15 euro a day including food and staying in a tented temporary camp by the time of the study. Considering that this study suitably is followed up by future monitoring by relating frequency of signs to this primary study over a period of 5-10 years, it becomes more cost efficient. This study sets an example that it is possible for a small size conservancy to obtain a survey of leopards investigating their individual occurrence, carrying capacity and predation pressure on livestock in the vicinity to a relatively low cost. Acknowledgements I thank professor Mats Björklund for supervision and support, Reija Dufva for laboratory support, Mike Prettejohn for valuable information and generous hospitality in Kenya and Kenya Wildlife Service for cooperating in the study. References Bailey TN (1993) The African leopard: ecology and behaviour of a solitary felid. Columbia University Press, New York Balme G, Hunter L, Slotow R (2007) Feeding habitat selection by hunting leopards Panthera pardus in a woodland savanna: prey catchability versus abundance. Animal Behaviour 74:589-598 Cavallo JA (1990) Cat in the human cradle. Natural History 2:52-61 Coe MJ, Cumming DH, Phillipson J (1976) Biomass and production of large African herbivores in relation to rainfall and primary production. Oecologia 22:341-354 Ernest HB, Penedo MC, May BP, Syvanen M, Boyce WM (2000) Molecular tracking of mountain lions in the Yosemite Valley region in California: genetic analysis using microsatellites and faecal DNA. Molecular Ecology 9:433-441 Edwards DC, Bogdan AV (1951) Important grass plants of Kenya. Sir Isaac Pitman & Sons Ltd., Nairobi Hayward MV, O’Brien J, Kerley GIH (2007) Carrying capacity of large African predators: Predictions and tests. Biolological Conservation 139:219-229 Henschel P, Ray J (2003) Leopards in African Rainforests: Survey and Monitoring Techniques. WCS Global Carnivore Program IUCN (10
th April 2008) Red list of threatened species; Panthera pardus.
[http://www.iucnredlist.org/search/details.php/15954/all]
9 (12)
Kingdon J (1977) East African mammals, an atlas of evolution in Africa, volume III part A (carnivores). Academic Press, London, pp 360 Kingdon J (2003) The Kingdon field guide to African mammals. A&C Black Publishers Ltd., London Kolowski JM, Holekamp KE (2006) Spatial, temporal, and physical characteristics of livestock depredations by large carnivores along a Kenyan reserve border. Biological Conservation 128:529-541 Marker LL, Dickman AJ (2005) Factors affecting leopard (Panthera pardus) spatial ecology, with particular reference to Namibian farmlands. South African Journal of Wildlife Research 35:105-115 Menotti-Raymond M, David VA, Lyons LA (1999) A genetic linkage map of microsatellites in the domestic cat (Felis catus). Genomics 57:9-23 Ministry of Agriculture, Kenya (1980) Agro-Climatic Zone Map of Kenya, Kenya Soil Survey, Ministry of Agriculture, Republic of Kenya Mizutani F (1999) Biomass density of wild and domestic herbivores and carrying capacity on a working ranch in Laikipia District, Kenya. African Journal of Ecology 37: 226-240 Mizutani F, Jewell PA (1998) Home-range and movements of leopards (Panthera pardus) on a livestock ranch in Kenya. Journal of Zoology 244:269-286 Mizutani F, Muthiani E, Kristjanson P, Recke H (2005) Impact and value of wildlife in pastoral livestock production systems in Kenya: possibilities for healthy ecosystem conservation and livestock development for the poor. In: Osofsky SA, Cleaveland S, Karesh WB, Kock MD, Nyhus PJ, Starr L and Yang A (editors) (2005) Conservation and development interventions at the wildlife/livestock interface: implications for wildlife, livestock and human health. IUCN, Gland, Switzerland and Cambridge, UK, pp 121-132 Norton PM, Henley SR (1987) Home range and movements of male leopards in the Cedarberg Wilderness Area, Cape Province. South African Journal of Wildlife Research 17:41-48 Nowell K, Jackson P (editors) (1996) Wild cats: status survey and conservation action plan. IUCN, Gland, Switzerland, pp 24-30 Snow DW, Perrins CM (editors) (1998) The birds of the western Palearctic. Oxford University Press, New York, 1:479-480 Spong G, Johansson M, Björklund M (2000) High genetic variation in leopards indicates large and long-term stable effective population size. Molecular Ecology 9:1773-1782 Stander PE, Haden PJ (1997) The ecology of asociality in Namibian leopards. Journal of Zoology, London 242:343-364 Taberlet P, Gordon L (1999) Non-invasive genetic sampling and individual identification. Biological Jounal of the Linnean Society 68:41-55 UN (14
th March 2008) Population Division of the Department of Economic and Social Affairs of the United
Nations Secretariat; World population prospects; Kenya; Population by sex; Medium variant [http://esa.un.org/unpp] Woodroffe R (2000) Predators and people: using human densities to interpret declines of large carnivores. Animal Conservation 3:165-173

10 (12)
Woodroffe R, Ginsberg JR (1998) Edge effects and the extinction of populations inside protected areas. Science 280:2126-2128 Table 1 Wildlife and livestock biomass on the Sangare Ranch Conservancy
References: [1]Director Sangare Ranch Conservancy [2]Personal communication with local veterinaries [3]Kingdon 2003 [4]Hayward et al. (2007) [5]Snow DW and Perrins CM (1998)
Common name
Body mass (kg) Individuals Total biomass (kg km
-2)
Biomass available to leopard (kg km
-2)
Giraffes adult 750 10 375 Giraffes young 375 2 37,5 37,5 Cattle adult, Sangare breed
650 [1] 320 10400
Calves, Sangare breed 325 80 1300 1300 Buffalo adult 450 48 1080 Buffalo calves 225 12 135 135 Eland adult 340 80 1360 Eland young 170 20 170 170 Zebra adult 200 80 800 Zebra young 100 20 100 100 Waterbuck adult 160 80 640 Waterbuck young 80 20 80 80 Goats, Sangare breed 55 [2] 183 503 503 Bush pig 54 12 32,4 32,4 Warthog 45 12 27 27 Impala 40 400 800 800 Bushbuck 30 75 113 113 Bush duiker 18 [3] 50 43,8 43,8 Thompsons 15 100 75 75 Stray dogs in Sangare 15 [2] 10 7,5 7,5 Baboon 12 [4] 100 60 60 Steinbuck 12 [3] 6 3,45 3,45 Suni 5 [3] 12 3 3 Cape Hare 4 500 100 100 Rock hyraxes 3,6 [3] 500 90 90 Tree hyraxes 3 [3] 500 75 75 Guinea fowl, Helmeted 1,4 [5] 200 14 14
Total 18424 3769

11 (12)
Table 2 Genotypes obtained from the survey grouped by individuals and number of times (N) they were obtained
Individual FCA026 FCA126 FCA232 FCA506 F115 N
1 138/150 152/158 121 0 188/194 1 2 138/150 138 108/112 0 213 1 3 136/148 136/140 116/118 196 215 1 4 138/150 146/152 116/118 190 190/192 1 5 138/150 158 0 196 196 1 6 138/150 152/158 112/114 194 188/194 1 7 138/150 151/157 116/118 188/190 198/200 2 8 0 0 117/119 190/194 195/213 1 9 0 0 116/118 194/196 200/216 1
10 138/152 146/150 116/118 194/196 195/213 1 11 138 137/141 119 200 0 1 12 138/148 136 117/119 196/200 197/215 1 13 138/150 151/157 116/118 188/194 190/196 1
No of alleles 5 11 8 5 12
Missing data are represented by 0 Table 3 Available prey biomass (kg km
-2) to leopard according to Hayward et al 2007 derived from data
presented in Table 1
Common name Preferred species biomass in Sangare RC
Preferred prey weight range biomass in Sangare RC
Preferred prey weight range biomass in the vicinity
Warthog 27 Impala 800 800 Small East African Goat [1]
6575
Bushbuck 113 113 Bush duiker 44 44 Thompsons 75 Stray dogs in Sangare 8 Stray dogs in vicinity [2] 300 Baboon 60 Steinbuck 3
Total 956 1129 6875
[1]Body mass 25Akg and 3945 individuals [2]Body mass 15
Akg and 300
B individuals
References: APersonal communication with local veterinaries.
BEstimations by the author (H.S.)
Table 4 Leopard density (individuals 100km
-2) in other studies in similar habitat types
Study area Density Methods Sources
Lolldaiga Hills ranch, Kenya 12,5 radio telemetry Mizutani and Jewell 1998
Kruger NP, South Africa 3,5 - 30,3 radio telemetry Bailey 1993
Serengeti NP, Tanzania 3,5 sightings Schaller 1972*
Serengeti NP, Tanzania 4,7 sightings Cavallo 1993*
*in Nowell and Jackson 1996
12 (12)
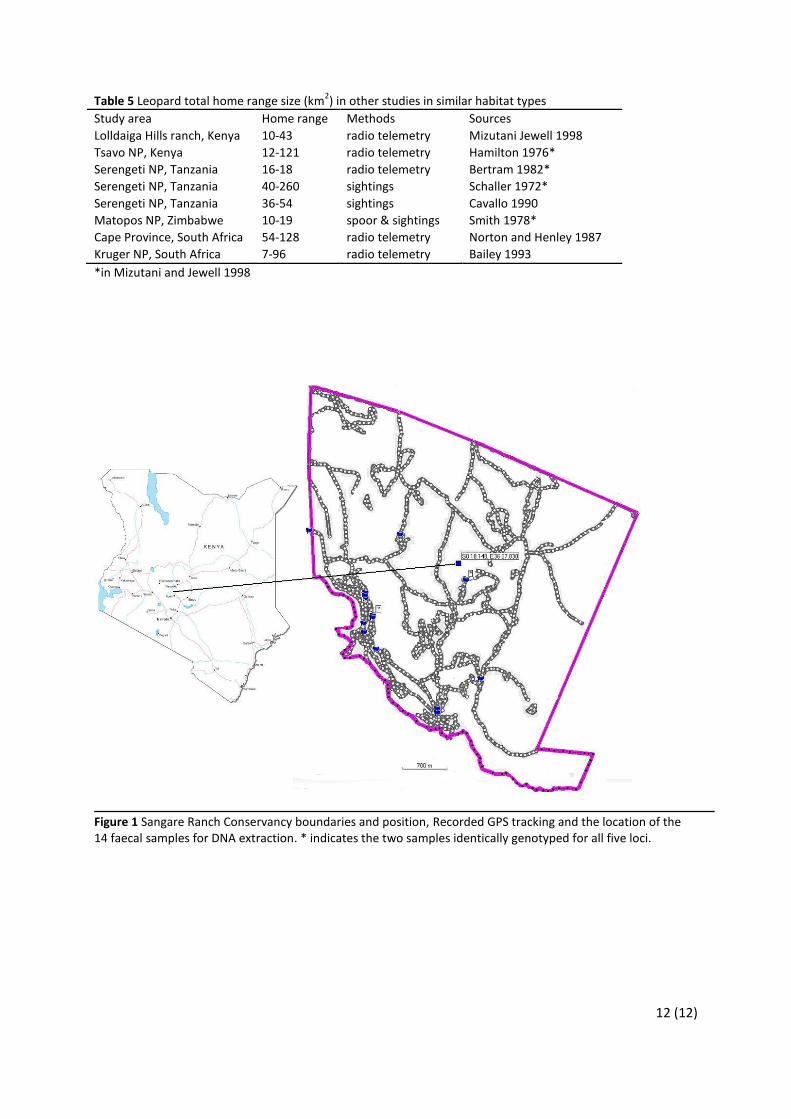
Table 5 Leopard total home range size (km2) in other studies in similar habitat types
Study area Home range Methods Sources
Lolldaiga Hills ranch, Kenya 10-43 radio telemetry Mizutani Jewell 1998
Tsavo NP, Kenya 12-121 radio telemetry Hamilton 1976*
Serengeti NP, Tanzania 16-18 radio telemetry Bertram 1982*
Serengeti NP, Tanzania 40-260 sightings Schaller 1972*
Serengeti NP, Tanzania 36-54 sightings Cavallo 1990
Matopos NP, Zimbabwe 10-19 spoor & sightings Smith 1978*
Cape Province, South Africa 54-128 radio telemetry Norton and Henley 1987
Kruger NP, South Africa 7-96 radio telemetry Bailey 1993
*in Mizutani and Jewell 1998
Figure 1 Sangare Ranch Conservancy boundaries and position, Recorded GPS tracking and the location of the 14 faecal samples for DNA extraction. * indicates the two samples identically genotyped for all five loci.