lending for growth? an analysis of state-owned banks...
TRANSCRIPT
Working Paper 2013:19 Department of Economics School of Economics and Management
Lending for Growth? An Analysis of State-Owned Banks in China Fredrik N.G. Andersson Katarzyna Burzynska Sonja Opper June 2013

1
Lending for Growth?
An Analysis of State-Owned Banks in China
Fredrik N.G. Andersson
Lund University
Katarzyna Burzynska
Lund University
Sonja Opper
Lund University
Abstract
This paper provides the first comparative analysis of different types of publicly owned banks
operating in China between 1997 and 2008. Using principal component analysis and Granger-
causality tests, this study shows that China’s state-owned commercial banks and rural credit
cooperatives did not promote GDP growth during the observation period. State-owned
commercial banks even had a negative effect on growth in the manufacturing sector. By contrast,
state policy banks and joint stock commercial banks did promote domestic growth. China’s
experience presents a more nuanced picture of state banking that goes beyond the role of
ownership to consider functional and institutional differences.
Keywords: China, Banking sector, Economic growth
JEL Classification: G21; O16; P30
Corresponding author at: Department of Economics, Lund University, Box 7082, 220 07 Lund,
Sweden. E-Mail: [email protected]

2
1 Introduction
Populist accounts of China’s development model often refer to government sponsored
“superbanks” as the engine of the country’s growth model (Anderson and Forsythe, 2013).1
Indeed, with heavy state ownership of financial institutions and far-reaching control rights,
government officials and politicians in China enjoy substantial leeway in influencing the
allocation of a rapidly growing pool of financial resources. Between 1997 and 2008 alone, total
bank loans grew by 260% in real terms, while GDP grew by 180% over the same period.
Particularly large-scale, partly or fully state-owned corporations and multinationals seem to enjoy
competitive advantages via subsidized loans readily supplied by government-owned banks.
A rapid increase in bank lending, however, does not necessarily imply a positive causal
relationship between banking activities and economic growth. The causality may also move in
the opposite direction, as a growing economy also generates a higher demand for credit. In the
absence of functioning financial markets, credit and economic growth may even be causally
1 Theoretical arguments supporting a positive finance-growth nexus draw on a broad theoretical
literature interpreting government-owned banks as a convenient tool to spur economic
development and alleviate poverty (Banerjee, 2003; Burgess and Pande, 2003) by channeling
household savings into productive investments (Gerschenkron, 1962; Stiglitz, 1994; Hausman
and Rodrik, 2003; Adrianova et al., 2008), lower interest rate risks and greater financial stability
(Demirguç-Kunt and Detragiache, 1998; Reinhart and Kaminsky, 1999), an absence of excessive
risk taking by bank managers (Akerlof and Romer, 1993; Demirguç-Kunt and Detragiache,
1998), and an increased effectiveness of monetary policy instruments, such as expansive
measures to push the economy out of a recession (Micco and Panizza, 2006; Yeyati et al., 2007).

3
unrelated. Given China’s economic success, it is crucial to pin down the actual nature of the
finance-growth nexus. This is all the more important, as China has emerged as a role model for
many other developing economies following a state-capitalist reform path.
Notwithstanding vast research efforts, the empirical evidence on China’s finance-growth
nexus is not only inconclusive (Aziz and Duenwald, 2002; Boyreau-Debray, 2003; Liang and
Teng, 2006; Hasan et al, 2009; Liang, 2005; Hao 2006; Rousseau and Xiao, 2007; Cheng and
Degryse, 2010) but also neglects the institutional and functional heterogeneity of China’s state
banking sector. This invites serious identification problems regarding the question of which types
of state banks and lending strategies – if any – are in fact growth promoting.
Prior work on bank profitability has convincingly demonstrated the organizational
heterogeneity of China’s banking sector. There is broad empirical support for a substantial
efficiency gap between traditional state-owned commercial banks and joint stock commercial
banks, which involve different degrees of institutional and private ownership (Fu and Heffernan,
2007; Shih et al., 2007; Ariff and Can, 2008; Berger et al., 2009; García-Herrero et al., 2009; Lin
and Zhang, 2009). Similarly, there is strong evidence suggesting differences in non-performing
loans and loan default rates. Shifting to a disaggregated analysis of the finance-growth nexus is
therefore a logical extension of the work that has been conducted at the micro-organizational
level. This type of disaggregated analysis not only provides a more nuanced answer to the
question of whether bank lending in China is growth promoting. Our empirical strategy of
exploring the distinct roles of various government-owned policy banks and commercial banks
also promises empirical insights in response to the more general question of which – if any -
financial tasks government can successfully accomplish through bank ownership. In contrast to
cross-country studies, our approach benefits from a relatively homogenous external environment,

4
administered by the same government, and characterized by shared historical roots, language, and
cultural values.
We construct a novel dataset to analyze the effect of bank lending on various measures of
economic growth for the period from 1997 to 2008. Using Granger causality tests, we separately
analyze the effects of total lending, short term lending and long term lending. Our results provide
a fairly mixed account, which strongly undermines the generally held view that the country’s
state commercial banks are successfully employed to promote economic growth. Among the
various financial institutions under review here, only traditional policy banks and partly state-
owned joint stock commercial banks are growth promoting. Lending by the dominant state-
owned commercial banks, which still hold more than 50% of loans and assets, reduces growth in
the short run. Moreover, the lending activities of rural credit cooperatives led to an overall
decline in growth, although we find positive growth effects for agricultural production. However,
these are outweighed by negative effects in other sectors. Overall, our results underline the
importance of a more fine-grained approach to the study of state-owned banks and their potential
developmental role. Institutional and functional features apparently combine to shape different
lending strategies, which do not invite general conclusions on the either positive or negative role
of government in lending decisions. If anything, our research would suggest that government
lending can be growth promoting, if the contextual features are appropriate.
The remainder of the paper is organized as follows: Section 2 provides a summary account
of China’s banking sector, highlighting the major institutional and functional differences between
the four most important types of banking institutions. Section 3 describes our data and
methodology. Section 4 moves on to a disaggregated analysis and discussion of the observed
finance-growth effects, and section 5 presents the study’s conclusions.
5
2 Organizational diversity in China’s banking sector
Behind the façade of a state-dominated banking system, a portfolio of relatively diversified
financial institutions characterized by different degrees of state and public ownership has
evolved. While it is beyond the purpose of our study to discuss each financial intermediary in
detail, it seems essential to highlight at least some of the key institutional differences and the
functional diversity of banking in China, to substantiate our advocacy of a disaggregated
analytical approach.
We include four types of banking institutions that dominate the financial landscape in our
analysis: These are state policy banks (PBs), the key provider of policy loans, state-owned
commercial banks (SOCBs), which still held a dominant market share of 43% of total loans by
the end of our observation period in 2008, followed by joint stock commercial banks (JSCBs),
and rural credit cooperatives (RCCs). All four institutions jointly held 83% of financial assets and
nearly 85% of total loans in 2008 (Almanac of China's Finance and Banking, 2009).2 While all
financial institutions are subject to state guidance and political intervention, they are distinct
organizational units operating under different formal institutional incentives and constraints. The
diversity of these banking institutions is reflected in the differentiated set of domestic regulations
and supervisory rules guiding banking activities in China. In the most general sense, one can
2 These institutions' market positions also remained relatively unaffected by new market entrants,
such as foreign banks (Berger et al., 2009). As of 2010, years after the entry of foreign banks into
the Chinese market, these foreign banks still held less than 2% of China’s banking assets (China
Banking Regulatory Commission, 2010).

6
differentiate between banks solely responsible for the provision of policy directed loans,
resembling the concept of traditional development banks, and those providing commercial loans.
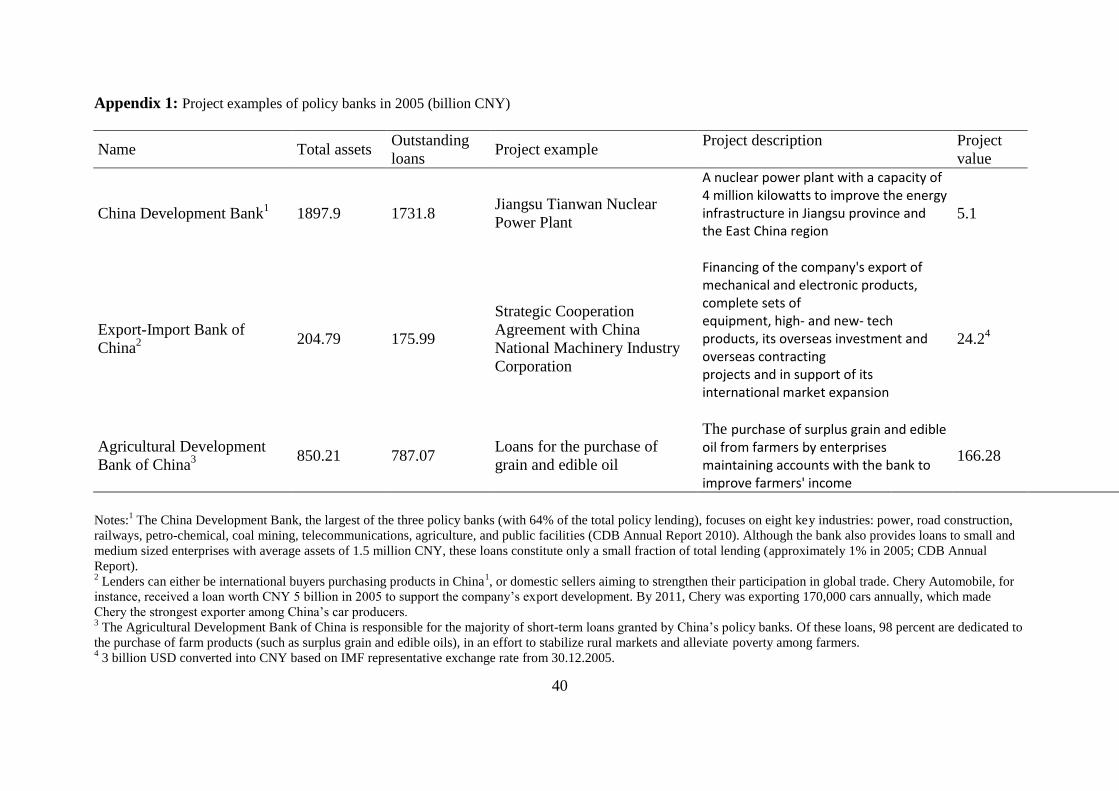
The provision of policy loans is the responsibility of three different state policy banks,
which are organized around distinct economic activities. These are the Agricultural Development
Bank (ADB), the China Development Bank (CDB), primarily responsible for infrastructure
projects, and the Export–Import Bank of China (Exim). Given their prominent strategic role, PBs
are fully state-owned entities under tight political regulation and guidance.3 All three policy
banks finance large capital construction projects, typically in the range of 0.5 to 10 billion CNY,
mostly with medium- to long-term maturity. In line with the functional specialization of the three
different policy banks, the purpose of the funding varies widely (see Appendix 1 for example
loans).
Regarding commercial lenders, the Commercial Banking Law (1995) holds all lenders
responsible to lend “in accordance with the needs of the national economic and social
development and under the guidance of the industrial policies of the State” (Art 34). The actual
degree of political intervention and closeness of state bank relations, however, varies
substantially and in keeping with differences in the degree of state ownership. China’s four
SOCBs, which provide the lion’s share of commercial loans, are the most exposed to political
guidance and ad-hoc intervention (Cull and Xu, 2003). Although stock listings after 2005 put an
end to complete state-ownership, political control over commercial banking persists thanks to the
3 This is also reflected in the choice of geographic locations. The number of branches is small and
limited to centrally administered cities and provincial capitals. Locations typically coincide with
provincial offices of the China Banking Regulatory Commission, the country’s banking
supervisory body.

7
continued majority holdings of the state.4 Similar to the potential losses resulting from policy
lending (Art 41 of The Commercial Banking Law), loans are de facto guaranteed by the state
(Chiu and Lewis, 2006).5
Although the younger joint stock commercial banks also have some state ownership, the
degree of state involvement is on average smaller (Shih et al., 2007; Garcia-Herrero et al., 2009).
State ownership ranges in most cases from between 15 and 25%. State shareholding only plays a
stronger role in two of the JSCBs (at 48 and 62%; see Appendix 2 for details). Given the lower
degree of state ownership, institutional and private shareholders seem more successful in
mitigating political interference. JSCBs are generally more likely to prioritize profit motives over
social or political objectives (Lin and Zhang, 2009).6 In line with their higher degree of non-state
ownership, JSCBs are – different from SOCBs - fully responsible for any non-performing loans
and face substantial bankruptcy and takeover risk.7 In line with harder budget constraints, the
4At the end of 2011, the state held 57.13% of the total shares of CCB; 67.60% of the shares of
BOC; 82.7% of the shares of ABC; and 70.7% of the shares of ICBC (annual reports of the
respective banks).
5 In the period from 1999 to 2005 alone, the state cleaned the balance sheets of China’s financial
institutions by transferring 2038.9 billion RMB worth of non-performing loans to newly
established Asset Management Companies (AMCs) responsible for loan management. Nearly
95% of this amount was directed towards SOCBs (China Financial Statistics, 2007).
6 The sole exception is China Minsheng Bank – a JSCB wholly owned by non-government run
private enterprises (Jia, 2009).
7 Internationally well documented examples were the 1998 bankruptcy of the Hainan
Development Bank (HDB) and the 2004 takeover of Shenzhen Development Bank by Newbridge

8
share of their non-performing loans is substantively smaller compared to SOCBs: 2.1% compared
to 8.0% (China Banking Regulatory Commission, 2007).
In terms of ownership, rural credit cooperatives occupy a unique position as collectively
run local banks. They are subject to considerably less state guidance than their urban
counterparts. Formally registered as publicly owned legal persons, they are run and managed by
their members, such as local investors, local governments and County RCC Unions (Ong, 2006).
While many RCCs experience various forms of government interference through local party
secretaries and the County RCC Unions, they are believed to be politically more independent
than SOCBs and JSCBc due to a greater administrative distance from the central and provincial
governments (Ong, 2006; Gao, 2012).8 As in the case of JSCBs, RCCs are held accountable for
their individual profits and losses and face considerable bankruptcy risk (Garcia-Herrero et al.,
2006).9 Nevertheless, given their strict limitation to local business lending, business operations
are critically constrained.
A review of the distinct lending strategies reveals striking commonalities. All commercial
banks favor short-term loans with maturities of up to one year. This limits opportunities for
Capital, a US investment firm (Podpiera, 2006). However, in the case of HDB, all deposits were
guaranteed by the government (Jia, 2009).
8 Central supervision is rather indirect, as only the so-called RCC Unions are placed under the
direct supervision and administrative responsibility of the Central Bank.
9 See, for instance, RCCs Regulation on the Administration of RCCs (1997) and Regulation on
the Administration of County-level RCC Unions (1997). As the evaluation criteria of County
RCC Unions primarily focus on financial performance, the grassroots RCCs are motivated to
maximize profit and the efficiency of capital.

9
major, large-scale technical investments with longer amortization periods. Short-term loans are
predominantly used to bypass liquidity constraints and finance working capital. Only SOCBs
have a substantial proportion of medium-term loans, representing 40.7% of their loan portfolios
(see table 1). However, even for medium-term loans, the majority of lending is for purposes other
than capital construction or technical improvements, with the latter only receiving 4.9% of the
total SOCB loans granted between 1997 and 2005. Borrowers are traditional state-owned
companies, corporatized state-owned firms, and partly privatized joint stock companies operating
in the manufacturing and commercial sectors.10
In line with the smaller degree of political
interference and greater scope of organizational autonomy, JSCBs tend to lend to a somewhat
greater extent to small-scale state owned enterprises (SOEs) not prioritized by political leaders.
Lending to the newly founded private enterprises operating in the industrial and commercial
sector remains limited (see table 1; see also Yan et al., 2007; Sufian, 2009). Nevertheless, JSCBs
extend substantively more short-term loans for “other” purposes. Such consumption and
investment loans typically benefit private individuals and households, but are also provided to
small-scale household enterprises and businesses. Finally, based at the village, township and
county levels, and geographically confined in their market access, RCCs primarily cater to the
financial needs of local farmers, small-scale township and village enterprises, small-scale
individual and private manufacturing companies, and rural supply and marketing cooperatives.
10
While precise data on the ownership structure of customers is scarce, the information available
for the China Construction Bank provides a good indication of the general trend among the
SOCBs. Here, SOEs hold approximately 50% of outstanding loans, while joint stock enterprises
make up 20% and private enterprises receive only 10-15% of total loans (CCB Annual Reports
2005 - 2007).

10
Given the relatively weak financial basis of these RCCs, the average loans are comparatively
small, the loan maturities rarely exceed one year (as indicated by an extremely large share of
short-term lending of 91%, see table 1) and the banks’ client bases are limited. Loans are granted
to finance modest organizational improvements of township-village enterprises, bridge the
seasonal liquidity constraints of households, or pay for educational expenses.
Insert table 1 about here
In summary: China’s banking sector is composed of a diversified portfolio of partially or fully
state or publicly owned financial institutions. While all financial institutions involve state or
public ownership to a substantial degree, they operate under distinct institutional incentives and
constraints. While precise measurements of individual qualities are hard to come by, the stylized
comparison provided in Table 2 summarizes some of the most important cross-organizational
differences with respect to ownership, political independence, and budget constraints.
Institutionally, JSCBs and RCCs should enjoy stronger profit incentives and greater operational
autonomy. However, functionally, the local market limitations of RCCs may well outweigh these
advantages. PBs and SOCBs, in contrast, enjoy very limited operational autonomy, and weaker
profit incentives, which suggests the existence of standard problems of corporate governance and
soft budget constraints that are also observed for state-owned firms in the manufacturing and
service sectors (Boardman and Vining, 1992; Megginson et al., 1994; Shleifer, 1998; Dewenter
and Malatesta, 2001).
Clearly, this stylized illustration underscores our argument for a disaggregated review of
the distinct linkages between lending activities and growth performance in China. Our working

11
hypothesis is that the institutional and functional diversity of state banking is associated with
different effects on economic growth.
Insert table 2 about here
3 Empirical strategy
3.1 Method
To test our hypothesis we employ Granger causality tests. Two sets of Granger causality tests are
performed: one set testing the short-run causal relationship and one set testing the long-run causal
relationship. Differentiating between the short- and long-run causal relationships is important, as
we do not have information regarding the objective functions state banks and their principals
apply. Clearly, the quality and timing of a potential finance-growth nexus depends on the
question of whether state banks aim to pursue strategic, long-term goals (which may not result in
an immediate response in terms of growth promotion) or respond to social, economic and
political needs with a focus on short-term effects.
The short-run tests are based on the following two Granger test regressions,
, and (1)
, (2)
where xit is growth in the real economy and lbt is the growth rate in real bank lending from bank-
type b, and testing whether for all j=1,…,J and for all h=1,…,H to determine
the casual relationship.11
Because we use growth rates, these tests explore the short-run
relationship. To test the long-run causal relationship, we employ Toda and Yamamoto’s (1995)
11
The lag length is chosen using the Bayesian information criterion.

12
modified Granger-causality test for non-stationary data. This test is similar to the test in equations
(1) and (2), but additional lags of the dependent and the explanatory variables are added to the
regression models to control for non-stationarity. These tests are based on estimating the two test
regressions,
(3)
, (4)
where Xit is the logarithm of the real economic measure in levels and Lbt is the logarithm of real
bank lending in levels. To control for the non-stationarity, D additional lags of the dependent and
explanatory variables are added to the test regression, where D is equal to the integration order of
the respective variables. In other words, if X and L are integrated of order 1, one additional lag of
these variables is included in the test regressions. The casual relationship is tested as for the
stationary case by testing whether for all j and for all h.
3.2 Data
We consider three different measures of bank loans: total loans, short-term loans and long-term
loans. The differentiation between short- and long-term loans is important, as short-term loans
may be more plagued by ad-hoc political intervention at the local level. Reportedly, government
officials in China are careful to avoid the social unrest often associated with rising local
unemployment levels. It has been observed, for instance, that the employment policies of state-
owned companies follow a counter-cyclical pattern, hinting at political interference to maintain
surplus employment during economic downturns (Hu et al., 2006). The inclination for politicians
and firms to lobby for short-term liquidity loans is therefore more pronounced. Long-term loans,
in contrast, are more likely to reflect strategic political interests and government mandated

13
development plans addressing the expansion of distinct priority sectors specified by China’s
medium- and long-term development plans.
The data are collected from China Financial Statistics: 1949-2005 (Financial Survey and
Statistics Department of the People’s Bank of China; 2007), which offers a unique compilation of
Chinese banking statistics not previously publicly released. The data frequency is monthly and
the data cover the period from 1997M1 to 2005M12. Although these unique data allow us to
perform a fine-grained analysis, the time period is relatively short. We therefore test whether our
benchmark results also hold for a longer time period. For this robustness exercise, we compiled
additional total loan statistics from the annual Almanac of China’s Finance and Banking. These
almanacs contain total loans to non-financial institutions, albeit only at a quarterly level.
Combined with total loans from the China Financial Statistics, this provides us with a longer
time series for total loans, which stretches from 1997Q1 to 2008Q4. The almanacs, however, do
not distinguish between short- and long-term loans, and consequently only permits a less detailed
analysis of the longer sample.12
To measure real economic activity, we rely on six different measures: GDP, agricultural
production, manufacturing production, service production, total factor productivity and capital
12
The bank loan statistics contain two breaks: one break in 2001Q1 for JSCBs and one break in
2007Q1 for RCCs. The break for JSCBs is caused by an additional bank being added to the group
of JSCB banks. The RCC break coincides with the intervention of the Central Bank, which
removed a substantial amount of non-performing loans from the RCCs' balance sheets. In parallel,
ownership reforms reduced the RCC sector from 19,348 legal entities at the end of 2006 to fewer
than 8,509 by the end of 2007. To control for these breaks, we include dummy variables in our
test regressions.

14
stock. GDP is the most commonly used measure of real economic performance in the finance-
growth literature. As individual bank lending is unevenly distributed across economic sectors, it
is not to be expected that potential growth effects would necessarily be represented in overall
GDP growth. We therefore also separately test for growth effects for agriculture, manufacturing
and services. Moreover, considering the differences between typical borrowers and in loan size
and maturity, bank loans are likely to affect growth through different transmission channels
(Bonfigioli, 2008). For example, PBs’ focus on large-scale infrastructure investments is likely to
affect capital accumulation and productivity. JSCBs and RCCs, in contrast, typically prioritize
short-term lending (see table 1), which is less likely to affect the rate of capital growth, but may
nonetheless increase productivity. By relaxing firms’ short term budget restrictions, such short-
term loans may allow for internal restructuring, the introduction of new quality control systems,
and human capital improvements. As an extension of the standard analysis, we therefore also
include capital growth and total factor productivity (TFP) in our analysis.
Differentiating between the effect of bank lending on capital growth and the effect on TFP
growth is not trivial. Although capital accumulation is important, a substantial component of
cross-country income differences is explained by differences in TFP. Increasing the rate of TFP
growth is thus crucial for developing countries to permanently close the income gap with
developed countries. However, sustained TFP growth is generally more difficult to achieve than
capital accumulation (Easterly and Levine, 2002).
All real economic variables, except TFP, are collected from Thompson Financial Statistics
Datastream. Because GDP data are only compiled on a quarterly basis, we constructed matching
quarterly observations of the lending data by using the last month of the respective quarter. All
economic variables and bank lending variables are deflated using the GDP deflator and have been
15
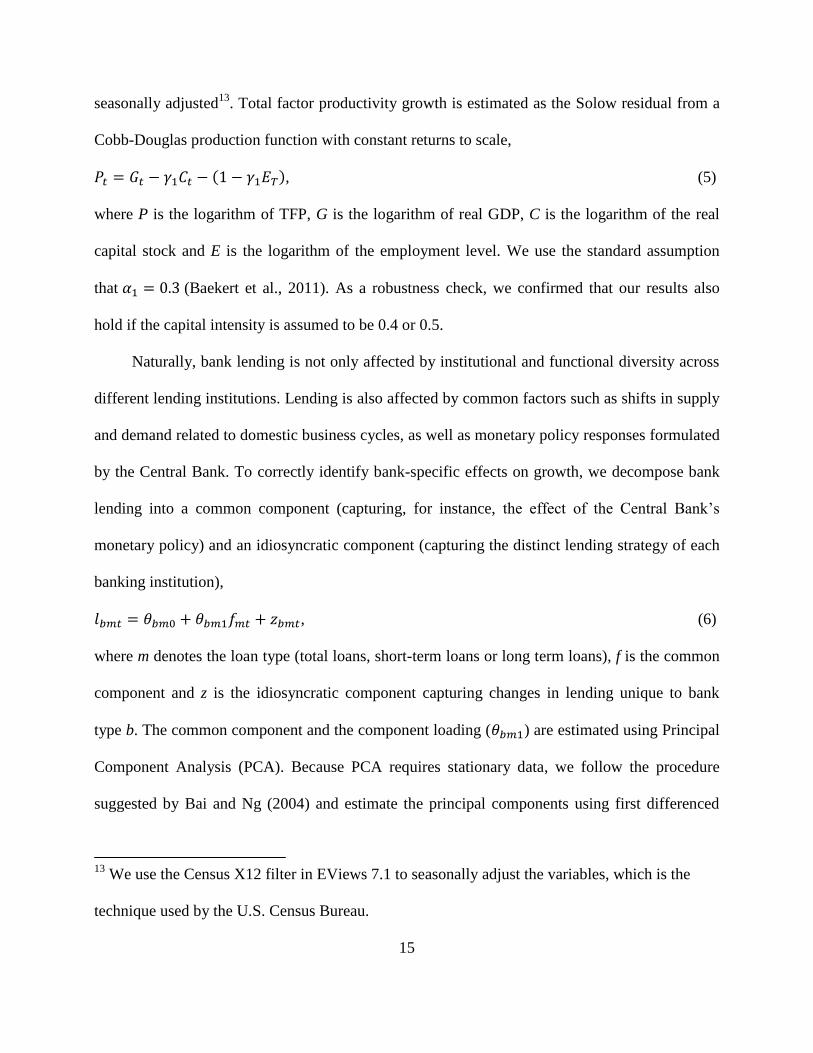
seasonally adjusted13
. Total factor productivity growth is estimated as the Solow residual from a
Cobb-Douglas production function with constant returns to scale,
, (5)
where P is the logarithm of TFP, G is the logarithm of real GDP, C is the logarithm of the real
capital stock and E is the logarithm of the employment level. We use the standard assumption
that (Baekert et al., 2011). As a robustness check, we confirmed that our results also
hold if the capital intensity is assumed to be 0.4 or 0.5.
Naturally, bank lending is not only affected by institutional and functional diversity across
different lending institutions. Lending is also affected by common factors such as shifts in supply
and demand related to domestic business cycles, as well as monetary policy responses formulated
by the Central Bank. To correctly identify bank-specific effects on growth, we decompose bank
lending into a common component (capturing, for instance, the effect of the Central Bank’s
monetary policy) and an idiosyncratic component (capturing the distinct lending strategy of each
banking institution),
, (6)
where m denotes the loan type (total loans, short-term loans or long term loans), f is the common
component and z is the idiosyncratic component capturing changes in lending unique to bank
type b. The common component and the component loading ( ) are estimated using Principal
Component Analysis (PCA). Because PCA requires stationary data, we follow the procedure
suggested by Bai and Ng (2004) and estimate the principal components using first differenced
13
We use the Census X12 filter in EViews 7.1 to seasonally adjust the variables, which is the
technique used by the U.S. Census Bureau.

16
data.14
Having estimated the common component (f) and the loadings, we then estimate the
idiosyncratic component as,
. (7)
The long run common components and idiosyncratic components are obtained by cumulating the
short-run common components and the short-run idiosyncratic components (Bai and Ng, 2004).
Both a CUSUM test and a Chow break point test reveal a structural break in the short-
run but not in long-run parameter values for JSCBs and SOCBs after 2001Q4 for the 1997Q1 to
2005Q4 sample and a break after 2003Q3 for the 1997Q1 to 2008Q4 sample. To account for this
break in our tests, we define a dummy variable that separates between the two periods. This
yields the regression,
, (8)
, (9)
where d is the dummy variable that takes the value one after the indicated break. In the Granger-
causality tests, we test jointly whether the parameters are equal to zero both before and after the
break. We also analyze the effect of the break on the banks’ abilities to promote growth.
4 Results and Discussion
4.1 The role of idiosyncratic lending over time
As the first step of our analysis, we explore the extent to which growth in lending over time
reflects idiosyncratic behavior linked to the individual financial institution and the extent to
14
The Phillips Perron unit root test shows that all variables are integrated of order 1 in levels and
of order 0 in first differences.

17
which lending patterns reflect common monetary policy and business cycle effects. Table 2
summarizes our results. Two observations stand out: First, JSCBs realized the highest quarterly
average lending growth (6.5% per quarter) between 1997Q1 and 2005Q4, which is certainly
connected with the younger organizational age of these lending institutions relative to the
SOCBs.15
For the other bank types, average quarterly lending growth varies between 1.9%
(SOCBs) and 2.4% (RCCs). Both PBs and SOCBs have exhibited slower growth in short-term
loans compared to long-term loans, while JSCBs and RCCs have increased short-term and long-
term lending at comparable rates. The observed pattern is broadly confirmed for the longer
sample: here, lending growth by JSCB reached on average 5.6%, while lending growth otherwise
remained between 1.9% (SOCBs) and 2.8% (PBs).
Second, our analysis reveals a substantive variation in the respective roles of the common
and idiosyncratic components in explaining lending growth in China. Lending by PBs is least
affected by common shocks. Depending on loan type, the common component only explains
between 3% and 18% of the variability in lending growth between 1997 and 2005. This is in line
with the distinctive role policy banks play as facilitators of large-scale, politically driven
infrastructure projects. For commercial banks, the explanatory power of the common component
is naturally higher and ranges between 40% and 60% for total lending. For JSCBs, the common
component achieves the highest explanatory power, confirming the aforementioned stronger
market orientation (and insulation from ad-hoc policy interventions) of these banks. Over time,
the common component explains a larger proportion of the variation in comparison with what the
longer sample (1995-2008) shows. However, also in the longer sample, the difference in the
15
These growth rates have been corrected for breaks in the time series in 2001Q1 (JSCBs) and
2007Q1 (RCCs).

18
degree of market orientation between JSCBs on the one hand and SOCBS and RCCs on the other
persists.
Insert table 3 about here
4.2 Short-term growth effects between 1997 and 2005
Our analysis of short-term growth effects confirms substantial differences across bank types and
loan maturities (see table 4). Regarding PBs, their total lending Granger causes both GDP and
total factor productivity growth. These effects are primarily driven by long-term loans that
causally explain GDP growth, and total factor productivity growth, whereas short-term loans only
have a temporary effect on manufacturing. For the service sector, long-term loans have a
bidirectional causal relationship with GDP. For agricultural, manufacturing, and capital growth,
total policy bank lending follows rather than precedes short-term growth, reflecting the banks’
role as a political tool employed to respond to rather than drive market development. This is most
pronounced in the case of agricultural production, which Granger causes PB lending in the form
of both short-term and long-term loans. This is clearly associated with the lending policies of the
Agricultural Development Bank of China (see Appendix 1 for details), which finances purchases
of surplus grain and edible oil production from farmers to stabilize market prices.
Lending by SOCBs, China’s major commercial lender, in contrast, does not generate any
positive short-term effects on growth with respect to total lending. Moreover, total lending
activities also do not follow economic activity, leaving the lending performance virtually
disconnected from activities in the real economy. For short-term lending, our tests suggest that
SOCB loans Granger cause negative growth effects for GDP, manufacturing production and TFP.
In other words, an increase in short-term SOCB loans reduces economic activity. This suggests

19
that SOCB lending is structured in a way that allows unproductive firms to remain in business
while crowding out loans to more productive enterprises. This is consistent with the widely
reported incidents of political interference to rescue prioritized, but ailing, large-scale state-
owned enterprises (Wei and Wang, 1997; Cull and Xu, 2003; Shih et al., 2007). The only positive
effect of SOCB loans in the short-run is in the relationship between long-term loans and
agricultural production. Because the structural break tests indicated a break in the parameters
after 2001, we also compared the parameter estimates of the period before (1997 to 2001) and
after the break (2002 to 2005). The identified short-term effects of SOCB lending, however, are
confirmed, and the negative effects of SOCB loans increased rather than decreased.16
Based on our estimations, JSCBs are the most effective among China’s commercial lenders
in terms of short-term growth promotion. Although the market share of JSCBs had only reached
20% of total loans by the end of 2005, JSCB lending Granger caused growth in GDP and
manufacturing production by strengthening both TFP growth and capital growth. Similar to the
SOCBs, the structural break test indicates a break in the short-run parameters after 2001Q4. An
analysis of the respective sub-periods shows that the positive growth effects generated by JSCB
lending increased in the latter period. In light of the rapid expansion in JSCB-lending (with an
average growth rate of 6.5%), it is reasonable to assume that growth effects have increased as the
banks’ market share gradually expands. Somewhat strikingly, the positive growth effects of total
lending are not matched by similar effects stemming either from short-term or long-term loans. A
possible explanation is that the lending portfolios of JSCBs have changed substantively over the
observation period, with a redistribution of loans toward short-term lending. Once we include an
16
Results are available upon request.

20
interaction term between short-term and long-term lending into the Granger causality regressions,
we find positive effects on growth.
Finally, RCC lending generates positive growth effects in the agricultural sector. As a
downside, however, RCC-lending also negatively Granger causes manufacturing production and
TFP growth. RCCs lend to local small-scale ventures and agricultural enterprises, and these loans
are efficient in the sense that they expand overall agricultural production. However, these small
ventures often operate at below average total factor productivity, and an expansion of these local
ventures reduces overall productivity in the economy. Moreover, an expansion of the agricultural
sector increases the competition for resources with manufacturing production, thus resulting in
negative effects on this sector.
We conclude with a review of the growth effects associated with the common component.
In the short-run, a shock to the common component increases both GDP growth and agricultural
production. Strikingly, the common component does not generate any short-term effects for
manufacturing or services. This pattern is consistent with casual accounts reporting that
expansive policy measures, such as low interest rate policies, introduced in an ad-hoc manner
may not benefit the best lenders but instead politically connected ones. During the global
economic crisis, for instance, state-owned companies reportedly used stimulus money for stock
market investments instead of productive uses. It is also notable that the common component is
Granger caused by capital growth, confirming that China’s leadership is firmly committed to
following a capital-driven growth strategy.
Insert table 4 about here

21
4.3 Long-term growth effects between 1997 and 2005
Shifting our analytic attention to the linkage between idiosyncratic lending behavior and long-
term growth effects, the general account is comparable, revealing no major differences in the
banks’ abilities to influence short-term or long-term growth objectives (see table 5).
PB lending registers a bidirectional causal effect between lending and TFP growth.
Typically, there is a three to four quarter lag between short-run PB loans and TFP growth. This
difference in lags is in line with the typical lending pattern of PBs, which provide financing for
major capital investments such as infrastructure construction. While these projects do not have
immediate productivity effects, they can generate productivity effects for a large part of the local
and regional economy, once projects develop and reach completion. These positive growth
effects of PBs are thus indirect rather than direct. Otherwise, PB lending follows rather than
precedes growth in GDP, agriculture and manufacturing. This is true for both short- and long-
term lending.
For SOCBs, the main lenders in China’s market for commercial loans, the long-term
account seems particularly bleak. Not only do our estimates fail to reveal positive growth effects
(and present a negative causal relationship between short-term lending and manufacturing
growth), SOCB lending between 1997 and 2005 appears disconnected from real economic
activities in the sense that lending does also not follow trends in domestic demand. In fact, SOCB
lending appears virtually disconnected from economic realities in this particular period of time.
Clearly, SOCBs fail to play the role of a strategic lender that is emphasized by Chinese
policymakers and legally prescribed.
Although JSCB lending loses its positive impact on GDP growth observed in the short-run
analysis, total JSCB lending still spurs long-term manufacturing growth and total factor

22
productivity growth, which reinforces the superior lending decisions made by JSCBs in
comparison with SOCBs as their main competitors in the commercial lending market. This
further undermines the developmental view of state banking, asserting that state-ownership and
political involvement may be better adapted to spur long-term economic development.
Finally, the long-term perspective confirms the difficult position of RCCs, which exert a
positive effect on agricultural production, but at the expense of manufacturing and TFP growth.
Clearly these effects are closely associated with the local role of RCCs, limiting their economic
activities to relatively confined lending markets, making efficient capital allocation rather
difficult.
In the long run, the common component is the only driver of GDP growth and capital
accumulation. Thus, despite China’s highly interventionist approach to financial institutions and
domestic lending, by 2005, the only effective means to spur long-term GDP growth are monetary
policies and market responses.
To summarize the analysis of long-term growth effects: None of the financial institutions
had positive effects on GDP growth in the long run. Regarding total lending, only policy banks
were able to promote total factor productivity growth, JSCB lending had a positive impact on
manufacturing and total factor productivity development and RCCs were able to promote
agricultural production, albeit at the cost of negative growth in GDP, manufacturing, and TFP.
The largest share of commercial lending conducted by SOCBs remained disconnected from the
real economy, and neither spurred nor followed economic growth.
Insert table 5 about here
4.4 Robustness checks

23
To scrutinize our findings, we have extended our sample period to the end of 2008. Regrettably,
data availability does not allow for an even longer sample. Moreover, we will lose some degree
of detail in the information, as short-term and long-term loans are not reported separately for the
period in question. However, this simplified perspective may be justifiable, as our analysis found
no striking differences between the two types of lending. Importantly, the inclusion of additional
years covers a major reform package, the incorporation and stock listing of China’s SOCBs. This
reform was initiated to bring in new minority investors and – often foreign - expertise in an effort
to help SOCBs modernize their bank operations and increase profitability. Moreover, the central
government sought to combat arbitrary political intervention and the awarding of personal favors
at the local level, without losing majority control over financial assets. As a consequence of this
partial de-politicization process, the balance sheets of SOCBs improved, as the successful
reduction of non-performing loans to 1% in 2010 confirms (China Banking Regulatory
Commission, 2010).
Insert table 6 about here
As can be expected, our benchmark results are broadly confirmed for PBs, which did not undergo
any substantive political or economic changes between 2005 and 2008. An expansion of the
agricultural sector causes greater demand for capital, which is provided by PBs (i.e., by the
Agriculture Development Bank). PB lending again has positive effects on manufacturing
production and indirect effects on TFP both in the short- and long-run. The most notable
difference from the previous sample is that PB lending Granger causes not only short-run but also
long-run GDP growth.
As expected the most critical changes are observed for SOCB lending. Clearly, the
completed incorporation and stock-listing of SOCBs and concomitant hardening of budget

24
constraints has led to a closer alignment of bank activities with changes in the real economy. The
main difference from the smaller sample is that SOCB lending is Granger caused by
developments in the real economy as measured by GDP, manufacturing production, service
production and TFP. Although SOCBs do not cause growth, they have begun to respond to
economic growth. However, SOCB loans still Granger cause negative growth effects in the
manufacturing sector in both the short- and long-run. This may hint at difficulties in breaking up
established patronage and clientelist networks linking the management of state-owned
companies, local politicians and local branches of SOCBs. Clearly, the misallocation of loans in
the manufacturing sector could not be stopped by the simple introduction of non-state minority
shareholders. Structural break tests reveal a break in 2003Q2, six months later than the break in
the shorter sample. The comparison of parameter estimates for both sub-samples (1997Q2-
2003Q2 and 2003Q3 and 2008Q4) shows that growth in the real economy Granger causes SOCB
lending in the second period but not in the first.17
Apparently, the corporatization, governance
and management reforms applied to SOCBs have successfully led to a closer alignment of
lending activities with changes in the real economy. However, thus far SOCB lending does not
facilitate or promote economic growth.
With a slight expansion in market share from 20% in 2005 to 23% in 2008, JSCBs have
expanded their positive impact on the real economy in comparison to the shorter sample. Similar
to the previous results, JSCB loans positively Granger cause GDP, manufacturing production,
TFP and capital accumulation in the short-run. Unlike the shorter sample, these effects are also
sustained in the long-run in the case of manufacturing production and TFP growth. Similar to
SOCBs, the structural break tests reveal a significant break approximately 2003Q2 for the short-
17
Results are available upon request.

25
run model. A comparison of the two periods’ parameter estimates reveals a slightly more
significant effect in the second sub-period than in the first.18
There are no significant structural breaks for RCCs, and the results for the expanded sample
confirm those of the smaller sample: RCC lending promotes agricultural growth but has negative
effects on the overall economy, possibly through its indirect effects on productivity and resource
competition between agricultural and manufacturing firms. The negative effects on overall
productivity and manufacturing production suggest that an expansion in RCC lending is harmful
to the modernization of the Chinese economy. However, given the large rural population and
share of rural household production, these negative side effects of RCC lending may be well
justified in a broader context. First, the agricultural sector in a developing country requires capital
investments for development to be sustained over the long-term (see, e.g., Lewis, 1954; Ranis
and Fei, 1961). Second, the availability of agricultural loans is essential to slow down rural-to-
urban migration and illegal migration, which may pose a threat to urban stability, particularly in
labor surplus societies such as China. Temporarily negative growth effects on TFP and
manufacturing production at the national level may therefore be a necessary byproduct of
supporting rural and remote areas during the economic transition process.
Finally, the short-term effects of the common component are consistent with our shorter
sample. In the long run, however, the common component is now following rather than
promoting growth. Given the high-performance years preceding the 2008 global economic crisis,
the monetary policy response was – as our results show –an effort to avoid an overheating of the
economy rather than a tool employed to jump-start domestic growth processes.
18
Results are available upon request.

26
Our analysis suggests a pair of tentative conclusions. Most generally, we assert that
ownership alone is a poor predictor of the economic role that state banks can play in fostering
economic development. While PBs and SOCBs were both wholly state owned banks (until 2005),
the difference in the identified finance growth nexus is striking. While PBs promoted total factor
productivity and GDP growth, the lending of SOCBs seems largely disconnected from economic
realities, as it does not promote, but rather is harmful to, economic growth. The most obvious
differences are organizational and structural features, as PBs are highly centralized and assume
the role of a development bank, whereas SOCBs operate a fairly dispersed branch network with a
focus on commercial lending. Under this set-up, the negative effects associated with policy banks
are obviously more difficult to control given the extensive clientelist and patronage networks
linking the local financial sector to the local economy.
Similarly, the reduced state ownership of in JSCBs and RCCs, again, is associated with
strikingly different results. While JSCB lending is associated with an increase in manufacturing
growth and total factor productivity, the confined rural market of RCCs helps to channel capital
into local, low-productivity investments that ultimately reduce GDP, manufacturing and factor
productivity.
5 Discussion and Conclusions
It is a widely held belief that China’s economy has benefited from a state-owned banking system,
particularly among Western policymakers and practitioners who regard China’s rapid
development with skepticism. This paper provides new evidence by employing disaggregated
lending data to produce a more nuanced account of the nature of the finance-growth nexus in
China. Using detailed lending data available for the period from 1997 to 2008, a principal
27
component analysis provides empirical insights into the short- and long-run relationship between
bank lending and economic growth.
Our analysis reveals that the performance of state banks is closely linked to the nature of
financial activities in which they are engaged. Between 1997 and 2008, only two types of banks
generated positive effects on GDP growth: PB lending spurred GDP growth in the short- and
long-run. Among the commercial lenders, only JSCB lending registered a positive impact on
GDP growth. The main commercial lenders, the heavily state-controlled SOCBs, did not
contribute to growth. In the long-run, SOCB-lending had a negative effect on manufacturing
growth. Clearly, this suggests a crowding-out of credit to private and politically unconnected
firms, which would promise higher returns than their politically connected counterparts (La Porta
et al., 2002; Sapienza, 2004).
These findings suggest several tentative conclusions: Wholly owned state banks only seem
to enjoy advantages regarding the financing of public goods, such as road networks, or long-term
projects with substantial uncertainty and information asymmetries. Regarding commercial
lenders, majority ownership by the state seems associated with substantive losses in efficiency.
Our findings are in contrast to the general perception that Chinese companies enjoy unfair
advantages thanks to generous support from SOCBs. While individual firms certainly benefit, the
manufacturing sector as a whole experiences negative growth effects in the long run. The
apparent misallocation of financial resources is most likely associated with the widely reported
ad-hoc political interference in support of ailing state-owned companies, an interpretation that is
also consistent with the superior performance of JSCBs in which the state only holds a minority
of shares.

28
In light of the Chinese government’s most recent efforts to liberalize and modernize its
banking system, our results do not present to an optimistic outlook. Recent efforts to gradually
merge the political functions of policy banks with commercial lending may dilute the relatively
strong comparative advantage policy banks displayed until 2008.19
If ongoing reforms were to
shift the functions of policy banks closer to those of standard commercial banks, the banking
system would lose one of its central advantages.
While generalizations would clearly be premature, China’s experience certainly calls for a
more nuanced assessment of state banking that considers the distinct institutional and functional
features of specific policy and commercial banks. Further research applying a disaggregated
approach to state banking may provide crucial insights, particularly for developing countries,
concerning how to employ state banking to pursue developmental goals successfully.
19
See Policy bank to be commercialized, http://www.china.org.cn/english/business/243063.htm.

29
References
Akerlof, G. A., Romer, P. M., 1993. Looting: the economic underworld of bankruptcy for profit.
Brookings Papers on Economic Activity 24 (2), 1-74.
Andrianova, S., Demetriades, P., Shortland, A., 2008. Government ownership of banks,
institutions, and financial development. Journal of Development Economics 85 (1-2), 218-252.
Ariff, M., Can, L., 2008. Cost and profit efficiency of Chinese banks: A non-parametric analysis.
China Economic Review 19 (2), 260-273.
Aziz, J., Duenwald, C. K., 2002. Growth-financial intermediation nexus in China. IMF Working
Paper No. 02/194.
Bai, J., Ng, S., 2004. A PANIC Attack on unit roots and cointegration. Econometrica 72 (4),
1127-1177.
Banerjee, A. V., 2003. Contracting constraints, credit markets and economic development. In:
Dewatripont, M., Hansen, L. P., Turnovsky, S. J. (Eds.), Advances in Economics and
Econometrics. Cambridge University Press, Cambridge, pp. 1–46.
Bekaert, G., Campbell, R. H., Lundblad, C., 2011. Financial openness and productivity. World
Development 39 (1), 1-19.
Berger, A. N., Hasan, I., Zhou, M., 2009. Bank ownership and efficiency in China: What will
happen in the world's largest nation? Journal of Banking and Finance 33 (1), 113-130.
Boardman, A. E., Vining, A. R., 1992. Ownership vs. competition: Efficiency in public
enterprise. Public Choice 73 (2), 205-239.
Bonfiglioli, A., 2008. Financial integration, productivity and capital accumulation. Journal of
International Economics 76, 337-355.
Boyreau-Debray, G., 2003. Financial intermediation and growth: Chinese style. World Bank
Policy Research Working Paper No. 3027.
Burgess R., Pande, R., 2005. Do rural banks matter? Evidence from the Indian social banking
experiment. American Economic Review 95 (3), 780-795.

30
Cheng X., Degryse, H., 2010. The impact of bank and non-bank financial institutions on local
economic growth in China. Journal of Financial Services Research 37 (2), 179-199.
China Banking Regulatory Commission (CBRC), Annual Report, various issues, Beijing:
http://www.cbrc.gov.cn/showannual.do.
China Finance Society, Almanac of China's Finance and Banking (Annual). China Finance
Publishing House, Beijing.
Chiu, B., Lewis, M. K., 2006. Reforming China's State-owned Enterprises and Banks. Edward
Elgar Press, UK, USA.
Cull, R., Xu, L. C., 2003. Who gets credit? The behavior of bureaucrats and state banks in
allocating credit to Chinese state-owned enterprises. Journal of Development Economics 71 (2),
533-559.
Demirgüc-Kunt, A., Detragiache, E., 1998. The determinants of banking crises in developing
and developed countries. IMF Staff Papers 45 (1), 81-109.
Dewenter, K., Malatesta, P.H., 2001. State-owned and privately owned firms: an empirical
analysis of profitability, leverage, and labor intensity. American Economic Review 91 (1), 320-
334.
Easterly, W., Levine, R., 2002. It´s not factor accumulation: Stylized facts and growth models.
In: Loayza, N., Soto, R., Loayza N., Schmidt-Hebbel, K. (Eds.), Economic Growth: Sources,
Trends, and Cycles, Vol. 6. Central Bank of Chile, Santiago, pp. 061-114.
Financial Survey and Statistics Department of the Peoples Bank of China, 2007. China Financial
Statistics: 1949-2005. China Financial Publishing House, Beijing.
Fu, X., Heffernan, S., 2007. Cost X-efficiency in China's banking sector. China Economic
Review 18 (1), 35-53.
Gao, W., 2012. Financial Development in Rural China: with Special Reference to the Reform of
the Chinese Rural Credit Cooperative. Economic Science Press, Beijing.
Garcia-Herrero A., Gavila S., Santabarbara D., 2006. China's banking reform: An assessment of
its evolution and possible impact. CESifo Economic Studies 52, 304-363.

31
García-Herrero, A., Gavilá, S., Santabárbara, D., 2009. What explains the low profitability of
Chinese banks? Journal of Banking and Finance 33 (11), 2080-2092.
Gerschenkron, A., 1962. Economic Backwardness in Historical Perspective. Harvard University
Press, Cambridge.
Hao, C., 2006. Development of financial intermediation and economic growth: The Chinese
experience. China Economic Review 17 (4), 347-362.
Hasan, I., Wachtel, P., Zhou, M., 2009. Institutional development, financial deepening and
economic growth: Evidence from China. Journal of Banking and Finance 33 (1), 157-170.
Hausmann, R., Rodrik, D., 2003. Economic development as self-discovery. Journal of
Development Economics 72 (2), 603-633.
Hu, Y., Opper, S., Wong, S.M.L., 2006. Political economy of labor retrenchment: Evidence based
on China’s SOEs. China Economic Review 17 (3), 281-299.
Jia C., 2009. The effect of ownership on the prudential behavior of banks – The case of China.
Journal of Banking and Finance 33 (1), 77-87.
La Porta, R., Lopez-de-Silanes, F., Shleifer, A., 2002. Government ownership of banks. Journal
of Finance 57 (1), 265-301.
Lewis, A. (1954). Development with Unlimited Supplies of Labour. The Manchester School, 22,
139-192.
Liang, Q., Teng, J., 2006. Financial development and economic growth: Evidence from China.
China Economic Review 17 (4), 395–411.
Liang, Z., 2005. Financial development, market deregulation and growth: Evidence from China.
Journal of Chinese Economic and Business Studies 3 (3), 247-262.
Lin, X., Zhang, Y., 2009. Bank ownership reform and bank performance in China. Journal of
Banking and Finance 33 (1), 20–29.
Megginson, W. L., Nash, R. C., van Randenborgh, M., 1994. The financial and operating
performance of newly privatized firms: An international empirical analysis. Journal of Finance 49
(2), 403–452.

32
Micco, A., Panizza, U., 2006. Bank ownership and lending behavior. Economics Letters 93 (2),
248-254.
OECD, 2004. China in the Global Economy: Rural Finance and Credit Infrastructure in China.
OECD Publishing.
Ong, L. H., 2006. Multiple principals and collective action: China’s rural credit cooperatives and
poor households’ access to credit. Journal of East Asian Studies 6, 177-204.
Podpiera, R., 2006. Progress in China's banking sector reform: Has bank behavior changed? IMF
Working Papers 06/71.
Policy bank to be commercialized. http://www.china.org.cn/english/business/243063.htm.
Accessed 14.02.2013.
Qian, J., Strahan, P., Yang, Z., 2011. The impact of incentives and communication costs on
information production: Evidence from bank lending. Presented at the annual Financial
Intermediation Research Society Conference in Sydney.
Ranis, G., Fei, J.C.H., 1961. A theory of economic development. American Economic Review 51
(4), 533-565.
Reinhart, C.M., Kaminsky, G.L., 1999. The twin crises: The causes of banking and balance-of-
payments problems. American Economic Review 89 (3), 473-500.
Rousseau P. L., Xiao, S., 2007. Banks, stock markets and China’s Great Leap Forward. Emerging
Markets Review 8 (3), 206–217.
Sandersen, H., Forsythe, M., 2013. China's Superbank: Debt, Oil and Influence - How China
Development Bank is Rewriting the Rules of Finance. Bloomberg Press.
Sapienza, P., 2004. The effects of government ownership on bank lending. Journal of Financial
Economics 72 (2), 357-384.
Shih, V., Zhang, Q., Liu, M., 2007. Comparing the performance of Chinese banks: A principal
component approach. China Economic Review 18 (1), 15-34.
Shleifer, A., 1998. State versus private ownership. Journal of Economic Perspectives 12 (4), 133-
50.

33
Stiglitz, J. E.,1994. The role of the state in financial markets. In: Bruno M., Pleskovic, B. (Eds.),
Proceedings of the World Bank Annual Conference on Development Economics. World Bank,
Washington, DC.
Sufian, F., 2009. The determinants of efficiency of publicly listed Chinese banks: evidence from
two-stage banking models. Macroeconomics and Finance in Emerging Market Economies 2 (1),
93-133.
Toda, H.Y., Yamamoto, T., 1995. Statistical inferences in vector autoregressions with possibly
integrated processes. Journal of Econometrics 66 (1-2), 225-250.
Wei, S.. Wang, T., 1997. The siamese twins: Do state-owned banks favor state-owned enterprises
in China? China Economic Review 8 (1), 19-29.
Yan, L., Hung-Gay, F., Xianfeng, J., 2007. Market structure and profitability of Chinese
commercial banks. Chinese Economy 40 (5), 100-113.
Yeyati E. L., Micco, A., Panizza, U., Detragiache, E., Repetto, A., 2007. A reappraisal of state-
owned banks. Economía 7 (2), 209-259.

34
TABLES:
Table 1 Average shares of different types of loans in total loans in percentages (1997-2005)
Short-term loans Medium and Long-term loans Other loans1
PBs 47.0 52.8 0.2
SOCBs 55.3 40.7 4.0
JSCBs 62.6 25.1 12.3
RCCs 91.2 5.8 3.0
Note: 1 Include paper financing and total advances.
Source: Own calculations based on China Financial Statistics (2007).

35
Table 2: Institutional and Functional Features of Key Banking Institutions
PBs SOCBs JSCBs RCCs
Institutional
characteristics
Main task Policy lending Commercial
lending
Commercial
lending
Commercial
lending
Ownership State State
Mixed Collective
Political
independence
Low Low-medium High High
Budget
constraints
Soft Medium Hard Hard
Functional
characteristics
Major recipients
of loans
SOEs,
Government
agencies
SOEs, partly
privatized joint
stock companies
SOEs, partly
privatized joint
stock companies
TVEs and rural
households
Loan size 0.5-10 billion
CNY
4-7 million CNY Na 1-2 thousand
CNY
Main purpose Capital
construction
Industrial sector Industrial sector Agricultural
sector
Maturity Medium – and
long-term
Short- and
medium- term
Short-term Short-term
Market National
National National Local
Market share in
2008 (in%)
8.94 51.58 13.99 8.25
Source: China Financial Statistics (2007); OECD (2004); Qian et al. (2011); Banks’ Annual Reports;
China Banking Regulatory Commission, 2009.

36
Table 3: Descriptive Statistics – Growth Rates
1997Q2 to 2005Q4 1997Q2 to 2008Q4
Average
Growth Rate
Std.
Dev.
Variance decomposition Average
Growth Rate
Std.
Dev.
Variance decomposition
Common
Component
Idiosyncratic
Component
Common
Component
Idiosyncratic
Component
PBs
Total 2.3% 3.0 18% 82% 2.8% 3.0 31% 69%
Short-term 0.7% 3.2 13% 87% NA NA NA NA
Long-term 4.0% 5.1 3% 97% NA NA NA NA
SOCBs
Total 1.9% 2.9 40% 60% 1.9% 3.7 64% 36%
Short-term -0.4% 4.4 8% 92% NA NA NA NA
Long-term 4.6% 4.3 18% 82% NA NA NA NA
JSCBs
Total 6.5% 3.1 64% 36% 5.6% 4.2 80% 20%
Short-term 5.5% 3.6 7% 93% NA NA NA NA
Long-term 9.6% 6.3 25% 75% NA NA NA NA
RCCs
Total 2.4% 2.0 63% 37% 2.5% 2.6 60% 40%
Short-term 2.4% 2.0 29% 71% NA NA NA NA
Long-term 3.3% 5.1 4% 96% NA NA NA NA
Notes:
a. Growth in real loans.
b. There is a break in JSCB loans in 2001 and in RCCs in 2007. These breaks affect the growth rate for one quarter; that quarter has been
removed from these calculations.

37
Table 4: Granger Causality Tests: Short-term growth effects 1997-2005
Loan type GDP Agriculture Manufacturing Service TFP Capital
PB’S
Total loans PB GDP Agric. PB Manuf. PB - PB TFP Capital PB
Short-term loans - Agrc. PB PB Manuf. - - -
Long-term loans PB GDP Agric. PB - Service PB PB TFP -
SOCBs
Total loans - - - - - -
Short-term loans SOCB GDP* - SOCB Manuf.* - SOCB Manuf.* -
Long-term loans SOCB Agric. - - - -
JSCBs
Total loans JSCB GDP - JSCB Manuf. - JSCB TFP JSCB Capital
Short-term loans - . - - JSCB TFP -
Long-term loans - - - - - -
RCCs
Total loans - RCC Agric. RCC Manuf* - RCC TFP* -
Short-term loans - RCC Agric. - - - -
Long-term loans GDP RCC - - Service RCC TFP RCC -
Common
Component
Total loans GDP CC CC Agric. - - - Capital CC
Short-term loans - CC Agric. - - - -
Long-term loans GDP CC - - Service CC TFP CC -
Note: * denotes a negative effect; all other effects are positive. Due to the small sample and the relatively small volume of loans from JSCBs and
RCCs compared to the size of the economy, we use a 10% significance level.

38
Table 5: Granger Causality Tests: Long-term growth effects, 1997-2005
Loan type GDP Agriculture Manufacturing Service TFP Capital
PB’S
Total loans GDP PB Agric. PB Manuf. PB - PB TFP -
Short-term loans - Agrc. PB PB Manuf. - PB TFP -
Long-term loans GDP PB Agric. PB - - PB TFP -
SOCBs
Total loans - - - - - -
Short-term loans - - SOCB Manuf.* - - -
Long-term loans - - - - - -
JSCBs
Total loans - - JSCB Manuf. - JSCB TFP -
Short-term loans - . - - - -
Long-term loans - - - - - -
RCCs
Total loans GDP RCC* RCC Agric. RCC Manuf.* - RCC TFP* -
Short-term loans - - - - -
Long-term loans - RCC Agric. - - - -
Common
Component
Total loans CC GDP CC Agric.* - - - CC Capital
Short-term loans - - - - - -
Long-term loans - - - - - -
Note: * denotes a negative effect; all other effects are positive. Due to the small sample and the relatively small volume of loans from JSCBs and
RCCs compared to the size of the economy, we use a 10% significance level.

39
Table 6: Granger Causality Tests: Short- and long-term growth effects of total loans, 1997-2008
Bank GDP Agriculture Manufacturing Service TFP Capital
Short-term effects
PB’s PB GDP Agric. PB PB Manuf. - PBTFP -
SOCBs GDP SOCB - SOCBManuf. ServiceSOCB TFP SOCB SOCBCapital
JSCBs JSCB GDP Agric.JSCB JSCB Manuf. - JSCB TFP JSCB Capital
RCCs RCC GDP* RCCAgric. JSCB Manuf.* JSCB TFP*
Common
Component CCGDP CC Agric. - - CCTFP Capital CC
Long-term effects
PB’s PB GDP Agric. PB PB Manuf. - PBTFP CapitalTFP
SBCs - - SOCBManuf.* - - -
JSCBs - - JSCB Manuf. - JSCB TFP -
RCCs RCC GDP* RCC Agric. RCCManuf.* - JSCB TFP* -
Common
Component GDP CC* - Manuf CC* - TFP CC* -
Note: * denotes a negative effect, all other effects are positive. For the longer sample, we use a 5% significance level.
40
Appendix 1: Project examples of policy banks in 2005 (billion CNY)
Name Total assets Outstanding
loans Project example
Project description Project
value
China Development Bank1 1897.9 1731.8
Jiangsu Tianwan Nuclear
Power Plant
A nuclear power plant with a capacity of 4 million kilowatts to improve the energy infrastructure in Jiangsu province and the East China region
5.1
Export-Import Bank of
China2
204.79
175.99
Strategic Cooperation
Agreement with China
National Machinery Industry
Corporation
Financing of the company's export of mechanical and electronic products, complete sets of equipment, high- and new- tech products, its overseas investment and overseas contracting projects and in support of its international market expansion
24.24
Agricultural Development
Bank of China3
850.21 787.07 Loans for the purchase of
grain and edible oil
The purchase of surplus grain and edible oil from farmers by enterprises maintaining accounts with the bank to improve farmers' income
166.28
Notes:1 The China Development Bank, the largest of the three policy banks (with 64% of the total policy lending), focuses on eight key industries: power, road construction,
railways, petro-chemical, coal mining, telecommunications, agriculture, and public facilities (CDB Annual Report 2010). Although the bank also provides loans to small and
medium sized enterprises with average assets of 1.5 million CNY, these loans constitute only a small fraction of total lending (approximately 1% in 2005; CDB Annual
Report). 2 Lenders can either be international buyers purchasing products in China
1, or domestic sellers aiming to strengthen their participation in global trade. Chery Automobile, for
instance, received a loan worth CNY 5 billion in 2005 to support the company’s export development. By 2011, Chery was exporting 170,000 cars annually, which made
Chery the strongest exporter among China’s car producers.
3 The Agricultural Development Bank of China is responsible for the majority of short-term loans granted by China’s policy banks. Of these loans, 98 percent are dedicated to
the purchase of farm products (such as surplus grain and edible oils), in an effort to stabilize rural markets and alleviate poverty among farmers.
4 3 billion USD converted into CNY based on IMF representative exchange rate from 30.12.2005.

41
Appendix 2
Summary information from 2011 on banking institutions included in the analysis (in billions
of RMB and percentages) Banking institution Total
assets
Share in total
assets of
banking
institutions
Total
loans
Share in
total loans of
banking
institutions
Type of the
largest
shareholder
Ownership
share of the
largest
shareholder
State-owned commercial banks
Industrial and Commercial
Bank of China (ICBC)
15477 13.88 7594 13.05 State-owned 35.40
Agricultural Bank of
China (ABC)
11678 10.47 5399 9.28 State-owned 40.12
Bank of China (BOC) 11830 10.61 6203 10.66 State-owned 67.60
China Construction Bank
(CCB)
12282 11.01 6325 10.87 State-owned 57.13
Policy banks
China Development Bank
(CDB)
6252 5.61 5526 9.50 State-owned 100
Agricultural Development
Bank of China (ADBC)
1751 1.57 1671 2.87 State-owned 100
Export-Import Bank of
China (Exim)
1199 1.08 914 1.57 State-owned 100
Joint stock commercial banks
Bank of Communications 4611 4.13 2505 4.31 State-owned 26.52
CITIC Industrial Bank 2766 2.48 1411 2.42 State-owned 61.85
Everbright Bank of China 1733 1.55 869 1.49 State-owned 48.37
Hua Xia Bank 1244 1.12 594 1.02 State-owned
legal person
20.28
China Guangfa Bank 919 0.82 540 0.93 Foreign legal
person
20.00
Shenzhen Development
Bank
1258 1.13 610 1.05 Private legal
person
42.16
China Merchants Bank 2795 2.51 1604 2.76 State-owned
legal person
17.86
Shanghai Pudong
Development Bank
2685 2.41 1302 2.24 State-owned
legal person
20.00
Industrial Bank 2409 2.16 969 1.67 State-owned 21.03
Evergrowing Bank 437 0.39 145 0.25 State-owned
legal person
20.55
China Zheshang Bank 163 0.15 87 0.15 State-owned
legal person
14.29
China Bohai Bank 312 0.28 113 0.19 State-owned
legal person
25.00
China Minsheng Banking
Co.
2229 2.00 1178 2.02 State-owned
legal person
15.27
Source: Based on CBRC Annual Report 2011, annual reports 2011 of respective banks