legislator financial interests and distributive committeesjbattist/workshop/battista_f07.pdf ·...
TRANSCRIPT
Legislator Financial Interests and Distributive Committees
James Coleman BattistaUniversity of North Texas
September 4, 2007
Abstract
I use a new dataset of American state legislators’ outside financial interests to assess the dis-tributive theory of committees. Significant numbers of committees regulating agriculture, bank-ing, education, health care, and insurance over-represent legislators with financial interests in thecommittee’s jurisdiction, supporting the distributive model. Further, the breadth of a committee’sjurisdiction is related to its representativeness in a manner consistent with the distributive model. Ialso find that committee representativeness as measured by legislator interests is uncorrelated withcommittee representativeness measured using NOMINATE scores.
NOTE:This is the version I took to MPSA and that got dinged by AJPS. My presentation will incorpo-
rate some of the reviewers’ comments and take a different tack from what’s here.
Since its introduction, the distributive theory of committees as formalized by Weingast and
Marshall (1988) (also Shepsle and Weingast 1987) has been controversial and has sparked long-
running disputes within political science. Much of the empirical side of this debate has been over
whether or not committees are uniform high-demanders of the goods the committee can provide.
Many researchers (Weingast and Marshall 1988, Krehbiel 1990, Cox and McCubbins 1993, Grose-
close 1994, Adler and Lapinski 1997) have conducted empirical tests of the distributive model in
the U.S. House. Other researchers have tested theories of committees in state legislatures. (Overby
and Kazee 2000, Overby, Kazee, and Prince 2004, Battista 2004, Prince and Overby 2005) Using
state legislatures to test theories devised for Congress has long been held up as a useful way to
assess the generalizability of those theories. (Squire and Hamm 2005, Jewell 1981) However, it has
been difficult to directly assess the predictive power of the distributive model in state legislatures
because measures of preferences relevant to the distributive model are difficult to obtain. Nearly
all of the articles that examine committee representativeness in state legislatures estimate legislator
preferences with either NOMINATE (Poole and Rosenthal 1997) scores or National Federation of
Independent Businesses voting scores. Neither of these preference estimates tap into the essential
concept of the high-demanding outlier because they are not jurisdiction-specific. Rather, both are
probably highly correlated with ideology. These preference measures mean that while current arti-
cles can say something about the informativeness of state legislative committees – a committee that
is too liberal or too conservative would be a bad informational agent if there is uncertainty along
an ideological dimension – they cannot say anything about the extent to which state legislative
committees are distributive.
In this paper, I use data on state legislators’ financial interests to better address the question of
whether state legislative committees are consistent with the distributive model, thereby testing the
generalizability of that model. If legislators with a financial interest in an industry can be expected
to be biased towards that industry, this affords us a direct test of the distributive model. Using
these new data, I find substantially more support for the distributive model than had previously
been found in state legislatures. However, even this more supportive evidence is still mixed and
does not offer unequivocal or definitive support for the distributive model.
1
The distributive model and state legislatures
While they did not originate the idea that distributive politics are important in Congress or that
congressional committees are important tools for distribution, the particular formalization of the
distributive model that is probably best known was put forward by Weingast and Marshall (1988).
They argued that committee systems represent an institutionalized vote-trade, a petrified logroll.
Legislators might wish to trade votes over policies that different constituencies demand, but trading
votes is difficult for two reasons. First, legislators have a direct incentive not to go through with
their end of the trade in order to reduce the tax burden to their own district. (Weingast and Marshall
1988, 140) Second, other legislators might attempt to eliminate subsidy programs that have already
passed or even taken effect, again to reduce the tax burden to their own constituents. (Weingast
and Marshall 1988, 139–140) These incentives mean that a rational legislator would find it difficult
to trust his or her colleagues to go through with their end of the vote trade, and to refrain from
repealing the relevant benefit in the near future. A committee system characterized by gatekeeping
and self-selection can deal with these problems. If committees can prevent bills from coming to the
floor, a committee can quietly veto any bill that would reduce subsidy levels. Likewise, a committee
system in which legislators choose their committee assignments helps reduce the complex string of
vote trades to a single, one-time exchange of power ratified by the vote accepting committee slates
for the session. (Weingast and Marshall 1988, 144) Empirically, the distributive model predicts
that legislators should seek membership on the committees most valuable to them. Iterated across
legislators and committees, this process should create outlying committees that have a stronger
taste for providing committee benefits than does the chamber as a whole. That is, in a distributive
world the agriculture committee should be dominated by members from farming districts who
have a greater preference for farm subsidies than does the chamber. This leads to a legislature that
whose total policy output is strongly biased towards providing an inefficiently large amount of all
types of subsidies and other particularized benefits.
In their original article, Weingast and Marshall (1988) found that several U.S. House committees
had mean interest-group scores that were higher than the mean of the chamber. Adler and Lapinski
2
(1997) found similar results using district characteristics to estimate Representatives’ preferences.
Other researchers (Krehbiel 1990, Cox and McCubbins 1993) have disagreed, and have used a va-
riety of preference estimates and comparison techniques to argue that committees are not unrep-
resentative outliers. Groseclose (1994) argued that the picture is mixed, but favors the preference
outlier hypothesis. Parker, Parker, Copa, and Lawhorn (2005) examined patterns of division and
consensus on committees and found support for the distributive model. Hurwitz, Moiles, and
Rohde (2001) found both distributive and partisan dimensions to agriculture decisions in the 104th
U.S. House. Many other researchers have addressed this question for the U.S. House, and have
found a range of findings.
State legislatures as a testbed for committee theories
There has also been a recent stream of articles looking to state legislatures to examine theories
of committees. Overby, Kazee, and Prince (2004) and Prince and Overby (2005) both used interest-
group scores from the National Federation of Independent Businesses or the Chamber of Commerce
to estimate preferences in nearly all lower and upper chambers respectively. They found that outly-
ing committees were rare; three percent of lower-chamber committees (Overby, Kazee, and Prince
2004, 87) and eleven percent of upper-chamber committees (Prince and Overby 2005, 78) differed
from their parent chambers at a significance level of 0.05 or better. Battista (2004) used unidimen-
sional NOMINATE scores as preference estimators in a study of eleven state legislative chambers,
and likewise found outliers to be rare (4.5% outlying at a 0.05 level).
However, the preference estimators in these works should be seen as something close to general
measures of ideology. This is most obvious for NOMINATE, where under many commonplace voting
records the recovered dimension is liberal/conservative. But we should also view scores issued by
a general business-oriented interest group as approximately ideological; a dimension dividing pro-
business from anti-business legislators can be expected to be correlated with a liberal/conservative
dimension. But this means that none of these studies can directly assess the distributive model, be-
cause all of them lack the jurisdiction-specific measures that testing the distributive theory requires.
3
That is, to assess the distributive theory we must know how pro-farmer the agriculture committee
of a given chamber is, not how liberal or conservative or generally pro-business it is, and data of
this sort is largely unavailable for comparative state research. While there are an increasing number
of interest group scores available for state legislators, the groups offering the scores often vary from
state to state, introducing additional uncertainty into the measures. At the same time, more scores
are available for professionalized, full-time legislatures than for citizen, part-time legislatures, mak-
ing it difficult to secure representative samples of states. While it might be tempting to assume that
a committee that is unrepresentative ideologically is a distributive committee, it need not be. We
would not expect it to be also a distributive high-demander unless the relevant jurisdiction-specific
measure were highly correlated with ideology. Because of this, the most that can be said of the out-
liers identified by Overby, Kazee, and Prince, or Prince and Overby, or Battista, is that they would
be bad suppliers of information if there is substantial uncertainty about the connection between
policy and outcome concentrated on a liberal-conservative axis.
State legislative researchers have used different techniques to try to circumvent this data prob-
lem. Martorano (2006) looked at the formal rules of legislatures in order to assess the institutional
underpinnings of the distributive model. She asked whether the sets of rules in each of 24 lower
chambers from 1955–1995 were consistent with the autonomous, powerful committees that the dis-
tributive model hypothesizes. The distributive theory would assert that strong property rights in
committee assignments should be linked to stronger, more autonomous committees, but Martorano
found the reverse – stronger property rights are associated with less autonomous committees, so
arguing against the distributive model. Battista (2006) examined internal committee behavior in
the California Legislature, in part to more directly address the distributive model. He found that
most committees’ internal voting records displayed some characteristics of preference divergence
between the chamber and the committee, such as the committee voting unanimously to report a
bill on which the floor vote was deeply divided. (Battista 2006, 162–163) But at the same time, com-
mittees also displayed other characteristics that better fit with the informational (Krehbiel 1991),
partisan (Cox and McCubbins 1993), or conditional (Maltzman 1997) models. (Battista 2006, 166–
167) These papers illustrate that imaginative use of available data can counteract the lack of interest
4
group scores in state legislatures.
In this paper, I take another approach, estimating preferences using information on legislators’
financial interests, as well as those of their immediate families, taken from financial disclosure state-
ments required by law. The basic assumption is that a legislator with a direct or familial financial
connection to agriculture should have a stronger preference for providing agricultural subsidies or
other laws that benefit farmers than would a legislator with no such financial interest. To the extent
that this assumption holds, a committee with a preponderance of legislators with financial interests
in the committee’s jurisdiction should be a high-demanding outlier. Hamm (1986) used a similar
method to examine subgovernments in the Colorado legislature. Using original data on the occu-
pations, association memberships, government experience, and district characteristics of members,
he found that there were an abundance of “interested” legislators on the agriculture, education,
and transportation committees of the Colorado House and Senate.
Data
To assess the degree to which committees are dominated by interested legislators, I examine five
classes of committee and interest: agriculture, banking, education, health care, and insurance. A
primary reason for restricting my analysis to these committee/interest pairs is that these are the
committees whose jurisdictions line up most neatly to legislators’ interests as identified in the data.
These jurisdictions are also important subjects of state-level regulation, service provision, and ad-
ministration. Apart from agriculture, these jurisdictions do involve one substantial break with the
Weingast-Marshall model as originally published. The Weingast-Marshall model assumes that re-
election is the primary motive force behind vote-trading politics and the committee system, and
that legislators are choosing committee assignments to provide benefits to their districts, writing
that “Electoral competition induces congressmen, at least in part, to represent the interests of their
constituents.” But it seems unlikely that there are significant numbers of districts with concentra-
tions of education workers or health care workers that are so high that their legislators work in the
interests of education or health care because their biased district demands it, in the way we might
5
think of an agriculture committee serving district needs. However, it is reasonable to think that
they should nonetheless fit into a Weingast-Marshall system of committees as logroll agents.
To see this, note that the Weingast-Marshall model has two phases. In the first, legislators ac-
quire preferences from their district’s economic interests. In the second, legislators trade influence
across interests and form a committee system to cement their vote trade. Re-election only enters
their model as a means to assign preferences to legislators – if legislators have at least some ex-
ogenous preferences that do not spring from their districts’ economic interests, then they can act
upon these preferences in the second stage, trading influence and votes just as they would with
preferences induced by re-election. Further, it is reasonable to think that legislators might have
active preferences that are not induced by electoral concerns in addition to preferences induced by
the district, though we would not expect legislators to commonly hold preferences that run counter
to the economic interests of the district. In his seminal discussion of Congressmen in committees,
Fenno (1973) noted that while some committees provide electoral benefit to the Representative,
others (such as the foreign relations committees) do not seem tightly connected to re-election or
to constituency interests. But if we take the vote-trading core of the Weingast-Marshall model se-
riously, Representatives should be self-selecting onto these policy committees out of self-interest
and their own preferences and priorities, so that the foreign relations committees are composed
disproportionately of MCs with strong preferences about foreign relations. That is, if the distribu-
tive model is a strong model, legislators should be trading influence across all of the dimensions
of their preferences and not only across those that are closely tied to their constituents’ economic
interests. At the same time, however, we should expect any distributive tendencies to be strongest
for committees regulating agriculture as agriculture combines the possibility for exogenous interest
in a policy area with the re-election motivations that Weingast and Marshall emphasize.
A small number of committees appear in the data more than once. This happens when the same
committee deals with more than one of the interests, such as a committee on banking and insurance
or a health, education, and welfare committee. In these cases, the committee is considered first
from one perspective and then another. A banking and insurance committee is assessed first for
an overabundance of legislators with ties to banking, and then for ties to the insurance industry. A
6
fuller discussion of the role of jurisdiction breadth appears after the initial presentation of findings.
The preference estimator I use is based on data on state legislators’ financial interests. These data
were collected by the Center for Public Integrity, “a nonprofit organization dedicated to producing
original, responsible investigative journalism on issues of public concern.” (Center for Public In-
tegrity 2006) The Center collected all of the financial-disclosure filings submitted by state legislators
in 1999 and coded legislator financial ties to several industries and sub-industries as well as legisla-
tor committee assignments. In this paper, I use data for lower state legislative chambers, counting
all financial ties except for accounts with and loans from financial institutions and simple invest-
ments. The remaining financial ties include direct income from an industry, pension income from
an industry, income from clients in an industry, business or farm profit, ownership of real property,
officer or director positions, and so on. I exclude simple stock ownership because it should be less
likely to reflect a substantial connection with or interest in an industry, and should be more likely to
be simply part of a diversified investment portfolio geared towards retirement or other long-term
goals. A legislator with pension income from Humana, implying long employment in Humana and
immersion in the health care industry, should be more likely to favor health care interests than a
legislator who merely owns some shares of Humana stock as part of their retirement planning.
The requirements for financial-disclosure filings vary from state to state. Four states (Idaho,
Michigan, Utah, and Vermont) do not require their legislators to file disclosure forms. Among the
rest, the Center examined the laws surrounding financial disclosure forms and assigned each state
a stringency score between zero and 100 inclusive, with higher values denoting states where more
financial relationships must be disclosed. The Center interprets these stringency scores much like
academic grades, denoting states with scores greater than 60 as having a passing grade. (Center
for Public Integrity 1999) Most of the results here will be presented for all chambers that require
reporting, and again for the 26 states with passing scores (≥ 60) and for the 19 states earning what
we might think of as a “gentleman’s C” (≥ 75) or better.
There are some problems with the financial interest data, but they are not serious. First, they
do not include any measure of magnitude. This means that a legislator who happened to have a
school district as a business client and a career K-12 teacher who is serving as a legislator are both
7
considered as simply having an interest in education. It would obviously be preferable to have a
finer-grained measure of interests. However, there is sufficient variation on the simple binary level
to reveal interesting results, even if more precise measures might lead to even more interesting re-
sults. Second, the filings in at least some states include the financial interests of legislators’ spouses
or dependents. I include all such interests, though many dependents’ interests are dropped because
they are accounts with mutual funds or other simple investments. One reason for this decision is
that I am trying to capture a legislator’s orientation towards different interest groups, with the idea
that legislators will be more strongly oriented towards interest groups in which they have a finan-
cial tie. But we would also expect legislators to be more strongly oriented towards interest groups
to which their family has a financial tie, so this information is relevant. On a more pragmatic level,
many of the filings the Center coded do not themselves indicate whether the relevant financial in-
terest is the filer’s, spouse’s, or dependents’, so fully distinguishing between these classes of interest
is impossible without dropping large numbers of observations.
Methods
I use simulations to compare committees to their parent chambers. For each committee/interest
combination in each chamber, I draw 10,000 random samples of the appropriate size and note the
number of legislators with ties to the relevant industry. Because no legislator can be on a given
committee more than once, each of the 10,000 random samples is taken without replacement. Each
committee then receives a score equal to the proportion of simulated committees with at least as
many interested legislators as the actual committee, making each score a one-tailed p-value. Com-
paring with simulations avoids violating assumptions in a simple binomial test – the probability
of drawing an interested legislator for any given committee slot depends in part on who has been
selected to fill the prior slots. While it is almost certainly possible to extract an exact probabil-
ity value from the combinatorics for each committee/interest pairing in each state, the simulation
method required only simple modifications of already-existing R code and should be an extremely
close approximation to those exact probabilities. In practice, the simulated p-values are very close
8
(correlation = 0.999, with most differences between 0.01–0.025) to p-values generated by simply
referencing the binomial distribution for the probability of observing at least as many legislators
with financial ties to the industry given the chamber proportion of such legislators, but these small
differences do sometimes cross traditional boundaries of statistical significance.
In addition, I compare the percent of the committee who have a financial tie to the relevant
interest to the percent of the chamber and find the difference. This is particularly useful in those
chambers where there are only a few legislators who have a tie to a given interest. In a chamber
of 100 with two legislators who have a tie to an interest, neither of which is on the committee, the
committee will receive a simulation score of 1.000 (since all committees have at least zero inter-
ested legislators), even though the percent of interested legislators in the committee is very close
to the value for the chamber. All of which is to say that directly examining the extent to which
chambers over-represent (or under-represent) a given interest gives another picture of patterns of
self-selection and interest representation.
Over-representation of interested legislators
In all of the five committee/interest pairings I examine, there is at least some evidence that leg-
islators with financial interests in the industries regulated by the committee are over-represented.
So long as legislators’ financial interests are correlated with their preferences, this indicates a pref-
erence divergence from the chamber and so is consistent with the Weingast-Marshall model’s as-
sertion that committees are high-demanders. However, small or moderate degrees of preference
deviation from the chamber are also consistent with the competing informational theory. (Krehbiel
1991) An important part of the formal models underlying the informational theory is the resource
stage, in which the chamber induces the committee to learn about the relevant policy, a costly en-
deavor, by endowing the committee with resources. (Gilligan and Krehbiel 1990, 552–555) If a
slightly or somewhat biased committee can be induced to acquire expertise at a lower cost to the
chamber than a fully representative committee can be, a somewhat biased committee might mini-
mize the sum of resource costs and uncertainty costs. (Gilligan and Krehbiel 1990, 552–555)
9
Table 1 reports the simulation-based representativeness scores for each committee/interest pair.
This is the probability of observing at least as many interested legislators as we actually observe if
appointment were random, and low values indicate an outlying, high-demanding committee. Val-
ues in the neighborhood of 0.5 indicate committees with about as many interested legislators as we
would expect from random appointment, and values well over 0.5 denote committees with fewer
interested legislators than chance might supply. As the table notes, there are a substantial number
of committees (58 of 225, or 23%) in all jurisdictions that are unrepresentative at a significance level
of 0.05 or better. The percent of 0.05-outliers ranges from 13% of committees regulating banking to
53% of agriculture committees. All of these are substantially higher than the five percent of com-
mittees we would expect by chance. Note that the percentage of outlying committees in agriculture
is much higher than the percentage for other jurisdictions. Using a different method, the Center
originally found that 25% of legislators they examined have at least one committee assignment that
regulated a personal or business interest. (Center for Public Integrity 2000)
However, these simple percentages do not take the stringency of reporting requirements into
account, nor do they consider variations in the critical value for declaring a committee an outlier, a
factor that Groseclose (1994) and Battista (2004) found important in understanding the joint signif-
icance of a chamber’s set of committees. To deal with this, Table 2 displays the number of outliers
and their joint significance figures for critical values of 0.01, 0.05, 0.10, and 0.20. The 0.01 and 0.05
columns represent clear, distinct outliers that should be consistent only with the distributive model.
The 0.10 and 0.20 models, however, indicate less severe outliers that might be consistent with both
the distributive and informational models. The joint significance numbers are taken from the bi-
nomial distribution and are the probability of observing at least as many outliers (at the relevant
critical value) as we actually observe. For example, the 0.024 for banking at the 0.05 level is the
probability of observing at least six events of 0.05 probability in 45 trials. It also displays sepa-
rate values for all chambers, for the 26 chambers with “passing” (≥ 60) stringency grades, and for
the 19 chambers with stringency scores of at least 75. The results here show dramatic differences
between jurisdictions. Committees regulating banking and education have at most relatively mild
tendencies towards being outliers. On the other hand, agriculture committees are strongly outlying.
10
The highest joint significance figure for agriculture committees is only 0.00005, while the lowest is
8.01× 10⁻²⁰. Also, note that while committees regulating insurance are significantly more likely to
be 0.05-outliers, they are not significantly more likely to be 0.20-outliers.
Table 3 reports the over-representation of interested legislators for all lower chambers. This is
the percent of the committee who have a financial tie to the relevant industry minus the percent
of the chamber who have such a tie. High values of this variable denote an outlier, while values
below zero indicate that interested legislators are under-represented on the committee. These over-
representation percentages are highly correlated (-0.841) with the simulated p-values. Obviously,
many committees seriously over-represent legislators with a financial interest in the committee’s ju-
risdiction. For every category except banking, the mean is distinguishably greater than zero with a
simple t-test; for banking the values range from 0.06 for all chambers to 0.15 for chambers with strin-
gency scores of at least 75. At the same time, there is at least one committee that under-represents
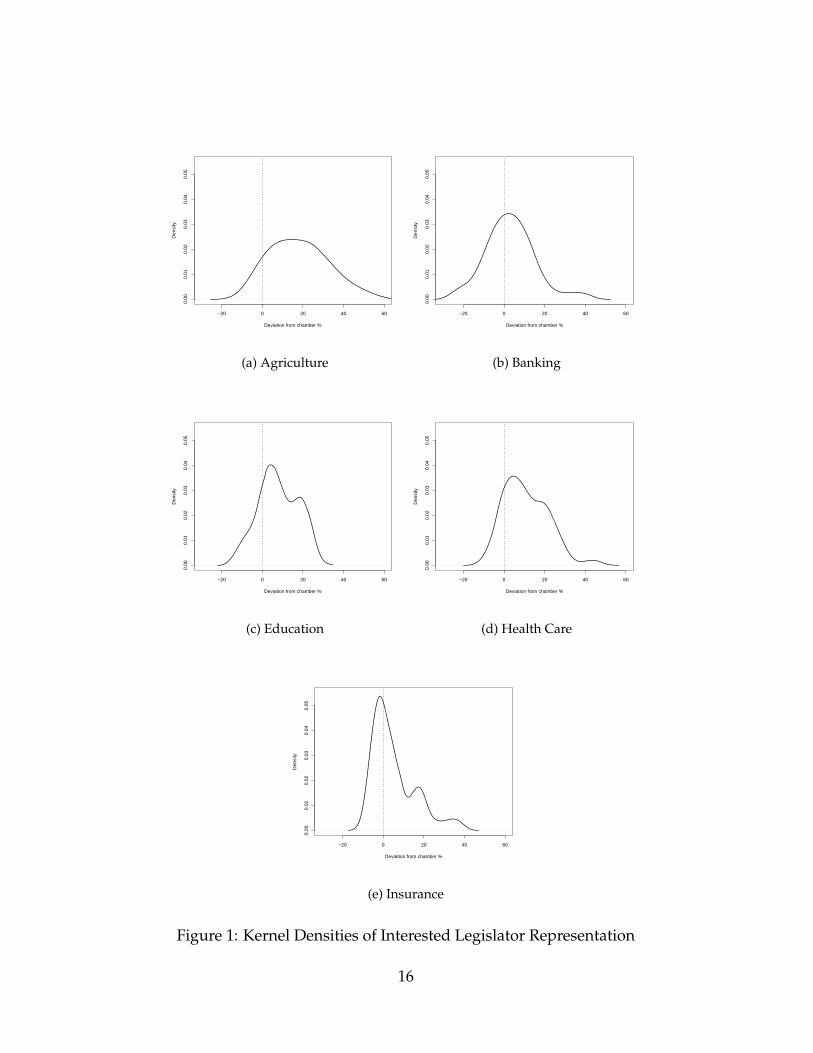
interested legislators in every category. Figure 1 offers another way to examine the extent to which
state legislative committees over-represent interested legislators, displaying the kernel densities of
the over-representation scores for each jurisdiction/interest pair. In each subfigure, the vertical
dashed line marks the zero axis where the relevant interest has the same share of the committee
as it does of the chamber. As the figures demonstrate, banking and insurance behave differently
than do agriculture, education, and health care. While the other committee/interest pairs have
modes to the right of zero, if not always far to the right, the distribution of representation scores
for committees regulating banking appears nearly normal and centered very near zero, while com-
mittees regulating insurance actually have a negative mode. A similar figure for simulation-based
representativeness scores appears later in the paper.
Table 4 displays the results broken down by stringency level. In this table, the columns on the
right report the number of committees in which interested legislators are over-represented by at
least ten percentage points and the number of committees whose percentage of interested legis-
lators is no higher than the chamber’s percentage. In every committee/interest pair, there are a
nontrivial proportion of committees that over-represent interested legislators, but there are also a
nontrivial number of committees in which interested legislators are under-represented. Indeed,
11
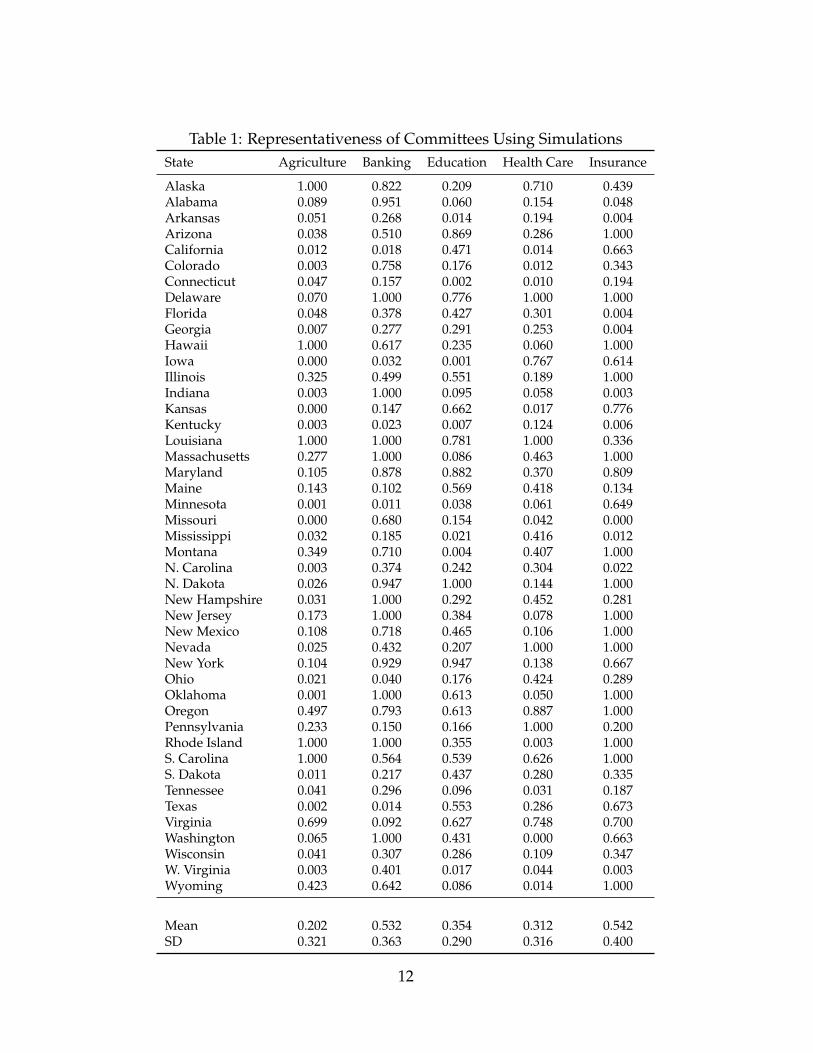
Table 1: Representativeness of Committees Using SimulationsState Agriculture Banking Education Health Care Insurance
Alaska 1.000 0.822 0.209 0.710 0.439Alabama 0.089 0.951 0.060 0.154 0.048Arkansas 0.051 0.268 0.014 0.194 0.004Arizona 0.038 0.510 0.869 0.286 1.000California 0.012 0.018 0.471 0.014 0.663Colorado 0.003 0.758 0.176 0.012 0.343Connecticut 0.047 0.157 0.002 0.010 0.194Delaware 0.070 1.000 0.776 1.000 1.000Florida 0.048 0.378 0.427 0.301 0.004Georgia 0.007 0.277 0.291 0.253 0.004Hawaii 1.000 0.617 0.235 0.060 1.000Iowa 0.000 0.032 0.001 0.767 0.614Illinois 0.325 0.499 0.551 0.189 1.000Indiana 0.003 1.000 0.095 0.058 0.003Kansas 0.000 0.147 0.662 0.017 0.776Kentucky 0.003 0.023 0.007 0.124 0.006Louisiana 1.000 1.000 0.781 1.000 0.336Massachusetts 0.277 1.000 0.086 0.463 1.000Maryland 0.105 0.878 0.882 0.370 0.809Maine 0.143 0.102 0.569 0.418 0.134Minnesota 0.001 0.011 0.038 0.061 0.649Missouri 0.000 0.680 0.154 0.042 0.000Mississippi 0.032 0.185 0.021 0.416 0.012Montana 0.349 0.710 0.004 0.407 1.000N. Carolina 0.003 0.374 0.242 0.304 0.022N. Dakota 0.026 0.947 1.000 0.144 1.000New Hampshire 0.031 1.000 0.292 0.452 0.281New Jersey 0.173 1.000 0.384 0.078 1.000New Mexico 0.108 0.718 0.465 0.106 1.000Nevada 0.025 0.432 0.207 1.000 1.000New York 0.104 0.929 0.947 0.138 0.667Ohio 0.021 0.040 0.176 0.424 0.289Oklahoma 0.001 1.000 0.613 0.050 1.000Oregon 0.497 0.793 0.613 0.887 1.000Pennsylvania 0.233 0.150 0.166 1.000 0.200Rhode Island 1.000 1.000 0.355 0.003 1.000S. Carolina 1.000 0.564 0.539 0.626 1.000S. Dakota 0.011 0.217 0.437 0.280 0.335Tennessee 0.041 0.296 0.096 0.031 0.187Texas 0.002 0.014 0.553 0.286 0.673Virginia 0.699 0.092 0.627 0.748 0.700Washington 0.065 1.000 0.431 0.000 0.663Wisconsin 0.041 0.307 0.286 0.109 0.347W. Virginia 0.003 0.401 0.017 0.044 0.003Wyoming 0.423 0.642 0.086 0.014 1.000
Mean 0.202 0.532 0.354 0.312 0.542SD 0.321 0.363 0.290 0.316 0.400
12
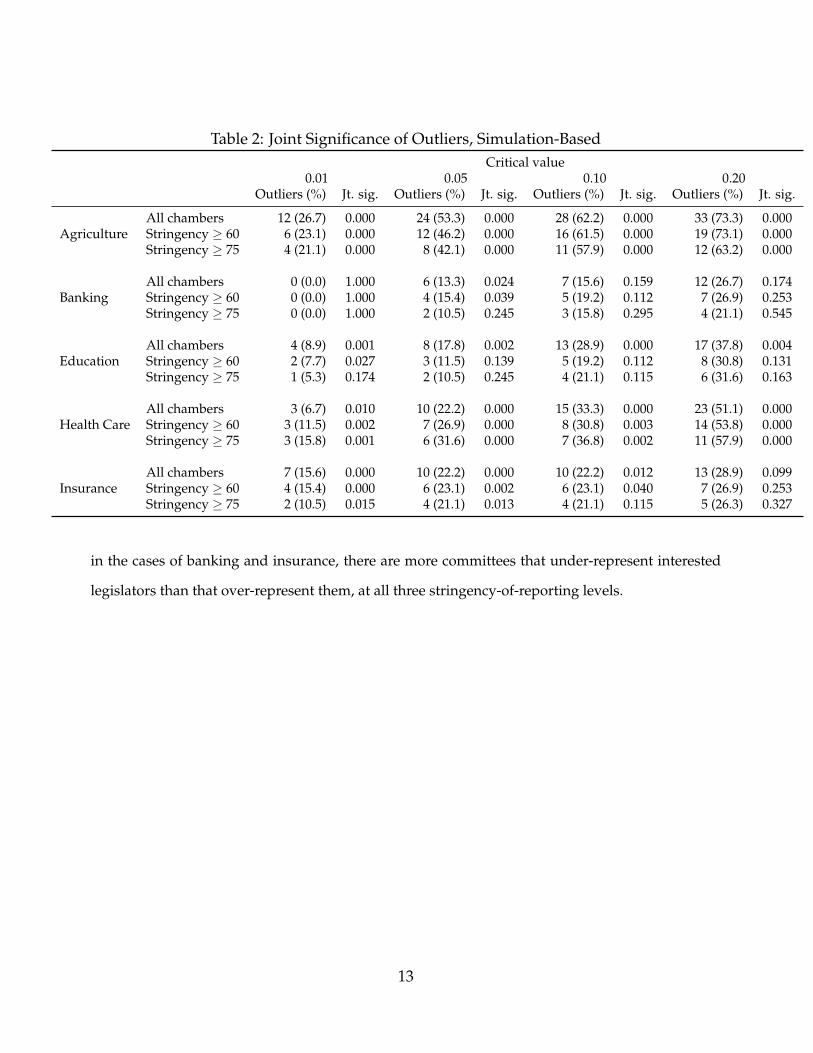
Table 2: Joint Significance of Outliers, Simulation-BasedCritical value
0.01 0.05 0.10 0.20Outliers (%) Jt. sig. Outliers (%) Jt. sig. Outliers (%) Jt. sig. Outliers (%) Jt. sig.
All chambers 12 (26.7) 0.000 24 (53.3) 0.000 28 (62.2) 0.000 33 (73.3) 0.000Agriculture Stringency ≥ 60 6 (23.1) 0.000 12 (46.2) 0.000 16 (61.5) 0.000 19 (73.1) 0.000
Stringency ≥ 75 4 (21.1) 0.000 8 (42.1) 0.000 11 (57.9) 0.000 12 (63.2) 0.000
All chambers 0 (0.0) 1.000 6 (13.3) 0.024 7 (15.6) 0.159 12 (26.7) 0.174Banking Stringency ≥ 60 0 (0.0) 1.000 4 (15.4) 0.039 5 (19.2) 0.112 7 (26.9) 0.253
Stringency ≥ 75 0 (0.0) 1.000 2 (10.5) 0.245 3 (15.8) 0.295 4 (21.1) 0.545
All chambers 4 (8.9) 0.001 8 (17.8) 0.002 13 (28.9) 0.000 17 (37.8) 0.004Education Stringency ≥ 60 2 (7.7) 0.027 3 (11.5) 0.139 5 (19.2) 0.112 8 (30.8) 0.131
Stringency ≥ 75 1 (5.3) 0.174 2 (10.5) 0.245 4 (21.1) 0.115 6 (31.6) 0.163
All chambers 3 (6.7) 0.010 10 (22.2) 0.000 15 (33.3) 0.000 23 (51.1) 0.000Health Care Stringency ≥ 60 3 (11.5) 0.002 7 (26.9) 0.000 8 (30.8) 0.003 14 (53.8) 0.000
Stringency ≥ 75 3 (15.8) 0.001 6 (31.6) 0.000 7 (36.8) 0.002 11 (57.9) 0.000
All chambers 7 (15.6) 0.000 10 (22.2) 0.000 10 (22.2) 0.012 13 (28.9) 0.099Insurance Stringency ≥ 60 4 (15.4) 0.000 6 (23.1) 0.002 6 (23.1) 0.040 7 (26.9) 0.253
Stringency ≥ 75 2 (10.5) 0.015 4 (21.1) 0.013 4 (21.1) 0.115 5 (26.3) 0.327
in the cases of banking and insurance, there are more committees that under-represent interested
legislators than that over-represent them, at all three stringency-of-reporting levels.
13
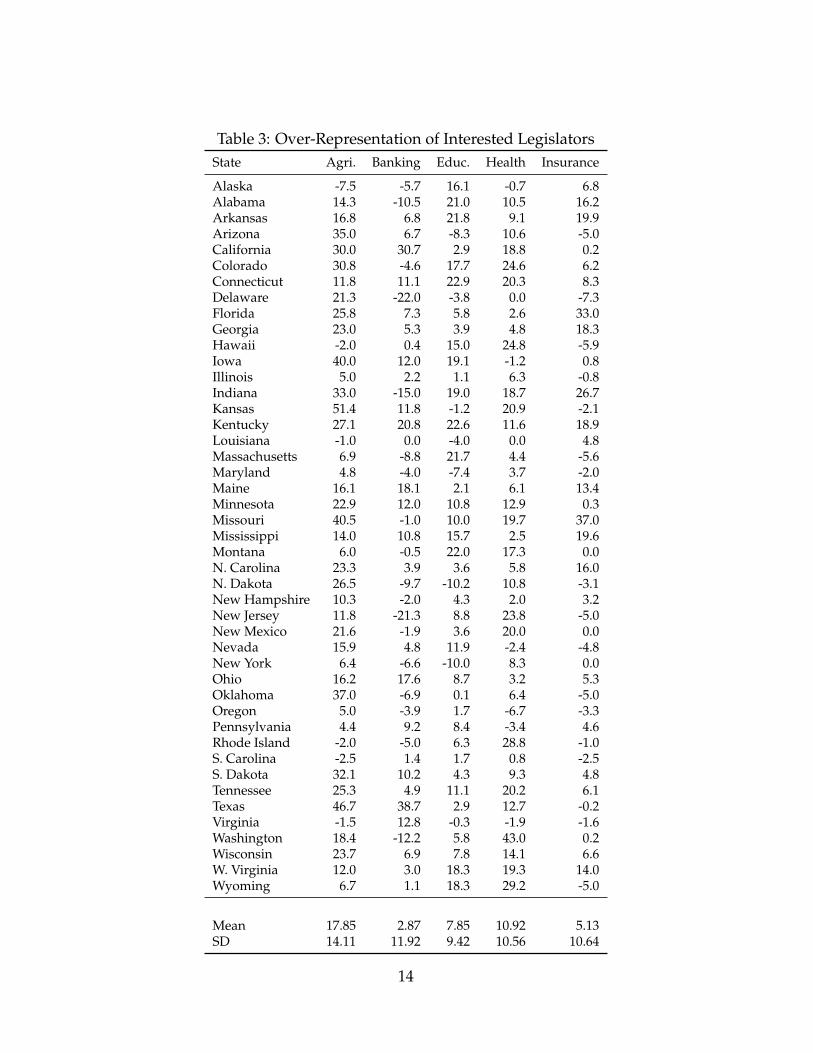
Table 3: Over-Representation of Interested LegislatorsState Agri. Banking Educ. Health Insurance
Alaska -7.5 -5.7 16.1 -0.7 6.8Alabama 14.3 -10.5 21.0 10.5 16.2Arkansas 16.8 6.8 21.8 9.1 19.9Arizona 35.0 6.7 -8.3 10.6 -5.0California 30.0 30.7 2.9 18.8 0.2Colorado 30.8 -4.6 17.7 24.6 6.2Connecticut 11.8 11.1 22.9 20.3 8.3Delaware 21.3 -22.0 -3.8 0.0 -7.3Florida 25.8 7.3 5.8 2.6 33.0Georgia 23.0 5.3 3.9 4.8 18.3Hawaii -2.0 0.4 15.0 24.8 -5.9Iowa 40.0 12.0 19.1 -1.2 0.8Illinois 5.0 2.2 1.1 6.3 -0.8Indiana 33.0 -15.0 19.0 18.7 26.7Kansas 51.4 11.8 -1.2 20.9 -2.1Kentucky 27.1 20.8 22.6 11.6 18.9Louisiana -1.0 0.0 -4.0 0.0 4.8Massachusetts 6.9 -8.8 21.7 4.4 -5.6Maryland 4.8 -4.0 -7.4 3.7 -2.0Maine 16.1 18.1 2.1 6.1 13.4Minnesota 22.9 12.0 10.8 12.9 0.3Missouri 40.5 -1.0 10.0 19.7 37.0Mississippi 14.0 10.8 15.7 2.5 19.6Montana 6.0 -0.5 22.0 17.3 0.0N. Carolina 23.3 3.9 3.6 5.8 16.0N. Dakota 26.5 -9.7 -10.2 10.8 -3.1New Hampshire 10.3 -2.0 4.3 2.0 3.2New Jersey 11.8 -21.3 8.8 23.8 -5.0New Mexico 21.6 -1.9 3.6 20.0 0.0Nevada 15.9 4.8 11.9 -2.4 -4.8New York 6.4 -6.6 -10.0 8.3 0.0Ohio 16.2 17.6 8.7 3.2 5.3Oklahoma 37.0 -6.9 0.1 6.4 -5.0Oregon 5.0 -3.9 1.7 -6.7 -3.3Pennsylvania 4.4 9.2 8.4 -3.4 4.6Rhode Island -2.0 -5.0 6.3 28.8 -1.0S. Carolina -2.5 1.4 1.7 0.8 -2.5S. Dakota 32.1 10.2 4.3 9.3 4.8Tennessee 25.3 4.9 11.1 20.2 6.1Texas 46.7 38.7 2.9 12.7 -0.2Virginia -1.5 12.8 -0.3 -1.9 -1.6Washington 18.4 -12.2 5.8 43.0 0.2Wisconsin 23.7 6.9 7.8 14.1 6.6W. Virginia 12.0 3.0 18.3 19.3 14.0Wyoming 6.7 1.1 18.3 29.2 -5.0
Mean 17.85 2.87 7.85 10.92 5.13SD 14.11 11.92 9.42 10.56 10.64
14
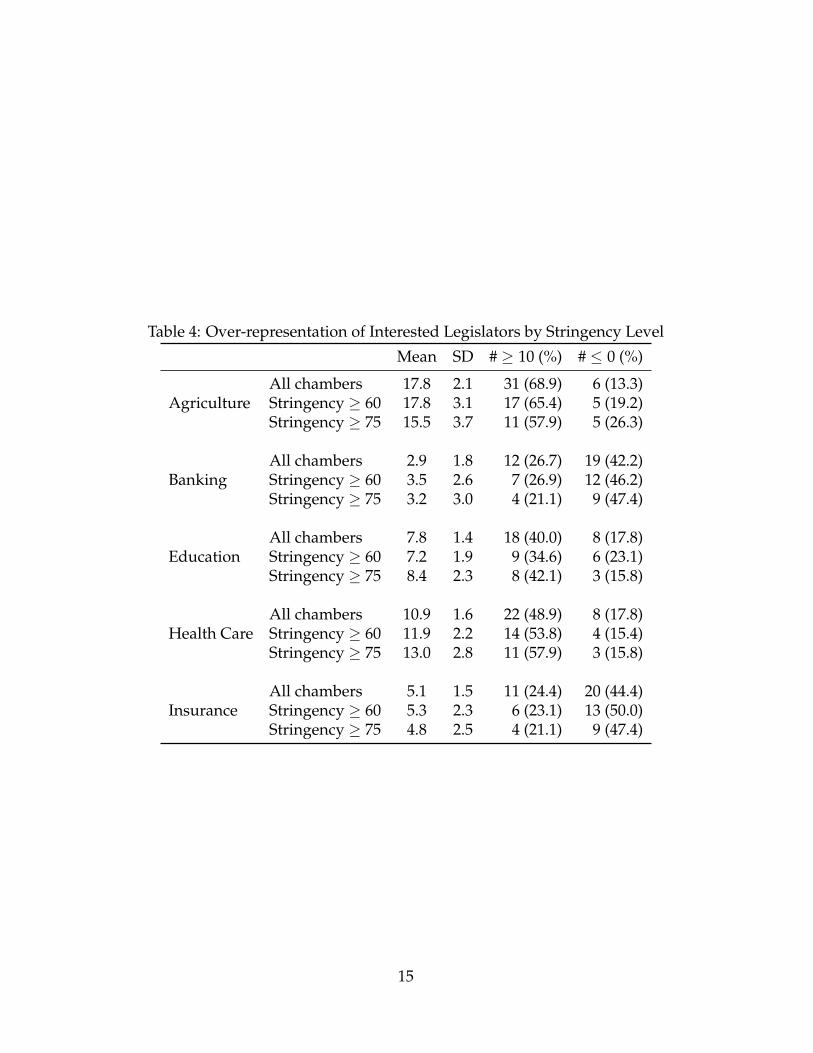
Table 4: Over-representation of Interested Legislators by Stringency Level
Mean SD # ≥ 10 (%) # ≤ 0 (%)
All chambers 17.8 2.1 31 (68.9) 6 (13.3)Agriculture Stringency ≥ 60 17.8 3.1 17 (65.4) 5 (19.2)
Stringency ≥ 75 15.5 3.7 11 (57.9) 5 (26.3)
All chambers 2.9 1.8 12 (26.7) 19 (42.2)Banking Stringency ≥ 60 3.5 2.6 7 (26.9) 12 (46.2)
Stringency ≥ 75 3.2 3.0 4 (21.1) 9 (47.4)
All chambers 7.8 1.4 18 (40.0) 8 (17.8)Education Stringency ≥ 60 7.2 1.9 9 (34.6) 6 (23.1)
Stringency ≥ 75 8.4 2.3 8 (42.1) 3 (15.8)
All chambers 10.9 1.6 22 (48.9) 8 (17.8)Health Care Stringency ≥ 60 11.9 2.2 14 (53.8) 4 (15.4)
Stringency ≥ 75 13.0 2.8 11 (57.9) 3 (15.8)
All chambers 5.1 1.5 11 (24.4) 20 (44.4)Insurance Stringency ≥ 60 5.3 2.3 6 (23.1) 13 (50.0)
Stringency ≥ 75 4.8 2.5 4 (21.1) 9 (47.4)
15
−20 0 20 40 60
0.00
0.01
0.02
0.03
0.04
0.05
Deviation from chamber %
Den
sity
(a) Agriculture
−20 0 20 40 60
0.00
0.01
0.02
0.03
0.04
0.05
Deviation from chamber %
Den
sity
(b) Banking
−20 0 20 40 60
0.00
0.01
0.02
0.03
0.04
0.05
Deviation from chamber %
Den
sity
(c) Education
−20 0 20 40 60
0.00
0.01
0.02
0.03
0.04
0.05
Deviation from chamber %
Den
sity
(d) Health Care
−20 0 20 40 60
0.00
0.01
0.02
0.03
0.04
0.05
Deviation from chamber %
Den
sity
(e) Insurance
Figure 1: Kernel Densities of Interested Legislator Representation
16
Jurisdiction breadth and interest over-representation
Variation in the breadth or specificity of committee jurisdictions provides another venue for testing
the distributive model. In the Weingast-Marshall model, the committees reflect the salient parts of
the logroll given institutional form. However, the constituent elements of the logroll coalition might
vary from state to state. This is not to say that we should expect different patterns of winners and
losers. Rather, we might expect one state to distributively divide itself along regional lines, with
committee jurisdictions reflecting this, while another might divide along economic-sector lines and
so have a different set of committees. If the distributive model is a powerful model, then we should
expect different logrolls to result in different committee systems, and for different types of legisla-
tors to self-select onto committees with wider or narrower jurisdictions. That is, an environment
and agriculture committee should attract a different mix of legislators than a straightforward agri-
culture committee, and a unified health, education, and welfare committee ought to represent a dif-
ferent logroll coalition (one in which, perhaps, policy liberals are important) than does a committee
dealing only with K-12 education, which might be dominated by legislators with ties to education.
This idea is not new; Shepsle (1978) argued that committees with broad, multipart jurisdictions
should be less prone to his interest-advocacy-accommodation syndrome because the various parts
of its jurisdiction would attract members with different interests, thus making it harder for any one
interest to have a commanding majority of the committee.
If the Weingast-Marshall model is strong, narrow committees should be more homogeneously
high-demanding than broad committees are. To examine this, I classified each jurisdiction into two
levels of specificity. Narrow-jurisdiction committees include committees whose stated jurisdiction
lines up perfectly with the relevant interest, such as education committees and banking committees,
as well as committee systems which assign more than one committee to the relevant interest, such
as chambers with separate higher education and K-12 education committees. Broad-jurisdiction
committees are those committees whose stated jurisdiction includes both a relevant interest and
some other concern. Examples of these multiple jurisdictions include committees on commerce;
banking and insurance; health and welfare; health, education, and welfare; agriculture and natural
17
resources, and so on. The jurisdictions are coded from the committee titles and the Council of State
Governments’ 1999 Directory II, which lists contact information for various legislative subject ar-
eas. (Council of State Governments 2000) I then simply compared the representativeness statistics,
both raw scores and percents of outliers at various degrees of severity, between narrow and broad
committees.
Table 5 displays these results for all committees and offers p-values from simple one-tailed t
tests. As it shows, there is a mixed effect of jurisdiction. In committees regulating health care, bank-
ing, and insurance, at least some measures of representativeness vary in response to the breadth of
the relevant committee’s jurisdiction. At the same time, however, there is no apparent effect in
committees regulating agriculture and education. Table 6 displays the analogous table for over-
representation of interested legislators in percentage terms. In this table, the raw values are the per-
cent of the committee who have a financial interest in the jurisdiction less the chamber percentage
of interested legislators. Entries reading “% ≤ 0%” give the percentage of committees that under-
represent interested legislators, those reading “% ≥ 10%” indicate the percentage of committees in
which interested legislators are over-represented by at least ten percentage points, and so on. The
results are similar for this table, except that Table 6 shows an effect for jurisdiction in agriculture as
well. In broad terms, what this means is that while health and welfare committees differ from health
committees, and commerce committees and unified banking and insurance committees differ from
banking or insurance committees, unified health, education, and welfare committees do not differ
noticeably from education committees. In neither case does dividing the data by stringency-of-
reporting levels offer any additional useful illumination. Further, the effect remains even when the
relevant interest is broadened with the jurisdiction. That is, banking committees are more likely
to over-represent bankers than banking-and-insurance committees are to over-represent the bank-
ing and insurance industries and than commerce or other broad committees are to over-represent
legislators with ties to financial industries.
These findings offer further support for the distributive model. Not only are there significant
numbers of outlying committees, committees with narrow jurisdictions are more outlying than
are committees with broad jurisdictions. The data are consistent with a story of logroll coalitions
18
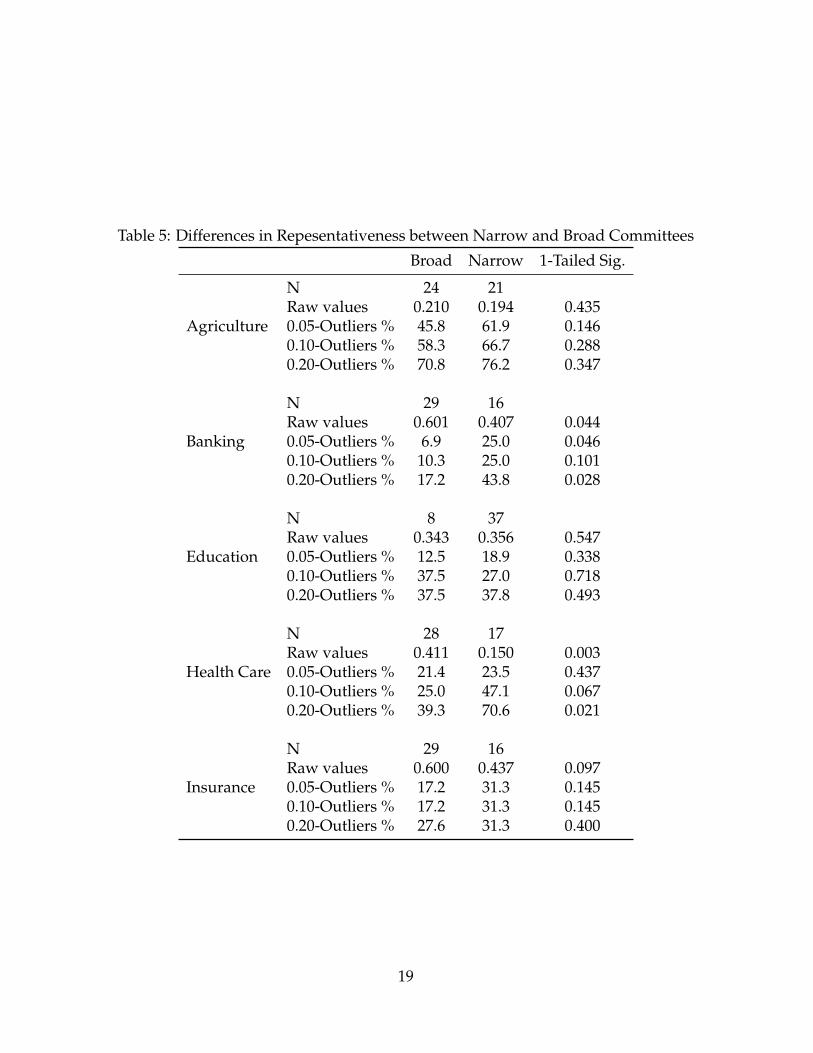
Table 5: Differences in Repesentativeness between Narrow and Broad Committees
Broad Narrow 1-Tailed Sig.
N 24 21Raw values 0.210 0.194 0.435
Agriculture 0.05-Outliers % 45.8 61.9 0.1460.10-Outliers % 58.3 66.7 0.2880.20-Outliers % 70.8 76.2 0.347
N 29 16Raw values 0.601 0.407 0.044
Banking 0.05-Outliers % 6.9 25.0 0.0460.10-Outliers % 10.3 25.0 0.1010.20-Outliers % 17.2 43.8 0.028
N 8 37Raw values 0.343 0.356 0.547
Education 0.05-Outliers % 12.5 18.9 0.3380.10-Outliers % 37.5 27.0 0.7180.20-Outliers % 37.5 37.8 0.493
N 28 17Raw values 0.411 0.150 0.003
Health Care 0.05-Outliers % 21.4 23.5 0.4370.10-Outliers % 25.0 47.1 0.0670.20-Outliers % 39.3 70.6 0.021
N 29 16Raw values 0.600 0.437 0.097
Insurance 0.05-Outliers % 17.2 31.3 0.1450.10-Outliers % 17.2 31.3 0.1450.20-Outliers % 27.6 31.3 0.400
19
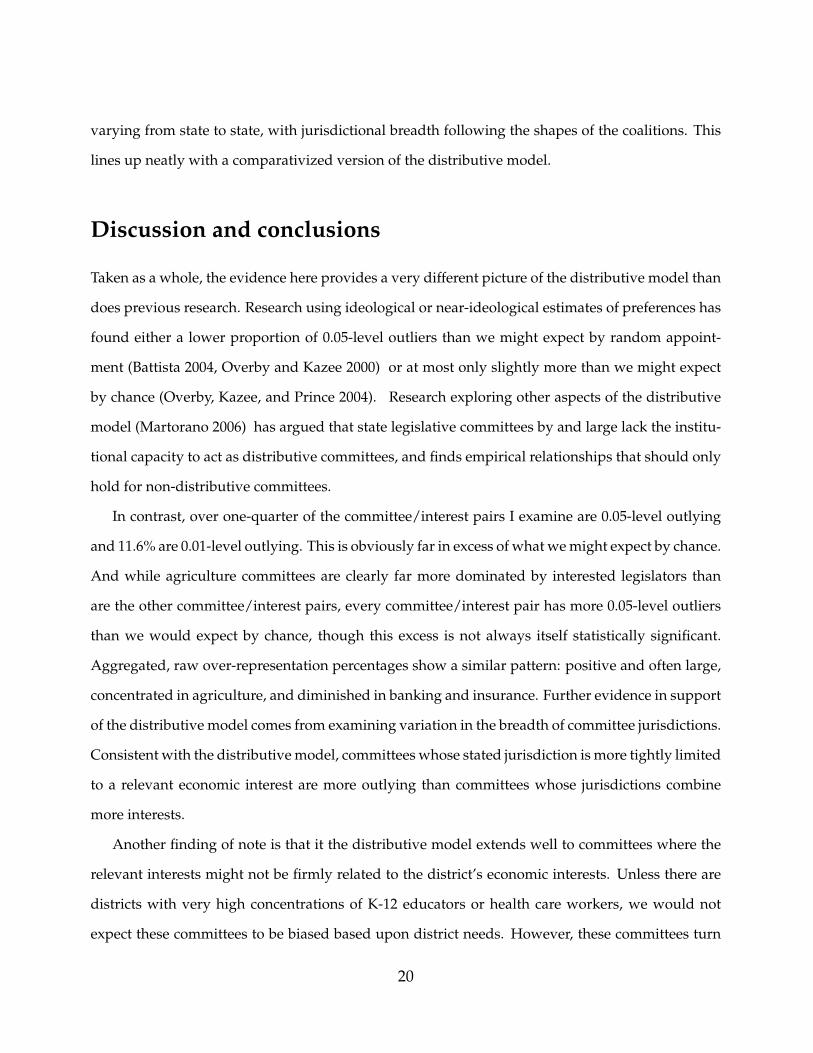
varying from state to state, with jurisdictional breadth following the shapes of the coalitions. This
lines up neatly with a comparativized version of the distributive model.
Discussion and conclusions
Taken as a whole, the evidence here provides a very different picture of the distributive model than
does previous research. Research using ideological or near-ideological estimates of preferences has
found either a lower proportion of 0.05-level outliers than we might expect by random appoint-
ment (Battista 2004, Overby and Kazee 2000) or at most only slightly more than we might expect
by chance (Overby, Kazee, and Prince 2004). Research exploring other aspects of the distributive
model (Martorano 2006) has argued that state legislative committees by and large lack the institu-
tional capacity to act as distributive committees, and finds empirical relationships that should only
hold for non-distributive committees.
In contrast, over one-quarter of the committee/interest pairs I examine are 0.05-level outlying
and 11.6% are 0.01-level outlying. This is obviously far in excess of what we might expect by chance.
And while agriculture committees are clearly far more dominated by interested legislators than
are the other committee/interest pairs, every committee/interest pair has more 0.05-level outliers
than we would expect by chance, though this excess is not always itself statistically significant.
Aggregated, raw over-representation percentages show a similar pattern: positive and often large,
concentrated in agriculture, and diminished in banking and insurance. Further evidence in support
of the distributive model comes from examining variation in the breadth of committee jurisdictions.
Consistent with the distributive model, committees whose stated jurisdiction is more tightly limited
to a relevant economic interest are more outlying than committees whose jurisdictions combine
more interests.
Another finding of note is that it the distributive model extends well to committees where the
relevant interests might not be firmly related to the district’s economic interests. Unless there are
districts with very high concentrations of K-12 educators or health care workers, we would not
expect these committees to be biased based upon district needs. However, these committees turn
20
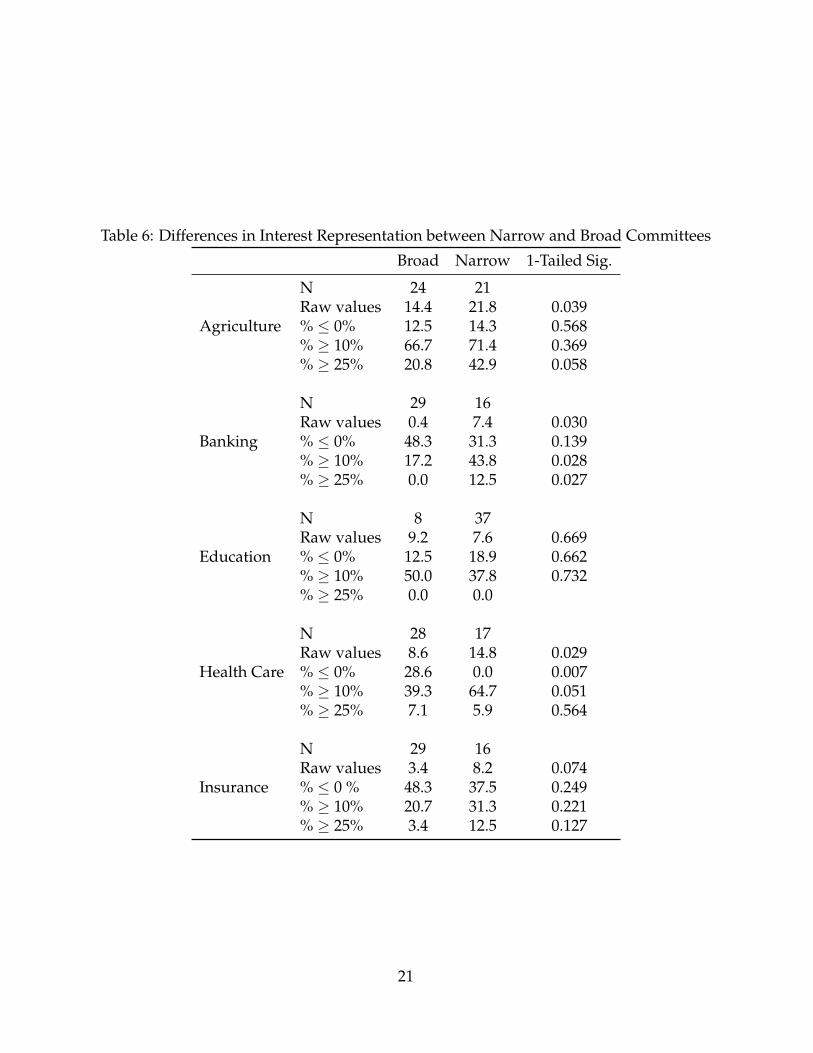
Table 6: Differences in Interest Representation between Narrow and Broad Committees
Broad Narrow 1-Tailed Sig.
N 24 21Raw values 14.4 21.8 0.039
Agriculture % ≤ 0% 12.5 14.3 0.568% ≥ 10% 66.7 71.4 0.369% ≥ 25% 20.8 42.9 0.058
N 29 16Raw values 0.4 7.4 0.030
Banking % ≤ 0% 48.3 31.3 0.139% ≥ 10% 17.2 43.8 0.028% ≥ 25% 0.0 12.5 0.027
N 8 37Raw values 9.2 7.6 0.669
Education % ≤ 0% 12.5 18.9 0.662% ≥ 10% 50.0 37.8 0.732% ≥ 25% 0.0 0.0
N 28 17Raw values 8.6 14.8 0.029
Health Care % ≤ 0% 28.6 0.0 0.007% ≥ 10% 39.3 64.7 0.051% ≥ 25% 7.1 5.9 0.564
N 29 16Raw values 3.4 8.2 0.074
Insurance % ≤ 0 % 48.3 37.5 0.249% ≥ 10% 20.7 31.3 0.221% ≥ 25% 3.4 12.5 0.127
21
out to be stacked in favor of interested legislators, if only mildly in the case of education committees.
This finding indicates that committees can serve as engines of vote-trading across policy areas that
are not necessarily of traditionally distributive import. At the same time, it should be noted that
agriculture committees, which would combine any exogenous interests legislators might have with
strong district needs, are substantially more biased than the other committee/interest pairs.
All of this means that our understanding of legislative committees and theories of legislative
committees must be more nuanced. It is not the case that the informational model is “simply ratio-
nal,” as Overby, Kazee, and Prince (2004) wrote when they found that only a few state legislative
committees were unrepresentative using NFIB scores. Borrowing an analogy from Groseclose and
King (1997), earlier evidence may have led us to award the Intercontinental Heavyweight Cham-
pionship belt to the informational model, at least for state legislatures, but the evidence presented
here indicates that this may have been premature. At the very least the picture is more complicated,
as it is for the U.S. House, where mixed findings are the norm.
One way in which our understanding might become more nuanced is at the intersection of the
distributive and informational models. In this paper, I have found unprecedented levels of support
for the distributive model among state legislatures. At the same time, earlier findings using (nearly)
ideological measures of preferences remain, and these articles found support for the informational
model. The question of how the findings here and earlier findings compare to each other imme-
diately presents itself. Happily, a direct comparison is possible for nearly all committees in my
sample. The interest data I use was submitted by legislators in 1999, and Wright (2004) collected
roll-call votes for all state legislative chambers in the 1999–2000 biennium (with one exception).
Given the roll-call votes, computing NOMINATE scores is trivially easy. This conjuncture of dif-
ferent data sources makes comparing interest-based and NOMINATE-based measures of committee
representativeness a tedious but ultimately uncomplicated matter of simply generating the requi-
site representativeness scores again using unidimensional NOMINATE scores instead of financial
interests as a measure of preferences.
I generated the NOMINATE-based representativeness scores again using simulations, except that
these simulations compare the actual committee median to the distribution of simulated committee
22
medians. Like the interest-based scores, the NOMINATE-based scores are essentially one-tailed p-
values; in this case, they are the proportion of simulated committees whose medians were to the
left1 of the actual committee median. Thus, a score of 0.01 indicates a liberal outlier.2
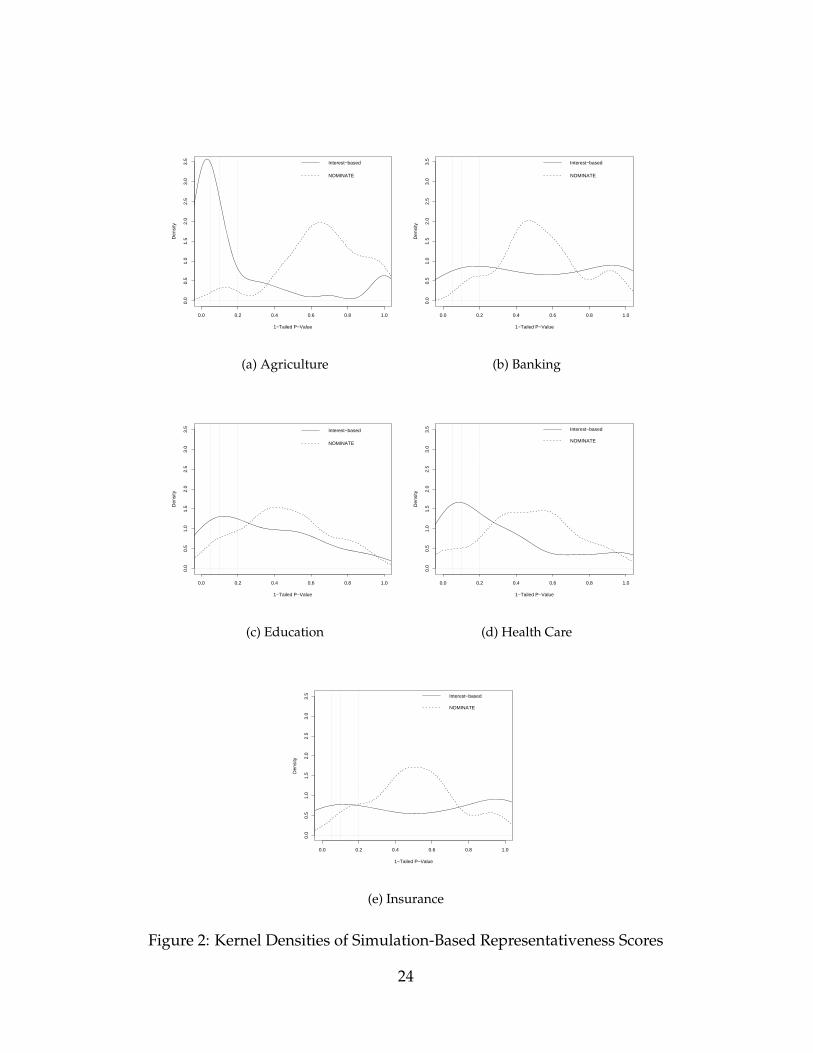
Figure 2 displays the densities of interest-based and NOMINATE-based measures of committee
representativeness. The vertical lines indicate the critical values of 0.05, 0.10, and 0.20. Because
these are one-sided p-values, high values do not denote committees that are especially representa-
tive. Rather, they denote committees in which interested legislators are radically under-represented
or committees far more conservative than we might expect from random appointment. Representa-
tive committees should be clustered near the 0.5 point. In each case, the distribution consistent with
the null hypothesis of random appointment is flat. The figure shows that interest-based and NOMI-
NATE-based measures of committee representativeness tell radically different tales. Except for com-
mittees regulating agriculture, which trend slightly conservative, NOMINATE-based measures show
more-or-less representative committees that tend to be neither disproportionately liberal nor dis-
proportionately conservative. Interest-based measures, however, are in three cases shifted strongly
to the left, showing a tendency towards the high-demanding outliers that the distributive model
predicts. In the cases of banking and insurance, the distribution of interest-based scores is flatter
than that of NOMINATE-based scores. However, this is to some extent an artifact of the kernel den-
sity estimator, and readers should note that the distributions in both of these committee / interest
pairs are slightly more bimodal and concentrated at the extremes than the figure might indicate.
1Strictly, closer to the NOMINATE endpoint dominated by Democrats.2The NOMINATE-based analysis is taken from a different project with a different data-collection effort for committee as-
signments. Accordingly, there are occasionally very slight variations in committee membership between the committee inthe interest-based analysis and the committee in the NOMINATE-based analysis if the Center’s data collection and my pre-vious data collection on committee assignments looked at different times in the relevant session. Based on an examinationof a large sample of committees, these differences are both rare and trivial and do not affect any conclusions.
23
0.0 0.2 0.4 0.6 0.8 1.0
0.0
0.5
1.0
1.5
2.0
2.5
3.0
3.5
1−Tailed P−Value
Den
sity
Interest−based
NOMINATE
(a) Agriculture
0.0 0.2 0.4 0.6 0.8 1.0
0.0
0.5
1.0
1.5
2.0
2.5
3.0
3.5
1−Tailed P−Value
Den
sity
Interest−based
NOMINATE
(b) Banking
0.0 0.2 0.4 0.6 0.8 1.0
0.0
0.5
1.0
1.5
2.0
2.5
3.0
3.5
1−Tailed P−Value
Den
sity
Interest−based
NOMINATE
(c) Education
0.0 0.2 0.4 0.6 0.8 1.0
0.0
0.5
1.0
1.5
2.0
2.5
3.0
3.5
1−Tailed P−Value
Den
sity
Interest−based
NOMINATE
(d) Health Care
0.0 0.2 0.4 0.6 0.8 1.0
0.0
0.5
1.0
1.5
2.0
2.5
3.0
3.5
1−Tailed P−Value
Den
sity
Interest−based
NOMINATE
(e) Insurance
Figure 2: Kernel Densities of Simulation-Based Representativeness Scores
24
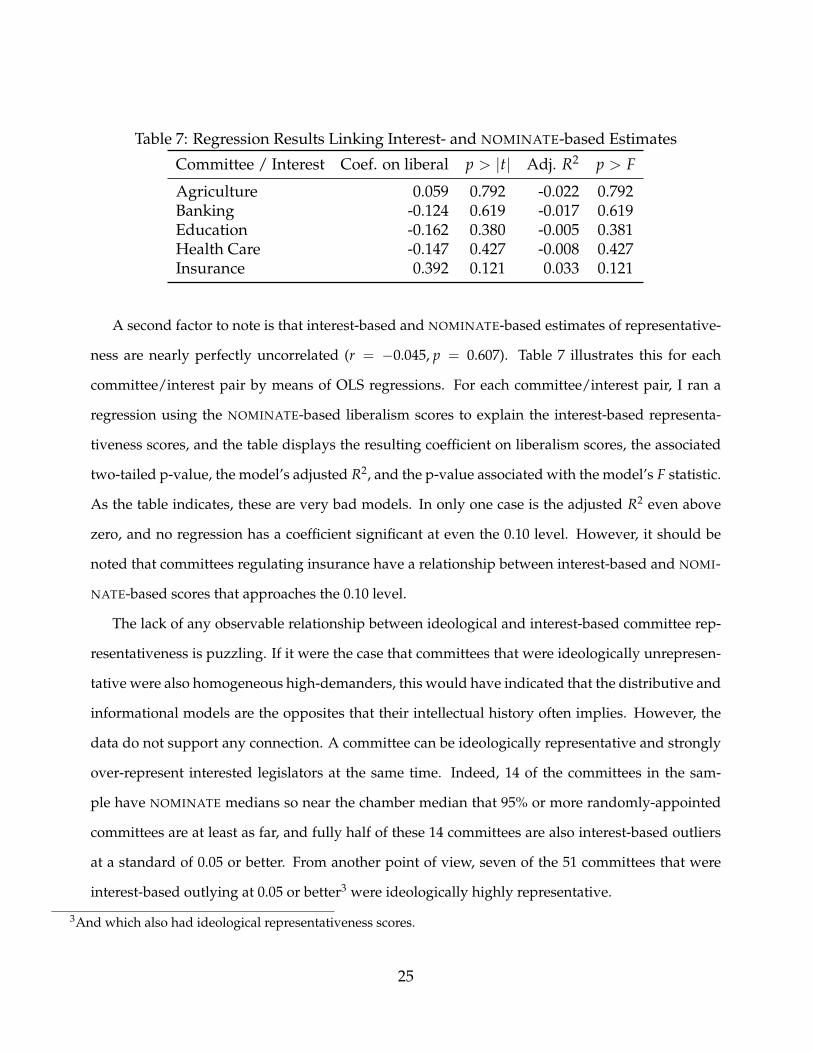
Table 7: Regression Results Linking Interest- and NOMINATE-based Estimates
Committee / Interest Coef. on liberal p > |t| Adj. R2 p > F
Agriculture 0.059 0.792 -0.022 0.792Banking -0.124 0.619 -0.017 0.619Education -0.162 0.380 -0.005 0.381Health Care -0.147 0.427 -0.008 0.427Insurance 0.392 0.121 0.033 0.121
A second factor to note is that interest-based and NOMINATE-based estimates of representative-
ness are nearly perfectly uncorrelated (r = −0.045, p = 0.607). Table 7 illustrates this for each
committee/interest pair by means of OLS regressions. For each committee/interest pair, I ran a
regression using the NOMINATE-based liberalism scores to explain the interest-based representa-
tiveness scores, and the table displays the resulting coefficient on liberalism scores, the associated
two-tailed p-value, the model’s adjusted R2, and the p-value associated with the model’s F statistic.
As the table indicates, these are very bad models. In only one case is the adjusted R2 even above
zero, and no regression has a coefficient significant at even the 0.10 level. However, it should be
noted that committees regulating insurance have a relationship between interest-based and NOMI-
NATE-based scores that approaches the 0.10 level.
The lack of any observable relationship between ideological and interest-based committee rep-
resentativeness is puzzling. If it were the case that committees that were ideologically unrepresen-
tative were also homogeneous high-demanders, this would have indicated that the distributive and
informational models are the opposites that their intellectual history often implies. However, the
data do not support any connection. A committee can be ideologically representative and strongly
over-represent interested legislators at the same time. Indeed, 14 of the committees in the sam-
ple have NOMINATE medians so near the chamber median that 95% or more randomly-appointed
committees are at least as far, and fully half of these 14 committees are also interest-based outliers
at a standard of 0.05 or better. From another point of view, seven of the 51 committees that were
interest-based outlying at 0.05 or better3 were ideologically highly representative.
3And which also had ideological representativeness scores.
25
What should we make of such two-faced committees? One option arises if we consider a mul-
tidimensional policy space. Under such circumstances, it is at least possible that the distributive
dimensions are not the dimensions with the greatest uncertainty. In the informational model, or
in the underlying Crawford and Sobel (1982) information transmission model, the “goal” of the
chamber is to reduce the uncertainty about the effects of policy. However, not all policies or pol-
icy dimensions have equal amounts of uncertainty over the effects of policies. In particular, there
ought to be generally less uncertainty about more straightforward distributive policies – figuring
out the likely effects of a direct subsidy, or of building an arguably unneeded road or bridge, should
not be rocket science. If the prime dimension of uncertainty is a general left-right continuum, the
same dimension that we would expect to be the primary dimension of conflict in the chamber,
this allows the possibility of committees that are both distributive and informational, that deliver
accurate information where there is uncertainty and, at the same time, bring home the bacon for
their constituents on other dimensions. That is, distributiveness and informativeness need not be
opposites if the information needed to reduce the relevant uncertainty is not strongly related to
distributive politics. Likewise, estimates of committee representativeness generated using ideolog-
ical preference estimates need not be merely (bad) proxies for estimates created using jurisdiction-
specific preference estimates; both may carry their own information. Hurwitz, Moiles, and Rohde
(2001) support this possibility. In an intensive study of the Agriculture Committee and agriculture-
related subcommittee of the Appropriations Committee in the 104th U.S. House, they found that
on some issues, the committees behaved consistently with the distributive model, while on oth-
ers its behavior was consistent with the partisan model. Similarly, Battista’s (2006) mixed findings
discussed earlier support the contention that distributiveness and informativeness can lie along dif-
ferent dimensions. Of course, this only raises the possibility of such mixed committees; there is no
guarantee that the committees observed here that are interest-based outliers and ideological inliers
were consciously selected to be such.
In summary, this paper presents new evidence for distributive committees in state legislatures.
By estimating preferences with financial interests, I have found that committees dealing with agri-
culture, banking, education, health care, and insurance have some tendency towards high-demanding
26
outliers. This represents far more support for the distributive theory of committees than had previ-
ously been found in state legislatures. Further, more narrowly-defined committees are more prone
to unrepresentativeness than are committees with broad jurisdictions, consistent with the distribu-
tive model.
The most obvious implication of this is that the vote-trading based distributive model gener-
alizes far better than we had previously suspected. Previous recent work on Congress and state
legislatures led to the conclusion that while the distributive model might have something to say
about the organization of Congress, it was relatively limited to that institution. Here, I find that
this is not the case. The distributive model applies reasonably well to state legislatures. Note that
this is the case even for committees that are not distributive in the conventional sense, though
tendencies towards unrepresentativeness are far stronger for agriculture, the lone traditionally dis-
tributive committee. This offers further support for the Weingast-Marshall model by supporting its
hypothesized mechanism of committees as agents of vote trading across issue areas, showing that
it generalizes to dimensions of political conflict beyond geographically distributive politics. This
paper’s findings also indicate that, much like in Congress, estimating preferences in ways that are
appropriate to the theory in question is an important part of testing the applicability of that theory.
A second implication joins other recent work: committees are more complex creatures than
most of our theories posit. While the evidence here supports the distributive model, it does not
do so wholeheartedly or without hesitation. Twenty-seven percent of the committees in my sam-
ple under-represent the relevant interest on the committee, and a further 17% over-represent the
relevant interest by no more than five percentage points, and these committees are concentrated in
banking and insurance. So even at the most direct level, the evidence presented here does not imply
that the informational or partisan models have been somehow invalidated or disconfirmed. When
placed into context with results from NOMINATE-based measures of preferences, this becomes even
more stark. Committees, it seems, can have both distributive and informational elements, and hav-
ing more of one does not imply having less of the other.
Understanding the greater complexity of legislative committees points towards one obvious
venue for future research, following along the lines of Hurwitz, Moiles, and Rohde (2001). What
27
drives a chamber’s choices among different levels of informativeness and distributive utility at
the same time? What institutional features conduce to more purely informational or distributive
committees, and which foster committees with strong elements of both? For committees that share
distributive and informational aspects, when do they show their distributive face, and when their
informational? What determines when the party or chamber steps in to take more effective control
of the committee, or constrain it more rigorously? How can we predict committee behavior when
our baseline is multidimensional and complex instead of a one-dimensional, reductionist account?
Given that the breadth or narrowness of a committee’s jurisdiction seems an important predictor
of interest over-representation, what institutional, membership, or other factors can help us predict
when a chamber will choose narrow jurisdictions over broad?
Another obvious ground for future research involves cross-checking and triangulating on jurisdiction-
specific measures of preferences. Doing so might help to address the key drawback of the financial-
interest data I use to estimate preferences, the lack of scale. The data I use here indicate whether
a legislator has an interest in a given economic sector, but not how strong that interest might be.
One way to check would be to compare financial-interest data to interest group scores. Key prob-
lems with interest group scores in state legislatures are availability and comparability – the scores
are hard to come by, and difficult or impossible to compare across states since there are very few
national interest groups that rate state legislators. However, it should be possible to check that
state legislators with a financial interest in an industry also have higher interest-group scores for
that industry, as well as getting some sense of the average magnitude of the effect. Similarly, if
the data were more easily available it would be possible to compare a district’s economic and de-
mographic characteristics with the financial interests (and possibly interest group scores) of their
elected legislators.
28
ReferencesAdler, E. Scott and John Lapinski. 1997. “Demand-Side Theory and Congressional Committee
Composition: A Constituency Characteristics Approach.” American Journal of Political Science41:895–918.
Battista, James Coleman. 2004. “Reexamining Legislative Committee Representativeness in theStates.” State Politics and Policy Quarterly 4:161–180.
Battista, James Coleman. 2006. “Committee Theories and Committee Votes: Internal CommitteeBehavior in the California Legislature.” State Politics and Policy Quarterly 6:151–173.
Center for Public Integrity. 1999. “Hidden Agendas: How State Legislators Keep Conflicts ofInterest Under Wraps.” http://www.publicintegrity.org/oi/report.aspx?aid=617, accessed 9November 2006.
Center for Public Integrity. 2000. “Nationwide Numbers.”http://www.publicintegrity.org/oi/report.aspx?aid=615, accessed 9 November 2006.
Center for Public Integrity. 2006. “About Us.” http://www.publicintegrity.org/about/about.aspx,accessed 9 November 2006.
Council of State Governments. 2000. CSG Directory Two: Legislative Leadership, Committees, and Staff.Lexington, KY: Council of State Governments.
Cox, Gary W. and Mathew D. McCubbins. 1993. Legislative Leviathan: Party Government in the House.Berkeley: University of California Press.
Crawford, Vincent P. and Joel Sobel. 1982. “Strategic Information Transmission.” Econometrica 50.
Gilligan, Thomas W. and Keith Krehbiel. 1990. “Organization of Informative Committees by aRational Legislature.” American Journal of Political Science 34:531–564.
Groseclose, Tim. 1994. “Testing Committee Composition Hypotheses for the U.S. Congress.” Journalof Politics 56:440–458.
Groseclose, Tim and David C. King. 1997. “Committee Theories and Committee Institutions.” Pre-sented at the Annual Meeting of the American Political Science Association, Washington, D.C.
Hamm, Keith E. 1986. “The Role of ‘Subgovernments’ in U.S. State Policy Making: An ExploratoryAnalysis.” Legislative Studies Quarterly 11:321–351.
Hurwitz, Mark S., Roger J. Moiles and David W. Rohde. 2001. “Distributive and Partisan Issues inAgriculture Policy in the 104th House.” American Political Science Review 95:911–922.
Jewell, Malcolm E. 1981. “Editor’s Introduction: The State of U.S. State Legislative Research.”Legislative Studies Quarterly 6:1–25.
Krehbiel, Keith. 1990. “Are Congressional Committees Composed of Preference Outliers?” Ameri-can Political Science Review .
Krehbiel, Keith. 1991. Information and Legislative Organization. Ann Arbor: University of MichiganPress.
Maltzman, Forrest. 1997. Competing Principals: Committees, Parties, and the Organization of Congress.Ann Arbor: University of Michigan Press.
29
Martorano, Nancy. 2006. “Balancing Power: Committee System Autonomy and Legislative Orga-nization.” Legislative Studies Quarterly 31:205–234.
Overby, L. Marvin and Thomas A. Kazee. 2000. “Outlying Committees in the Statehouse: AnExamination of the Prevalence of Committee Outliers in State Legislatures.” Journal of Politics62:701–728.
Overby, L. Marvin, Thomas A. Kazee and David W. Prince. 2004. “Committee Outliers in StateLegislatures.” Legislative Studies Quarterly 29:81–107.
Parker, Glenn R., Suzanne L. Parker, Juan C. Copa and Mark D. Lawhorn. 2004. “The Question ofCommittee Bias Revisited.” Political Research Quarterly 57:431–440.
Poole, Keith and Howard Rosenthal. 1997. Congress: A Political-Economic History of Roll-Call Voting.New York: Oxford University Press.
Prince, David W. and L. Marvin Overby. 2005. “Legislative Organization Theory and CommitteePreference Outliers in State Senates.” State Politics and Policy Quarterly 5:68–87.
Shepsle, Kenneth A. 1978. The Giant Jigsaw Puzzle: Democratic Committee Assignments in the ModernHouse. Chicago: University of Chicago Press.
Shepsle, Kenneth A. and Barry R. Weingast. 1987. “The Institutional Foundations of CommitteePower.” American Political Science Review 81:85–104.
Squire, Peverill and Keith E. Hamm. 2005. 101 Chambers: Congress, State Legislatures, and the Futureof Legislative Studies. Columbus, OH: Ohio State.
Weingast, Barry R. and William J. Marshall. 1988. “The Industrial Organization of Congress; , Or,Why Legislatures, Like Firms, Are Not Organized as Markets.” Journal of Political Economy96:132–163.
Wright, Gerald C. 2004. “Representation in America’s Legislatures.” Indiana University: NationalScience Foundation Grant.
30