lecture: solidification and growth kinetics
TRANSCRIPT

Textbook: Phase transformations in metals and alloys
(Third Edition), By: Porter, Easterling, and Sherif (CRC
Press, 2009).
Diffusion and Kinetics
Lecture: Solidification and Growth Kinetics
Nikolai V. Priezjev
Solidification and Growth Kinetics
► Nucleation in Pure Metals
1) Homogeneous Nucleation, 2) Nucleation Rate, 3) Heterogeneous Nucleation
► Growth of a Pure Solid
1) Growth mechanisms: Continuous and Lateral
► Alloy Solidification
► Solidification of Ignots and Casting
► Rate of a phase transformation
Reading: Chapter 4 of Porter, Easterling, Sherif
https://www.slideshare.net/NikolaiPriezjev

Nucleation
Heterogeneous – the new phase appears on the walls of the container, at impurity
particles, etc.
Homogeneous – solid nuclei spontaneously appear within the undercooled phase.
Let’s consider solidification of
a liquid phase undercooled
below the melting temperature
as a simple example of
a phase transformation.

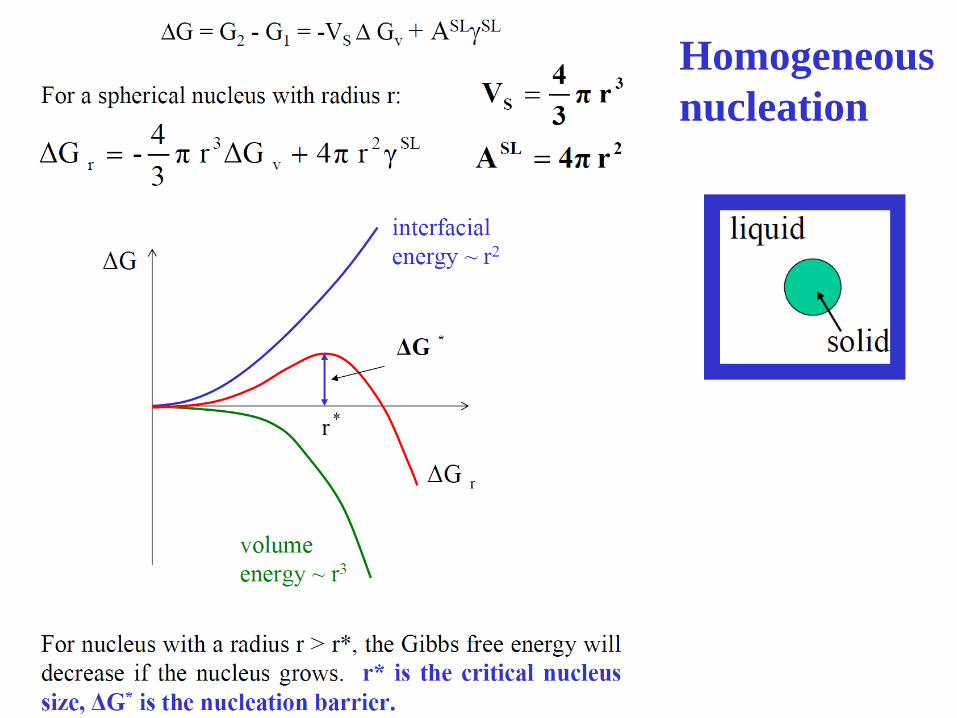
Homogeneous nucleation
Is the transition from undercooled liquid to a
solid spherical particle in the liquid a
spontaneous one?
That is, does the Gibbs free energy decreases?

Reminder:
Driving
force for
solidification
(ΔGv)

Origin of the
interfacial
energy (γSL)
Homogeneous
nucleation

Homogeneous
nucleation
Gibbs-Thomson effect
r

Homogeneous
nucleation

Homogeneous
nucleation
https://www.slideshare.net/NikolaiPriezjev

Homogeneous
nucleation
A two-dimensional representation of an instantaneous
picture of the liquid structure. Many close packed
crystal-like clusters (shaded) are present.
A number of spherical clusters
of radius r is given by
kT
Gnn r
r exp0
system in the atoms ofnumber 0 n
r allfor validwhen mTT
rrfor validwhen mTT
nuclei stable are
rr clusters when mTT
SLvr rGrG 23 43
4
Example: 1mm3 copper at Tm (~1020 atoms):
~1014 clusters of 0.3nm radius (~10 atoms)
~10 clusters with radius 0.6nm (~60 atoms)

Homogeneous
nucleation
A number of spherical clusters
of radius r is given by
kT
Gnn r
r exp0
system in the atoms ofnumber 0 n
r allfor validwhen mTT
rrfor validwhen mTT
nuclei stable are
rr clusters when mTT
The variation of r* and rmax with undercooling ΔT.
TH
Tr
m
mSL
12
SLvr rGrG 23 43
4
mT
Liquid Solid

Homogeneous
nucleation
kT
Gnn r
r exp0

Rate of
homogeneous
nucleation

Rate of
homogeneous
nucleation
kTH
TA
m
mSL
2
23
3
16
mT

https://www.slideshare.net/NikolaiPriezjev

Heterogeneous nucleation
https://www.slideshare.net/NikolaiPriezjev

Heterogeneous
nucleation
Shape factor

Heterogeneous
nucleation
Gibbs-Thomson effect
mT 5.0,90 S

Heterogeneous
nucleation
mT

Heterogeneous nucleation
Heterogeneous nucleation in mould-wall cracks, (a) The critical nuclei, (b) The
upper nucleus cannot grow out of the crack while the lower one can.
TH
Tr
m
mSL
12
vGVG
2
1
V* = volume of the critical nucleus (sphere or cap)
small
large
90
*
*
r
V
https://www.slideshare.net/NikolaiPriezjev

Pre-melting
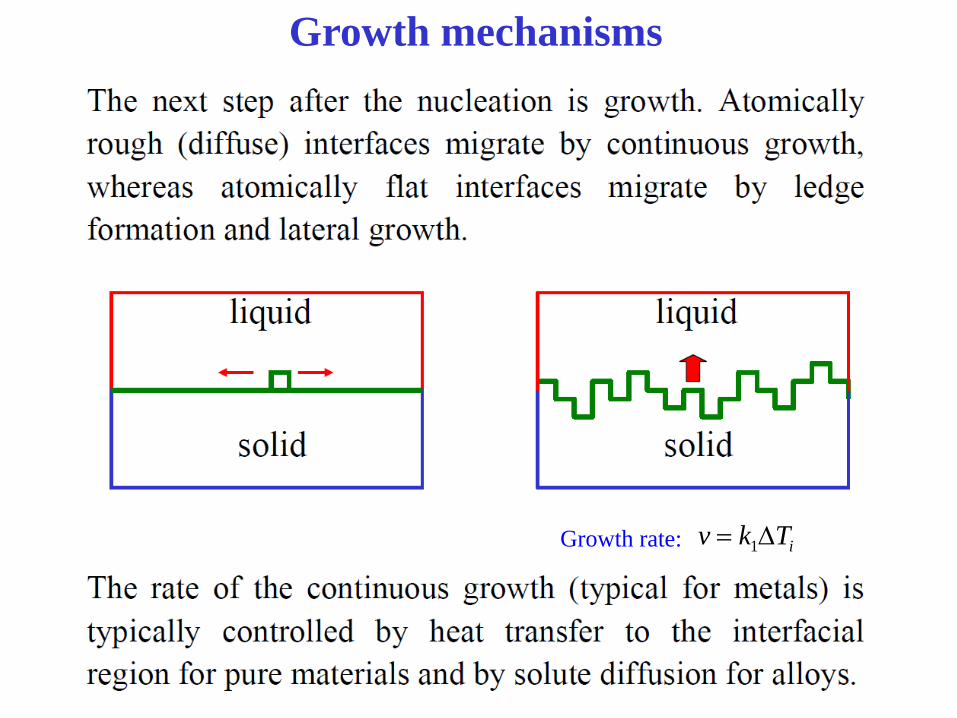
Growth mechanisms
iTkv 1Growth rate:

Growth mechanisms
2
2 )/exp( iTkv Growth rate:

Growth mechanisms
2
3 )( iTkv Growth rate:

Growth mechanisms
The influence of interface
undercooling (ΔTi) on growth rate
for atomically rough and smooth
interfaces.
mT

4.2.3 Heat Flow and Interface Instability (pure Metals)
(a) Temperature distribution for solidification when heat is extracted through the liquid,
(b) for a planar S/L interface, and (c) for a protrusion.
vLLSS vLTKTK
Thermal
conductivity Rate of growth
of the solidTemperature
gradient
Latent heat of
fusion per unit
volume
Supercooled
below Tm
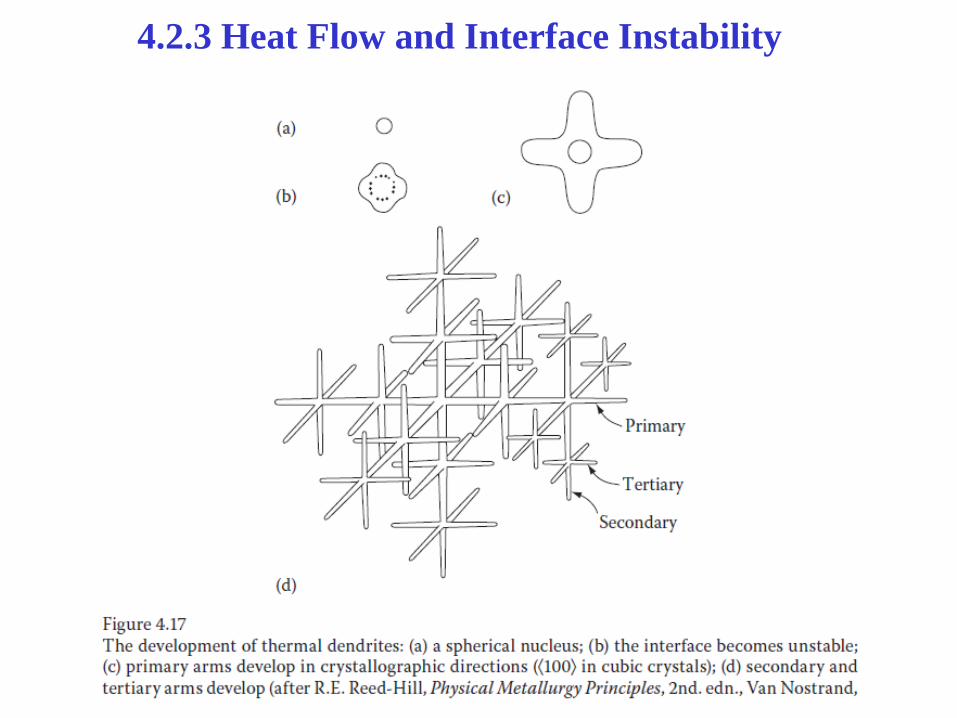
4.2.3 Heat Flow and Interface Instability

4.2.3 Heat Flow and Interface Instability
Temperature
distribution at the
tip of a growing
thermal dendrite.
Isothermal
solid 0ST
vLLSS vLTKTK
r
T
L
K
L
TKv c
v
L
v
LL
Gibbs-Thomson effect:
m
v
T
TL
rG
2
r
rT
rL
TT
v
mr
2 0
0
2
TL
Tr
v
m
Driving force
for solidification
Minimum possible
critical nucleus radius
r
r
r
T
L
Kv
v
L 10
Interface temperature
*r2r max,
,0
,0
v
rv
rrv Gibbs-Thomson effect
Slow heat conduction
Maximum velocity

A hypothetical phase diagram, partition coefficient k = XS/XL is constant (independent of T).
XS = mole fraction of solute in the solid
XL = mole fraction of solute in the liquid at equilibrium.
Assumption: liquidus and
solidus are straight lines
composition of solidcomposition of liquid
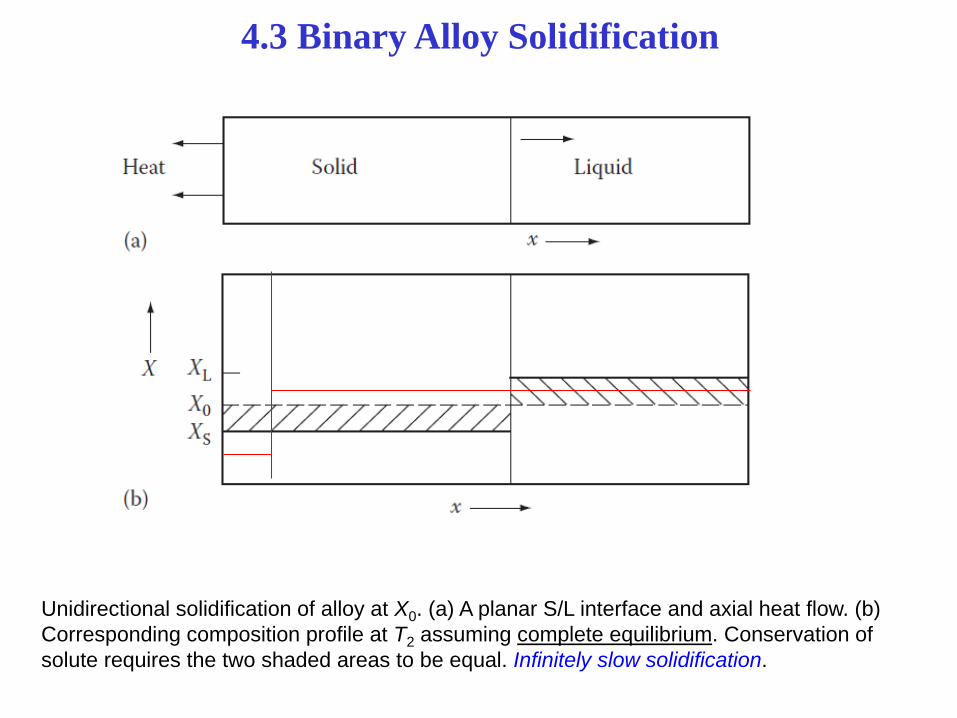
4.3 Binary Alloy Solidification
4.3 Binary Alloy Solidification
Unidirectional solidification of alloy at X0. (a) A planar S/L interface and axial heat flow. (b)
Corresponding composition profile at T2 assuming complete equilibrium. Conservation of
solute requires the two shaded areas to be equal. Infinitely slow solidification.

No diffusion in solid, perfect mixing (stirring) in liquid.
Planar front solidification of alloy X0 assuming no diffusion in the solid, but complete mixing in the liquid. (a) As
before, but including the mean composition of the solid (dashed curve). (b) Composition profile just under T1.
(c) Composition profile at T2. (d) Composition profile at the eutectic temperature and below.
4.3 Binary Alloy Solidification
Liquid richer in solute.
X0
X0

4.3 Binary Alloy Solidification
No diffusion in solid,
diffusional mixing in liquid.
Liquid richer
in solute.
Steady state with v:
rate of solute diffusion
down concentration
gradient = rate solute
rejected from
interface.
)( SLL CCvCD

Development of microstructure in eutectic alloys (I)
Several different types of microstructure can be formed in slow cooling an different
compositions. Let’s consider cooling of liquid lead – tin system as an example.

Development of microstructure in eutectic alloys (II)
At compositions between the room temperature solubility limit and the maximum
solid solubility at the eutectic temperature, phase nucleates as the solid
solubility is
exceeded upon
crossing the
solvus line.

Development of microstructure in eutectic alloys (III)Solidification at the eutectic composition
No changes above the eutectic temperature TE. At TE all the liquid transforms to
and phases
(eutectic reaction).

Development of microstructure in eutectic alloys (IV)Solidification at the eutectic composition
Formation of the eutectic structure in the lead-tin system. In the micrograph, the
dark layers are lead-reach phase, the light layers are the tin-reach phase.
Compositions of and phases are very different eutectic reaction involves
redistribution of Pb and Sn atoms by atomic diffusion.
This simultaneous
formation of and
phases result in a
layered (lamellar)
microstructure
that is called
eutectic
structure.

Development of microstructure in eutectic alloys (V)
Compositions other than eutectic but within the range of the eutectic isotherm
Primary phase is formed in the + L region, and the eutectic structure that
includes layers of
and phases
(called eutectic
and eutectic
phases) is formed
upon crossing
the eutectic
isotherm.

Development of microstructure in eutectic alloys (VI)
Although the eutectic structure
consists of two phases, it is a
microconstituent with distinct
lamellar structure and fixed ratio
of the two phases.

4.3 Growth of Lamellar Eutectics
Interdiffusion in the liquid ahead of
a eutectic front.Molar free energy diagram at a temperature ΔT0
below the eutectic temperature, for the case = *.
Gibbs-Thomson effect:
mT
TH
rG
2 Driving force
for solidification
mVGG
2)()(
ET
THG 0
)(
0
2
TH
TV Em
=0

4.3 Growth of Lamellar Eutectics
(a) Molar free energy diagram at (TE - ΔT0) for the
case * < < ∞, showing the composition difference
available to drive diffusion through the liquid (ΔX).
(b) Model used to calculate the growth rate.
XDkv
1
Interdiffusion in the liquid ahead of
a eutectic front.
*
0 1XX
00 TX
*
02 1 1
TDkv

Homogeneous
nucleation
kT
Gnn r
r exp0

Rate of
homogeneous
nucleation
Gibbs-Thomson effect:
mT
TH
rG
2
Driving force
for solidification

5. TTT (Time Temperature Transformation) Diagrams
The percentage transformation versus time for different transformation temperatures.