enrichment, growth kinetics and ecophysiology of …
TRANSCRIPT

Instructions for use
Title ENRICHMENT, GROWTH KINETICS AND ECOPHYSIOLOGY OF ANAMMOX BACTERIA
Author(s) 張, 磊
Citation 北海道大学. 博士(工学) 甲第13219号
Issue Date 2018-03-22
DOI 10.14943/doctoral.k13219
Doc URL http://hdl.handle.net/2115/73113
Type theses (doctoral)
File Information Zhang_Lei.pdf
Hokkaido University Collection of Scholarly and Academic Papers : HUSCAP

ENRICHMENT, GROWTH KINETICS AND
ECOPHYSIOLOGY OF ANAMMOX BACTERIA
ZHANG LEI
Supervisor: Professor Satoshi OKABE
Division of Environmental Engineering
Department of Engineering
Hokkaido University
This thesis is submitted in partial fulfilment of the requirements for the degree of
Doctor of Philosophy in Engineering


i
Wo
rd T
emp
late
by
Fri
edm
an &
Mo
rgan
20
14
Declaration
This dissertation is the result of my own work and includes nothing, which is the
outcome of work done in collaboration except where specifically indicated in the text.
It has not been previously submitted, in part or whole, to any university of institution for
any degree, diploma, or other qualification.
Signed:______________________________________________________________
Date:_________________________________________________________________

ii
Wo
rd T
emp
late
by
Fri
edm
an &
Mo
rgan
20
14
ABSTRACT
Anaerobic ammonium oxidizing (anammox) bacteria have the unique
metabolic ability to convert ammonium and nitrite to dinitrogen gas. This discovery led
to the knowledge that activity of these bacteria were responsible for a substantial part
(50 – 100%) of the enormous nitrogen losses observed in the freshwater and marine
environments. However, ecophysiology and niche differentiation of anammox bacteria
are still the enigma that remains due to the time-consuming enrichment methods,
insufficient/inaccurate knowledge of growth kinetics and various environmental factors
involved that yet to be identified. In this thesis, I focus on the eco-physiological
characteristics of anammox bacteria to address their niche differentiation and ecological
significance. In chapter 3, since it is still not possible to achieve pure culture of
anammox bacteria, lack of appropriate culture has become the biggest hurdle for
physiological study of anammox bacteria requiring high purity planktonic culture. Such
culture has once been obtained using membrane bioreactor before, but took
considerably amount of time and efforts. This chapter focuses on the development of a
novel method for rapid cultivation of free-living anammox cells using immobilization
technique. It was demonstrated that active free-living planktonic anammox cells with
purity > 95% was successfully developed in the MBR with overall only 35 days
operation time. In chapter 4, it was acknowledged that the specific niche of certain
microorganism is mostly determined from their kinetics including maximum specific
growth rate. Inaccurate information of their kinetics would inevitably disturb the
interpretation of their behaviour in complex eco-systems. Specifically, in the case of
anammox bacteria, whose maximum specific growth rate is always in debate. In this
chapter, a reliable re-evaluation procedure for maximum specific growth rates of three
anammox species was developed and showing that anammox bacteria may not
appropriate to be considered as slow-growing bacteria any more. In chapter 5,
previously the issue of niche differentiation of anammox bacteria has been addressed by
analysing the database of so far published 16S rRNA gene sequences, illustrating their
niche partitioning and global distribution. However, information regarding their true
dynamic behaviour could not be obtained. Enriched culture-dependent competition
under given conditions is a direct way to illustrate their niche differentiation. In this
chapter, the microbial competitions for a common substrate (nitrite) among three
anammox species (i.e. “Ca. Brocadia sinica”, “Ca. Jettenia caeni” and “Ca. Kuenenia

Enrichment, growth kinetics and ecophysiology of anammox bacteria – ZHANG Lei – 12/2017
iii
Wo
rd T
emp
late
by
Fri
edm
an &
Mo
rgan
20
14
stuttgartiensis”) were systematically investigated in nitrite-limited gel-immobilized
column reactors (GICR) and membrane bioreactors (MBRs) under different nitrogen
loading rates (NLRs). 16S rRNA gene-based population dynamics revealed that “Ca. J.
caeni” could proliferate only at low NLRs, whereas “Ca. B. sinica” outcompeted other
two species at higher NLRs in both types of reactors, demonstrating NLR was one of
factors determining ecological niche differentiation of “Ca. B. sinica” and “Ca. J. caeni”.
On the other hand, a statistical study looking at over 6000 anammox 16S rRNA gene
sequences from the public database, indicated that salinity was the most important
factor governing anammox bacterial distributions, with “Ca. Scalindua” dominated in
saline environments while “Ca. Brocadia” were mostly found in freshwater
environments. Though it is strongly suggested, physiological verification of salinity as a
niche factor for anammox bacteria has never been conducted. Detailed understanding of
the extent of the effect of salinity on adaptation, genetic basis and ecological
significance are all completely lacking at this moment. In this chapter, we conducted
both batch and continuous experiment combined with mass analysis and genetic
identification aiming to address the question whether and how salinity becomes one of
the key factor in the niche differentiation between “Ca. Brocadia” and “Ca. Scalindua”.
Results obtained suggest that trehalose associated different response to osmostress in
"Ca. B. sinica" and "Ca. S. japonica" might be one of the reason shaping the distinct
niche in between. In the final chapter findings of previously conducted studies were
compiled and recommendations for future prospective were highlighted.

iv
Wo
rd T
emp
late
by
Fri
edm
an &
Mo
rgan
20
14
ACKNOWLEDGEMENTS
You can’t go anywhere in graduate school without good advice and help, and
my experience has certainly been a reflection of the kind support of my supervisor: Prof.
Dr. Satoshi OKABE. Without his guidance and passion for science, I wouldn’t have
been able to earn a PhD. I am thankful that he agreed to take me on as his grad student,
and am grateful for his patience in working help me and continually challenged me to
become a better person and a better researcher. I also am thankful for my committee
members. They have provided me nothing but positive support and guidance, and have
helped me to think critically about the world around me.
I am also grateful for my mentors, colleagues and research co-operators, Prof.
Sano, Prof. Satoh and Prof. Ishii, Prof. Kitajima, Prof. Oshiki, Dr. Ali, Dr. Song, Mr.
Mizuto, Ms. Narita, Ms. Kobayashi and Ms. Gao, Ms. Amrini, Ms. Ushiyama, Mr.
Kamigaito and all lab mates in water quality control engineering laboratory for their
valuable discussions and contributions to this work.
I am really obligated to Ministry of Education, Sports, Science and Technology,
Govt. of japan for providing me the honour scholarship to support my life here. I would
also like to acknowledge administration of Graduate School of Engineering and officers
in e3 program, Hokkaido University for their kind helps and supports. I would also like
to acknowledge Hokkaido Electric Power Co.,Inc. for providing me accommodation.
Finally, I would like to dedicate this thesis to my parents (Zhang jiaye, Jiang
mingying) for their numerous supports.
Thank you to Kayla Friedman and Malcolm Morgan of the Centre for
Sustainable Development, University of Cambridge, UK for producing the Microsoft
Word thesis template used to produce this document.

v
Wo
rd T
emp
late
by
Fri
edm
an &
Mo
rgan
20
14
CONTENTS
1 INTRODUCTION ...................................................................................................... 16
2 LITERATURE REVIEW .......................................................................................... 22
2.1 ABSTRACT .............................................................................................................. 23
2.2 INTRODUCTION ................................................................................................. 23
2.3 ENRICHMENT OF ANAMMOX CELLS ........................................................... 26
Rapid cultivation as planktonic cells ............................................................. 27
2.4 MICROBIAL GROWTH KINETICS OF ANAMMOX BACTERIA .................. 28
Maximum species growth rate (μmax) ............................................................. 28
Affinity constant to limiting substrate (nitrite) ............................................... 29
2.5 INTERSPECFIC COMPETITION AMONG ANAMMOX BACTERIA ............ 33
2.6 CONCLUSION ..................................................................................................... 36
2.7 REFERENCE ........................................................................................................ 37
3 RAPID CULTIVATION OF FREE-LIVING ANAMMOX CELLS .................... 62
3.1 ABSTRACT .......................................................................................................... 63
3.2 INTRODUCTION ................................................................................................. 63
3.3 MATERIALS AND METHODS........................................................................... 65
Gel immobilization ......................................................................................... 65
Operation of up-flow column reactor packed with PVA-SA gel beads .......... 65
Operation of MBR .......................................................................................... 65
Microbial analysis .......................................................................................... 66
Particle size distribution ................................................................................ 67
Scanning electron microscope of immobilized gel beads and naturally
aggregated granules ............................................................................................... 67
Chemical analyses .......................................................................................... 68
3.4 RESULTS .............................................................................................................. 68
Overall experiment procedure ....................................................................... 68
Growth pattern of “Ca. B. sinca” cells in gel beads ..................................... 71
3.5 DISCUSSION ....................................................................................................... 74
3.6 CONCLUSION ..................................................................................................... 76
3.7 REFERENCE ........................................................................................................ 76
4 MAXIMUM SPECIFIC GROWTH RATE OF ANAMMOX BACTERIA
REVISITED ................................................................................................................... 79

vi
Wo
rd T
emp
late
by
Fri
edm
an &
Mo
rgan
20
14
4.1 ABSTRACT .......................................................................................................... 80
4.2 INTRODUCTION ................................................................................................. 80
4.3 MATERIALS AND METHODS .......................................................................... 82
Development of qPCR assays ........................................................................ 82
Determination of maximum specific growth rate in MBR ............................. 83
Determination of maximum specific growth rate in immobilized gel beads .. 84
qPCR analysis ................................................................................................ 85
EPS production of “Ca. B. sinica” ................................................................ 85
EPS characterization using Fourier transform spectroscopy (FTIR) ........... 86
4.4 RESULTS .............................................................................................................. 86
Development of qPCR assay .......................................................................... 86
Anammox bacterial growth in MBR .............................................................. 86
Anammox bacterial growth in immobilized gel beads ................................... 87
Production of EPS .......................................................................................... 87
4.5 DISCUSSION ....................................................................................................... 88
4.6 CONCLUSIONS ................................................................................................... 91
4.7 REFERENCE ........................................................................................................ 99
5 MICROBIAL COMPETITION AMONG ANAMMOX BACTERIA IN
NITRITE-LIMITED BIOREACTORS .................................................................... 104
5.1 ABSTRACT ........................................................................................................ 105
5.2 INTRODUCTION ............................................................................................... 105
5.3 MATERIALS AND METHODS ........................................................................ 107
Monod growth curve .................................................................................... 107
Anammox enrichment cultures ..................................................................... 108
Long-term competition experiments ............................................................ 108
Chemical analysis ........................................................................................ 109
DNA extraction and quantitative PCR ......................................................... 109
Fluorescence in situ hydridization ............................................................... 110
5.4 RESULTS ............................................................................................................ 111
Monod growth curves................................................................................... 111
Competition in gel-immobilized column reactors ........................................ 111
Competition in MBRs ................................................................................... 112
Competition in granular reactor .................................................................. 112
FISH analysis ............................................................................................... 113
5.5 DISCUSSION ..................................................................................................... 113

vii
Wo
rd T
emp
late
by
Fri
edm
an &
Mo
rgan
20
14
5.6 CONCLUSIONS ................................................................................................. 118
5.7 REFERENCE ...................................................................................................... 126
6 TREHALOSE ASSOCIATED OSMOSTRESS RESPONSE IN “CA.
BROCADIA SINICA” AND “CA. SCALINDUA JAPONICA” ............................ 132
6.1 ABSTRACT ............................................................................................................ 133
6.2 INTRODUCTION ............................................................................................... 134
6.3 MATERIALS AND MEHODS ........................................................................... 135
Anammox bacteria ....................................................................................... 135
Specific anammox activity (SAA) tests ......................................................... 136
Adaptation and competition in MBR ............................................................ 137
Chemical analysis ........................................................................................ 137
DNA extraction and quantitative PCR ......................................................... 138
Fluorescence in situ hybridization ............................................................... 139
Genomic acquisition and phylogenetic analysis .......................................... 139
Quantification of Na+, K+ and trehalose measurements. ............................ 140
6.4 RESULTS ............................................................................................................ 141
Adaptation of “Ca. B. sinica” and “Ca. S. japonica” culture .................... 141
Competition between “Ca. B. sinica” and “Ca. S. japonica” ..................... 141
Osmoadaptive capabilities inferred from genomes. .................................... 142
Specific anammox activity, trehalose biosynthesis and Na+, K+ uptake. ..... 143
Phylogenetic analysis of trehalose 6 phosphatase/trehalose 6 phosphate
synthase system ..................................................................................................... 144
6.5 DISCUSSION: .................................................................................................... 145
6.6 CONCLUSION ................................................................................................... 148
6.7 REFERENCES .................................................................................................... 149
7 INTEGRATION AND PERSPECTIVES .............................................................. 164
7.1 INTEGRATION ....................................................................................................... 164
Enrichment ................................................................................................... 164
Maximum specific growth rate ..................................................................... 165
Niche differentiation .................................................................................... 165
Engineering implication. .............................................................................. 167
7.2 PERSPECTIVES ...................................................................................................... 167
7.3 CURRICULUM VITAE AND LIST OF PUBLICATIONS: ............................................... 168

viii
Wo
rd T
emp
late
by
Fri
edm
an &
Mo
rgan
20
14
LIST OF TABLES
TABLE 2.1 REACTOR TYPES USED FOR ENRICHING ANAMMOX BIOMASS. .......................... 57
TABLE 2.2 SPECIES SPECIFIC ENRICHING CONDITIONS. ..................................................... 59
TABLE 4.1 SPECIFIC PRIMERS AND PROBES DESIGNED IN THIS STUDY. .............................. 97
TABLE 4.2 SUMMARY OF THE MAXIMUM SPECIFIC GROWTH RATES OBTAINED IN THIS
STUDY AND REPORTED VALUES. ............................................................................... 98
TABLE 5.1 PHYSIOLOGICAL CHARACTERISTICS OF “CA. JETTENIA CAENI”, “CA. BROCADIA
SINICA” AND “CA. KUENENIA STUTTGARTIENSIS”. ................................................ 125
TABLE 6.1 BLAST HIT OF GENES RELATED TO ORGANIC COMPATIBLE SOLUTES
REGULATION IN THE GENOMES OF “CA. B. SINICA” AND “CA. S. JAPONICA”. ......... 156
TABLE 6.2 GENOMIC EVIDENCE FOR ION TRANSPORTATION AND TREHALOSE
BIOSYNTHESIS IN ANAMMOX BACTERIA FROM SEQUENCED GENOMES. ................... 157

ix
Wo
rd T
emp
late
by
Fri
edm
an &
Mo
rgan
20
14
LIST OF FIGURES
FIGURE 2.1 RESEARCH IN THE BIOLOGICAL CONVERSIONS OF NITROGEN INCLUDING
ANAMMOX FROM 1900 TO 2016. (A) ARTICLES THAT RELATED TO MAIN BIOLOGICAL
PROCESS INCLUDING NITRIFICATION, DENITRIFICATION AND ANAMMOX AS THE KEY
WORDS. (B), (C) AND (D) ARTICLES RELATED TO ANAMMOX AND ITS SUBDISCIPLINE.
ARTICLES WITH KEYWORDS “DENITRIFICATION”, “NITRIFICATION”, “ANAMMOX”,
“ANAMMOX AND APPLICATION”, “ANAMMOX AND PHYSIOLOGY”, AND “ANAMMOX
AND ECOLOGY” INDEXED BY WEB OF SCIENCE WERE TAKEN INTO ACCOUNT. ......... 52
FIGURE 2.2 ENRICHMENT OF ANAMMOX BACTERIA AS FREE-LIVING CELLS IN MEMBRANE
BIOREACTOR. (A) THE ANAMMOX MEMBRANE BIOREACTOR CULTIVATING “CA.
BROCADIA SINICA”. (B) FLUORESCENCE IN SITU HYBRIDIZATION MICROGRAPH
DEPICTING HIGHLY ENRICHED “CA. BROCADIA SINICA” IN YELLOW (COMBINATION
OF AMX820 PROBES COUNTERSTAINED WITH EUB 338 MIX PROBES FOR MOST
BACTERIA); SCALE BAR = 20 ΜM. ............................................................................. 53
FIGURE 2.3 MAXIMUM SPECIFIC GROWTH RATES OF ANAMMOX BACTERIA, NOB AND
AOB. FOR ANAMMOX BACTERIA, DIFFERENT GENUS WAS INDICATED IN RED (“CA.
KUENENIA”), GREEN (“CA. BROCADIA”), BLUE (“CA. SCALINDUA”) AND BROWN
(“CA. JETTENIA”). *: AOB THAT WAS NOT IDENTIFIED AS SPECIES. ......................... 54
FIGURE 2.4 HIGH AFFINITY AMMONIUM AND NITRITE OXIDATION BY ANAMMOX BACTERIA
COMPARED WITH AOB OR NOB. (A) KS VALUE FOR NITRITE FROM ANAMMOX
BACTERIA (DIAMOND) AND NITRITE OXIDIZING BACTERIA (NOB) (CIRCLE). (B) KS
VALUE FOR AMMONIUM/AMMONIA FROM ANAMMOX BACTERIA (DIAMOND) AND
AMMONIUM/AMMONIA OXIDIZING BACTERIA (AOB) (CIRCLE). FOR ANAMMOX
BACTERIA, DIFFERENT GENUS WAS INDICATED IN RED (“CA. KUENENIA”), GREEN
(“CA. BROCADIA”), BLUE (“CA. SCALINDUA”) AND BROWN (“CA. JETTENIA”). *:
INFORMATION NOT AVAILABLE AT THE TIME OF WRITING. ....................................... 55
FIGURE 3.1: CHANGE IN THE FORM OF BIOMASS. (A) AN ORIGINAL UP-FLOW GRANULAR
COLUMN REACTOR: GRANULES WERE COLLECTED FROM THIS REACTOR AND
DISPERSED. (B) DISPERSED GRANULES: ONLY THE UPPER PART (SUSPENDED BIOMASS,
INDICATED USING ARROW) WAS USED FOR PVA-SA GEL IMMOBILIZATION. (C) A
GEL-IMMOBILIZED COLUMN REACTOR: ANAMMOX BIOMASS WAS IMMOBILIZED IN
PVA-SA GEL BEADS AND CULTIVATED IN A COLUMN REACTOR FOR 18 DAYS. (D)

x
Wo
rd T
emp
late
by
Fri
edm
an &
Mo
rgan
20
14
GEL BEADS AFTER DISPERSION: THE CULTIVATED MATURE GEL BEADS WERE
COLLECTED FROM THE COLUMN REACTOR. (E) START-UP OF MBR: AFTER PHYSICAL
DISPERSION OF MATURED GEL BEADS, THE DEBRIS OF GEL MATRIX WAS REMOVED BY
PASSING THROUGH A SIEVE OF 710 ΜM OPENING (SANPO, TOKYO). THE SIEVED
BIOMASS SUSPENSION WAS INOCULATED TO MBR. .................................................. 70
FIGURE 3.2: SIZE DISTRIBUTION OF BIOMASS PARTICLES INDICATED AS FREQUENCY ([%],
NUMBER OF PARTICLES OF TOTAL NUMBER OF PARTICLES MEASURED). THE BARS
SHOWED THE PARTICLE DISTRIBUTION OF DISPERSED GRANULES (PURPLE), DAY 0
(ORANGE) AND DAY 17 IN MBR (BLUE). (FOR COLORED FIGURE, THE READER IS
REFERRED TO THE WEB VERSION OF THIS ARTICLE) .................................................. 71
FIGURE 3.3: PERFORMANCE OF THE MBR AFTER INOCULATION AND PLANKTONIC FREE-
LIVING BIOMASS AFTER 17 DAYS OF CULTIVATION. IN SITU HYBRIDIZATION WAS
PERFORMED WITH TETRAMETHYLRHODAMINE-5-ISOTHIOCYANATE (TRITC)
LABELED AMX820 PROBE (RED) FOR “CA. B. SINICA” AND FLUORESCEINE
ISOTHIOCYANATE (FITC) LABELED EUB PROBES (GREEN) FOR MOST OF THE
BACTERIA. BAR INDICATES 20 ΜM. .......................................................................... 72
FIGURE 3.4: GROWTH PATTERN OF ANAMMOX BACTERIA IN PVA-SA GEL BEADS AND
GRANULES. “CA. B. SINICA” (YELLOW) GREW AS MICRO COLONIES INSIDE THE GEL
BEADS AND COMPARED WITH NATURALLY AGGREGATED GRANULES (PANEL A).
LOCAL CELL DENSITY OF MICRO COLONIES INCREASED WITH TIME IN GEL BEADS AND
COMPARED WITH GRANULES (PANEL B AND C). PANEL B IS A CLOSE-UP VIEW OF
PANEL A. PANEL C IS THE QUANTITATIVE RESULT OF LOCAL CELL DENSITY. WHITE
BARS INDICATE 50 ΜM (PANEL A) AND 10 ΜM (PANEL B), RESPECTIVELY. ND: NOT
DETERMINED DUE TO A LOW FLUORESCENCE INTENSITY. *: P<0.01 (STUDENT T TEST).
16S RRNA GENE COPY NUMBERS OF “CA. B. SINICA” IMMOBILIZED IN GEL BEADS AT
EACH TIME POINT WERE ALSO MEASURED. (FOR COLORED FIGURE, THE READER IS
REFERRED TO THE WEB VERSION OF THIS ARTICLE) .................................................. 73
FIGURE 3.5: SEM IMAGES OF ANAMMOX CELLS GROWN IN PVA-SA GEL BEADS AT DAY
0&15 AND A NATURALLY AGGREGATED GRANULE. (A) OVERVIEW OF THE SURFACE
PART OF GEL BEAD AT DAY 15 (BAR 1 MM). (B) A CLOSE-UP VIEW OF THE CELL
CLUSTER ON DAY 15 GEL BEAD (BAR 20 ΜM). (C) ENLARGED ANAMMOX CELL AT
DAY 15 (BAR 4 ΜM). (D) SECTION VIEW OF THE NATURALLY AGGREGATED GRANULE

xi
Wo
rd T
emp
late
by
Fri
edm
an &
Mo
rgan
20
14
(BAR 0.6 MM). (E) A CLOSE-UP VIEW OF THE CELL CLUSTER IN GRANULE (BAR 16
ΜM). (F) ENLARGED ANAMMOX CELL CLUSTER IN GRANULE (BAR 3 ΜM). ............... 74
FIGURE 4.1 CONFOCAL MICROSCOPIC IMAGES OF FISH ANALYSIS FOR ENRICHED FREE-
LIVING PLANKTONIC CELLS OF (A) “CA. BROCADIA SINICA”, (B) “CA. JETTENIA
CAENI” AND (C) “CA. SCALINDUA SP.” IN MBRS. CELLS WERE HYBRIDIZED WITH
COMBINATION OF FITC-LABELED AMX820 PROBE (GREEN) AND TRITC-LABELED
EUB MIX PROBE (RED) FOR “CA. BROCADIA SINICA” (A), TRITC-LABELED EUB338
MIX PROBE (RED) AND FITC-LABELLED PROBE JEC152 (GREEN) FOR “CA. JETTENIA
CAENI” (B), AND FITC-LABELED EUB338 MIX PROBE (GREEN) AND TRITC-
LABELLED PROBE SCA1129B FOR “CA. SCALINDUA SP.” (C). ANAMMOX BACTERIA
WERE SHOWN IN YELLOW FOR ALL PANELS. WHITE BARS INDICATE 20 ΜM. ............ 91
FIGURE 4.2 STANDARD CURVES OF THE QPCR ASSAYS DEVELOPED IN THIS STUDY FOR
“CA. B. SINICA”, “CA. J. CAENI” AND “CA. SCALINDUA SP.”, RESPECTIVELY. THE
STANDARD CURVES WERE PREPARED USING SERIAL 10-FOLD DILUTIONS (FROM 107
TO 103 OR 101
COPY NUMBERS ΜL-1) OF THE PLASMID DNA CARRYING THE PARTIAL
16S RRNA GENE OF “CA. B. SINICA”, “CA. J. CAENI” AND “CA. SCALINDUA SP.”,
RESPECTIVELY. GOODNESS-OF-FIT (R2) VALUE, THE SLOPE OF THE STANDARD CURVE,
AND AMPLIFICATION EFFICIENCY (E) ARE ALSO SHOWN. ERROR BARS INDICATE THE
STANDARD DEVIATION OF THE TRIPLICATES. ............................................................ 93
FIGURE 4.3 THE REACTOR PERFORMANCE, NITRITE CONCENTRATION IN BULK PHASE AND
GROWTH DYNAMICS OF “CA. B. SINICA” (A1 AND A2), “CA. J. CAENI” (B1 AND B2)
AND “CA. SCALINDUA SP.” (C1 AND C2) IN A MBR, RESPECTIVELY. MAXIMUM
SPECIFIC GROWTH RATE (ΜMAX) WAS DETERMINED FROM THE EXPONENTIAL INCREASE
IN 16S RRNA GENE COPY NUMBERS (GRAY PLOTS). TD : DOUBLING TIME, TD = LN 2 / Μ.
................................................................................................................................. 94
FIGURE 4.4 THE REACTOR PERFORMANCE, EFFLUENT NITRITE CONCENTRATION AND
GROWTH DYNAMICS OF “CA. B. SINICA” (A1 AND A2) AND “CA. J. CAENI” (B1 AND
B2) IMMOBILIZED IN GEL BEADS, RESPECTIVELY. MAXIMUM SPECIFIC GROWTH RATE
(ΜMAX) WAS DETERMINED FROM THE EXPONENTIAL INCREASE IN 16S RRNA GENE
COPY NUMBERS (GRAY PLOTS). TD : DOUBLING TIME, TD = LN 2/Μ. ........................... 95
FIGURE 4.5 EPS PRODUCTION AT DIFFERENT GROWTH PHASES. REACTOR PERFORMANCE
AND NITRITE CONCENTRATION IN BULK PHASE IN MBR (A). TEMPORAL CHANGE
IN16S RRNA GENE COPY NUMBERS OF “CA. B. SINICA” (B). TIME COURSE CHANGES

xii
Wo
rd T
emp
late
by
Fri
edm
an &
Mo
rgan
20
14
IN EXTRACELLULAR PROTEIN AND POLYSACCHARIDE CONTENT PER BIOMASS DRY
WEIGHT DURING CELL GROWTH (C). PRINCIPAL COMPONENT ANALYSIS (PCA) ON
THE SPECTRUM OF FOURIER TRANSFORM INFRARED SPECTROSCOPY (FTIR) FOR EPS
SAMPLES TAKEN FROM DIFFERENT GROWTH PHASES (D). ......................................... 96
FIGURE 5.1 THE MONOD GROWTH CURVES OF “CA. B. SINICA”, “CA. J. CAENI” AND “CA.
K. STUTTGARTIENSIS”. THE SPECIFIC GROWTH RATE (Μ) WAS SIMULATED AS A
FUNCTION OF A LIMITING SUBSTRATE (NITRITE) CONCENTRATION BY USING THE
MONOD EQUATION. IT SHOULD BE NOTED THAT SINCE THE KS VALUES WERE
ASSOCIATED WITH RELATIVELY HIGH STANDARD DEVIATIONS, THE MONOD GROWTH
CURVES WERE CALCULATED USING THE UPPER AND LOWER LIMIT OF KS VALUES FOR
“CA. B. SINICA”, “CA. J. CAENI” AND “CA. K. STUTTGARTIENSIS”. ....................... 119
FIGURE 5.2 POPULATION DYNAMICS OF “CA. B. SINICA”, “CA. J. CAENI” AND “CA. K.
STUTTGARTIENSIS” IN GEL-IMMOBILIZED COLUMN REACTOR (GICR) AT 37°C. A1-
A3: NITROGEN (NH4+ AND NO2
-) LOADING RATE (NLR) AND REMOVAL RATE (NRR)
AND NITRITE CONCENTRATION AT THE BOTTOM OF THE COLUMN REACTORS. B1- B3:
POPULATION DYNAMICS OF “CA. B. SINICA”, “CA. J. CAENI” AND “CA. K.
STUTTGARTIENSIS” IN GICRS. C1- C3: RELATIVE ABUNDANCE OF “CA. B. SINICA”,
“CA. J. CAENI” AND “CA. K. STUTTGARTIENSIS”, WHICH WERE CALCULATED BASED
ON THE 16S RRNA GENE COPY NUMBERS. ............................................................. 120
FIGURE 5.3 POPULATION DYNAMICS OF “CA. B. SINICA”, “CA. J. CAENI” AND “CA. K.
STUTTGARTIENSIS” IN MBRS AT 37°C. A1- A4: NITROGEN (NH4+AND NO2
-)
LOADING RATE (NLR) AND REMOVAL RATE (NRR) AND NITRITE CONCENTRATION IN
THE BULK PHASE. B1 – B4: POPULATION DYNAMICS OF “CA. B. SINICA”, “CA. J.
CAENI” AND “CA. K. STUTTGARTIENSIS” IN MBRS. C1 – C4: RELATIVE ABUNDANCE
OF “CA. B. SINICA”, “CA. J. CAENI” AND “CA. K. STUTTGARTIENSIS”, WHICH WERE
CALCULATED BASED ON THE 16S RRNA GENE COPY NUMBERS. ............................ 122
FIGURE 5.4 POPULATION DYNAMICS OF “CA. B. SINICA”, “CA. J. CAENI” AND “CA.
KUENENIA STUTTGARTIENSIS” IN SELF-AGGREGATED GRANULES IN AN UP-FLOW
COLUMN REACTOR AT 37°C. A: NITROGEN (NH4+AND NO2
-) LOADING RATE (NLR)
AND REMOVAL RATE (NRR) AND NITRITE CONCENTRATION AT THE BOTTOM OF THE
COLUMN REACTOR. B: POPULATION DYNAMICS OF “CA. B. SINICA”, “CA. J. CAENI”
AND “CA. K. STUTTGARTIENSIS” IN THE COLUMN REACTOR. C: RELATIVE
ABUNDANCE OF “CA. B. SINICA”, “CA. J. CAENI” AND “CA. K. STUTTGARTIENSIS” IN

xiii
Wo
rd T
emp
late
by
Fri
edm
an &
Mo
rgan
20
14
GRANULES, WHICH WERE CALCULATED BASED ON THE 16S RRNA GENE COPY
NUMBERS. .............................................................................................................. 123
FIGURE 5.5 FLUORESCENCE IN SITU HYBRIDIZATION (FISH) IMAGES OF THE CROSS
SECTIONS OF GEL BEADS AND SELF-AGGREGATED GRANULES. THE GEL BEADS WERE
TAKEN FROM G1 REACTOR ON DAY 69, AND THE GRANULES WERE TAKEN ON DAY 0
AND 90, RESPECTIVELY. IN SITU HYBRIDIZATION WAS PERFORMED WITH
TETRAMETHYLRHODAMINE-5-ISOTHIOCYANATE (TRITC) LABELED BRS211 PROBE
(RED) FOR “CA. B. SINICA” AND FLUORESCEINE ISOTHIOCYANATE (FITC) LABELED
JEC152 PROBE (GREEN) FOR “CA. J. CAENI” FOR ALL SAMPLES. A1 – A3: GEL BEADS
AT DAY 69, B1 – B3: SELF-AGGREGATED GRANULES AT DAY 0, AND C1 – C3: SELF-
AGGREGATED GRANULES AT DAY 90. “CA. K. STUTTGARTIENSIS” COULD NOT BE
DETECTED IN ALL EXPERIMENTS DUE TO LOW ABUNDANCE. “SURFACE” MEANS THE
SURFACE OF GEL BEADS AND GRANULES. SCALE BARS INDICATE 20 ΜM (A), 50 ΜM
(B), AND 50 ΜM (C, EXCEPT FOR C1, 200 ΜM). (FOR COLOR FIGURES, THE READER IS
REFERRED TO THE WEB VERSION OF THIS ARTICLE). ............................................... 124
FIGURE 6.1 ADAPTATION OF “CA. B. SINICA” AND “CA. S. JAPONICA” TO 1% SALINITY.
A1&B1: NITROGEN LOADING, REMOVAL RATES AND SALINITY. A2&B2: TEMPORAL
DYNAMIC OF INFLUENT AMMONIUM, NITRITE AND EFFLUENT AMMONIUM, NITRITE
AND NITRATE CONCENTRATION. A3&B3: CONFOCAL MICROSCOPIC IMAGES OF FISH
ANALYSIS FOR ADAPTED FREE-LIVING PLANKTONIC CELLS OF “CA. B. SINICA” (A3)
AND “CA. S. JAPONICA” (B3) IN MBRS. CELLS WERE HYBRIDIZED WITH
COMBINATION OF TRITC-LABELED AMX820 PROBE (RED) AND FITC-LABELED
EUB MIX PROBE (GREEN) FOR “CA. B. SINICA” AND FITC-LABELED EUB338 MIX
PROBE (GREEN) AND TRITC-LABELLED PROBE SCA1129B (RED) FOR “CA. S.
JAPONICA”. ANAMMOX BACTERIA WERE SHOWN IN YELLOW FOR BOTH PANELS.
WHITE BARS INDICATE 20 AND 10 ΜM. .................................................................. 158
FIGURE 6.2 REACTOR PERFORMANCE AND POPULATION DYNAMICS OF “CA. B. SINICA”
AND “CA. S. JAPONICA” AFTER MIXED AS EQUAL 16S RRNA GENE COPY NUMBERS IN
MBR AT 1% SALINITY UNDER ROOM TEMPERATURE. A: NITROGEN (NH4+AND NO2
-)
LOADING RATE AND REMOVAL RATE AND SALINITY IN THE MBR. B: TEMPORAL
DYNAMIC OF INFLUENT AMMONIUM, NITRITE AND EFFLUENT AMMONIUM, NITRITE
AND NITRATE CONCENTRATION. C: ABSOLUTE POPULATION DYNAMICS AND
RELATIVE ABUNDANCE (DASH LINE) OF “CA. B. SINICA” AND “CA. S. JAPONICA” IN
THE MBR. .............................................................................................................. 159

xiv
Wo
rd T
emp
late
by
Fri
edm
an &
Mo
rgan
20
14
FIGURE 6.3 SPECIFIC ANAMMOX ACTIVITY (SAA), INTRACELLULAR TREHALOSE AND NA+,
K+ CONCENTRATION OF “CA. B. SINICA” AT DEFINED SALINITY. A: SAA OF “CA. B.
SINICA” INDICATED BY NITROGEN GAS PRODUCTION RATES. B: INTRACELLULAR
TREHALOSE CONCENTRATION. C: INTRACELLULAR NA+ AND K+
CONCENTRATION.
BATCH TESTS WERE PERFORMED AS DUPLICATE. ................................................... 160
FIGURE 6.4 SPECIFIC ANAMMOX ACTIVITY (SAA), INTRACELLULAR TREHALOSE AND NA+,
K+ CONCENTRATION OF “CA. S. JAPONICA” AT DEFINED SALINITY. A: SAA OF “CA. S.
JAPONICA” INDICATED BY NITROGEN GAS PRODUCTION RATES. B: INTRACELLULAR
TREHALOSE CONCENTRATION. C: INTRACELLULAR NA+ AND K+
CONCENTRATION.
BATCH TESTS WERE PERFORMED AS DUPLICATE. ................................................... 161
FIGURE 6.5 MAXIMUM LIKELIHOOD PHYLOGENETIC TREE INFERRED FROM TREHALOSE-6-
PHOSPHATE SYNTHASE/ TREHALOSE-6-PHOSPHATASE PROTEIN SEQUENCE
ALIGNMENTS FOR MEMBERS OF ANAMMOX BACTERIA AS WELL AS OTHER BACTERIAL
AND ARCHAEAL SPECIES. THE TREE WAS ROOTED USING TREHALOSE-6-PHOSPHATASE
(A)/TREHALOSE-6-PHOSPHATE SYNTHASE (B) PROTEIN SEQUENCE OF “CA. B.
SINICA”. THE SCALE BAR REPRESENTS THE NUMBER OF NUCLEOTIDE CHANGES PER
SEQUENCE POSITION. PIE CHARTS AT THE NODES REPRESENT THE CONFIDENCE OF THE
BRANCH TOPOLOGY RESULTS, AND BOOTSTRAP VALUES GREATER THAN 50% ARE
FILLED IN BLACK (THE NEIGHBORJOINING METHOD, NJ, FOR THE UPPER-LEFT SECTOR,
THE MAXIMUM-LIKELIHOOD METHOD, ML, FOR THE UPPER-RIGHT SECTOR, OR THE
MAXIMUM-PARSIMONY METHOD, MP, FOR THE BOTTOM SECTOR). 200, 1000, 200
RESAMPLINGS FOR ML, NJ AND MP METHOD, RESPECTIVELY. .............................. 162

xv
Wo
rd T
emp
late
by
Fri
edm
an &
Mo
rgan
20
14

enrichment, growth kinetics and ecophysiology of anammox bacteria
16
1 INTRODUCTION
The anaerobic ammonium oxidation (anammox) process has been recognized
as one of the main biological nitrogen processes, where ammonium and nitrite react and
convert into dinitrogen gas directly under anaerobic condition (without oxygen) (Strous
et al., 1999a). The discovery of anammox process revolutionized our classic
understanding of global nitrogen cycle, in addition, the traditional model system of
wastewater treatment process regarding biological nitrogen removal was also
challenged (Ali and Okabe, 2015; Francis et al., 2007). During the first decades after
anammox process was discovered, lot of studies were carried out on application of this
novel process into nitrogen removal, more specifically, side-stream wastewater
including excess sludge digestion supernatant that contains high concentration of
ammonium (Kartal et al., 2010; van der Star et al., 2007). However, studies working on
the biochemistry and physiology of anammox process and bacteria were still very
limited, even after 30 years of discovery and in spite of the advancing of molecular
technology. Therefore, our understanding regarding ecophysiology on this particular
microorganism is extremely lacking at this moment. The reasons should be the so far
unavailability of pure culture for anammox bacteria (Strous et al., 1999b) and the
difficulty in the enrichment of anammox culture. Here anammox culture refers to highly
enriched planktonic cell culture (van der Star et al., 2008). When anammox bacteria was
found in the very beginning, its doubling time (specific growth rate) has been
characterized as long as more than two weeks. Although later on more and more studies
point out the intrinsic growth rate of anammox bacteria should be much faster and may

Chapter 1: Introduction
17
close to a doubling time of two days, still, at that time, to enrich an anammox culture is
far from an easy job. It is already quite difficult to enrich the culture, not to mention to
study the characterises, which is why physiology-related study are such limited (Zhang
et al., 2017b). While for bio-chemical study of anammox bacteria, some methods like
cell separating (Percoll separation) has enabled the separation of anammox cells from
other bacterial cells, even reach a purity more than 99% (Kartal et al., 2011). However,
the yield of this method is relatively low and therefore, require large amount of
anammox biomass. In addition, the separated cells can be used for further extraction of
DNA, RNA and protein, all biochemistry-related materials, but could not be used for
long term cultivation because along with the operation it inevitably introduces other
microbial members into the system. Therefore, some biochemical studies have been
carried out, with the situation of physiological study largely in blank.
There is no need to question the importance and necessity in the pursuit of
anammox bacteria physiology and one more step, their ecology in order to understand
their contribution to global nitrogen cycle (Oshiki et al., 2015; Zhang et al., 2017a). As
definition, bacterial physiology is a scientific discipline that concerns the life-supporting
functions and processes of bacteria, which allow bacteria cells to grow and reproduce.
Simply, the information of bacterial physiology is used to interpret, predict the life style
of specific bacteria, the optimum condition that this microorganism demonstrates its
maximum specific growth rate. While this is closely related to the ecological status of
the microorganism in nature, which is determined from its physiological requirements.
In this thesis, the main objective is to study the ecophysiology of anammox
bacteria. This objective was approached through the following chapters, briefly
explained as below.
Outline of Thesis
Chapter 1:
This chapter states the overview of current dissertation and broader
research questions that were addressed during doctoral endeavour. In addition,
the details of each research objectives were outlined in this chapter.

enrichment, growth kinetics and ecophysiology of anammox bacteria
18
Chapter 2:
This chapter presents a critical review of previous studies focusing on
physiology and niche differentiation of anammox bacteria. It was revealed
during literature review that number of publications regarding the physiology
and ecology of anammox bacteria so far was considerably fewer compared with
the application part of anammox process. There are many issues remained to be
addressed before more studies can be carried out on the study of physiology and
ecology of anammox bacteria. The literature review aims to present a
comprehensive summary of researches on how to enrich appropriate culture of
anammox bacteria, determination of key kinetics for anammox bacteria and their
niche differentiation. Besides, a detailed summary of the specific niche where so
far identified anammox species were enriched was established.
Chapter 3:
It was revealed in literature review that it is still not possible to achieve
pure culture of anammox bacteria. This became the biggest hurdle for
physiological study of anammox bacteria requiring high purity planktonic
culture. Such culture has once been obtained using membrane bioreactor before,
but took considerably amount of time and efforts. This chapter focuses on the
development of a novel method for rapid cultivation of free-living anammox
cells using immobilization technique. It was demonstrated that active free-living
planktonic anammox cells with purity > 95% was successfully developed in the
MBR with overall only 35 days operation time.
Chapter 4:
It was acknowledged that the specific niche of certain microorganism is
mostly determined from their kinetics including maximum specific growth rate.
Inaccurate information of their kinetics may misinterpret their behaviour in
complex eco-systems. In the case of anammox bacteria, whose maximum
specific growth rate is always in debate. In this study, a reliable re-evaluation
procedure for maximum specific growth rates of three anammox species was
developed and showing that anammox bacteria may not appropriate to be
considered as slow-growing bacteria any more.
Chapter 1: Introduction
19
Chapter 5:
Previously the issue of niche differentiation of anammox bacteria has
been addressed by analysing the database of so far published 16S rRNA gene
sequences, illustrating their niche partitioning and global distribution. However,
information regarding their actual dynamic behaviour could not be obtained.
Enriched culture-dependent competition is the most direct way to illustrate their
niche differentiation regarding certain factors. In this study, the microbial
competitions for a common substrate (nitrite) among three anammox species (i.e.
“Candidatus Brocadia sinica”, “Candidatus Jettenia caeni” and “Candidatus
Kuenenia stuttgartiensis”) were systematically investigated in nitrite-limited gel-
immobilized column reactors (GICR) and membrane bioreactors (MBRs) under
different nitrogen loading rates (NLRs). 16S rRNA gene-based population
dynamics revealed that “Ca. J. caeni” could proliferate only at low NLRs,
whereas “Ca. B. sinica” outcompeted other two species at higher NLRs in both
types of reactors, demonstrating NLR was one of factors determining ecological
niche differentiation of “Ca. B. sinica” and “Ca. J. caeni”.
Chapter 6:
A statistical study looking at over 6000 anammox 16S rRNA gene
sequences from the public database, indicated that salinity was the most
important factor governing anammox bacterial distributions, with “Ca.
Scalindua” dominated in saline environments while “Ca. Brocadia” were mostly
found in freshwater environments. Though it is strongly suggested,
physiological verification of salinity as a niche factor for anammox bacteria has
never been conducted. Detailed understanding of the extent of the effect of
salinity on adaptation, genetic basis and ecological significance are all
completely lacking at this moment. In this chapter, we conducted both batch and
continuous experiment combined with mass analysis and genetic identification
aiming to address the question whether and how salinity becomes one of the key
factor in the niche differentiation between “Ca. Brocadia” and “Ca. Scalindua”.
Results obtained suggest that the osmoadaptive strategy employed by “Ca. B.
sinica” limited its competition with “Ca. S. japonica”, shaped the distinct niche
in between.

enrichment, growth kinetics and ecophysiology of anammox bacteria
20
Chapter 7:
In this chapter findings of previously conducted studies were compiled and
recommendations for future prospective were highlighted.
Reference
Ali, M., Okabe, S., 2015. Anammox-based technologies for nitrogen removal:
Advances in process start-up and remaining issues. Chemosphere 141, 144–153.
doi:10.1016/j.chemosphere.2015.06.094
Francis, C.A., Beman, J.M., Kuypers, M.M.M., 2007. New processes and players in the
nitrogen cycle: the microbial ecology of anaerobic and archaeal ammonia oxidation.
ISME J. 1, 19–27. doi:10.1038/ismej.2007.8
Kartal, B., Kuenen, J.G., van Loosdrecht, M.C.M., 2010. Engineering. Sewage
treatment with anammox. Science 328, 702–3. doi:10.1126/science.1185941
Kartal, B., Maalcke, W.J., de Almeida, N.M., Cirpus, I., Gloerich, J., Geerts, W., Op
den Camp, H.J.M., Harhangi, H.R., Janssen-Megens, E.M., Francoijs, K.-J.,
Stunnenberg, H.G., Keltjens, J.T., Jetten, M.S.M., Strous, M., 2011. Molecular
mechanism of anaerobic ammonium oxidation. Nature 479, 127–30.
doi:10.1038/nature10453
Oshiki, M., Satoh, H., Okabe, S., 2015. Ecology and Physiology of Anaerobic
Ammonium Oxidizing (anammox) Bacteria. Environ. Microbiol. n/a-n/a.
doi:10.1111/1462-2920.13134
Strous, M., Fuerst, J., Kramer, E., Logemann, S., Muyzer, G., Van de Pas-Schoonen, K.,
Webb, R., Kuenen, J., Jetten, M., 1999a. Missing Lithotroph Identified as New
Planctomycete. Nature 400, 446–449.
Strous, M., Kuenen, J.G., Jetten, M.S., 1999b. Key physiology of anaerobic ammonium
oxidation. Appl. Environ. Microbiol. 65, 3248–50.
van der Star, W.R.L., Abma, W.R., Blommers, D., Mulder, J.-W., Tokutomi, T., Strous,
M., Picioreanu, C., van Loosdrecht, M.C.M., 2007. Startup of reactors for anoxic
ammonium oxidation: experiences from the first full-scale anammox reactor in
Rotterdam. Water Res. 41, 4149–63. doi:10.1016/j.watres.2007.03.044

Chapter 1: Introduction
21
van der Star, W.R.L., Miclea, A.I., van Dongen, U.G.J.M., Muyzer, G., Picioreanu, C.,
van Loosdrecht, M.C.M., 2008. The membrane bioreactor: a novel tool to grow
anammox bacteria as free cells. Biotechnol. Bioeng. 101, 286–294.
doi:10.1002/bit.21891
Zhang, L., Narita, Y., Gao, L., Ali, M., Oshiki, M., Ishii, S., Okabe, S., 2017a.
Microbial competition among anammox bacteria in nitrite-limited bioreactors. Water
Res. doi:https://doi.org/10.1016/j.watres.2017.08.052
Zhang, L., Narita, Y., Gao, L., Ali, M., Oshiki, M., Okabe, S., 2017b. Maximum
specific growth rate of anammox bacteria revisited. Water Res. 116, 296–303.
doi:10.1016/j.watres.2017.03.027

enrichment, growth kinetics and ecophysiology of anammox bacteria
22
2 LITERATURE REVIEW
This chapter has been summarized for submission as:
Zhang, L, Narita, Y and Okabe, S. Enrichment, growth kinetics and niche
differentiation of anammox bacteria.

Chapter 2: Literature review
23
2.1 Abstract
Anaerobic ammonium oxidizing (anammox) bacteria have the unique
metabolic ability to convert ammonium and nitrite to dinitrogen gas. This discovery led
to the knowledge that activity of these bacteria were responsible for a substantial part
(50 – 100%) of the enormous nitrogen losses observed in the freshwater and marine
environments. However, ecophysiology and niche differentiation of anammox bacteria
are still the enigma that remains due to the time-consuming enrichment methods,
insufficient/inaccurate knowledge of growth kinetics and various environmental factors
involved that yet to be identified. In this review, we summarized state of the art
information on culture enrichment and growth kinetics that are essential for deciphering
the ecophysiology of anammox bacteria. In addition, details of the enriching conditions
for several anammox species were summarized and potential factors for niche
partitioning were discussed.
2.2 INTRODUCTION
The discovery of missing autotroph, anaerobic ammonium oxidizing
(anammox) bacteria, has radically revolutionized our stereotypical view of biological
nitrification and denitrification and stimulated the hunt of “impossible” microbes (Mike
S M et al., 1999; Strous et al., 1999a). Anammox bacteria, belongs to the order of
Planctomycetales (Strous et al. 1999a), has been known to catalyze the oxidation of
ammonium by nitrite as the electron acceptor under anaerobic condition (van de Graaf
et al., 1996). So far five candidatus genera (Brocadia, Kuenenia, Jettenia, Scalindua
and Anammoxoglobus) and 19 species have been reported (Ali and Okabe, 2015; Kartal
et al., 2007a; Oshiki et al., 2016; Z. X. Quan et al., 2008; Schmid et al., 2003; Strous et
al., 1999a, 1998) with anammox activities being detected from various natural and man-

enrichment, growth kinetics and ecophysiology of anammox bacteria
24
made ecosystems (Hu et al., 2011; Humbert et al., 2012; Jetten et al., 2003; Marcel M
M Kuypers et al., 2003; Oshiki et al., 2016; Sonthiphand et al., 2014).
Anammox bacteria received considerable attention in industrial application owing to its
great economical potential from their distinct metabolism and physiology (Ali and
Okabe, 2015; Kartal et al., 2010), but were assumed to be minor players in the N cycle
within natural ecosystems before. In 2002, anammox process was found to be
responsible for 24 - 67% of N loss in marine sediments (Thamdrup and Dalsgaard,
2002), and 20 - 40% of N loss has been proposed to be attributed to anammox in the
suboxic water columns of the Black Sea and Gulfo Dulce (Dalsgaard et al., 2003;
Marcel M. M. Kuypers et al., 2003). Recent studies indicate an even greater percentage
(up to 100%) of marine N loss may come from anammox process (Hamersley et al.,
2007; Kuypers et al., 2005; Schmid et al., 2007; Trimmer et al., 2013). Combined with
universal detection of anammox activity in various ecosystems, ubiquitous of this
process was revealed (Francis et al., 2007; Hu et al., 2011). Thus, knowledge of
ecological biogeography, more specifically, ecological niche differentiation
(Vandermeer, 1972) of anammox bacteria, is essential for understanding the
contribution of anammox process to global nitrogen cycle. However, although number
of publications related to anammox is increasing exponentially (Fig. 1A), research focus
in recent years has been placed on the application and process optimization of anammox
for industrial and municipal wastewaters (Fig. 1B). While the investigations for its
ecology and physiology, the main disciplines illustrating the natural importance of
anammox bacteria, were extremely limited (Fig. 1C and 1D).
Physiological characteristics are essential for understanding and interpreting the
ecological niche of anammox bacteria (Oshiki et al., 2015, 2011). The main reason that
physiological study of anammox bacteria was quite limited is the lack of appropriate
culture with free living cells and a high purity (> 90%) (van der Star et al., 2008). So far
anammox bacteria have been enriched as aggregates like granules and biofilm due to its
low specific growth rate (Strous et al., 1998; Tsushima et al., 2007b). However, the
good retention capacity of aggregates would to some extent slower the selection rate
between anammox species or even, in some case, made it possible for two species to co-
exist in one eco-system due to the substrate diffusion limitation (Ali et al., 2015c;
Zhang et al., 2017a). This disturbs interpretation on niche partitioning in between.
Unavailability of planktonic cell cultures, information of kinetic parameters could
neither be determined accurately (Lotti et al., 2014).

Chapter 2: Literature review
25
Here, in view of recent knowledge, status regarding the enrichment of anammox culture,
the growth kinetics of anammox bacteria and niche differentiation between certain
anammox species were summarized. Firstly, the methods so far used for enriching
anammox bacteria were described with some new progresses in achieving completely
suspended planktonic anammox cells. Then, the growth kinetics including the μmax and
Ks obtained so far for various anammox species were summarized and discussed. Lastly,
a discussion on niche differentiation between anammox species was conducted based on
the competition among anammox species and physical environmental parameters used
for enrichment.

enrichment, growth kinetics and ecophysiology of anammox bacteria
26
2.3 ENRICHMENT OF ANAMMOX CELLS
Despite that anammox bacteria are key players in the global nitrogen cycle, no
pure cultures is still available (Strous et al., 1999b). However, anammox bacteria can be
selectively enriched by supplying specific substrate under anoxic condition (i.e.
ammonium and nitrite) (van de Graaf et al., 1996). Due to the relatively slow growth
rate as a doubling time more than 2 days (Zhang et al., 2017b), biomass retention is the
key factor for a successful enrichment of anammox bacteria (Strous et al., 1998).
Different reactor configurations have been tested so far to achieve a robust but yet
reproducible enrichment strategy including sequencing batch reactor (Strous et al.,
1998), up flow column reactor (Tsushima et al., 2007a), immobilized upflow column
reactor (Isaka et al., 2007) and up flow reactor packed with nonwoven porous polyester
materials (Fujii et al., 2002), etc. (Table 1). Those configurations enable the formation
of biomass aggregates by supplying a selection pressure as settling down and wash out,
attachment to supporting materials and immobilization using artificial materials.
Although large amount of anammox biomass could be enriched in those systems, they
are not in ideal form for fundamental investigation on anammox bacteria (i.e. eco-
physiological and biochemical characteristics). Firstly, satisfactory purity (>90%) could
not be achieved in aggregated biomass due to the complex microbial community
induced by substrate diffusion limitation and aggregation (Lawson et al., 2017;
Tsushima et al., 2007b), making it difficult to draw definite conclusion regarding the
physiological phenomenon. Secondly, heterogeneous distribution of specific anammox
activity in the aggregates. Lastly, the extracellular polymeric substance (EPS) as the
supporting material in aggregates, was found to trigger analyzing difficulties in protein
purification process (Cirpus et al., 2006; Ni et al., 2010).
To overcome above issues, growth of anammox bacteria as completely planktonic cells
is essential. As the pioneer and breakthrough, in 2007, MBR was introduced to cultivate
an anammox bacterium, “Ca. K. stuttgartiensis”, in the form of planktonic cells and
unprecedented high purity (97.6%) from which precise measurement of physiological
characteristics became possible (Table 1) (van der Star et al., 2008). Later,
phylogenetically-different anammox species have been also cultivated in the form of the
planktonic cells in MBRs; i.e., “Ca. Jettenia” (Ali et al., 2015a), “Ca. Brocadia” (Lotti
et al., 2014; Narita et al., 2017; Mamoru Oshiki et al., 2013) and “Ca. Scalindua”

Chapter 2: Literature review
27
(Awata et al., 2013a; Oshiki et al., 2011) and more and more physiological and
biochemical information was revealed (Oshiki et al., 2015).
Rapid cultivation as planktonic cells
However, this MBR cultivation still takes an enormous amount of time to
achieve free-living cells; usually more than 100 – 200 days (Ali et al., 2015a; Lotti et al.,
2014; Mamoru Oshiki et al., 2013; van der Star et al., 2008). This time-consuming
cultivation process is apparently a bottle neck of physiological, biochemical and kinetic
studies of anammox bacteria. A recent study was able to provide a new procedure where
completely suspended planktonic cell culture could be achieved within 35 days (Zhang
and Okabe, 2017). It was found that anammox bacteria cells grown in the gel beads did
not form rigid aggregates and were easily dispersible. This suggests that the biomass
grown in the gel beads could be used as an inoculum of MBR to obtain free-living
planktonic cells. The combination of gel immobilization technique as pre-culture and
MBR cultivation was proved as effective for rapid cultivation of planktonic cell cultures
(Fig. 2). It is believed that with much easier access to anammox planktonic cell culture,
more and more physiological studies will be carried out.

enrichment, growth kinetics and ecophysiology of anammox bacteria
28
2.4 MICROBIAL GROWTH KINETICS OF ANAMMOX
BACTERIA
Microbial growth kinetics, i.e., the relationship between the specific growth
rate (μ) of a microbial population and the limiting substrate concentration (s) (also
known as the Monod kinetics), is an indispensable tool in all fields of microbiology, be
it physiology, genetics, ecology, or biotechnology (Kovarova-Kovar and Egli, 1998). It
has been extensively used to predict, systematically evaluate and interpret the
competitions among the microorganisms of interest for their niche partitioning
(Bollmann et al., 2002; French et al., 2012; Füchslin et al., 2012; Kindaichi et al., 2006;
Martens-Habbena et al., 2009; Ngugi et al., 2016; Nogueira and Melo, 2006; Nowka et
al., 2015; Zhang et al., 2017a). Despite their importance, μmax and Ks of anammox
bacteria are still debatable issues due to experimental difficulties with a lack of
planktonic enrichment cell cultures with high purity (Strous et al., 1999b; van der Star
et al., 2008).
Maximum species growth rate (μmax)
The μmax of anammox bacteria was so far mainly determined by either controlling the
sludge retention time (SRT) or measuring the biomass yield and maximum specific
substrate consumption rate (Lotti et al., 2015; Oshiki et al., 2011). A recent study
reevaluated the maximum specific growth rates (μmax) of three phylogenetically distant
anammox bacterial species (i.e. “Ca. B. sinica”, “Ca. J. caeni” and “Ca. S. japonica”)
by directly measuring the time course increase of 16S rRNA gene copy numbers as
planktonic cells or immobilized biomass using newly developed quantitative
polymerase chain reaction (qPCR) assays (Zhang et al., 2017b). The μmax of “Ca. B.
sinica”, “Ca. J. caeni” and “Ca. S. japonica” were determined to be 0.33 ± 0.02 d-1, 0.18
d-1 and 0.17 d-1. These values were the fastest reported for these species so far. Before
anammox bacteria has been recognized as slow growing bacteria and anaerobic
ammonium oxidation itself was considered as simply a kinetically difficult metabolic
strategy (Strous et al., 1998). Now it is considered that much lower μmax obtained before

Chapter 2: Literature review
29
may result from the beyond-optimum condition for enrichment. By introducing more
appropriate culture and measuring methods, it could be expected that more μmax
approaching the intrinsic ones of anammox bacteria will be revealed in the future.
Part of the μmax values obtained from anammox bacteria, NOB and AOB were
summarized in Fig. 3 and Table S1. Most NOB possesses μmax of 0.19 – 2.08 d-1 (Bock
et al., 1990, 1983; Both et al., 1992; Ehrich et al., 1995; Laanbroek et al., 1994; Nowka
et al., 2015; Spieck and Bock, 2005), AOB with a μmax of 0.41 – 1.21 d-1 (Ahn et al.,
2008; Chandran et al., 2008; Galí et al., 2007; Hanaki et al., 1990; Jubany et al., 2009;
Kaelin et al., 2009; Katehis et al., 2002; Park and Noguera, 2007; Vadivelu et al., 2006),
which are higher than anammox bacteria (μmax of 0.05 – 0.33 d-1) (Kartal et al., 2008,
2007b; Lotti et al., 2015; Narita et al., 2017; Puyol et al., 2013; Strous et al., 1998; van
de Vossenberg et al., 2008a; van der Star et al., 2008; Zhang et al., 2017b). However, as
discussed before, current information of μmax from certain anammox species were
considered as insufficient. While the re-evaluated μmax from three anammox species
(“Ca. B. sinica”, “Ca. J. caeni” and “Ca. S. japonica”) demonstrated a μmax ranging from
0.17 to 0.33 d-1, close to the lowest value of NOB and AOB. Since most values of AOB
and NOB were obtained from pure culture, it is suggested that μmax of anammox bacteria
may closer to the ones of other autotrophic bacteria involved in natural nitrogen cycle
than previously assumed.
Affinity constant to limiting substrate (nitrite)
Nitrite is the limiting substrate for anammox bacteria (Lotti et al., 2014; Strous
et al., 1998). The affinity constant (Ks, also known as half-saturation constant) is a key
parameter in microbial ecology as well as the biological process in engineering field. So
far a wide range (0.2 – 370 μM) of values have been reported for the Ks of different
anammox species (Fig. 4) (Ali et al., 2015a; Awata et al., 2013b; Carvajal-Arroyo et al.,
2013; Kartal et al., 2008, 2007a; Lotti et al., 2014; Narita et al., 2017; Mamoru Oshiki et
al., 2013; Oshiki et al., 2017; Strous et al., 1999b; van der Star et al., 2008). Either
continuous cultures (Mamoru Oshiki et al., 2013; van der Star et al., 2008) or batch
experiments (Ali et al., 2015a; Strous et al., 1999b) has been employed for Ks
identification. It is not surprising to see this high variability by considering the species-

enrichment, growth kinetics and ecophysiology of anammox bacteria
30
specific difference, various cultivation methods, purity of the biomass and its
aggregation status (Lotti et al., 2014). Among those values, the five that obtained from
planktonic cell cultures (“Ca. K. stuttgartiensis”, “Ca. B. sinica”, “Ca. B. sp. 40”, “Ca.
S. japonica” and “Ca. B. sapporoensis”) (Awata et al., 2013a; Lotti et al., 2014; Narita
et al., 2017; Mamoru Oshiki et al., 2013; van der Star et al., 2008) are of highly
importance since they represent the most accurate measurement. Based on available Ks,
one could easily predict the result of interspecific competition if substrate is the only
factor involved. For instance, “Ca. B. sinica” might be the r-strategist while “Ca. K.
stuttgartiensis” be the K-strategist due to its higher affinity but lower μmax (Oshiki et al.,
2015).
We also summarized some reported Ks values for nitrite from nitrite oxidizing bacteria
(NOB) and Ks for ammonium/ammonia from ammonium oxidizing bacteria (AOB)
(Fig. 4) (Button, 1985; Jiang and Bakken, 1999; Keen and Prosser, 1987; Nowka et al.,
2015; Suwa et al., 1994; Suzuki et al., 1974; Ward, 1987). Ks values from NOB and
AOB were mostly obtained from pure culture. The estimated Ks for NOB vary
considerably, ranging from 9 to 544 μM, but higher than the ones from certain
anammox species (“Ca. K. stuttgartiensis”, “Ca. B. anammoxidians”, “Ca. B. sp. 40”,
“Ca. S. japonica” and “Ca. B. sapporoensis”). Similarly, Ks of AOB ranged between 6
to 4000 μM, higher than the ones of “Ca. B. anammoxidians” and “Ca. S. japonica”. It
should be noted that some Ks from anammox bacteria were measured using aggregates,
much lower intrinsic Ks value is expected and thus it might turn out that more anammox
species possess higher affinity with substrate than AOB and NOB.
Ks is not only important for ecological niche differentiation as interspecific competition,
it is also a valuable reference for the competition of anammox bacteria with other
microorganisms sharing same nutrients in natural and man-made ecosystems. In one
stage partial nitrification/denitrification systems, NOB compete with anammox bacteria
for nitrite that converted by AOB from ammonium (Lackner et al., 2014; Winkler et al.,
2012). Overgrow of NOB may outcompete the anammox bacteria and produce residual
nitrate, which is not desirable for nitrogen removal. Considering the Ks value of
anammox bacteria, strict population controlling strategy may not be necessary if
appropriate anammox species was selected (Higher affinity with substrate, e.g. “Ca. K.
stuttgartiensis” and “Ca. S. japonica”). Competition between AOB and anammox
bacteria is less since in granules or biofilm, AOB was always proliferate at the outside
of the layer while anammox bacteria resident at inner part depending on dissolved

Chapter 2: Literature review
31
oxygen concentration. Based on the lower Ks value for ammonium, anammox bacteria
could efficiently scavenge the remaining ammonium from AOB to create an ideal
ecosystem for complete nitrogen removal (Sliekers et al., 2002). Oxygen is another
important parameter between the competition of anammox bacteria and AOB or NOB.
Interestingly, one recent study investigated the oxygen sensitivity of anammox and
coupled N-cycle process in oxygen minimum zones (OMZ) found that activity of
anammox reaction was only moderately affected by changing oxygen concentration,
further, aerobic ammonia oxidation was active at an oxygen concentration of non-
detectable level (Kalvelage et al., 2011). These intriguing findings may suggest a fiercer
and more frequent competition between anammox bacteria and AOB, NOB. In addition,
if we only consider the Ks and μmax, the whole group of anammox bacteria could be
simply interpreted as k-strategist while the AOB and NOB groups are more likely to be
the r-strategist since they possess higher μmax but lower affinity (higher Ks value). This
property, to some extent, secured the advantageous position of anammox bacteria in
frequently occurred famine conditions in natural environment (Roszak and Colwell,
1987). This is also supported by the universal detection of anammox activity in open
ocean and estuary areas where the ammonium concentrations are less than 0.03 – 1 μM
(Beman et al., 2008; Herfort et al., 2007; Könneke et al., 2005; Wuchter et al., 2006)
and 22 – 45 μM to 115 μM when receiving agricultural run-off (Beman and Francis,
2006; Santoro et al., 2008), respectively, with an even lower concentrations of nitrite (~
0.5 μM) (Beman et al., 2013).
Ks of anammox bacteria was also lower than the ones reported for denitrifiers (4 – 25
μM) (Almeida et al., 1995; Betlach and Tiedje, 1981). A higher affinity for nitrite would
be advantageous for anammox bacteria to compete with denitrifiers. In fact, coexistence
of nitrifying, anammox and denitrifying bacteria in a sequencing batch reactor has been
successfully demonstrated with a high diversity (Langone et al., 2014), while the
success of anammox bacteria in maintaining its population might be attributed to its
high affinity to substrate. However, anammox bacteria was found to be susceptible for
several kinds of organic compounds and may suffer an inhibition (e.g. 91% activity
inhibition by 1 mM ethanol, 86% activity inhibition by 1 mM methanol and 36%
activity inihibiyion by 1 mM formate from “Ca. B. sinica”) (Jensen et al., 2007; Jin et
al., 2012; Oshiki et al., 2011). Overgrow of denitrifiers over anammox bacteria under
co-supplementary of organic compounds occurred under C/N ratio of 2.92 (Tang et al.,
2010). Therefore, a simultaneous partial nitrification, Anammox and denitrification

enrichment, growth kinetics and ecophysiology of anammox bacteria
32
system (e.g. SNAD) (Chen et al., 2009) that combines autotrophic nitrogen removal by
anammox bacteria and heterotrophic nitrogen removal by denitrifiers needs careful
process control and optimization (Takekawa et al., 2014).

Chapter 2: Literature review
33
2.5 INTERSPECFIC COMPETITION AMONG ANAMMOX
BACTERIA
Competition is an excellent tool to decipher the niche partitioning between
organisms of interest (Bollmann et al., 2002; Chakraborty et al., 2016; Füchslin et al.,
2012; Koeppel and Wu, 2014; Nowka et al., 2015; Vanniel et al., 1993; Winkler et al.,
2017). In fact, population shifts between different anammox genera or species have
been frequently reported in bioreactors: e.g., from “Ca. B. fulgida” to “Ca. B. sp. 40”
(Park et al., 2010a); from “Ca. B. fulgida” to “Ca. K. stuttgartiensis” (Park et al., 2015);
from “Ca. B. sp.” to “Ca. K. stuttgartiensis” (van der Star et al., 2008); and from “Ca. B.
anammoxidians” to “Ca. A. propionicus” (Kartal et al., 2007a). Population shift is,
however, not a systematic competition. The phenomenon observed could not be well
interpreted due to various factors involved that may complexify the results. First,
insufficiency of culture preparation. Inoculums of mixed cultures were directly
subjected to certain conditions where a population shift was observed later. It remains
unclear whether the result of population shift was due to the external factor or natural
selection. Second, inappropriate form of biomass employed (aggregates). Third,
inaccuracy/insufficient information regarding the kinetics of anammox bacteria so far.
Physical environmental factors have been found to have profound influence on
niche partitioning of microorganisms. A recent review on niche differentiation among
ammonia oxidizing archaea (AOA) and AOB has emphasized the importance of
substrate concentration, cell structure, source of ammonia, pH, difference in its own
activity, temperatures, zonation with water depth, oxygen deprivation and other factors
that yet to be concluded (sulfide, phosphate, salinity, soil moisture, etc.) (Hatzenpichler,
2012). Another review covered the anammox bacteria and discussed some
environmental parameters that have been suggested to be essential for its geographical
distribution including nitrite concertation, salt concentration, temperature, sulfide and
co-occurrence of organic compounds (e.g. formate, acetate, propionate, etc.) (Oshiki et
al., 2015).
A recent study introduced a systematic competition using free-living
planktonic cells of three anammox species demonstrated that nitrogen loading rate
(NLR) could be one of the factors involved in niche differentiation between two

enrichment, growth kinetics and ecophysiology of anammox bacteria
34
freshwater anammox species (i.e. “Ca. B. sinica” and “Ca. J. caeni”) (Zhang et al.,
2017a). Such information could be used to explain the difference in the abundance of
each anammox species in different ecosystems (Sonthiphand et al., 2014). In fact,
species “Ca. B. sinica” has been frequently detected in bioreactors operated at
extremely high NLRs (26.0 – 76.7 kg-N m-3 day-3) (Tang et al., 2011; Tsushima et al.,
2007b) while “Ca. J. caeni” was enriched at much lower NLRs (0.3 – 0.6 kg-N m-3 day-
3) (Ali et al., 2015a).
Although several anammox species have been enriched so far (i.e. “Ca. B.
anammoxidans”, “Ca. B. fulgida”, “Ca. B. sinica”, “Ca. B. sapporoensis”, “Ca. K.
stuttgartiensis”, “Ca. A. propionicus”, “Ca. S. brodae”, “Ca. S. profundal”, “Ca. S.
japonica”, “Ca. Scalindua sp.”, “Ca. J. caeni” and “Ca. J. asiatica”) (Ali et al., 2015a;
Egli et al., 2001; Fujii et al., 2002; Kartal et al., 2008, 2007b; Kindaichi et al., 2011;
Lotti et al., 2014; Nakajima et al., 2008; Narita et al., 2017; Z.-X. Quan et al., 2008a;
Tsushima et al., 2007b; van de Graaf et al., 1996; van de Vossenberg et al., 2008b), it is
still far from possible to predict what anammox species could be enriched by
manipulating physical environmental conditions (i.e. temperature, pH, salinity, etc.).
Here we summarized the detailed enriching conditions for each species (Table 3).
Enriched levels in aggregated granules or biofilms were mostly limited to less than 90%,
except for marine anammox species (“Ca. S. brodae” and “Ca. S. profundal”) since the
saline condition has a higher selectivity. A recent study elucidated a metabolic network
between anammox bacteria and Chlorobi-affiliated bacteria on protein degradation,
extracellular peptides catabolization and nitrate recycling into nitrite in naturally
aggregated granules (Lawson et al., 2017), while it remains unclear if such syntrophic
relationship is essential for certain anammox species as growing criteria. For instance,
Syntrophothermus lipocalidus and Aminobacterium colombiense has been successfully
pure cultured by replacing an hydrogen-consuming syntrophic partner using an
hydrogen-purging culture vessel (Adams et al., 2006). It is highly probable that some
microorganisms could not be absent in order to secure the growth of certain anammox
species. Secondly, most freshwater anammox species were enriched at temperature
range from 27 °C to 37 °C while for marine anammox species, the temperature was
15 °C to 25 °C. This is a clear difference between freshwater and marine species, which
should be correlated with the sea environment with mostly lower temperature compared
with laboratory bioreactors. However, among the freshwater anammx species,
temperature dependent specific anammox acitivity was not quite different with

Chapter 2: Literature review
35
maximum activity around 37 °C (Ali et al., 2015a; Oshiki et al., 2011). pH has been
found to regulate the AOB and AOA abundance, diversity and activity in paddy soils
(Li et al., 2015). However, it can be seen that all anammox species were enriched at pH
of 6.8 – 8.5, therefore, may not be a key factor in niche differentiation. So far, anammox
bacteria has been enriched from various source of biomass, including denitrifying
sludge, activated sludge, nitrifying biomass, marine sediments or river sediments (Egli
et al., 2001; Fujii et al., 2002; Kartal et al., 2008, 2007b; Kindaichi et al., 2011;
Nakajima et al., 2008; Z.-X. Quan et al., 2008a; Tsushima et al., 2007b; van de Graaf et
al., 1996; van de Vossenberg et al., 2008b). Recent studies have investigated the impact
of inoculum and growth mode on microbial ecology of anammox bioreactor community,
where they observed compared with inoculum and reactor configuration, composition of
the feed and extant substrate concentration might play a more important role (Park et al.,
2010a, 2010b). Similar phenomenon was also observed when enriching “Ca. B. fulgida”
and “Ca. A. propionicus”, where the authors used same inoculum but supplied different
medium (containing 1 – 30 mM acetate and 0.8 – 15 mM propionate, respectively)
(Kartal et al., 2008, 2007b). Therefore, source of inoculum may not be the determining
factor. Thus, another parameter that should be considered is the medium composition
including the water used for preparing the medium. Although most anammox studies
used the medium composition same with the first enriching culture (Table 3) (van de
Graaf et al., 1996), the amount (concentration) used was not always same, especially
metal concentrations including iron (5.0, 6.3, 6.8 or 9.0 mg L-1, respectively) (Ali et al.,
2015b; Hsu et al., 2014; Strous et al., 1998; van de Graaf et al., 1996) and copper (0.25
mg L-1 or no addition) (Ali et al., 2015b; van de Graaf et al., 1996). Anammox bacteria
is able to carry out nitrate dependent ferrous iron oxidation (M Oshiki et al., 2013) and
additionally, ferrous iron has been found to have positive effect on anammox activity
and specific growth rates (Liu and Ni, 2015; Qiao et al., 2013). Iron is deeply involved
in anammox metabolism and vast majority of cellular iron in the form of cofactors
within Fe-S proteins and multi-heme cytochromes participated in the oxidation of
ammonium to dinitrogen gas (Ferousi et al., 2017; Kartal and Keltjens, 2016). A recent
work analyzed the intracellular metal composition in “Ca. J. caeni”, where they
observed a slightly higher percentage of Fe compared with “Ca. B. sinica” (41% and
39%, respectively) (Ali et al., 2015a). On the other hand, copper was found to be
another dominant metal component in anammox bacteria (39% and 42% from “Ca. J.
caeni” and “Ca. B. sinica”, respectively) and was involved in enzymes in reductive
acetyl-CoA pathway for carbon fixation (Ali et al., 2015a; Kartal et al., 2011). It

enrichment, growth kinetics and ecophysiology of anammox bacteria
36
remains unclear if there is a species-specific response to metal addition and whether this
may become the selection factor. It is interesting that some anammox bacteria were
enriched using ground water instead of demineralized water (Ali et al., 2015a; Kindaichi
et al., 2011; Tsushima et al., 2007b). Indeed 16S rRNA genes of certain anammox
species have been detected at groundwater environment (Sonthiphand et al., 2014).
Composition of groundwater varies from regions and weather conditions, but mostly
contains metal elements and nitrogen compounds due to biological contamination and
rock dissolution, including ammonium, nitrite, nitrate, sulfate, chloride, potassium,
sodium, calcium, magnesium, phosphate and bicarbonate (Dragon and Marciniak, 2010).
These compounds are missing in the demineralized water. It requires and deserve
further investigation on the difference between demineralized water and groundwater in
the enrichment of anammox bacteria.
2.6 CONCLUSION
The wide distribution of anammox bacteria in the environment is currently well
established. Their contribution to fixed nitrogen loss over denitrification is striking in
many ecosystems. Eco-physiological niche has been indicated from universal detection
at various environmental conditions. However, most studies were conducted using
methods that target the abundance and/or expression of the molecular biomarkers. It is
difficult to draw direct conclusion on the niche partitioning of anammox bacteria only
by abundance and expression of genes due to their prolonged persistence. Culture-
dependent competition study is still essential as a complementary tool to decipher their
niche enigma. In this overview, we summarized the updated information of enrichment
methods, growth kinetics of anammox bacteria that are essential for competition study
and discussed some potential factors in niche differentiation. It is clear that we are in the
very beginning stage in revealing the niche partitioning of anammox bacteria. The
questions of why anammox bacteria has a species specific natural distribution and how
they successfully compete with AOB, NOB or denitrifiers remain unclear. Nevertheless,
it was suggested that anammox bacteria may possess much higher affinity with
substrate and advantageously survive with AOB, NOB or denitrifiers. Interspecific
differences in μmax and Ks may trigger their niche partitioning in terms of nutrients
Chapter 2: Literature review
37
availability. In addition, types of water and medium composition, especially metal
concentrations are potential factors for niche partitioning. Definitely more highly
enriched free living anammox cell cultures from various species are in great demand to
explore the ecophysiology of this unique microorganism.
2.7 REFERENCE
Adams, C.J., Redmond, M.C., Valentine, D.L., 2006. Pure-Culture Growth of
Fermentative Bacteria, Facilitated by H2 Removal: Bioenergetics and H2 Production.
Appl. Environ. Microbiol. 72, 1079–1085. doi:10.1128/AEM.72.2.1079-1085.2006
Ahn, J.H., Yu, R., Chandran, K., 2008. Distinctive microbial ecology and biokinetics of
autotrophic ammonia and nitrite oxidation in a partial nitrification bioreactor.
Biotechnol. Bioeng. 100, 1078–1087. doi:10.1002/bit.21863
Ali, M., Okabe, S., 2015. Anammox-based technologies for nitrogen removal:
Advances in process start-up and remaining issues. Chemosphere 141, 144–153.
doi:10.1016/j.chemosphere.2015.06.094
Ali, M., Oshiki, M., Awata, T., Isobe, K., Kimura, Z., Yoshikawa, H., Hira, D.,
Kindaichi, T., Satoh, H., Fujii, T., Okabe, S., 2015a. Physiological characterization of
anaerobic ammonium oxidizing bacterium “ C andidatus Jettenia caeni.” Environ.
Microbiol. 17, 2172–2189. doi:10.1111/1462-2920.12674
Ali, M., Oshiki, M., Awata, T., Isobe, K., Kimura, Z., Yoshikawa, H., Hira, D.,
Kindaichi, T., Satoh, H., Fujii, T., Okabe, S., 2015b. Physiological characterization of
anaerobic ammonium oxidizing bacterium “Candidatus Jettenia caeni”. Environ.
Microbiol. 17, 2172–89. doi:10.1111/1462-2920.12674
Ali, M., Oshiki, M., Rathnayake, L., Ishii, S., Satoh, H., Okabe, S., 2015c. Rapid and
successful start-up of anammox process by immobilizing the minimal quantity of
biomass in PVA-SA gel beads. Water Res. 79, 147–157.
doi:10.1016/j.watres.2015.04.024
Almeida, J.S., Reis, M.A.M., Carrondo, M.J.T., 1995. Competition between nitrate and
nitrite reduction in denitrification byPseudomonas fluorescens. Biotechnol. Bioeng. 46,
476–484. doi:10.1002/bit.260460512

enrichment, growth kinetics and ecophysiology of anammox bacteria
38
Awata, T., Oshiki, M., Kindaichi, T., Ozaki, N., Ohashi, A., Okabe, S., 2013a.
Physiological characterization of an anaerobic ammonium-oxidizing bacterium
belonging to the “Candidatus scalindua” group. Appl. Environ. Microbiol. 79, 4145–
4148. doi:10.1128/AEM.00056-13
Awata, T., Oshiki, M., Kindaichi, T., Ozaki, N., Ohashi, A., Okabe, S., 2013b.
Physiological Characterization of an Anaerobic Ammonium-Oxidizing Bacterium
Belonging to the “Candidatus Scalindua” Group. Appl Env. Microb 79, 4145–4148.
doi:10.1128/aem.00056-13
Beman, J.M., Francis, C.A., 2006. Diversity of ammonia-oxidizing archaea and bacteria
in the sediments of a hypernutrified subtropical estuary: Bahía del Tóbari, Mexico. Appl.
Environ. Microbiol. 72, 7767–7777. doi:10.1128/AEM.00946-06
Beman, J.M., Leilei Shih, J., Popp, B.N., 2013. Nitrite oxidation in the upper water
column and oxygen minimum zone of the eastern tropical North Pacific Ocean. ISME J.
7, 2192–2205. doi:10.1038/ismej.2013.96
Beman, J.M., Popp, B.N., Francis, C.A., 2008. Molecular and biogeochemical evidence
for ammonia oxidation by marine Crenarchaeota in the Gulf of California. ISME J. 2,
429–441. doi:10.1038/ismej.2007.118
Betlach, M.R., Tiedje, J.M., 1981. Kinetic Explanation for Accumulation of Nitrite,
Nitric Oxide, and Nitrous Oxide during Bacterial Denitrification. Appl. Environ.
Microbiol. 42, 1074–1084. doi:Article
Bock, E., Koops, H.P., Möller, U.C., Rudert, M., 1990. A new facultatively nitrite
oxidizing bacterium, Nitrobacter vulgaris sp. nov. Arch. Microbiol. 153, 105–110.
doi:10.1007/BF00247805
Bock, E., Sundermeyer-Klinger, H., Stackebrandt, E., 1983. New facultative
lithoautotrophic nitrite-oxidizing bacteria. Arch. Microbiol. 136, 281–284.
doi:10.1007/BF00425217
Bollmann, A., Bar-Gilissen, M.-J., Laanbroek, H.J., 2002. Growth at Low Ammonium
Concentrations and Starvation Response as Potential Factors Involved in Niche
Differentiation among Ammonia-Oxidizing Bacteria. Appl. Environ. Microbiol. 68,
4751–4757. doi:10.1128/AEM.68.10.4751-4757.2002
Chapter 2: Literature review
39
Both, G.J., Gerards, S., Laanbroek, H.J., 1992. Kinetics of nitrite oxidation in two
Nitrobacter species grown in nitrite-limited chemostats. Arch. Microbiol. 157, 436–441.
doi:10.1007/BF00249101
Button, D.K., 1985. Kinetics of nutrient-limited transport and microbial growth.
Microbiol. Rev. 49, 270–297.
Carvajal-Arroyo, J.M., Sun, W., Sierra-Alvarez, R., Field, J. a, 2013. Inhibition of
anaerobic ammonium oxidizing (anammox) enrichment cultures by substrates,
metabolites and common wastewater constituents. Chemosphere 91, 22–7.
doi:10.1016/j.chemosphere.2012.11.025
Chakraborty, B., Mallick, A., Sengupta, S., Sengupta, T.K., 2016. Deciphering a
survival strategy during the interspecific competition between Bacillus cereus MSM-S1
and Pseudomonas. doi:10.1098/rsos.160438
Chandran, K., Hu, Z., Smets, B.F., 2008. A critical comparison of extant batch
respirometric and substrate depletion assays for estimation of nitrification biokinetics.
Biotechnol. Bioeng. 101, 62–72. doi:10.1002/bit.21871
Chen, H., Liu, S., Yang, F., Xue, Y., Wang, T., 2009. The development of simultaneous
partial nitrification, ANAMMOX and denitrification (SNAD) process in a single reactor
for nitrogen removal. Bioresour. Technol. 100, 1548–1554.
doi:10.1016/j.biortech.2008.09.003
Cirpus, I.E.Y., Geerts, W., Hermans, J.H.M., Op den Camp, H.J.M., Strous, M., Kuenen,
J.G., Jetten, M.S.M., 2006. Challenging protein purification from anammox bacteria. Int.
J. Biol. Macromol. 39, 88–94. doi:10.1016/j.ijbiomac.2006.02.018
Dalsgaard, T., Canfield, D.E., Petersen, J., Thamdrup, B., Acuña-González, J., Acuna-
Gonzalez, J., 2003. N-2 production by the anammox reaction in the anoxic water
column of Golfo Dulce, Costa Rica. Nature 422, 606–608. doi:10.1038/nature01526
Dapena-Mora, A., Campos, J.L., Mosquera-Corral, A., Jetten, M.S.M., Mendez, R.,
2004. Stability of the ANAMMOX process in a gas-lift reactor and a SBR. J.
Biotechnol. 110, 159–170. doi:10.1016/j.jbiotec.2004.02.005
Dragon, K., Marciniak, M., 2010. Chemical composition of groundwater and surface
water in the Arctic environment (Petuniabukta region, central Spitsbergen). J. Hydrol.
386, 160–172. doi:10.1016/j.jhydrol.2010.03.017

enrichment, growth kinetics and ecophysiology of anammox bacteria
40
Egli, K., Fanger, U., Alvarez, P.J.J., Siegrist, H., van der Meer, J.R., Zehnder, A.J.B.,
2001. Enrichment and characterization of an anammox bacterium from a rotating
biological contactor treating ammonium-rich leachate. Arch. Microbiol. 175, 198–207.
doi:10.1007/s002030100255
Ehrich, S., Behrens, D., Lebedeva, E. V, Ludwig, W., Bock, E., 1995. A New
Obligately Chemolithoautotrophic, Nitrite-Oxidizing Bacterium, Nitrospira-
Moscoviensis Sp-Nov and Its Phylogenetic Relationship. Arch. Microbiol. 164, 16–23.
doi:10.1007/s002030050230
Ferousi, C., Lindhoud, S., Baymann, F., Kartal, B., Jetten, M.S., Reimann, J., 2017. Iron
assimilation and utilization in anaerobic ammonium oxidizing bacteria. Curr. Opin.
Chem. Biol. 37, 129–136. doi:10.1016/j.cbpa.2017.03.009
Francis, C.A., Beman, J.M., Kuypers, M.M.M., 2007. New processes and players in the
nitrogen cycle: the microbial ecology of anaerobic and archaeal ammonia oxidation.
ISME J. 1, 19–27. doi:10.1038/ismej.2007.8
French, E., Kozlowski, J. a, Mukherjee, M., Bullerjahn, G., Bollmann, A., 2012.
Ecophysiological characterization of ammonia-oxidizing archaea and bacteria from
freshwater. Appl. Environ. Microbiol. 78, 5773–80. doi:10.1128/AEM.00432-12
Füchslin, H.P., Schneider, C., Egli, T., 2012. In glucose-limited continuous culture the
minimum substrate concentration for growth, Smin, is crucial in the competition
between the enterobacterium Escherichia coli and Chelatobacter heintzii, an
environmentally abundant bacterium. ISME J. 6, 777–89. doi:10.1038/ismej.2011.143
Fujii, T., Sugino, H., Rouse, J.D., Furukawa, K., 2002. Characterization of the microbial
community in an anaerobic ammonium-oxidizing biofilm cultured on a nonwoven
biomass carrier. J. Biosci. Bioeng. 94, 412–418.
Furukawa;, K., Rouse;, J.D., Yoshida;, N., Hatanaka;, H., 2004. Mass Cultivation of
Anaerobic Ammonium-Oxidizing Sludge Using a Novel Nonwoven Biomass Carrier.
Environ. Biotechnol. Sustain. Dev. 36, 1163–1169.
doi:http://doi.org/10.1252/jcej.36.1163
Galí, A., Dosta, J., van Loosdrecht, M.C.M., Mata-Alvarez, J., 2007. Two ways to
achieve an anammox influent from real reject water treatment at lab-scale: Partial SBR
nitrification and SHARON process. Process Biochem. 42, 715–720.
doi:10.1016/j.procbio.2006.12.002

Chapter 2: Literature review
41
Hamersley, M.R., Lavik, G., Woebken, D., Rattray, J.E., Lam, P., Hopmans, E.C.,
Damsté, J.S.S., Krüger, S., Graco, M., Gutiérrez, D., Kuypers, M.M.M., 2007.
Anaerobic ammonium oxidation in the Peruvian oxygen minimum zone. Limnol. Ocean.
52, 923–933. doi:10.4319/lo.2007.52.3.0923
Hanaki, K., Wantawin, C., Ohgaki, S., 1990. Nitrification at low levels of dissolved
oxygen with and without organic loading in a suspended-growth reactor. Water Res. 24,
297–302. doi:10.1016/0043-1354(90)90004-P
Hatzenpichler, R., 2012. Diversity, physiology, and niche differentiation of ammonia-
oxidizing archaea. Appl. Environ. Microbiol. 78, 7501–10. doi:10.1128/AEM.01960-12
Herfort, L., Schouten, S., Abbas, B., Veldhuis, M.J.W., Coolen, M.J.L., Wuchter, C.,
Boon, J.P., Herndl, G.J., Sinninghe Damsté, J.S., 2007. Variations in spatial and
temporal distribution of Archaea in the North Sea in relation to environmental variables.
FEMS Microbiol. Ecol. 62, 242–257. doi:10.1111/j.1574-6941.2007.00397.x
Hsu, S.C., Lai, Y.C., Hsieh, P.H., Cheng, P.J., Wong, S.S., Hung, C.H., 2014.
Successful enrichment of rarely found Candidatus Anammoxoglobus propionicus from
leachate sludge. J. Microbiol. Biotechnol. 24, 879–887. doi:10.4014/jmb.1401.01016
Hu, B., Shen, L., Xu, X., Zheng, P., 2011. Anaerobic ammonium oxidation (anammox)
in different natural ecosystems. Biochem. Soc. Trans. 39, 1811–1816.
doi:10.1042/BST20110711
Humbert, S., Zopfi, J., Tarnawski, S.E., 2012. Abundance of anammox bacteria in
different wetland soils. Env. Microbiol Rep 4, 484–490. doi:10.1111/j.1758-
2229.2012.00347.x
Isaka, K., Date, Y., Sumino, T., Tsuneda, S., 2007. Ammonium removal performance of
anaerobic ammonium-oxidizing bacteria immobilized in polyethylene glycol gel carrier:
anammox bacteria immobilized in gel carrier. Appl. Microbiol. Biotechnol. 76, 1457–65.
doi:10.1007/s00253-007-1106-6
Isaka, K., Kimura, Y., Yamamoto, T., Osaka, T., Tsuneda, S., 2013. Complete
autotrophic denitrification in a single reactor using nitritation and anammox gel carriers.
Bioresour. Technol. 147, 96–101. doi:10.1016/j.biortech.2013.07.095
Jensen, M.M., Thamdrup, B., Dalsgaard, T., 2007. Effects of specific inhibitors on
anammox and denitrification in marine sediments. Appl. Environ. Microbiol. 73, 3151–
3158. doi:10.1128/AEM.01898-06

enrichment, growth kinetics and ecophysiology of anammox bacteria
42
Jetten, M.S.M., Sliekers, O., Kuypers, M., Dalsgaard, T., van Niftrik, L., Cirpus, I., van
de Pas-Schoonen, K., Lavik, G., Thamdrup, B., Le Paslier, D., Op den Camp, H.J.M.,
Hulth, S., Nielsen, L.P., Abma, W., Third, K., Engström, P., Kuenen, J.G., Jørgensen,
B.B., Canfield, D.E., Sinninghe Damsté, J.S., Revsbech, N.P., Fuerst, J., Weissenbach,
J., Wagner, M., Schmidt, I., Schmid, M., Strous, M., 2003. Anaerobic ammonium
oxidation by marine and freshwater planctomycete-like bacteria. Appl. Microbiol.
Biotechnol. 63, 107–114. doi:10.1007/s00253-003-1422-4
Jiang, Q.Q., Bakken, L., 1999. Comparison of Nitrospira strains isolated from terrestrial
environments. FEMS Microbiol.Ecol. 30, 171–186.
Jin, R.-C., Yang, G.-F., Yu, J.-J., Zheng, P., 2012. The inhibition of the Anammox
process: A review. Chem. Eng. J. 197, 67–79. doi:10.1016/j.cej.2012.05.014
Jubany, I., Lafuente, J., Baeza, J.A., Carrera, J., 2009. Total and stable washout of
nitrite oxidizing bacteria from a nitrifying continuous activated sludge system using
automatic control based on Oxygen Uptake Rate measurements. Water Res. 43, 2761–
2772. doi:10.1016/j.watres.2009.03.022
Kaelin, D., Manser, R., Rieger, L., Eugster, J., Rottermann, K., Siegrist, H., 2009.
Extension of ASM3 for two-step nitrification and denitrification and its calibration and
validation with batch tests and pilot scale data. Water Res. 43, 1680–1692.
doi:10.1016/j.watres.2008.12.039
Kalvelage, T., Jensen, M.M., Contreras, S., Revsbech, N.P., Lam, P., Günter, M.,
LaRoche, J., Lavik, G., Kuypers, M.M.M., 2011. Oxygen sensitivity of anammox and
coupled N-cycle processes in oxygen minimum zones. PLoS One 6.
doi:10.1371/journal.pone.0029299
Kartal, B., Keltjens, J.T., 2016. Anammox Biochemistry: A Tale of Heme c Proteins.
Trends Biochem. Sci. doi:10.1016/j.tibs.2016.08.015
Kartal, B., Kuenen, J.G., van Loosdrecht, M.C.M., 2010. Engineering. Sewage
treatment with anammox. Science 328, 702–3. doi:10.1126/science.1185941
Kartal, B., Maalcke, W.J., de Almeida, N.M., Cirpus, I., Gloerich, J., Geerts, W., Op
den Camp, H.J.M., Harhangi, H.R., Janssen-Megens, E.M., Francoijs, K.-J.,
Stunnenberg, H.G., Keltjens, J.T., Jetten, M.S.M., Strous, M., 2011. Molecular
mechanism of anaerobic ammonium oxidation. Nature 479, 127–30.
doi:10.1038/nature10453

Chapter 2: Literature review
43
Kartal, B., Rattray, J., van Niftrik, L. a, van de Vossenberg, J., Schmid, M.C., Webb,
R.I., Schouten, S., Fuerst, J. a, Damsté, J.S., Jetten, M.S.M., Strous, M., 2007a.
Candidatus “Anammoxoglobus propionicus” a new propionate oxidizing species of
anaerobic ammonium oxidizing bacteria. Syst. Appl. Microbiol. 30, 39–49.
doi:10.1016/j.syapm.2006.03.004
Kartal, B., Rattray, J., van Niftrik, L. a, van de Vossenberg, J., Schmid, M.C., Webb,
R.I., Schouten, S., Fuerst, J. a, Damsté, J.S., Jetten, M.S.M., Strous, M., 2007b.
Candidatus “Anammoxoglobus propionicus” a new propionate oxidizing species of
anaerobic ammonium oxidizing bacteria. Syst. Appl. Microbiol. 30, 39–49.
doi:10.1016/j.syapm.2006.03.004
Kartal, B., van Niftrik, L., Rattray, J., van de Vossenberg, J.L.C.M., Schmid, M.C.,
Sinninghe Damsté, J., Jetten, M.S.M., Strous, M., 2008. Candidatus “Brocadia fulgida”:
an autofluorescent anaerobic ammonium oxidizing bacterium. FEMS Microbiol. Ecol.
63, 46–55. doi:10.1111/j.1574-6941.2007.00408.x
Katehis, D., Fillos, J., Carrio, L.A., 2002. Comparison of bench scale testing methods
for nitrifier growth rate measurement. Water Sci. Technol. 46, 289–95.
Keen, G.A., Prosser, J.I., 1987. Steady state and transient growth of autotrophic
nitrifying bacteria. Arch. Microbiol. 147, 73–79. doi:10.1007/BF00492908
Kindaichi, T., Awata, T., Suzuki, Y., Tanabe, K., Hatamoto, M., Ozaki, N., Ohashi, A.,
2011. Enrichment Using an Up-flow Column Reactor and Community Structure of
Marine Anammox Bacteria from Coastal Sediment. Microbes Environ. 26, 67–73.
doi:10.1264/jsme2.ME10158
Kindaichi, T., Kawano, Y., Ito, T., Satoh, H., Okabe, S., 2006. Population dynamics and
in situ kinetics of nitrifying bacteria in autotrophic nitrifying biofilms as determined by
real-time quantitative PCR. Biotechnol. Bioeng. 94, 1111–1121. doi:10.1002/bit.20926
Kindaichi, T., Tsushima, I., Ogasawara, Y., Shimokawa, M., Ozaki, N., Satoh, H.,
Okabe, S., 2007. In Situ Activity and Spatial Organization of Anaerobic Ammonium-
Oxidizing (Anammox) Bacteria in Biofilms. Appl. Environ. Microbiol. 73, 4931–4939.
doi:10.1128/AEM.00156-07
Koeppel, A.F., Wu, M., 2014. Species matter: the role of competition in the assembly of
congeneric bacteria. ISME J. 8, 531–540. doi:10.1038/ismej.2013.180

enrichment, growth kinetics and ecophysiology of anammox bacteria
44
Könneke, M., Bernhard, A.E., de la Torre, J.R., Walker, C.B., Waterbury, J.B., Stahl,
D.A., 2005. Isolation of an autotrophic ammonia-oxidizing marine archaeon. Nature
437, 543–546. doi:10.1038/nature03911
Kovarova-Kovar, K., Egli, T., 1998. Growth Kinetics of Suspended Microbial Cells:
From Single-Substrate-Controlled Growth to Mixed-Substrate Kinetics. Microbiol. Mol.
Biol. Rev. 62, 646–666.
Kuypers, M.M., Lavik, G., Woebken, D., Schmid, M., Fuchs, B.M., Amann, R.,
Jorgensen, B.B., Jetten, M.S., 2005. Massive nitrogen loss from the Benguela upwelling
system through anaerobic ammonium oxidation. Proc Natl Acad Sci U S A 102, 6478–
6483. doi:10.1073/pnas.0502088102
Kuypers, M.M.M., Sliekers, A.O., Lavik, G., Schmid, M., Jørgensen, B.B., Kuenen,
J.G., Sinninghe Damsté, J.S., Strous, M., Jetten, M.S.M., 2003. Anaerobic ammonium
oxidation by anammox bacteria in the Black Sea. Nature 422, 608–611.
doi:10.1038/nature01472
Kuypers, M.M.M., Sliekers, a O., Lavik, G., Schmid, M., Jørgensen, B.B., Kuenen,
J.G., Sinninghe Damsté, J.S., Strous, M., Jetten, M.S.M., 2003. Anaerobic ammonium
oxidation by anammox bacteria in the Black Sea. Nature 422, 608–611.
doi:10.1038/nature01472
Laanbroek, H.J., Bodelier, P.L.E., Gerards, S., 1994. Oxygen consumption kinetics of
Nitrosomonas europaea and Nitrobacter hamburgensis grown in mixed continuous
cultures at different oxygen concentrations. Arch. Microbiol. 161, 156–162.
doi:10.1007/s002030050036
Lackner, S., Gilbert, E.M., Vlaeminck, S.E., Joss, A., Horn, H., van Loosdrecht,
M.C.M., 2014. Full-scale partial nitritation/anammox experiences--an application
survey. Water Res. 55, 292–303. doi:10.1016/j.watres.2014.02.032
Langone, M., Yan, J., Haaijer, S.C.M., Op den Camp, H.J.M., Jetten, M.S.M.,
Andreottola, G., 2014. Coexistence of nitrifying, anammox and denitrifying bacteria in
a sequencing batch reactor. Front. Microbiol. 5, 28. doi:10.3389/fmicb.2014.00028
Lawson, C.E., Wu, S., Bhattacharjee, A.S., Hamilton, J.J., McMahon, K.D., Goel, R.,
Noguera, D.R., 2017. Metabolic network analysis reveals microbial community
interactions in anammox granules. Nat. Commun. 8, 15416. doi:10.1038/ncomms15416

Chapter 2: Literature review
45
Li, H., Weng, B.-S., Huang, F.-Y., Su, J.-Q., Yang, X.-R., 2015. pH regulates ammonia-
oxidizing bacteria and archaea in paddy soils in Southern China. Appl. Microbiol.
Biotechnol. 99, 6113–6123. doi:10.1007/s00253-015-6488-2
Lin, Y.M., Lotti, T., Sharma, P.K., van Loosdrecht, M.C.M., 2013. Apatite
accumulation enhances the mechanical property of anammox granules. Water Res. 47,
4556–66. doi:10.1016/j.watres.2013.04.061
Liu, Y., Ni, B.-J., 2015. Appropriate Fe (II) addition significantly enhances anaerobic
ammonium oxidation (Anammox) activity through improving the bacterial growth rate.
Sci. Rep. 5, 8204. doi:10.1038/srep08204
Lotti, T., Kleerebezem, R., Abelleira-Pereira, J.M., Abbas, B., van Loosdrecht, M.C.M.,
2015. Faster through training: The anammox case. Water Res. 81, 261–268.
doi:10.1016/j.watres.2015.06.001
Lotti, T., Kleerebezem, R., Lubello, C., van Loosdrecht, M.C.M., 2014. Physiological
and kinetic characterization of a suspended cell anammox culture. Water Res. 60, 1–14.
doi:10.1016/j.watres.2014.04.017
Magrí, A., Vanotti, M.B., Szögi, A. a, 2012. Anammox sludge immobilized in polyvinyl
alcohol (PVA) cryogel carriers. Bioresour. Technol. 114, 231–40.
doi:10.1016/j.biortech.2012.03.077
Martens-Habbena, W., Berube, P.M., Urakawa, H., de la Torre, J.R., Stahl, D. a, 2009.
Ammonia oxidation kinetics determine niche separation of nitrifying Archaea and
Bacteria. Nature 461, 976–9. doi:10.1038/nature08465
Mike S M, J., Strous, M., Pas-schoonen, K.T. Van De, Schalk, J., Dongen, U.G.J.M.
Van, Graaf, A.A. Van De, Logemann, S., Iy, G.M., Loosdrecht, M.C.M. Van, Kuenen,
J.G., 1999. The anaerobic oxidation of ammonium. FEMS Microbiol. Rev. 22, 421–437.
Nakajima, J., Sakka, M., Kimura, T., Furukawa, K., Sakka, K., 2008. Enrichment of
anammox bacteria from marine environment for the construction of a bioremediation
reactor. Appl. Microbiol. Biotechnol. 77, 1159–66. doi:10.1007/s00253-007-1247-7
Narita, Y., Zhang, L., Kimura, Z. ichiro, Ali, M., Fujii, T., Okabe, S., 2017. Enrichment
and physiological characterization of an anaerobic ammonium-oxidizing bacterium
“Candidatus Brocadia sapporoensis.” Syst. Appl. Microbiol.
doi:10.1016/j.syapm.2017.07.004
enrichment, growth kinetics and ecophysiology of anammox bacteria
46
Ngugi, D.K., Blom, J., Stepanauskas, R., Stingl, U., 2016. Diversification and niche
adaptations of Nitrospina-like bacteria in the polyextreme interfaces of Red Sea brines.
ISME J. 10, 1383–1399. doi:10.1038/ismej.2015.214
Ni, B.-J., Hu, B.-L., Fang, F., Xie, W.-M., Kartal, B., Liu, X.-W., Sheng, G.-P., Jetten,
M., Zheng, P., Yu, H.-Q., 2010. Microbial and physicochemical characteristics of
compact anaerobic ammonium-oxidizing granules in an upflow anaerobic sludge
blanket reactor. Appl. Environ. Microbiol. 76, 2652–2656. doi:10.1128/AEM.02271-09
Nogueira, R., Melo, L.F., 2006. Competition betweenNitrospira spp. andNitrobacter spp.
in nitrite-oxidizing bioreactors. Biotechnol. Bioeng. 95, 169–175. doi:10.1002/bit.21004
Nowka, B., Daims, H., Spieck, E., 2015. Comparison of oxidation kinetics of nitrite-
oxidizing bacteria: nitrite availability as a key factor in niche differentiation. Appl.
Environ. Microbiol. 81, 745–753. doi:10.1128/AEM.02734-14
Oshiki, M., Awata, T., Kindaichi, T., Satoh, H., Okabe, S., 2013. Cultivation of
Planktonic Anaerobic Ammonium Oxidation (Anammox) Bacteria Using Membrane
Bioreactor. Microbes Environ. 28, 436–443. doi:10.1264/jsme2.ME13077
Oshiki, M., Ishii, S., Yoshida, K., Fujii, N., Ishiguro, M., Satoh, H., Okabe, S., 2013.
Nitrate-dependent ferrous iron oxidation by anaerobic ammonium oxidation (anammox)
bacteria. Appl. Environ. Microbiol. 79, 4087–93. doi:10.1128/AEM.00743-13
Oshiki, M., Mizuto, K., Kimura, Z., Kindaichi, T., Satoh, H., Okabe, S., 2017. Genetic
diversity of marine anaerobic ammonium-oxidizing bacteria as revealed by genomic and
proteomic analyses of “ Candidatus Scalindua japonica.” Environ. Microbiol. Rep. 9,
550–561. doi:10.1111/1758-2229.12586
Oshiki, M., Satoh, H., Okabe, S., 2016. Ecology and physiology of anaerobic
ammonium oxidizing bacteria. Environ. Microbiol. 18, 2784–2796. doi:10.1111/1462-
2920.13134
Oshiki, M., Satoh, H., Okabe, S., 2015. Ecology and Physiology of Anaerobic
Ammonium Oxidizing (anammox) Bacteria. Environ. Microbiol. n/a-n/a.
doi:10.1111/1462-2920.13134
Oshiki, M., Shimokawa, M., Fujii, N., Satoh, H., Okabe, S., 2011. Physiological
characteristics of the anaerobic ammonium-oxidizing bacterium “Candidatus Brocadia
sinica.” Microbiology 157, 1706–1713. doi:10.1099/mic.0.048595-0

Chapter 2: Literature review
47
Park, H., Rosenthal, A., Jezek, R., Ramalingam, K., Fillos, J., Chandran, K., 2010a.
Impact of inocula and growth mode on the molecular microbial ecology of anaerobic
ammonia oxidation (anammox) bioreactor communities. Water Res. 44, 5005–5013.
doi:10.1016/j.watres.2010.07.022
Park, H., Rosenthal, A., Ramalingam, K., Fillos, J., Chandran, K., 2010b. Linking
Community Profiles, Gene Expression and N-Removal in Anammox Bioreactors
Treating Municipal Anaerobic Digestion Reject Water. Environ. Sci. Technol. 44,
6110–6116. doi:10.1021/es1002956
Park, H., Sundar, S., Ma, Y., Chandran, K., 2015. Differentiation in the microbial
ecology and activity of suspended and attached bacteria in a nitritation-anammox
process. Biotechnol. Bioeng. 112, 272–279. doi:10.1002/bit.25354
Park, H.D., Noguera, D.R., 2007. Characterization of two ammonia-oxidizing bacteria
isolated from reactors operated with low dissolved oxygen concentrations. J. Appl.
Microbiol. 102, 1401–1417. doi:10.1111/j.1365-2672.2006.03176.x
Puyol, D., Carvajal-Arroyo, J.M., Garcia, B., Sierra-Alvarez, R., Field, J.A., 2013.
Kinetic characterization of Brocadia spp.-dominated anammox cultures. Bioresour.
Technol. 139, 94–100. doi:10.1016/j.biortech.2013.04.001
Qiao, S., Bi, Z., Zhou, J., Cheng, Y., Zhang, J., 2013. Long term effects of divalent
ferrous ion on the activity of anammox biomass. Bioresour. Technol. 142, 490–7.
doi:10.1016/j.biortech.2013.05.062
Quan, Z.-X., Rhee, S.-K., Zuo, J.-E., Yang, Y., Bae, J.-W., Park, J.R., Lee, S.-T., Park,
Y.-H., 2008a. Diversity of ammonium-oxidizing bacteria in a granular sludge anaerobic
ammonium-oxidizing (anammox) reactor. Environ. Microbiol. 10, 3130–9.
doi:10.1111/j.1462-2920.2008.01642.x
Quan, Z.-X., Rhee, S.-K., Zuo, J.-E., Yang, Y., Bae, J.-W., Park, J.R., Lee, S.-T., Park,
Y.-H., 2008b. Diversity of ammonium-oxidizing bacteria in a granular sludge anaerobic
ammonium-oxidizing (anammox) reactor. Environ. Microbiol. 10, 3130–3139.
doi:10.1111/j.1462-2920.2008.01642.x
Quan, Z.X., Rhee, S.K., Zuo, J.E., Yang, Y., Bae, J.W., Park, J.R., Lee, S.T., Park, Y.H.,
2008. Diversity of ammonium-oxidizing bacteria in a granular sludge anaerobic
ammonium-oxidizing (anammox) reactor. Env. Microbiol 10, 3130–3139.
doi:10.1111/j.1462-2920.2008.01642.x
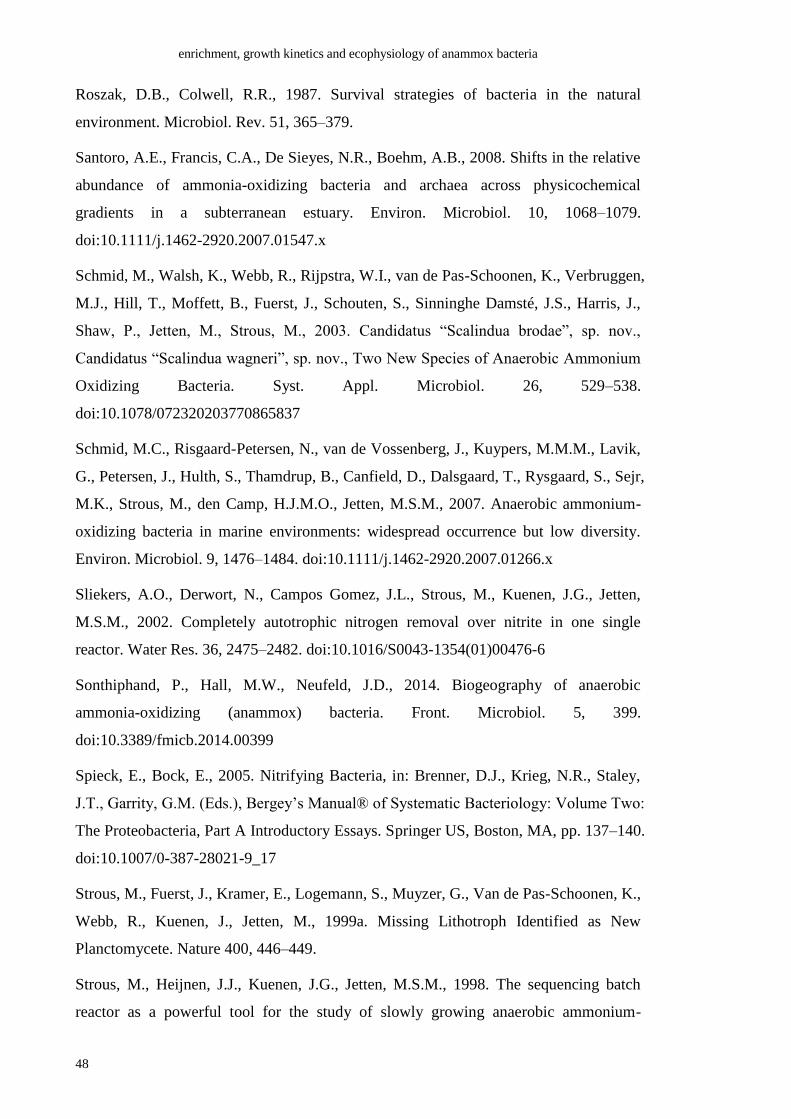
enrichment, growth kinetics and ecophysiology of anammox bacteria
48
Roszak, D.B., Colwell, R.R., 1987. Survival strategies of bacteria in the natural
environment. Microbiol. Rev. 51, 365–379.
Santoro, A.E., Francis, C.A., De Sieyes, N.R., Boehm, A.B., 2008. Shifts in the relative
abundance of ammonia-oxidizing bacteria and archaea across physicochemical
gradients in a subterranean estuary. Environ. Microbiol. 10, 1068–1079.
doi:10.1111/j.1462-2920.2007.01547.x
Schmid, M., Walsh, K., Webb, R., Rijpstra, W.I., van de Pas-Schoonen, K., Verbruggen,
M.J., Hill, T., Moffett, B., Fuerst, J., Schouten, S., Sinninghe Damsté, J.S., Harris, J.,
Shaw, P., Jetten, M., Strous, M., 2003. Candidatus “Scalindua brodae”, sp. nov.,
Candidatus “Scalindua wagneri”, sp. nov., Two New Species of Anaerobic Ammonium
Oxidizing Bacteria. Syst. Appl. Microbiol. 26, 529–538.
doi:10.1078/072320203770865837
Schmid, M.C., Risgaard-Petersen, N., van de Vossenberg, J., Kuypers, M.M.M., Lavik,
G., Petersen, J., Hulth, S., Thamdrup, B., Canfield, D., Dalsgaard, T., Rysgaard, S., Sejr,
M.K., Strous, M., den Camp, H.J.M.O., Jetten, M.S.M., 2007. Anaerobic ammonium-
oxidizing bacteria in marine environments: widespread occurrence but low diversity.
Environ. Microbiol. 9, 1476–1484. doi:10.1111/j.1462-2920.2007.01266.x
Sliekers, A.O., Derwort, N., Campos Gomez, J.L., Strous, M., Kuenen, J.G., Jetten,
M.S.M., 2002. Completely autotrophic nitrogen removal over nitrite in one single
reactor. Water Res. 36, 2475–2482. doi:10.1016/S0043-1354(01)00476-6
Sonthiphand, P., Hall, M.W., Neufeld, J.D., 2014. Biogeography of anaerobic
ammonia-oxidizing (anammox) bacteria. Front. Microbiol. 5, 399.
doi:10.3389/fmicb.2014.00399
Spieck, E., Bock, E., 2005. Nitrifying Bacteria, in: Brenner, D.J., Krieg, N.R., Staley,
J.T., Garrity, G.M. (Eds.), Bergey’s Manual® of Systematic Bacteriology: Volume Two:
The Proteobacteria, Part A Introductory Essays. Springer US, Boston, MA, pp. 137–140.
doi:10.1007/0-387-28021-9_17
Strous, M., Fuerst, J., Kramer, E., Logemann, S., Muyzer, G., Van de Pas-Schoonen, K.,
Webb, R., Kuenen, J., Jetten, M., 1999a. Missing Lithotroph Identified as New
Planctomycete. Nature 400, 446–449.
Strous, M., Heijnen, J.J., Kuenen, J.G., Jetten, M.S.M., 1998. The sequencing batch
reactor as a powerful tool for the study of slowly growing anaerobic ammonium-

Chapter 2: Literature review
49
oxidizing microorganisms. Appl. Microbiol. Biotechnol. 50, 589–596.
doi:10.1007/s002530051340
Strous, M., Kuenen, J.G., Jetten, M.S., 1999b. Key physiology of anaerobic ammonium
oxidation. Appl. Environ. Microbiol. 65, 3248–50.
Suwa, Y., Imamura, Y., Suzuki, T., Tashiro, T., Urushigawa, Y., 1994. Ammonia-
oxidizing bacteria with different sensitivities to (NH4)2SO4 in activated sludges. Water
Res. 28, 1523–1532. doi:10.1016/0043-1354(94)90218-6
Suzuki, I., Dular, U., Kwok, S.C., 1974. Ammonia or ammonium ion as substrate for
oxidation by Nitrosomonas europaea cells and extracts. J. Bacteriol. 120, 556–558.
Takekawa, M., Park, G., Soda, S., Ike, M., 2014. Simultaneous anammox and
denitrification (SAD) process in sequencing batch reactors. Bioresour. Technol. 174,
159–166. doi:10.1016/j.biortech.2014.10.021
Tang, C.-J., Zheng, P., Wang, C.-H., Mahmood, Q., Zhang, J.-Q., Chen, X.-G., Zhang,
L., Chen, J.-W., 2011. Performance of high-loaded ANAMMOX UASB reactors
containing granular sludge. Water Res. 45, 135–44. doi:10.1016/j.watres.2010.08.018
Tang, C.J., Zheng, P., Wang, C.H., Mahmood, Q., 2010. Suppression of anaerobic
ammonium oxidizers under high organic content in high-rate Anammox UASB reactor.
Bioresour. Technol. 101, 1762–1768. doi:10.1016/j.biortech.2009.10.032
Thamdrup, B., Dalsgaard, T., 2002. Production of N 2 through Anaerobic Ammonium
Oxidation Coupled to Nitrate Reduction in Marine Sediments Production of N 2
through Anaerobic Ammonium Oxidation Coupled to Nitrate Reduction in Marine
Sediments. Appl. Environ. Microbiol. 68, 1312–1318. doi:10.1128/AEM.68.3.1312
Trimmer, M., Engström, P., Thamdrup, B., 2013. Stark contrast in denitrification and
anammox across the deep norwegian trench in the skagerrak. Appl. Environ. Microbiol.
79, 7381–7389. doi:10.1128/AEM.01970-13
Tsushima, I., Kindaichi, T., Okabe, S., 2007a. Quantification of anaerobic ammonium-
oxidizing bacteria in enrichment cultures by real-time PCR. Water Res. 41, 785–794.
doi:10.1016/j.watres.2006.11.024
Tsushima, I., Ogasawara, Y., Kindaichi, T., Satoh, H., Okabe, S., 2007b. Development
of high-rate anaerobic ammonium-oxidizing (anammox) biofilm reactors. Water Res. 41,
1623–1634. doi:10.1016/j.watres.2007.01.050

enrichment, growth kinetics and ecophysiology of anammox bacteria
50
Tsushima, I., Ogasawara, Y., Shimokawa, M., Kindaichi, T., Okabe, S., 2007c.
Development of a super high-rate Anammox reactor and in situ analysis of biofilm
structure and function. Water Sci. Technol. 55, 9. doi:10.2166/wst.2007.236
Vadivelu, V.M., Keller, J., Yuan, Z., 2006. Stoichiometric and kinetic characterisation
of Nitrosomonas sp. in mixed culture by decoupling the growth and energy generation
processes. J. Biotechnol. 126, 342–356. doi:10.1016/j.jbiotec.2006.04.017
van de Graaf, A.A., de Bruijn, P., Robertson, L.A., Jetten, M.S.M., Kuenen, J.G., 1996.
Autotrophic growth of anaerobic ammonium-oxidizing micro-organisms in a fluidized
bed reactor. Microbiology 142, 2187–2196. doi:10.1099/13500872-142-8-2187
van de Vossenberg, J., Rattray, J.E., Geerts, W., Kartal, B., van Niftrik, L., van
Donselaar, E.G., Sinninghe Damsté, J.S., Strous, M., Jetten, M.S.M., 2008a. Enrichment
and characterization of marine anammox bacteria associated with global nitrogen gas
production. Environ. Microbiol. 10, 3120–9. doi:10.1111/j.1462-2920.2008.01643.x
van de Vossenberg, J., Rattray, J.E., Geerts, W., Kartal, B., van Niftrik, L., van
Donselaar, E.G., Sinninghe Damsté, J.S., Strous, M., Jetten, M.S.M., 2008b.
Enrichment and characterization of marine anammox bacteria associated with global
nitrogen gas production. Environ. Microbiol. 10, 3120–9. doi:10.1111/j.1462-
2920.2008.01643.x
van der Star, W.R.L., Miclea, A.I., van Dongen, U.G.J.M., Muyzer, G., Picioreanu, C.,
van Loosdrecht, M.C.M., 2008. The membrane bioreactor: a novel tool to grow
anammox bacteria as free cells. Biotechnol. Bioeng. 101, 286–294.
doi:10.1002/bit.21891
Vandermeer, J.H., 1972. Niche Theory. Annu. Rev. Ecol. Syst. 3, 107–132.
doi:10.1146/annurev.es.03.110172.000543
Vanniel, E., Arts, P., Wesselink, B., Robertson, L., Kuenen, J., 1993. Competition
between heterotrophic and autotrophic nitrifiers for ammonia in chemostat cultures.
FEMS Microbiol. Lett. 102, 109–118. doi:10.1016/0378-1097(93)90006-N
Vlaeminck, S.E., Terada, A., Smets, B.F., De Clippeleir, H., Schaubroeck, T., Bolca, S.,
Demeestere, L., Mast, J., Boon, N., Carballa, M., Verstraete, W., 2010. Aggregate size
and architecture determine microbial activity balance for one-stage partial nitritation
and anammox. Appl. Environ. Microbiol. 76, 900–9. doi:10.1128/AEM.02337-09

Chapter 2: Literature review
51
Ward, B.B., 1987. Kinetic studies on ammonia and methane oxidation by Nitrosococus
oceanus. Arch Microbiol. 147, 126–133.
Winkler, M.K.H., Boets, P., Hahne, B., Goethals, P., Volcke, E.I.P., 2017. Effect of the
dilution rate on microbial competition: R-strategist can win over kstrategist at low
substrate concentration. PLoS One 12, 1–12. doi:10.1371/journal.pone.0172785
Winkler, M.K.H., Kleerebezem, R., Van Loosdrecht, M.C.M., 2012. Integration of
anammox into the aerobic granular sludge process for main stream wastewater
treatment at ambient temperatures. Water Res. 46, 136–144.
doi:10.1016/j.watres.2011.10.034
Wuchter, C., Abbas, B., Coolen, M.J.L., Herfort, L., van Bleijswijk, J., Timmers, P.,
Strous, M., Teira, E., Herndl, G.J., Middelburg, J.J., Schouten, S., Sinninghe Damste,
J.S., 2006. Archaeal nitrification in the ocean. Proc. Natl. Acad. Sci. 103, 12317–12322.
doi:10.1073/pnas.0600756103
Zhang, L., Narita, Y., Gao, L., Ali, M., Oshiki, M., Ishii, S., Okabe, S., 2017a.
Microbial competition among anammox bacteria in nitrite-limited bioreactors. Water
Res. 125, 249–258. doi:10.1016/j.watres.2017.08.052
Zhang, L., Narita, Y., Gao, L., Ali, M., Oshiki, M., Okabe, S., 2017b. Maximum
specific growth rate of anammox bacteria revisited. Water Res. 116, 296–303.
doi:10.1016/j.watres.2017.03.027
Zhang, L., Okabe, S., 2017. Rapid cultivation of free-living planktonic anammox cells.
Water Res. 127, 204–210. doi:10.1016/j.watres.2017.10.029

enrichment, growth kinetics and ecophysiology of anammox bacteria
52
Figure 2.1 Research in the biological conversions of nitrogen including anammox
from 1900 to 2016. (A) Articles that related to main biological process including
nitrification, denitrification and anammox as the key words. (B), (C) and (D)
Articles related to anammox and its subdiscipline. Articles with keywords
“denitrification”, “nitrification”, “anammox”, “anammox and application”,
“anammox and physiology”, and “anammox and ecology” indexed by Web of
Science were taken into account.
0
500
1000
1500
2000
1900 1920 1940 1960 1980 2000 2020
Denitrification
Nitrification
Anammox
2 0
2 1 1 0 1 1 3
5 5
10 10
14
8 10
23 24
20
37
33
43
0
10
20
30
40
50
Anammox and application
0 0 0 0 1 0 1 1 2 2 3 3 0 0
2 2 3 4
0 3 2
5
0
10
20
30
40
50
Anammox and physiology
0 0 0 0 0 0 1 1 0 1 1 2 5
2 3 4 6
8 5
12 9
11
0
10
20
30
40
50
Anammox and ecology
Num
be
r o
f p
ub
lica
tio
ns p
er
yea
r
Num
be
r o
f p
ub
lica
tio
ns p
er
yea
r
Year
A B
C D

Chapter 2: Literature review
53
Figure 2.2 Enrichment of anammox bacteria as free-living cells in membrane
bioreactor. (A) The anammox membrane bioreactor cultivating “Ca. Brocadia
sinica”. (B) Fluorescence in situ hybridization micrograph depicting highly
enriched “Ca. Brocadia sinica” in yellow (combination of AMX820 probes
counterstained with EUB 338 mix probes for most bacteria); scale bar = 20 μm.
20 μm
A B

enrichment, growth kinetics and ecophysiology of anammox bacteria
54
Figure 2.3 Maximum specific growth rates of anammox bacteria, NOB and AOB.
For anammox bacteria, different genus was indicated in red (“Ca. Kuenenia”),
green (“Ca. Brocadia”), blue (“Ca. Scalindua”) and brown (“Ca. Jettenia”). *:
AOB that was not identified as species.
0
0.51
1.52
2.5
Maximum specific growth rates (μmax,d-1)
An
am
mo
xN
OB
AO
B

Chapter 2: Literature review
55
Figure 2.4 High affinity ammonium and nitrite oxidation by anammox bacteria
compared with AOB or NOB. (A) Ks value for nitrite from anammox bacteria
(diamond) and nitrite oxidizing bacteria (NOB) (circle). (B) Ks value for
ammonium/ammonia from anammox bacteria (diamond) and
ammonium/ammonia oxidizing bacteria (AOB) (circle). For anammox bacteria,
different genus was indicated in red (“Ca. Kuenenia”), green (“Ca. Brocadia”),
0.11
10
10
0
10
00
**
Ks (μM NO2-)
1
10
10
0
10
00
10
000
*
Ks (μM NH4+)
**
**
AB
Anam
mo
xN
OB
Anam
mo
xA
OB

enrichment, growth kinetics and ecophysiology of anammox bacteria
56
blue (“Ca. Scalindua”) and brown (“Ca. Jettenia”). *: information not available at
the time of writing.

Chapter 2: Literature review
57
Table 2.1 Reactor types used for enriching anammox biomass.
Reactor type Sequencing batch
reactor (SBR)
Non-woven fabric
assisted upflow
column reactor
Immobilized
gel reactor
Membrane
bioreactor
(MBR)
Form of
biomass
Aggregated
granules Attached Biofilm
Dispersed
biomass
immobilized in
artificial
materials
Suspended
planktonic cells
Advantages
1) Efficient
biomass
retention;
2) A homogeneous
distribution of
substrate,
products and
biomass
aggregates over
the reactor;
3) Reliable
operation for
more than one
year (long term
stability);
4) Stable
conditions
under substrate-
limiting
conditions.
1) Attached
growth to
reduce
washout;
2) Fast start-up
with
supporting
material;
3) Less energy
input (no need
for agitation or
aeration to mix
up).
1) Complete
biomass
retention;
2) Higher
diffusion
efficiency
compared
with
granules
and biofilm;
3) Different
groups of
microbes
can be
immobilize
d into one
system.
1) Complete
biomass
retention;
2) No diffusion
limitation;
3) Very high
purity
(>90%);
4) Possible to
manipulate
specific
growth rate
sensitively.
Disadvantages
1) Energy input is
needed for
floating
granules;
2) Inert biomass at
the inner part of
granules;
3) Heterogeneity
in substrate
diffusion and
specific
activity;
4) Large amount
of extracellular
polymeric
substance (EPS)
disturbing the
protein
purification
process;
1) Substrate
diffusion
limitation
along with the
biofilm;
2) Inert biomass
at the inner
part of
granules;
3) Heterogeneity
in substrate
diffusion and
specific
activity;
4) Space needed
for supporting
materials in
reactors;
5) Detachment
from the
1) The
strength of
the
immobilizin
g materials
(easy
broken);
considering
long-term
operation;
2) Cost from
the
immobilizin
g materials;
3) Difficulty in
measuring
cellular
composites
including
EPS due to
1) Less
resistant to
unfavorable
conditions
(e.g. oxygen
contaminatio
n, organic
loads);
2) Unsuitable
for practical
application;
3) Additional
costs in
membrane
maintenance
and aeration
for anoxic
condition,
agitation;
4) Long time

enrichment, growth kinetics and ecophysiology of anammox bacteria
58
5) Mineral
accumulation.
supporting
materials
during the
operation.
the
disturbance
from
immobilizin
g materials.
(6-12
months)
needed for
culture
development
.
Reference
(Ali et al., 2015c;
Cirpus et al., 2006;
Lin et al., 2013;
Strous et al., 1998;
Vlaeminck et al.,
2010)
(Furukawa; et al.,
2004; Kindaichi et
al., 2007;
Tsushima et al.,
2007c)
(Ali et al.,
2015c; Isaka et
al., 2013; Magrí
et al., 2012;
Zhang et al.,
2017b)
(Ali et al.,
2015a; Lotti et
al., 2015, 2014;
Mamoru Oshiki
et al., 2013; van
der Star et al.,
2008)

Chapter 2: Literature review
59
Table 2.2 Species specific enriching conditions.
Specie
s
“Ca. B.
anammoxidans”
“Ca.
B. fulgi
da”
“Ca. B.
sinica”
“Ca. B.
sapporoensis”
“Ca. K.
stuttgartiensis”
“Ca. A.
propionicus”
“Ca. S.
brodae”
“Ca. S.
profundal”
“Ca.
S. japon
ica”
“Ca.
Scalindua
sp.”
“Ca. J.
caeni”
“Ca.
Jettenia
asiat
ica”
Enrichment
level
(%)
74 80 70, 90 >90 90, >90 80, 65±5
~90 ~90 85±4.5,
>90
<67 72.8, >90
50
React
or type
SBR* SBR,
MBR
UAB,
MBR
MBR Flask,
SBR, MBR
SBR,
batch mode
reactor
SBR SBR UAB
, MBR
UAB UAB,
MBR
UA
B
Form
of
bioma
ss
Granule biofil
m
aggre
gates
Biofilm
,
suspen
ded plankto
nic
cells
suspen
ded
plankto
nic cells
Granul
e,
suspen
ded plankto
nic
cells
Granul
e
Floc Granul
e
Biofi
lm,
suspe
nded plank
tonic
cells
Biofi
lm
Biofil
m,
suspen
ded plankto
nic
cells
Gran
ule
Temp
eratur
e
32-33 33 37, 30 30, 25,
37
30, 35,
38
33, 27-
30
23 15-18 20 25 30, 37 30-
35
pH 7.0-8.0 7.0-
7.3
7.0-7.5,
7.6-7.8,
7.6-8.6
6.8-7.5, 7, 8.0 ±
0.1,
7.8-8.0, 7.1-7.5
7.0-7.3,
7-8
7-8 7-8 8.0 7.5-8.0 8.0-
8.5
Inocul
um
Denitrif
ying FBR
sludge
Activ
ated Slud
ge
Denitri
fication sludge,
Anam
mox biofilm
Full-
scale anamm
ox
reactor sludge,
anamm
ox UAB
sludge
Nitrifyi
ng RBC,
anamm
ox SBR sludge,
full-
scale anamm
ox
reactor sludge
Activat
ed sludge,
landfill
leachate
Marine
sediment
(Gullm
ar Fjord)
Marine
sediment
Mari
ne sedi
ment,
Anammo
x
biofilm
Mari
ne biofil
m
Labora
tory scale
denitrif
ication reactor
sludge
Rive
r sedi
ment
Locati
on of enrich
ment
Delft
(NLD)
Nijm
egen (NL
D)
Sappor
o (JPN)
Delft
(NLD), Sappor
o (JPN)
Dübend
orf, (CHE),
Santiag
o de Compo
stela
(ESP), Delft
(NLD)
Nijmeg
en (NLD),
Taichu
ng (TWN)
Nijmeg
en (NLD)
Nijmeg
en (NLD)
Hiros
hima (JPN
)
Tsu
(JPN)
Kuma
moto (JPN),
Sappor
o (JPN)
Shan
ghai (CH
N)
Medium
compo
sition **
A1, A2 A1 A1, A6 A5, B1 A3, A4 A1, B4 C1 C1 C2, C3
C4 B1, B2 B3
Type
of water
Demine
ralized water
Not
described
Ground
water
Demin
eralized
water,
Ground water
Demine
ralized water
Demin
eralized water
Demin
eralized water
Demin
eralized water
Grou
nd water
Deep
sea water
Groun
d water
Not
describe
d
Influent
substr
ate
Amm
onium
(mM)
5 3-45 6.2-
24.6,
16-30
60, 1-
15
6, 26.8,
120
2.5-45,
13.1
1-45 1-45 0.58-
6.3,
5-10
3.6-
10.9
17.9,
2.5-
16.8
15

enrichment, growth kinetics and ecophysiology of anammox bacteria
60
Nitrite
(mM)
5 3-45 3.7-
22.8, 16-30
60, 1-
15
6, 26.8,
120
2.5-45,
11.9
0.5-45 0.5-45 1.8-
6.3, 5-10
3.6-
14.1
17.9,
2.5-20
15
Nitrat
e (mM)
- 6 - - - 6, 0 0-1.5 0-1.5 - - - (3
mg-N/L in
ground
water)
-
Other - 1-30
mM
Acetate
- - - 0.8-15
mM
propionate
- - Sulfi
de to
adjust pH
- -
SRT (d)
- - 125, 30-60
12-15, 60
- - - - - - - -
Refere
nce
(Strous
et al., 1998;
van de
Graaf et al.,
1996)
(Kart
al et al.,
2008
)
(Mamo
ru Oshiki
et al.,
2013; Oshiki
et al.,
2011; Tsushi
ma et
al., 2007b)
(Lotti
et al., 2014;
Narita
et al., 2017)
(Dapen
a-Mora et al.,
2004;
Egli et al.,
2001;
van der Star et
al.,
2008)
(Hsu et
al., 2014;
Kartal
et al., 2007a)
(van de
Vossenberg et
al.,
2008a)
(van de
Vossenberg et
al.,
2008a)
(Kin
daichi et
al.,
2011; Mam
oru
Oshiki et
al.,
2013)
(Nak
ajima et al.,
2008
)
(Ali et
al., 2015b;
Fujii et
al., 2002)
(Z.-
X. Qua
n et
al., 2008
b)
*Abbreviations of reactor
SBR: sequencing batch reactor
MBR: membrane bioreactor
UAB: up-flow anaerobic biofilm
EGSB: expanded granular sludge bed
FBR: fluidized bed reactor
RBC: rotating biological contactor
**Medium composition
A group: variations of synthetic mineral medium proposed at first
A1. KHCO3, 500 mg L-1; KH2PO4, 27.2 mg L-1; MgSO4.7H2O, 300 mg L-1; CaCl2.2H2O, 180 mg L-1; trace element
solution I (EDTA, 5 g L-1; FeSO4, 5 g L-1) 1 mL L-1; trace elements solution II (EDTA, 15 g L-1; ZnSO4.7H2O, 0.43 g L-
1;CoCl2.6H2O, 0.24 g L-1; MnCl2.4H2O, 0.99 g L-1; CuSO4.5H2O, 0.25 g L-1; NaMoO4.2H2O, 0.22 g L-1; NiCl2.6H2O, 0.19 g L-1;
NaSeO4.10H2O, 0.21 g L-1; H3BO4, 0.014 g L-1), 1 mL L-1 (van de Graaf et al., 1996)
A2. KHCO3, 1.25 g L-1; NaH2PO4, 50 mg L-1; CaCl2.2H2O, 300 mg L-1; MgSO4.7H2O, 200 mg L-1; FeSO4, 6.25 mg L-1; ethylenediamine tetraacetic acid, 6.25 mg L-1; trace elements solution I and II (same as A1), 1.25 mL L-1 (Strous et al., 1998)
A3. KHCO3, 250 mg L-1; K2HPO4, 174.2 mg L-1; MgCl2, 42.6 mg L-1; CaCl2, 55.5 mg L-1; trace element solution I
(EDTA, 10 g L-1; FeSO4, 5 g L-1) 2 mL L-1; trace elements solution II (EDTA, 15 g L-1; ZnSO4.7H2O, 0.43 g L-1;CoCl2.6H2O, 0.24
g L-1; MnCl2.4H2O, 0.99 g L-1; CuSO4.5H2O, 0.25 g L-1; NaMoO4.2H2O, 0.22 g L-1; NiCl2.6H2O, 0.19 g L-1; NaSeO4.10H2O,
0.21 g L-1; H3BO4, 0.014 g L-1), 1 mL L-1 (Egli et al., 2001)
A4. KHCO3, 1.5 g L-1; KH2PO4, 24.5 mg L-1; MgSO4.7H2O, 49.4 mg L-1; CaCl2, 147 mg L-1; EDTA, 14.6 mg L-1; yeast extract, 1.0 mg L-1; trace elements solution II (same as A1), 1 mL L-1 (van der Star et al., 2008)
A5. KHCO3, 0-1.5 g L-1; KH2PO4, 24.5-2041 mg L-1; MgSO4.7H2O, 49.4 mg L-1; CaCl2, 73.5-147 mg L-1; EDTA, 14.6
mg L-1; vitamin solution, 0-10 mL L-1; trace elements solution I and II (same as A1), 1 mL L-1 (Lotti et al., 2014)
A6. KHCO3, 24.4 mg L-1; KH2PO4, 24.4 mg L-1; MgSO4.7H2O, 60 mg L-1; CaCl2, 51 mg L-1; yeast extract, 1.0 mg L-1;
trace elements solution I and II (same as A1), 0.5 mL (Mamoru Oshiki et al., 2013)
B group: Other medium for freshwater anammox bacteria
B1. NaHCO3, 84 mg L-1; KH2PO4, 54 mg L-1; MgSO4.7H2O, 1 mg L-1; CaCl2.2H2O, 1.4 mg L-1; FeSO4.7H2O, 9 mg L-1;
EDTA, 5 mg L-1; NaCl, 1 mg L-1; KCl, 1.4 mg L-1
B2. KHCO3, 125 mg L-1; KH2PO4, 54 mg L-1; MgSO4.7H2O, 9 mg L-1; CaCl2.2H2O, 1.4 mg L-1; FeSO4.7H2O, 9 mg L-1; EDTA, 5 mg L-1; NaCl, 1 mg L-1; KCl, 1.4 mg L-1
B3. KH2PO4, 10 mg L-1; trace elements (not described in detail) (Z.-X. Quan et al., 2008b)
B4. KHCO3, 1.36 mg L-1; NaH2PO4, 65.2 mg L-1; MgSO4.7H2O, 217 mg L-1; CaCl2.2H2O, 326 mg L-1; FeSO4.7H2O, 6.79 mg L-1; EDTA, 6.79 mg L-1; HCl, 1 mM; trace elements solution II (same as A1), 1 mL (Hsu et al., 2014)
C group: media for marine anammox bacteria

Chapter 2: Literature review
61
C1. Red sea salt, 33 gL-1; FeSO4, 0-9 μM; KH2PO4, 0-0.2 mM; NaHCO3 (van de Vossenberg et al., 2008a)
C2. SEALIFE (artificial sea salt), 35 gL-1; KHCO3, 500 mg L-1; KH2PO4, 27 mg L-1; MgSO4.7H2O, 300 mg L-1; CaCl2.2H2O, 180 mg L-1; trace elements solution I and II (same as A1), 1 mL (Kindaichi et al., 2011)
C3 SEALIFE (artificial sea salt), 35 gL-1; KHCO3, 24.4 mg L-1; KH2PO4, 24.4 mg L-1; MgSO4.7H2O, 60 mg L-1; CaCl2,
51 mg L-1; yeast extract, 1.0 mg L-1; trace elements solution I and II (same as A1), 0.5 mL (Mamoru Oshiki et al., 2013)
C4. KHCO3, 125 mg L-1; KH2PO4, 54 mg L-1; FeSO4.7H2O, 9 mg L-1; EDTA, 5 mg L-1 (Nakajima et al., 2008)

enrichment, growth kinetics and ecophysiology of anammox bacteria
62
3 RAPID CULTIVATION OF
FREE-LIVING ANAMMOX
CELLS
This chapter has been published as:
Zhang, L and Okabe, S. Rapid Cultivation of free-living Anammox Cells. Water
Research, 2017, 127, 204-210.

Chapter 3: Rapid Cultivation of free-living Anammox Cells
63
3.1 ABSTRACT
It is still not successful to cultivate anaerobic ammonium oxidizing (anammox)
bacteria, a key player in global nitrogen cycle, as pure culture. Planktonic cell culture
with high purity is, therefore, essential for physiological and biochemical studies of
anammox bacteria. However, development of such planktonic cell cultures requires an
enormous amount of time and effort. Here we developed a novel method for cultivating
free-living planktonic anammox cells rapidly. First, anammox granules were dispersed
and immobilized in 6% polyvinyl alcohol – 4% sodium alginate (PVA-SA) gel beads
for pre-incubation. Anammox bacteria grew rapidly as loosely connected micro-
colonies in the gel beads. After 18 days of pre-cultivation, mature gel beads were
harvested, physically dispersed by vortex and inoculated into a membrane bioreactor
(MBR). The MBR was then continuously operated at a low nitrogen loading rate (< 0.9
kg-TN m-3 d-1). After 17 days of operation, active free-living planktonic anammox cells
with purity > 95% was successfully developed in the MBR. Total culture time (gel
beads and MBR) to accomplish free-living planktonic anammox cells was only 35 days,
which was significantly shorter than the previous reports. This new cultivation
technique could greatly facilitate various microbial, physiological and biochemical
studies of anammox.
3.2 INTRODUCTION
Highly enriched and free-living planktonic cells are essential for biochemical
and physiological studies of anammox bacterium (Strous et al., 1999). Our
understanding of biochemistry and physiology of anammox bacteria is still limited. (van
der Star et al., 2008) was the first to successfully enrich an anammox bacterial species
“Ca. Kuenenia stuttgartiensis” as planktonic cells using a membrane-assisted bioreactor
(MBR). The MBR can cultivate anammox bacteria with complete biomass retention but
without selection pressure such as settling ability and thereby free-living planktonic
cells with high purity can be obtained in the MBR. The MBR has been considered as a
useful and necessary tool for physiological and kinetic studies and used for various
anammox bacterial species; i.e., “Ca. Jettenia” (Ali et al., 2015a), “Ca. Brocadia” (Lotti
et al., 2014; Oshiki et al., 2013) and “Ca. Scalindua” (Awata et al., 2013; Oshiki et al.,
2011). In those studies, anammox granular biomass was directly inoculated into the

enrichment, growth kinetics and ecophysiology of anammox bacteria
64
MBR and cultured in the standard anammox medium (van de Graaf et al., 1996) with
low levels of divalent ions (i.e., calcium and/or magnesium) and addition of small
amounts of yeast extract. However, this MBR cultivation still takes an enormous
amount of time to achieve free-living cells; usually more than 100 – 200 days (Ali et al.,
2015a; Lotti et al., 2014; Oshiki et al., 2013; van der Star et al., 2008). This time-
consuming cultivation process is apparently a bottle neck of physiological, biochemical
and kinetic studies of anammox bacteria.
Cell immobilization technology has been successfully applied to anammox bacteria (Ali
et al., 2015b, 2014, Isaka et al., 2013, 2008, 2007; Zhang et al., 2017). Anammox
bacteria could grow at almost the maximum rate in polyvinyl alcohol (PVA, 6% w/v)-
sodium alginate (SA, 2% w/v) gel beads due to high substrate supply, no hydraulic
shear stress and thereby less EPS production, and full retention of newly born cells
(Zhang et al., 2017). Therefore, only a considerably small amount of anammox biomass
was required for rapid successful start-up of anammox process if the biomass was
immobilized in the PVA-SA gel (Ali et al., 2015b). However, the durability of the
PVA-SA gel beads for long-term operation was a problem, because the gel beads tended
to be broken due to insufficient hardness after long-term (i.e., 1- 2 months) operation at
37 °C. We also found that anammox bacteria cells grown in the gel beads did not form
rigid aggregates and were easily dispersible. This suggests that the biomass grown in
the gel beads could be used as an inoculum of MBR to obtain free-living planktonic
cells. The combination of gel immobilization technique as pre-culture and MBR
cultivation has never been tested for rapid cultivation of planktonic cell cultures.
Therefore, the objective of current work is to develop a rapid and reliable method for
achievement of free-living planktonic anammox bacterial cell culture with high purity (>
95%). Total culture time for this purpose in our method was only 35 days, which was
significantly shorter than the previously reported values. In this technique, a pre-
cultivation of physically-dispersed granular biomass using PVA-SA gel immobilization
was performed before inoculating into MBR. Since we think the pre-culture in PVA-SA
gel beads was a key to this new method, growth of anammox cells in the PVA-SA gel
beads were investigated in details.

Chapter 3: Rapid Cultivation of free-living Anammox Cells
65
3.3 MATERIALS AND METHODS
Gel immobilization
“Ca. B. sinica” dominated anammox biomass was immobilized in PVA-SA gel
beads as described previously (Ali et al., 2014). In brief, granular biomass harvested
from an up-flow column reactor (Tsushima et al., 2007) was physically dispersed and
mixed with the same volume of immobilization solution containing PVA (6%, w/v) and
SA (2%, w/v). The initial biomass content in the gel bead was 1-3×10⁸ copy number per
gel bead. The mixed biomass solution was dropped into CaCl2 (4%, w/v) solution by
using a peristaltic pump (Eyela Roller Pump RP, Tokyo, Japan) equipped with a Phar
Med BPT tube (ID 3.1 mm) to make spherical beads with diameter of 1 - 2 mm. The gel
beads were cured in the CaCl2 solution overnight to enhance the physical strength. After
rinse with sterilized water at least three times, the gel beads were inoculated into an up-
flow column reactor.
Operation of up-flow column reactor packed with PVA-SA gel beads
An up-flow column reactor (255 mL, Fujirika, Japan) was packed with
immobilized gel beads and operated for 18 days at 37 °C and pH = 7.5 ± 0.5. The
packing ratio of the gel beads was 70% (v/v). The column reactor was continuously fed
with the anoxic inorganic synthetic medium (van de Graaf et al., 1996) at a hydraulic
retention time (HRT) of 2.13 h. The concentrations of ammonium and nitrite in the feed
were increased from 2 to 12 mM, corresponding to nitrogen loading rates of 1.3 to 7.6
kg-N m-3 d-1, to avoid substrate limitation. The feeding medium was purged with N2 gas
to remove dissolved oxygen. A N2 gas bag was connected to the medium tank to
prevent oxygen contamination (Tsushima et al., 2007). Throughout the operation, gel
beads samples were collected at the bottom of the reactor every week, and subjected to
microbial analysis. In addition, influent and effluent water samples were also collected
for chemical analyses on daily basis.
Operation of MBR
After 18 days of operation, highly active gel beads were harvested from the
bottom of the column reactor and transferred to two 225 ml graduated conical tubes
(Becton Dickinson, NJ, USA) containing 100 mL gel beads, respectively. Two tubes

enrichment, growth kinetics and ecophysiology of anammox bacteria
66
were briefly vortexed for 1 min at maximum speed to disperse the gel beads, and then
the dispersed gel beads were filtrated with a test sieve (710 μm, SANPO, Tokyo) to
remove the debris of gel bead. The filtrated biomass suspension was inoculated into a
MBR. The MBR consists of a wide mouth reagent bottle (2-liter, Sansyo, Japan), which
was equipped with a hollow-fiber membrane unit composed of 300 polyethylene tubes
(pore size, 0.1 μm; tube diameter, 1 mm; length, 70 mm, Mitsubishi Rayon, Japan). A
peristaltic pump (MP-1000, EYELA, Tokyo, Japan), actuated by a water level sensor
(HL–S1A, ASONE, Japan), was directly connected to the membrane unit to keep the
volume of culture medium constant. The culture medium in the MBR was vigorously
agitated with a magnetic stirrer working at 200 rpm. A mixed Ar and CO2 (95:5) gas
was continuously supplied to the culture medium at a flowrate of 10 mL min-1 to avoid
oxygen contamination. pH was not controlled but ranged between 7.0 - 8.0. The same
anoxic inorganic medium (van de Graaf et al., 1996) was continuously supplied at 2 mL
min-1. Sludge retention time (SRT) was not controlled. Nitrite concentration in the MBR
was regularly monitored by colorimetric method according to standard methods (APHA,
1998) and was kept below detection limit to avoid nitrite inhibition. The membrane was
washed routinely for every week.
Microbial analysis
Growth of “Ca. B. sinica” in the up-flow column reactor and MBR was
monitored by quantitative PCR-based 16S rRNA gene copy number analysis. Gel beads
and culture suspension in the MBR were collected, and genomic DNAs were extracted
using Fast DNA spin kit for soil (MP Biomedical, Tokyo, Japan). The extracted DNAs
were subjected to the PCR-based 16S rRNA gene copy number analysis, which was
conducted with “Ca. B. sinica” specific PCR primers and TaqMan probe (Table S1)
and Premix Ex Taq (Probe qPCR) (Takara Bio Inc., Japan) as described previously.
More detailed qPCR procedure can be found elsewhere (Zhang et al., 2017). PCR
amplification and fluorescence detection were conducted by ABI prism 7500 sequence
detection system (Applied Biosystems, California, USA). “Ca. B. sinica” genome
contains a single rrn operon (Oshiki et al., 2015).
FISH analysis was performed to determine the local cell density of “Ca. B. sinica”
micro-clusters in the immobilized gel bead and naturally aggregated granules. The
purity of the enriched MBR culture was also examined based on FISH. Briefly, the
biomass was fixed in 4% paraformaldehyde (PFA) for up to 23 hr at 4 °C. The PFA-

Chapter 3: Rapid Cultivation of free-living Anammox Cells
67
fixed biomass was embedded in Tissue-Tek OCT compound (Sakura Finetek, Torrance,
CA), and then vertical thin sections with 20 µm of thickness were obtained using a
cryostat (Reichert-Jung Cryocut 1800, Leica, Bensheim, Germany) (Okabe et al., 1999),
which were mounted on Teflon-coated glass slides (Slide-glass, Matsunami Glass Ind.,
Ltd, Japan) and were subjected to in situ hybridization. For FISH analysis, fluoresceine
isothiocyanate (FITC)-labeled AMX820 probe and tetramethylrhodamine-5-
isothiocyanate (TRITC)-labeled EUB338 mixed probe (Table S2) were used for
detection of “Ca. B. sinica” and most bacteria. Specimens were examined using a
Fluoview FV 300 confocal laser scanning microscope (Olympus, Tokyo, Japan)
equipped with multi Ar laser (458 nm, 488nm, 514nm), HeNe laser (543nm) and HeNe
laser (633nm). Fluorescence images were analyzed by the image-processing software
Image-Pro Premier 9.1 (Media Cybernetics, USA).
To determine the local cell density of micro-clusters in the immobilized gel beads and
naturally aggregated granules, number of fluoresced cells within certain regions (500 ×
500 pixels) was counted as indicated as local cell density. In detail, at least three regions
were selected for each micro-cluster and or each time point sample, minimum ten
positions were selected and at each microscopic field, were selected for cell counting.
Error bars shows standard deviation of local cell density.
Particle size distribution
Particle size distributions of biomass at different time points were determined
using a laser diffraction particle size analyzer SALD-2000J (Shimadzu, Kyoto, Japan).
Suspension from dispersed granules, biomass suspension in MBR were collected into
15 mL centrifuge tubes (Thermo Fisher Scientific, USA) and subjected to size
determination. At three times were measured for each sample.
Scanning electron microscope of immobilized gel beads and naturally
aggregated granules
Aggregated granules were prepared following the previous report (Van
Neerven et al., 1990). In brief, freshly prepared PVA-SA gel beads and granules were
washed three times for 10 min in the 0.025 M Na-cacodylate buffer (pH 6.8). A first
fixation was performed in the same buffer containing 2% (w/v) glutaraldehyde for 3 h.

enrichment, growth kinetics and ecophysiology of anammox bacteria
68
After washing three times for 10 min in the Na-cacodylate buffer, samples were placed
for a second fixation for 1.5 h in this buffer containing 1.0% OsO4. The beads were
washed again in the buffer three times for 10 min and stored in the same buffer
overnight prior to dehydration in a series of gradually increasing ethanol concentrations:
50, 60, 70, 80, 90 and two times 99.5%. Each step was allowed to equilibrate for 10 min;
for cutting the beads, they were transferred to a cold metal block that was kept cool in a
liquid N2 bath in such a way that the top of the block was in the vapor phase. The beads
were split in halves with a precooled razor blade and a hammer. Subsequently, the split
beads were quickly transferred again to 99.5% ethanol and subjected to critical point-
drying and coated with Au. The samples were observed with SEM (JEOL JSM-6301F,
Japan).
Day 15 samples were prepared following this second method because they became
fragile and very weak for the chemical fixation used in the first method (Van Neerven et
al., 1990). In brief, the beads were collected and briefly washed with demineralized
water. Excess water was carefully removed by blotting lightly with filter paper.
Subsequently, the gel beads were quickly plunged into liquid N2, split and freeze-dried
in a blazer apparatus equipped with the CRYO - SEM at -90 °C at 10-7 atm for 0.5 h.
These lyophilized samples were directly coated with Au. Observation was directly
executed using a CRYO - SEM (JEOL JSM-6701F, Japan).
Chemical analyses
The concentration of ammonium, nitrite and nitrate were measured with an ion-
exchange chromatography (IC-2010, TOSOH, Tokyo, Japan) equipped with an TSKgel
IC-Anion HS and TSKgel IC-Cation columns (TOSOH) after filtration with 0.2-μm-
pore size membranes (Advantec Co., Ltd., Tokyo, Japan) (Tsushima et al., 2007).
3.4 RESULTS
Overall experiment procedure
Fig. 1 illustrated the change in the form of biomass in this newly proposed
method. In detail, original biomass was collected from a granular up-flow column

Chapter 3: Rapid Cultivation of free-living Anammox Cells
69
reactor (A) and dispersed by vortexing in a 50mL centrifugation tube using a vortex
mixer (Vortex-Genie 2 Mixer, Scientific Industries, Inc., USA). (B). After standing still
for c.a. 1 min, the biomass suspension (indicated using an arrow) was removed and
immobilized using PVA-SA solution (C). The initial biomass concentration was 1 – 3 ×
108 copy numbers per gel bead. After 18 days of operation, the fully matured gel beads
were collected and dispersed by vortexing for 30s (Vortex-Genie 2 Mixer, Scientific
Industries, Inc., USA). (D). The debris of gel beads was removed by passing through a
sieve of 710 μm opening (SANPO, Tokyo) and sieved cell suspension was directly
inoculated into a MBR (E).
The MBR was operated at nitrogen loading rates (NLR) of 0.4 to 0.8 kg-N m-3 day-1,
and achieved >85% of nitrogen removal efficiencies right after start-up (Fig. 3). During
the operation of the MBR, remaining debris of the dispersed gel beads was further
eliminated by removing the biomass attached onto the membrane modules every day.
Finally, the free-living planktonic biomass was remained in the MBR after 18 days of
operation. FISH analysis revealed that >95% of total bacteria were “Ca. Brocadia sinica”
cells in the MBR biomass (Fig. 3). Growth of “Ca. B. sinica” was also confirmed by the
quantitative PCR analysis, which showed that an exponential growth (3.9 × 10⁹ to 1.2 ×
1010 copy numbers per mL) was observed as the nitrogen loading rate was increased
(Fig. 3). Phylogenetic analysis confirmed the dominance of “Ca. B. sinica” along with
the experiment (data not shown).
Particle-size distributions of the dispersed granules (the inoculum for gel
immobilization), biomass in the MBR on 0 day, and after 17 day of operation were
determined and compared, respectively (Fig. 2). The average particle size of the
dispersed granules was 184.7 μm, decreased to 69.0 μm after cultivation in the gel beads
for 18 days and further decreased to 1.1 μm after cultivation in the MBR for 17 days,
indicating that free-living planktonic anammox bacterial culture was achieved.

enrichment, growth kinetics and ecophysiology of anammox bacteria
70
Figure 3.1: Change in the form of biomass. (A) An original up-flow granular
column reactor: granules were collected from this reactor and dispersed. (B)
Dispersed granules: only the upper part (suspended biomass, indicated using
arrow) was used for PVA-SA gel immobilization. (C) A gel-immobilized column
reactor: anammox biomass was immobilized in PVA-SA gel beads and cultivated
in a column reactor for 18 days. (D) Gel beads after dispersion: the cultivated
mature gel beads were collected from the column reactor. (E) Start-up of MBR:
after physical dispersion of matured gel beads, the debris of gel matrix was
removed by passing through a sieve of 710 μm opening (SANPO, Tokyo). The
sieved biomass suspension was inoculated to MBR.
0
15
30
45
300 162 87 47 25 14 7 4 2 1
Fre
quency [
%]
Aggregates diameter [μm]
Dispersed granules as inoculum
Day 0 in MBR
Day 17 in MBR

Chapter 3: Rapid Cultivation of free-living Anammox Cells
71
Figure 3.2: Size distribution of biomass particles indicated as frequency ([%],
number of particles of total number of particles measured). The bars showed the
particle distribution of dispersed granules (purple), day 0 (orange) and day 17 in
MBR (blue). (For colored figure, the reader is referred to the web version of this
article)
Growth pattern of “Ca. B. sinca” cells in gel beads
A key step of the rapid cultivation of free-living planktonic cells was
cultivation in gel beads. The growth pattern of immobilized “Ca. B. sinica” cells in gel
beads was, therefore, investigated in detail to understand the mechanism of easily
dispersible biomass formation. “Ca. B. sinica” cells growing in the gel beads were
visualized by FISH and compared with ones in naturally aggregated granules. (Fig. 4A
and 4B). “Ca. B. sinica” cells proliferated as micro-colonies in the gel beads. The
micro-colonies became denser as they grew from day 10 to day 18, but were clearly
looser than the naturally aggregated granules (Fig. 4A and 4B). The local cell densities
of micro-colonies in the gel beads increased from 334.2 ± 65.7 cells per 500 ×500
pixels at day 10 to 527.6 ± 135.9 at day18, accordingly the16S rRNA gene copy
numbers increase from 2.1×10⁹ at day 10 to 2.9×10⁹ copy numbers per gel bead at 18
day. However, these local cell densities in the gel beads were significantly lower than
that of the granules (p < 0.01, student t-test) (Fig. 4). The local cell density could not be
measured for the gel beads on day 0 because it was too low.
In addition, the morphology of the micro-colony of “Ca. B. sinica” cells grown in the
gel bead was analyzed using SEM and compared with that of naturally aggregated
granules. In the 15-day-old gel bead, “Ca. B. sinica” cells were loosely aggregated with
very less extracellular polymeric substance (EPS) - like matrix, whereas cells were
densely packed and embedded in the EPS matrix (Fig. 5D, 5E and 5F).

enrichment, growth kinetics and ecophysiology of anammox bacteria
72
Figure 3.3: Performance of the MBR after inoculation and planktonic free-living
biomass after 17 days of cultivation. In situ hybridization was performed with
tetramethylrhodamine-5-isothiocyanate (TRITC) labeled AMX820 probe (red) for “Ca.
B. sinica” and fluoresceine isothiocyanate (FITC) labeled EUB probes (green) for most
of the bacteria. Bar indicates 20 μm.
NLR
&N
RR
[K
g-N
m-3
day
-1]
16S
rR
NA
gene c
opy n
um
bers
[copie
s m
L-1
]
0.00
0.25
0.50
0.75
1.00
0 5 10 15 20 25 30 35
Nitrogen loading rate (NLR)
Nitrogen removal rate (NRR)
16S rRNA gene copy numbers
Days of operation
1011
1010
109
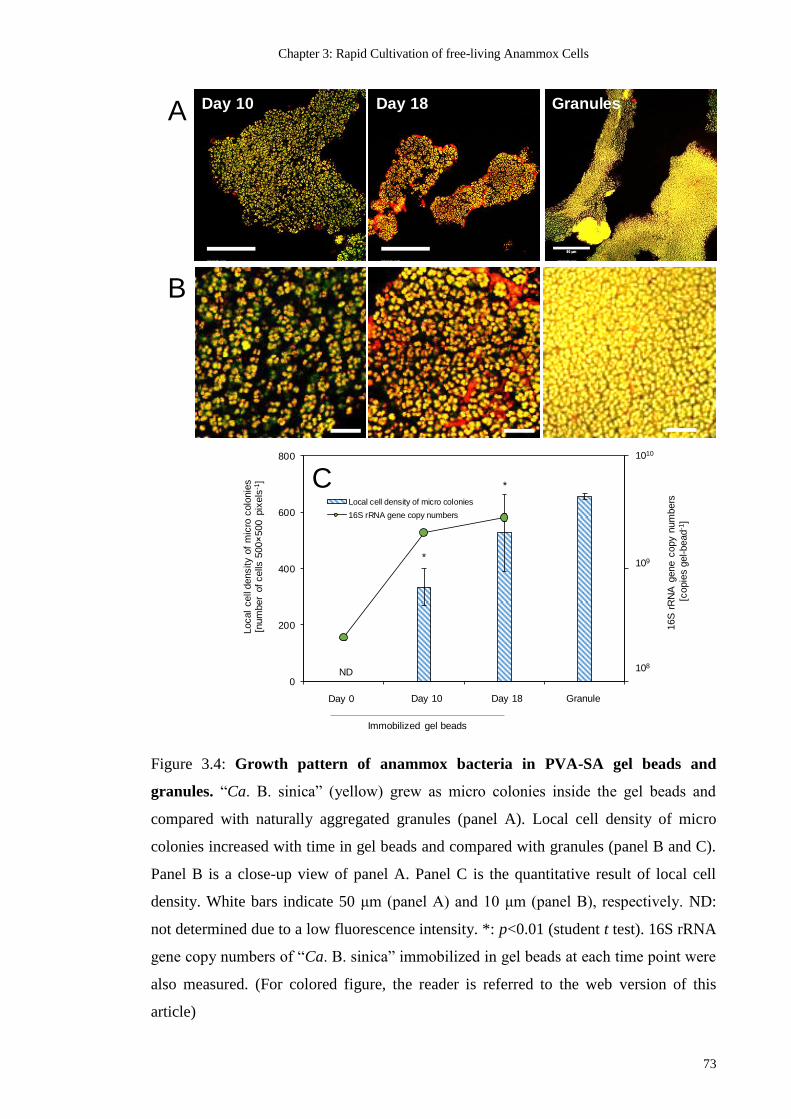
Chapter 3: Rapid Cultivation of free-living Anammox Cells
73
Figure 3.4: Growth pattern of anammox bacteria in PVA-SA gel beads and
granules. “Ca. B. sinica” (yellow) grew as micro colonies inside the gel beads and
compared with naturally aggregated granules (panel A). Local cell density of micro
colonies increased with time in gel beads and compared with granules (panel B and C).
Panel B is a close-up view of panel A. Panel C is the quantitative result of local cell
density. White bars indicate 50 μm (panel A) and 10 μm (panel B), respectively. ND:
not determined due to a low fluorescence intensity. *: p<0.01 (student t test). 16S rRNA
gene copy numbers of “Ca. B. sinica” immobilized in gel beads at each time point were
also measured. (For colored figure, the reader is referred to the web version of this
article)
0
200
400
600
800
Local
cell
density o
f m
icro
colo
nie
s[n
um
ber
of cells
500
500 p
ixels
-1]
Day 0
Local cell density of micro colonies
16S rRNA gene copy numbers
1010
109
108
*
*
16S
rR
NA
gene c
opy n
um
bers
[copie
s g
el-bead
-1]
Day 10 Day 18 GranulesA
B
C
Day 10 Day 18
ND
Granule
Immobilized gel beads

enrichment, growth kinetics and ecophysiology of anammox bacteria
74
Figure 3.5: SEM images of anammox cells grown in PVA-SA gel beads at day 0&15
and a naturally aggregated granule. (A) Overview of the surface part of gel bead at
day 15 (bar 1 mm). (B) A close-up view of the cell cluster on day 15 gel bead (bar 20
μm). (C) Enlarged anammox cell at day 15 (bar 4 μm). (D) Section view of the naturally
aggregated granule (bar 0.6 mm). (E) A close-up view of the cell cluster in granule (bar
16 μm). (F) Enlarged anammox cell cluster in granule (bar 3 μm).
3.5 DISCUSSION
In general, anammox bacteria have strong self-aggregation ability, which is one
of factors hampering advancement of physiological and biochemical studies of
anammox bacteria. In this study, highly active and enriched anammox planktonic cell
culture (> 95% and an average particle size of 1.1 μm) was successfully obtained within
only one month period, which was much shorter than the previous studies where mostly
at least 6 months were required (Ali et al., 2015a; Lotti et al., 2014; Oshiki et al., 2013;
van der Star et al., 2008). In addition to the rapid cultivation, this proposed method
required a relatively small amount of initial biomass that was immobilized in the gel
beads (1 - 3×10⁸ 16S rRNA gene copy numbers per gel bead). The key step of this
successful cultivation and its novelty compared with our previous work (Oshiki et al.,
2013) was obviously a pre-culture in PVA-SA gel beads prior to MBR cultivation,
which generates easily dispersible micro-colonies. Super high growth rates and activity
of anammox cells have been observed when immobilized in PVA-SA gel beads (Ali et
al., 2015b; Zhang et al., 2017). However, the growth pattern of anammox bacterial cells
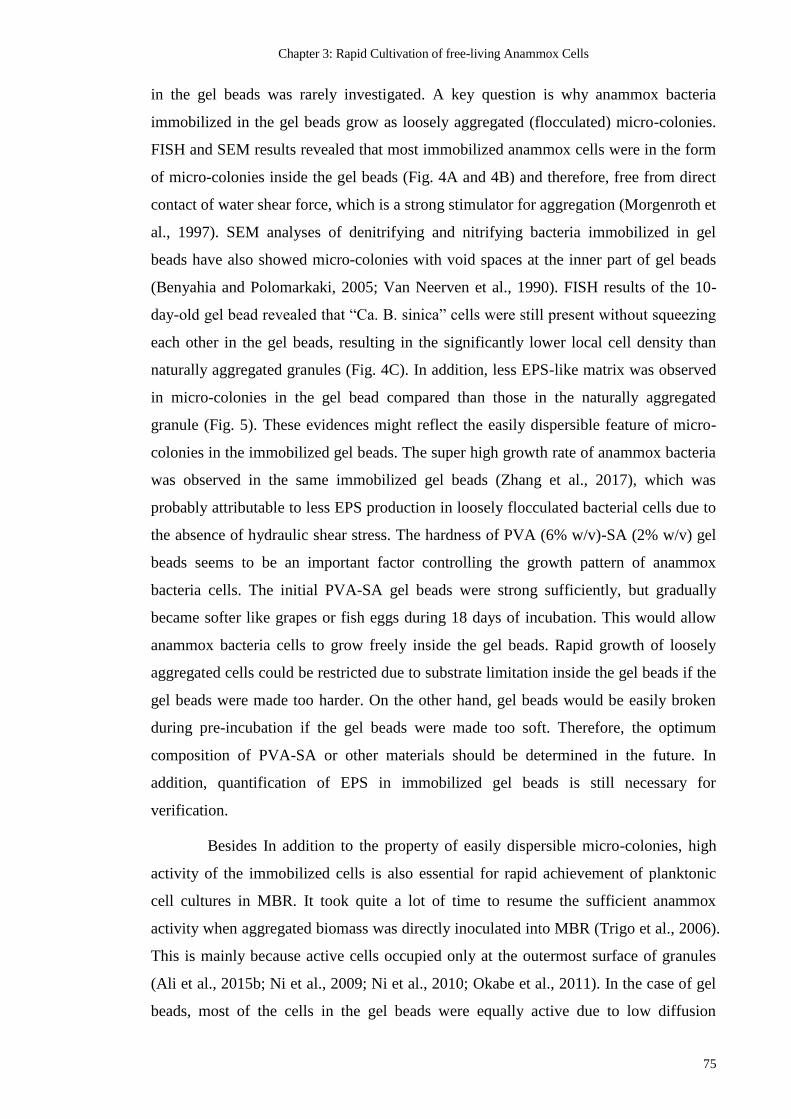
Chapter 3: Rapid Cultivation of free-living Anammox Cells
75
in the gel beads was rarely investigated. A key question is why anammox bacteria
immobilized in the gel beads grow as loosely aggregated (flocculated) micro-colonies.
FISH and SEM results revealed that most immobilized anammox cells were in the form
of micro-colonies inside the gel beads (Fig. 4A and 4B) and therefore, free from direct
contact of water shear force, which is a strong stimulator for aggregation (Morgenroth et
al., 1997). SEM analyses of denitrifying and nitrifying bacteria immobilized in gel
beads have also showed micro-colonies with void spaces at the inner part of gel beads
(Benyahia and Polomarkaki, 2005; Van Neerven et al., 1990). FISH results of the 10-
day-old gel bead revealed that “Ca. B. sinica” cells were still present without squeezing
each other in the gel beads, resulting in the significantly lower local cell density than
naturally aggregated granules (Fig. 4C). In addition, less EPS-like matrix was observed
in micro-colonies in the gel bead compared than those in the naturally aggregated
granule (Fig. 5). These evidences might reflect the easily dispersible feature of micro-
colonies in the immobilized gel beads. The super high growth rate of anammox bacteria
was observed in the same immobilized gel beads (Zhang et al., 2017), which was
probably attributable to less EPS production in loosely flocculated bacterial cells due to
the absence of hydraulic shear stress. The hardness of PVA (6% w/v)-SA (2% w/v) gel
beads seems to be an important factor controlling the growth pattern of anammox
bacteria cells. The initial PVA-SA gel beads were strong sufficiently, but gradually
became softer like grapes or fish eggs during 18 days of incubation. This would allow
anammox bacteria cells to grow freely inside the gel beads. Rapid growth of loosely
aggregated cells could be restricted due to substrate limitation inside the gel beads if the
gel beads were made too harder. On the other hand, gel beads would be easily broken
during pre-incubation if the gel beads were made too soft. Therefore, the optimum
composition of PVA-SA or other materials should be determined in the future. In
addition, quantification of EPS in immobilized gel beads is still necessary for
verification.
Besides In addition to the property of easily dispersible micro-colonies, high
activity of the immobilized cells is also essential for rapid achievement of planktonic
cell cultures in MBR. It took quite a lot of time to resume the sufficient anammox
activity when aggregated biomass was directly inoculated into MBR (Trigo et al., 2006).
This is mainly because active cells occupied only at the outermost surface of granules
(Ali et al., 2015b; Ni et al., 2009; Ni et al., 2010; Okabe et al., 2011). In the case of gel
beads, most of the cells in the gel beads were equally active due to low diffusion
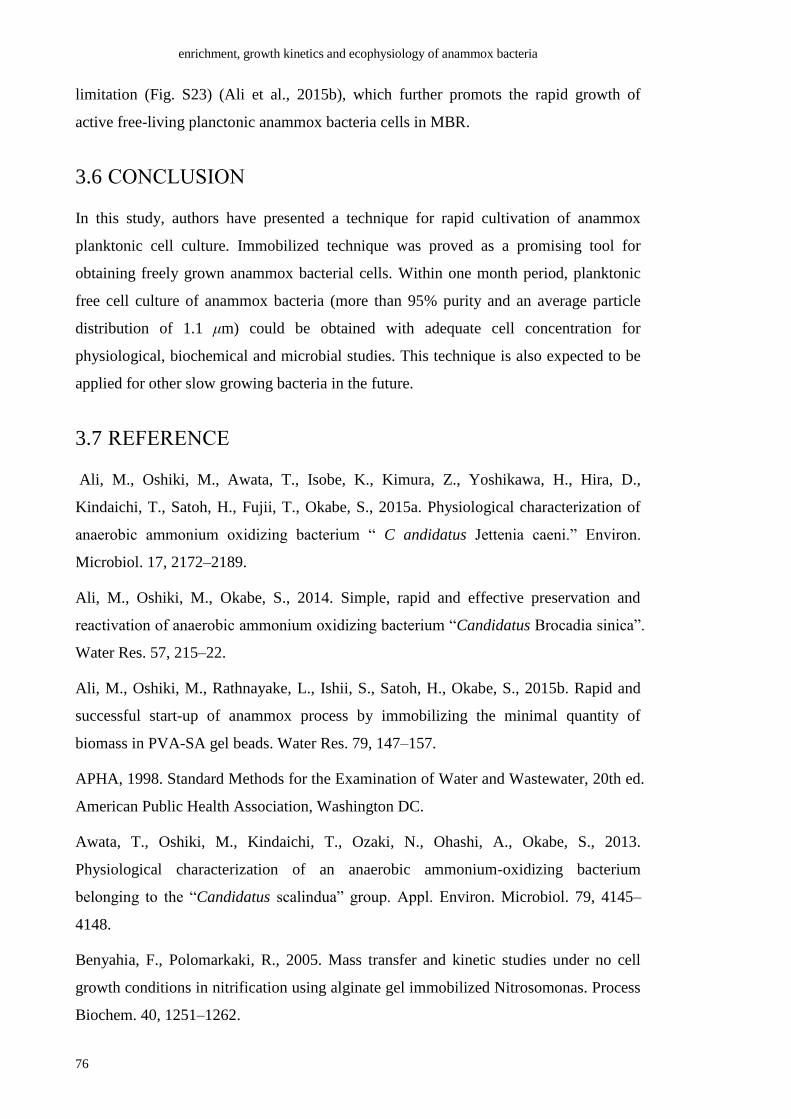
enrichment, growth kinetics and ecophysiology of anammox bacteria
76
limitation (Fig. S23) (Ali et al., 2015b), which further promots the rapid growth of
active free-living planctonic anammox bacteria cells in MBR.
3.6 CONCLUSION
In this study, authors have presented a technique for rapid cultivation of anammox
planktonic cell culture. Immobilized technique was proved as a promising tool for
obtaining freely grown anammox bacterial cells. Within one month period, planktonic
free cell culture of anammox bacteria (more than 95% purity and an average particle
distribution of 1.1 μm) could be obtained with adequate cell concentration for
physiological, biochemical and microbial studies. This technique is also expected to be
applied for other slow growing bacteria in the future.
3.7 REFERENCE
Ali, M., Oshiki, M., Awata, T., Isobe, K., Kimura, Z., Yoshikawa, H., Hira, D.,
Kindaichi, T., Satoh, H., Fujii, T., Okabe, S., 2015a. Physiological characterization of
anaerobic ammonium oxidizing bacterium “ C andidatus Jettenia caeni.” Environ.
Microbiol. 17, 2172–2189.
Ali, M., Oshiki, M., Okabe, S., 2014. Simple, rapid and effective preservation and
reactivation of anaerobic ammonium oxidizing bacterium “Candidatus Brocadia sinica”.
Water Res. 57, 215–22.
Ali, M., Oshiki, M., Rathnayake, L., Ishii, S., Satoh, H., Okabe, S., 2015b. Rapid and
successful start-up of anammox process by immobilizing the minimal quantity of
biomass in PVA-SA gel beads. Water Res. 79, 147–157.
APHA, 1998. Standard Methods for the Examination of Water and Wastewater, 20th ed.
American Public Health Association, Washington DC.
Awata, T., Oshiki, M., Kindaichi, T., Ozaki, N., Ohashi, A., Okabe, S., 2013.
Physiological characterization of an anaerobic ammonium-oxidizing bacterium
belonging to the “Candidatus scalindua” group. Appl. Environ. Microbiol. 79, 4145–
4148.
Benyahia, F., Polomarkaki, R., 2005. Mass transfer and kinetic studies under no cell
growth conditions in nitrification using alginate gel immobilized Nitrosomonas. Process
Biochem. 40, 1251–1262.

Chapter 3: Rapid Cultivation of free-living Anammox Cells
77
Isaka, K., Date, Y., Kimura, Y., Sumino, T., Tsuneda, S., 2008. Nitrogen removal
performance using anaerobic ammonium oxidation at low temperatures. FEMS
Microbiol. Lett. 282, 32–8.
Isaka, K., Kimura, Y., Yamamoto, T., Osaka, T., Tsuneda, S., 2013. Complete
autotrophic denitrification in a single reactor using nitritation and anammox gel carriers.
Bioresour. Technol. 147, 96–101.
Isaka, K., Sumino, T., Tsuneda, S., 2007. High nitrogen removal performance at
moderately low temperature utilizing anaerobic ammonium oxidation reactions. J.
Biosci. Bioeng. 103, 486–90.
Lotti, T., Kleerebezem, R., Lubello, C., van Loosdrecht, M.C.M., 2014. Physiological
and kinetic characterization of a suspended cell anammox culture. Water Res. 60, 1–14.
Morgenroth, E., Sherden, T., Van Loosdrecht, M.C.M., Heijnen, J.J., Wilderer, P.A.,
1997. Aerobic granular sludge in a sequencing batch reactor. Water Res. 31, 3191–3194.
Ni, B.-J., Hu, B.-L., Fang, F., Xie, W.-M., Kartal, B., Liu, X.-W., Sheng, G.-P., Jetten,
M., Zheng, P., Yu, H.-Q., 2010. Microbial and physicochemical characteristics of
compact anaerobic ammonium-oxidizing granules in an upflow anaerobic sludge
blanket reactor. Appl. Environ. Microbiol. 76, 2652–2656.
Ni, B.-J., Xie, W.-M., Liu, S.-G., Yu, H.-Q., Wang, Y.-Z., Wang, G., Dai, X.-L., 2009.
Granulation of activated sludge in a pilot-scale sequencing batch reactor for the
treatment of low-strength municipal wastewater. Water Res. 43, 751–761.
Okabe, S., Satoh, H., Watanabe, Y., 1999. In situ analysis of nitrifying biofilms as
determined by in situ hybridization and the use of microelectrodes. Appl. Environ.
Microbiol. 65, 3182–3191.
Oshiki, M., Awata, T., Kindaichi, T., Satoh, H., Okabe, S., 2013. Cultivation of
planktonic anaerobic ammonium oxidation (anammox) bacteria using membrane
bioreactor. Microbes Environ. 28, 436–443.
Oshiki, M., Shimokawa, M., Fujii, N., Satoh, H., Okabe, S., 2011. Physiological
characteristics of the anaerobic ammonium-oxidizing bacterium “Candidatus Brocadia
sinica.” Microbiology 157, 1706–1713.
Oshiki, M., Shinyako-Hata, K., Satoh, H., Okabe, S., 2015. Draft Genome Sequence of
an Anaerobic Ammonium-Oxidizing Bacterium,“Candidatus Brocadia sinica.” Genome
Announc. 3, 3–4.

enrichment, growth kinetics and ecophysiology of anammox bacteria
78
Strous, M., Kuenen, J.G., Jetten, M.S., 1999. Key physiology of anaerobic ammonium
oxidation. Appl. Environ. Microbiol. 65, 3248–3250.
Trigo, C., Campos, J.L., Garrido, J.M., Méndez, R., 2006. Start-up of the Anammox
process in a membrane bioreactor. J. Biotechnol. 126, 475–487.
Tsushima, I., Ogasawara, Y., Kindaichi, T., Satoh, H., Okabe, S., 2007. Development of
high-rate anaerobic ammonium-oxidizing (anammox) biofilm reactors. Water Res. 41,
1623–1634.
van de Graaf, A.A., de Bruijn, P., Robertson, L.A., Jetten, M.S.M., Kuenen, J.G., 1996.
Autotrophic growth of anaerobic ammonium-oxidizing micro-organisms in a fluidized
bed reactor. Microbiology 142, 2187–2196.
van der Star, W.R.L., Miclea, A.I., van Dongen, U.G.J.M., Muyzer, G., Picioreanu, C.,
van Loosdrecht, M.C.M., 2008. The membrane bioreactor: a novel tool to grow
anammox bacteria as free cells. Biotechnol. Bioeng. 101, 286–294.
Van Neerven, A.R.W., Wijffels, R., Zehnder, A.J.B., 1990. Scanning electron
microscopy of immobilized bacteria in gel beads: a comparative study of fixation
methods. J. Microbiol. Methods 11, 157–168.
Zhang, L., Narita, Y., Gao, L., Ali, M., Oshiki, M., Okabe, S., 2017. Maximum specific
growth rate of anammox bacteria revisited. Water Res. 116, 296–303.

Chapter 4: maximum specific growth rate of anammox bacteria revisited
79
4 MAXIMUM SPECIFIC
GROWTH RATE OF
ANAMMOX BACTERIA
REVISITED
This chapter has been published as:
Zhang, L., Narita, Y., Gao, L., Ali, M., Oshiki, M., Okabe, S., 2017. Maximum specific
growth rate of anammox bacteria revisited. Water Res. 116, 296–303.

enrichment, growth kinetics and ecophysiology of anammox bacteria
80
4.1 ABSTRACT
Anammox bacteria have long been considered to be slow-growing bacteria. However, it
has recently been reported that they could grow much faster than previously thought
when they were cultivated in a membrane bioreactor (MBR) with a step-wise decrease
in the solid retention time (SRT). Here, we reevaluated the maximum specific growth
rates (μmax) of three phylogenetically distant anammox bacterial species (i.e. “Ca.
Brocadia sinica”, “Ca. Jettenia caeni” and “Ca. Scalindua sp.”) by directly measuring
16S rRNA gene copy numbers using newly developed quantitative polymerase chain
reaction (qPCR) assays. When free-living planktonic “Ca. B. sinica” and “Ca. J. caeni”
cells were immobilized in polyvinyl alcohol (PVA) and sodium alginate (SA) gel beads
and cultivated in an up-flow column reactor with high substrate loading rates at 37 ºC,
the μmax were determined to be 0.33 ± 0.02 d-1 and 0.18 d-1 (corresponding doubling time
of 2.1 day and 3.9 day) from the exponential increases in 16S rRNA genes copy
numbers, respectively. These values were faster than the fastest growth rates reported
for these species so far. The cultivation of anammox bacteria in gel beads was achieved
less than one month without special cultivation method and selection pressure, and the
exponential increase in 16S rRNA gene numbers was directly measured by qPCR with
high reproducibility; therefore, the resulting μmax values were considered accurate.
Taken together, the fast growth is, therefore, considered to be an intrinsic kinetic
property of anammox bacteria.
4.2 INTRODUCTION
Anaerobic ammonium oxidation (anammox) has received a great attention as a
promising environmentally friendly and energy efficient wastewater treatment process
(Ali and Okabe, 2015). There are more than 100 full-scale anammox installations
worldwide, and this number is growing rapidly (Lackner et al., 2014). Kinetics and
stoichiometry are the two essential factors for the design and optimization of anammox-
based wastewater treatment process (Lotti et al., 2014; van der Star et al., 2007). The
relatively consistent stoichiometry of anammox metabolism has been reported from
highly enriched anammox cultures regardless of biomass forms such as aggregated cells
(Strous et al., 1998) or suspended (planktonic) cells (Lotti et al., 2014). However,
kinetic parameters such as specific growth rate (μ) of anammox bacteria are still
debatable issues due to experimental difficulties and a lack of planktonic enrichment

Chapter 4: maximum specific growth rate of anammox bacteria revisited
81
cell cultures with high purity (Strous et al., 1999; van der Star et al., 2008). Although
anammox bacteria have long been regarded as slow-growing anaerobic
chemolithoautotrophs (Strous et al., 1999), surprisingly a high maximum specific
growth rate (μmax = 0.33 d-1 at 30 ºC) was recently reported (Lotti et al., 2015). Lotti et
al. (2015) suggested that the μmax was not an intrinsic property and could be increased
by optimizing the growth conditions (through increasing the biomass specific electron
transfer capacity).
The μmax of anammox bacteria was mainly determined in following two ways (Lotti et
al., 2015; Oshiki et al., 2011);
(1) μmax = qmax × Y (Eq. 1)
(2) μmax = 1 / SRT (Eq. 2)
where, qmax is maximum specific substrate uptake rate (g-NH4+-N g-VSS-1 d-1), Y is the
biomass growth yield (g-VSS g-NH4+-N-1), and SRT is the solid retention time (d). The
qmax can be calculated by dividing the maximum volumetric substrate removal rate (g-
NH4+-N m-3 d-1) by total biomass concentration in a reactor (g-VSS m-3). For accurate
determination of qmax, the reactor must be operated without any substrate limitation,
which leads to underestimation of qmax, consequently μmax. In some studies, however,
aggregated biomass (granules, biofilms, or flocs) were used, which are more prone to
confront substrate diffusion limitations (Okabe et al., 2011; Oshiki et al., 2011; Strous et
al., 1998; Tsushima et al., 2007a; van de Graaf et al., 1996). Thus, kinetic parameters
such as μmax and Ks determined using aggregated biomass must be carefully reevaluated.
The reported Y values were rather constant regardless of anammox species except for
“Ca. Scalindua sp.” (Oshiki et al., 2016).
Membrane bioreactors (MBRs) were recently used to determine the μmax, because the
MBR enables cultivation of free-living planktonic anammox bacterial cells (Ali et al.,
2015a; Awata et al., 2013a; Lotti et al., 2014; Lotti et al., 2015; van der Star et al.,
2008). In these studies, the SRT was step-wisely decreased close to the critical dilution
rate (i.e., maximum specific growth rate) by increasing the mixed liquor discharge rate,
and thus the μmax was estimated as an inverse of the SRT according to the model (Eq. 2).
Although this approach enables to minimizing the effects of substrate limitation,
maintenance, and decay, wall growth and biomass accumulation in hollow fiber
membrane modules most likely occur in a long-term operation, which significantly
overestimate the qmax and μmax. Furthermore, the above mentioned μmax determination

enrichment, growth kinetics and ecophysiology of anammox bacteria
82
methods (Eq. 1 and 2) in general require relatively long experimental periods (a few
months to a year) (Lotti et al., 2014; Lotti et al., 2015; van der Star et al., 2008). Hence,
for better understanding of kinetic properties of anammox bacteria, it is necessary to
revisit and reevaluate the μmax values with a direct and rapid determination method with
better accuracy.
In the present study, the μmax of three phylogenetically distant anammox species (i.e.
“Ca. Brocadia sinica”, “Ca. Jettenia caeni” and “Ca. Scalindua sp.”) were determined
by directly measuring temporal increases in 16S rRNA gene copy numbers. The qPCR-
based quantification assay of 16S rRNA gene copy number has been previously used to
estimate μmax of anammox bacteria (Tsushima et al., 2007; van der Star et al., 2007).
First, the genera specific quantitative polymerase chain reaction (qPCR) assays were
newly developed for quantification of each 16S rRNA gene copy numbers. According
to the Monod equation, it is essential to cultivate the anammox biomass without any
substrate limitation and inhibition to obtain the exponential growth, namely μmax.
Second, free-living planktonic cells were cultured in MBRs as a semi-batch mode with
complete biomass retention and continuous substrate supply. Finally, planktonic cells
were immobilized in polyvinyl alcohol and sodium alginate (PVA-SA) gel beads and
cultured in up-flow column reactors with high substrate loading rates to avoid substrate
limitation. The μmax was then calculated from exponential increases in 16S rRNA gene
copy numbers, and the highest μmax was observed for immobilized anammox cells.
4.3 MATERIALS AND METHODS
Development of qPCR assays
Three TaqMan qPCR assays were developed to quantify the 16S rRNA genes copy
numbers of “Ca. Brocadia sinica”, “Ca. Jettenia caeni” and “Ca. Scalindua sp.”,
respectively. The primers and probes were designed using the Primer Express software
ver. 2.0 (Applied Biosystems) (Table 1). The specificity of the primers was verified
through Ribosome Database Project Seqmatch program
(https://rdp.cme.msu.edu/seqmatch/ seqmatch_intro.jsp) (Cole et al., 2014). In addition,
the specificity of the assays was experimentally verified using plasmids (106 copies μL-1)
containing the partial 16S rRNA genes of three species.

Chapter 4: maximum specific growth rate of anammox bacteria revisited
83
The qPCR mixture (20 μL) contained 10 μL of 2× Premix ExTaq (Takara Bio), 0.4 μL
of each forward and reverse primers (10 μM), 0.8 μL of TaqMan probe (10 μM), 0.4 μL
of the 50× ROX Reference Dye II (Takara Bio), and 2 μL of template DNA. The qPCR
was performed in MicroAmp Optical 96-well reaction plates (Applied Biosystems) with
an ABI prism 7500 sequence detection system (Applied Biosystems) in the following
reaction conditions: initial annealing at 95°C for 30 sec, followed by 40 cycles at 95°C
for 5 sec, and primer extension at 60°C for 34 sec. Serial dilutions (103 to 107 copies μL-
1) of the plasmid DNA containing the target 16S rRNA gene were prepared for the
quantification standard. The amplification efficiencies were calculated as described
previously (Ishii et al., 2013).
Determination of maximum specific growth rate in MBR
Three membrane bioreactors (MBRs) were operated to determine the maximum specific
growth rates of “Ca. B. sinica”, “Ca. J. caeni” and “Ca. Scalindua sp.”, respectively
(Oshiki et al., 2013). Each anammox biomass with a purity of > 90%, which was
previously enriched in our laboratory (Ali et al., 2015a; Awata et al., 2013; Oshiki et al.,
2013), was used as an inoculum. Anammox cultures consisted of completely free-living
planktonic cells as indicated by fluorescence in situ hybridization (FISH) (Fig. 1). A
membrane module composed of 300 polyethylene hollow fiber membranes (pore size,
0.1 μm; tube diameter, 1 mm; length, 70 mm, Mitsubishi Rayon, Japan) was installed on
a wide mouth reagent bottle (2-liter, Sansyo, Japan). A peristaltic pump (MP–1000,
EYELA, Tokyo, Japan), actuated by a water level sensor (HL–S1A, ASONE, Japan),
was directly connected to the membrane module to keep a constant water level in the
MBR. The MBR culture was continuously agitated at 200 rpm using a magnetic stirrer.
A mixed Ar and CO2 (95:5) gas was continuously supplied to the cell culture at 10 mL
min-1 to avoid oxygen contamination. pH was not controlled but ranged between 7.0 -
8.0. In the case of “Ca. B. sinica” and “Ca. J. caeni”, the constitution of trace elements
in the influent medium was (mg L-1): FeSO4·7H2O 9.0, EDTA·2Na 5.0, NaCl 1.0, KCl
1.4, CaCl2·2H2O 1.4, MgSO4·7H2O 1.0, NaHCO3 84, KH2PO4 54 and 0.5 mL L-1 trace
elements solution II (van de Graaf et al., 1996). In the case of “Ca. Scalindua sp.”, the
inorganic nutrient medium was supplied with 25 g L-1 of SEALIFE (Marine Tech,
Tokyo, Japan), an artificial sea salt, CaCl2·2H2O (114 mg L-1), MgSO4·7H2O (99 mg L-
1), KHCO3 (500 mg L-1), KH2PO4 (24.4 mg L-1), 0.5 mL L-1 trace element solution I &
II (van de Graaf et al., 1996). The detailed information of the artificial mineral medium

enrichment, growth kinetics and ecophysiology of anammox bacteria
84
of SEALIFE was described in the previous work (Kindaichi et al., 2011; Oshiki et al.,
2013). In all experiments, nitrite concentration was set as a limiting substrate.
The concentrations of ammonium, nitrite and nitrate were determined using an ion-
exchange chromatography (IC-2010, TOSOH, Tokyo, Japan) equipped with an TSKgel
IC-Anion HS and TSKgel IC-Cation columns (TOSOH) after filtration with 0.2-μm-
pore size membranes (Advantec Co., Ltd., Tokyo, Japan) (Tsushima et al., 2007b).
Nitrite concentration in MBR was also regularly monitored by colorimetric method
according to standard methods (APHA, 1998). Water quality of “Ca. Scalindua sp.”
culture was measured only using colorimetric method according to standard methods
(APHA, 1998) due to the high ionic strength of the medium.
To obtain an exponential growth of anammox bacteria, planktonic biomass was
inoculated at time zero and the culture medium was continuously supplied into the
MBR. The initial biomass concentration of “Ca. B. sinica”, “Ca. Scalindua sp.” and “Ca.
J. caeni” was 3.7×10⁹, 1.2×10¹⁰, and 8.2×10⁸ 16S rRNA gene copies mL-1, respectively.
The exponential growth can be observed when substrate and nutrients are present in
excess. As growth proceeds, more substrates are consumed and required. Thus, the
substrate (ammonium and nitrite) loading rate must be gradually increased with time to
avoid substrate limitation. In this study, the substrate loading rate was adjusted by
substrate concentrations and feeding rate. It should be noted that since anammox
activity could be inhibited by high nitrite concentration (Carvajal-Arroyo et al., 2013;
Lotti et al., 2012; Oshiki et al., 2016), the nitrite concentration must be carefully
maintained in an appropriate range during the entire experiment. Solid retention time
(SRT) of MBR was not controlled (at infinity) in all experiments.
Determination of maximum specific growth rate in immobilized gel
beads
Free-living planktonic cells of “Ca. B. sinica” and “Ca. J. caeni” MBR cultures
were immobilized in PVA (6%, w/v) and SA (2%, w/v) gel as described previously (Ali
et al., 2014). After the gel beads were cured in the CaCl2 solution overnight and washed
with sterilized distilled water at least three times, the gel beads were inoculated into an
up-flow column reactor (255 mL, Fujirika, Japan) with a packing ratio of 70% (v/v).
The up-flow column reactor was operated at 37 °C, pH 7.5±0.5 and HRT 2.1 h as
described previously (Ali et al., 2014). As anammox bacteria grew in the gel beads, the

Chapter 4: maximum specific growth rate of anammox bacteria revisited
85
substrate loading rate was gradually increased to avoid substrate limitation. The gel
bead samples were always collected from the bottom of the reactor where the higher
substrate concentrations were expected, and 16S rRNA gene copy number per gel bead
was measured by qPCR as described below. In addition, the concentrations of NH4+-N,
NO2- -N and NO3
- -N in influent and effluent were measured on daily basis.
Immobilization of “Ca. Scalindua sp.” was not successful due to high ionic strength of
the medium containing SEALIFE.
qPCR analysis
Maximum specific growth rates of “Ca. B. sinica”, “Ca. J. caeni” and “Ca.
Scalindua sp.” were determined from the exponential increase phases of 16S rRNA
gene copy numbers. Culture suspensions in MBRs and gel beads in the column reactors
were collected, and genomic DNAs were extracted using Fast DNA spin kit for soil
(MP Biomedical, Tokyo, Japan) by following manufacturer’s manual. The extracted
DNAs were subjected to quantitative PCR analysis. Premix Ex Taq (Probe qPCR)
(Takara Bio Inc., Japan) was used for the PCR, and the PCR mixture was prepared as
described in the manufacturer’s manual. “Ca. B. sinica”, “Ca. J. caeni” and “Ca.
Scalindua sp.” possesses one (Oshiki et al., 2015), two (Hira et al., 2012), and one
(Oshiki et al., unpublished) rrn operon in their genomes, respectively.
EPS production of “Ca. B. sinica”
Production of extracellular polymeric substances (EPS) is a diversion of
substrate (or energy) away from cellular growth, thereby might affect the specific
growth rate. The EPS production of “Ca. B. sinica” was quantified during growth
experiment in the MBR. As described above, a MBR was established and operated, and
16S rRNA gene copy numbers and extracellular protein and polysaccharide contents per
cell were determined according to previous description with little modification (Tan et
al., 2014). In briefly, 15 mL biomass were collected and centrifuged at 8,000 g for 10
min at 4°C. The pellets were subjected to freeze-drying for 24 h. After the dried
biomass pellet was weighted and recorded, the biomass was resuspended in 1 mL of 0.9%
NaCl (w/v) solution with 0.6% formaldehyde (v/v) for 1 h at 4°C, and then 400 μL of 1
M NaOH was added to the biomass suspension and incubated for 3 h at 4°C. Thereafter,
EPS was collected at 17,000 g for 15 min at 4°C as the supernatant. The protein
concentration was quantified by the Lowry method with bovine serum albumin as the

enrichment, growth kinetics and ecophysiology of anammox bacteria
86
standard (Lowry et al., 1951). The polysaccharide concentration was measured using the
phenol-sulfuric acid assay with glucose as the standard (DuBois et al., 1956).
EPS characterization using Fourier transform spectroscopy (FTIR)
Fourier transform spectroscopy (FTIR) was employed to analyze chemical and
structural characteristics of EPS produced during different growth phases. Samples were
prepared according to the manufacturer’s protocol. FTIR spectra were collected using a
FT/IR 660 plus spectrometer (JASCO, Japan). The operating range was from 4000 to
600 cm-1 with a resolution of 10 cm-1. Based on the FTIR spectra, a principal
component analysis (PCA) was performed with R 3.0.2 (R Development Core Team;
Vienna, Austria) to illustrate the difference of EPS characteristics during the growth
phases (Lammers et al., 2009).
4.4 RESULTS
Development of qPCR assay
Three TaqMan qPCR assays were newly developed for the quantification of
“Ca. B. sinica”, “Ca. J. caeni” and “Ca. Scalindua sp.”. The assays could specifically
quantify target 16S rRNA genes as low as 103 copies μL-1 (Fig. 2). The standard curves
for the three assays had the goodness-of-fit (r2) values of >0.99 (Fig. 2) with the
amplification efficiencies ranging between 97-109%. These results indicated high
specificity and sensitivity of the qPCR assays.
Anammox bacterial growth in MBR
Free-living planktonic cells of “Ca. B. sinica”, “Ca. J. caeni” and “Ca. Scalindua sp.”
were cultivated in the MBRs to determine the maximum specific growth rate (μmax). In
order to obtain exponential growth (namely, μmax), the nitrogen loading rate was
carefully increased step-wisely to avoid substrate limitation as well as nitrite inhibition
(Fig. 3).
In the MBR culture of “Ca. B. sinca”, the bulk nitrite concentration was in the range 0 –
3.3 (average 0.38) mg-N L-1 (Fig. 3, A1). The 16S rRNA gene copy numbers increased
from 3.7×10⁹ to 2.9×10¹⁰, in which the exponential increase was observed from day 8 to

Chapter 4: maximum specific growth rate of anammox bacteria revisited
87
day 19 (Fig. 3, A2). Accordingly, the μmax and corresponding doubling time were
calculated to be 0.17 d-1 and 4.1 d, respectively.
In the MBR culture of “Ca. J. caeni”, the bulk nitrite concentrations fluctuated more
widely from 0 – 5.1 (average 0.73) mg-N L-1 (Fig. 3, B1). Exponential increase of the
16S rRNA gene copy numbers was found rather late during day 33 to day 48 probably
due to low initial biomass concentration and low nitrogen loading rate (Fig. 3, B2). The
μmax and corresponding doubling time were calculated to be 0.11 d-1 and 6.3 d,
respectively.
In the MBR culture of “Ca. Scalindua sp.”, the bulk nitrite concentration was in the
range 0 – 1.8 (average 0.68) mg-N L-1 (Fig. 3, C1). Exponential increase of 16S rRNA
gene copy numbers was observed from day 4 to day 10 (Fig. 3, C2). Accordingly, the
μmax and corresponding doubling time were calculated to be 0.17 d-1 and 4.1 d,
respectively.
Anammox bacterial growth in immobilized gel beads
Free-living planktonic cells of “Ca. B. sinica” and “Ca. J. caeni” were
immobilized in PVA-SA gels and cultivated in up-flow column reactors. In order to
avoid both substrate limitation and inhibition, the nitrogen loading rate was carefully
increased as the cells grew. The effluent nitrite concentrations were in the range 0.2 - 34
(average 11.3) mg-N L-1 for the “Ca. B. sinica” reactor and the range 2.4 - 27.9 (average
12.9) mg-N L-1 for the “Ca. J. caeni” reactor during the experiments (Fig. 4, A1 and
B1). Exponential increase in 16S rRNA gene copy numbers of “Ca. B. sinica” was
observed after 1 week, and the μmax was calculated to be 0.34 d-1 (i.e., doubling time of
2.1 d) accordingly (Fig. 4, A2). Similarly, exponential increase in 16S rRNA gene copy
numbers of “Ca. J. caeni” was observed after 20 days, the μmax was calculated to be 0.18
d-1 (i.e., doubling time of 3.9 d) accordingly (Fig. 4, B2). These observed μmax of both
species were higher than the ones obtained from MBR cultures. The μmax of “Ca.
Scalindua sp.” could not be determined due to unsuccessful immobilization.
Production of EPS
Extracellular protein and polysaccharide contents per biomass [μg mg-VSS-1]
were determined when planktonic “Ca. B. sinica” cells were cultured in a MBR (Fig. 5,
Fig. S1). The MBR was operated with a step-wise increase in the nitrogen loading rate

enrichment, growth kinetics and ecophysiology of anammox bacteria
88
to supply sufficient substrates without nitrite inhibition. The 16S rRNA gene copy
numbers increased and reached a stable value after 30 days. Extracellular
polysaccharide content was relatively constant (ranging from average 19 μg mg-VSS-1
during the exponential growth phase to 29 μg mg-VSS-1 during the stationary phase)
throughout the cultivation, whereas extracellular protein content increased by 1.7 times
from 61 to 108 μg mg-VSS-1 (Fig. 5C). PCA analysis of FTIR spectra revealed that
there was a clear difference between the EPS produced during the exponential growth
and stationary phase (Fig. 5D).
4.5 DISCUSSION
The maximum specific growth rates (μmax) of anammox bacteria immobilized in PVA-
SA gel beads were directly determined from exponential increases in 16S rRNA gene
copy numbers. The μmax measurement was conducted for “Ca. B. sinica” in triplicate
and the consistent results were obtained (0.31 - 0.34 d-1, Fig. S2, 95% confidence
interval: 0.33 ± 0.02 d-1), supporting the high reproducibility of this method. The qPCR-
based quantification assay of 16S rRNA gene copy number is an easy, rapid, and
specific alternative to quantification of target cells in environmental samples and mixed
populations (Trung et al., 2011; Tsushima et al., 2007a). This approach is based on the
assumption that a constant relationship exists between the cell number and the 16S
rRNA gene copy number. It has been previously demonstrated that the cell numbers and
16S rRNA gene copy numbers was highly correlated during exponential growth phase
under no stress condition (Chase and Harwood, 2011; Reichert-Schwillinsky et al.,
2009). The qPCR-based quantification assay of 16S rRNA gene copy number has been
previously used to estimate the μmax of anammox bacteria (Tsushima et al., 2007; van
der Star et al., 2007).
A limitation of this qPCR assay was, however, its inability to discriminate between
active and inactive cells. Accumulation of inactive cells in gel beads and MBR cultures
might lead to overestimation of μmax. In the present study, μmax was determined from
exponential increase phases of 16S rRNA gene copy numbers, in which optimal growth
conditions (no substrate limitation and inhibition) were maintained, and thus the growth
rate is maximum and decay is negligible (Cupples et al., 2003). In fact, the decay rate of
“Ca. B. sinica” has been reported to be 0.0029 - 0.0081 d-1 (Oshiki et al., 2013), which
was < 3% of the μmax values obtained in this study, suggesting the effect of decay rate
Chapter 4: maximum specific growth rate of anammox bacteria revisited
89
was negligible in this measurement. Therefore, the resulting μ values were considered to
be μmax and accurate.
According to the Monod equation, the limiting substrate (i.e., nitrite in this study)
concentration in the up-flow column reactor must be carefully maintained in order to
ensure the exponential growth (i.e., maximum specific growth rate). It should be also
noted that high nitrite concentration inhibits anammox activity (Oshiki et al., 2016). The
half-saturation constant (Ks) value for nitrite was 0.48 ± 0.29 mg-N L-1 for “Ca. B.
sinica”, 0.50 ± 0.013 mg-N L-1 for “Ca. J. caeni”, and 0.0063 mg-N L-1 for “Ca.
Scalindua sp.”, respectively (Oshiki et al., 2016). The inhibition constant (Ki) value for
nitrite was < 224 mg-N L-1 for “Ca. B. sinica”, 154 mg-N L-1 for “Ca. J. caeni”, and 105
mg-N L-1 for “Ca. Scalindua sp.”, respectively (Oshiki et al., 2016). Therefore, the
nitrite concentration must be maintained at least in the range between two times of its
Ks value and a half of Ki value; 0.96 – 112 mg-N L-1 for “Ca. B. sinica”, 1.0 – 78 mg-N
L-1 for “Ca. J. caeni” and 0.0032 – 53 mg-N L-1 for “Ca. Scalindua sp.”, respectively, to
obtain the exponential increase in 16S rRNA gene copy numbers.
In the case of “Ca. B. sinica” gel bead column reactor, the effluent nitrite concentration
was in the range 0.2 – 34.0 (average 11.3) mg-N L-1 during the experiment (Fig. 4, A1).
In the case of “Ca. J. caeni” gel bead column reactor, the effluent nitrite concentration
was in the range 2.4 - 27.9 (average 12.9) mg-N L-1 during the experiment (Fig. 4, B1).
This indicates that the effluent nitrite concentration was mostly maintained above their
Ks values and below Ki value throughout the experiment. In addition, the gel bead
samples were always taken from the bottom part (medium inlet side) of the column
reactor, thus, the higher nitrite concentrations than the effluent concentration could be
expected due to the concentration gradient developed along with the column height
(Kindaichi et al., 2007). Furthermore, the substrate diffusivity in PVA-SA gel beads
was relatively high (77% of diffusivity in water) (Ali et al., 2015b). Taken together,
nitrite was present in excess in the gel beads; therefore, the resulting μmax values were
considered reliable.
As a result, the μmax values of 0.33 ± 0.02 d-1 for “Ca. B. sinica” and 0.18 d-1 for “Ca. J.
caeni” were obtained from the immobilized cells at 37 ºC, which were higher than the
previously reported μmax values for corresponding anammox species (Ali et al., 2015a;
Oshiki et al., 2011) (Table 2). The highest previously reported μmax value was 0.33 d-1
for anammox bacteria closely related to “Ca. Brocadia sp. 40” (Lotti et al., 2015), which
was estimated as an inverse of SRT of MBR at 30 ºC (lower than the optimum

enrichment, growth kinetics and ecophysiology of anammox bacteria
90
temperature). In their study, even though the SRT was gradually decreased to 3.0 days
by increasing the flow rate of mixed liquor discharge for about 300 days, anammox
activity (NO2- and NH4
+ removal rates) remained relatively unchanged whereas the
mixed liquor biomass concentration significantly decreased. Therefore, it was
concluded that anammox bacteria have a remarkable capacity to increase the growth
rate by maximizing the electron transfer capacity (biomass specific NH4+ oxidation rates
[mg-NH4+-N g-VS-1 d-1]). Under such short SRT (i.e., high dilution rate) conditions and
relatively long operation time, bacterial cells tend to attach and grow on the walls of
MBR and/or membrane modules (Okabe et al., 1992; Okabe and Characklis, 1992),
which results in significant overestimation of the biomass specific NH4+ oxidation rates,
namely μmax. In this study, the membrane and walls were vigorously shaken and cleaned
to avoid biomass attachment everyday during the operation (usually a month), which
resulted in no visible biomass attachment.
The μmax values determined from the immobilized “Ca. B. sinica” (0.33 ± 0.02 d-1) and
“Ca. J. caeni” (0.18 d-1) were higher than those obtained from planktonic free-living
cultures in MBRs; 0.17 d-1 for “Ca. B. sinica”, 0.11 d-1 for “Ca. J. caeni”, and 0.17 d-1
for “Ca. Scalindua sp.” (Table 2). A relatively small amount of anammox biomass was
inoculated into the MBR culture, and the MBRs were operated as a semi-batch mode
(no SRT control and continuous substrate supply) for a relatively short term (about a
month). Temporal changes in 16S rRNA gene copy numbers were directly measured.
Compared with the gel bead column reactors, it was difficult to maintain appropriate
nitrite concentration in the MBR culture (Fig. 3). The average nitrite concentrations,
especially for “Ca. B. sinica” and “Ca. J. caeni”, were close to their Ks values during
the experiment, suggesting occurrence of nitrite limitation. This is probably the reason
why the lower μmax values were observed in the MBR cultures.
In addition to the substrate limitation, all newly born daughter cells could be completely
retained in PVA-SA gel beads and free from hydraulic shear stress. It is considered that
free-living planktonic anammox cells need to produce more EPS than the immobilized
cells, since hydraulic shear stress is a key stimulator of EPS production and
consequently aggregation (Beun et al., 2002; Liu et al., 2010). Production of EPS
requires investment of energy derived from the substrate utilization, approximately 7%
of fixed carbon was secreted as soluble microbial products by “Ca. B. sinica” (Oshiki et
al., 2011). The planktonic “Ca. B. sinica” cells produced 109 μg-extracellular protein

Chapter 4: maximum specific growth rate of anammox bacteria revisited
91
mg-VSS-1 and 29 μg-extracellular carbohydrate mg-VSS-1 at stationary growth phase,
which were higher than the production at exponential growth phase (Fig. 5, Fig. S1).
Quantification of EPS production was not successful for immobilized cells due to high
background of alginate matrix used for immobilization. Such allocation of energy to
EPS production perhaps hinders the planktonic anammox bacteria from growing at a
maximum rate, whereas immobilized cells could use most of the energy for cellular
growth. However, this hypothesis must be verified in future.
4.6 CONCLUSIONS
The maximum specific growth rate (μmax) of anammox bacteria was
reevaluated by directly measuring exponential increases in 16S rRNA gene copy
numbers. First, qPCR assays were developed for quantification of 16S rRNA gene copy
numbers of three phylogenetically distant anammox bacteria; “Ca. Brocadia sinica”,
“Ca. Jettenia caeni” and “Ca. Scalindua sp.”, respectively. The free-living planktonic
anammox bacteria were immobilized in PVA-SA gel beads and cultivated in up-flow
column reactors without substrate limitation, and temporal changes in 16S rRNA genes
were monitored. The μmax were determined to be 0.33 ± 0.02 d-1 for “Ca. B. sinica” and
0.18 d-1 for “Ca. J. caeni” at 37 ºC, respectively, which are higher than the highest
previously reported values. These μmax values were directly determined based on the
exponential increase in 16S rRNA genes; therefore considered accurate. Furthermore,
the direct 16S rRNA gene quantification of immobilized cells is relatively easy and
rapid (takes only a month). In the present study, since special cultivation method and
selection pressures were not applied, this fast growth rate is, therefore, considered to be
an intrinsic kinetic property of anammox bacteria.
Figure 4.1 Confocal microscopic images of FISH analysis for enriched free-living
planktonic cells of (A) “Ca. Brocadia sinica”, (B) “Ca. Jettenia caeni” and (C) “Ca.
A B C

enrichment, growth kinetics and ecophysiology of anammox bacteria
92
Scalindua sp.” in MBRs. Cells were hybridized with combination of FITC-labeled
AMX820 probe (green) and TRITC-labeled EUB mix probe (red) for “Ca.
Brocadia sinica” (A), TRITC-labeled EUB338 mix probe (red) and FITC-labelled
probe JEC152 (green) for “Ca. Jettenia caeni” (B), and FITC-labeled EUB338 mix
probe (green) and TRITC-labelled probe Sca1129b for “Ca. Scalindua sp.” (C).
Anammox bacteria were shown in yellow for all panels. White bars indicate 20 μm.
y = -3.2x + 42.2R² = 0.998E = 105%
0
10
20
30
40
0 2 4 6 8
“Ca. Brocadia sinica”
y = -3.4x + 40.9R² = 0.996E = 97%
0
10
20
30
40
0 2 4 6 8
“Ca. Jettenia caeni”
y = -3.1x + 40.6R² = 0.996E = 109%
0
10
20
30
40
0 2 4 6 8
“Ca. Scalindua sp.”
Qu
an
tifica
tio
n c
ycle
(C
q)
Target gene concentrations
[log copies μl-1]

Chapter 4: maximum specific growth rate of anammox bacteria revisited
93
Figure 4.2 Standard curves of the qPCR assays developed in this study for “Ca. B.
sinica”, “Ca. J. caeni” and “Ca. Scalindua sp.”, respectively. The standard curves were
prepared using serial 10-fold dilutions (from 107 to 103 or 101 copy numbers μL-1) of the
plasmid DNA carrying the partial 16S rRNA gene of “Ca. B. sinica”, “Ca. J. caeni” and
“Ca. Scalindua sp.”, respectively. Goodness-of-fit (r2) value, the slope of the standard
curve, and amplification efficiency (E) are also shown. Error bars indicate the standard
deviation of the triplicates.

enrichment, growth kinetics and ecophysiology of anammox bacteria
94
Figure 4.3 The reactor performance, nitrite concentration in bulk phase and growth
dynamics of “Ca. B. sinica” (A1 and A2), “Ca. J. caeni” (B1 and B2) and “Ca.
Scalindua sp.” (C1 and C2) in a MBR, respectively. Maximum specific growth rate
0.0
E+
00
3.0
E+
09
6.0
E+
09
9.0
E+
09
020
40
60
0.E
+0
0
1.E
+1
0
2.E
+1
0
3.E
+10
010
20
30
0246
012345
010
20
30
Nitro
gen
loa
din
g r
ate
Nitri
te in
efflu
ent
0246
0.0
0
0.0
5
0.1
0
0.1
5
0.2
0
020
40
60
Nitro
gen
loa
din
g r
ate
Nitri
te in
efflu
ent
0246
0.0
0.5
1.0
1.5
2.0
010
20
30
Nitro
gen
loa
din
g r
ate
Nitri
te in
efflu
ent
16S rRNAgene copy numbers
[copies mL-1]
Nitrite concentration
[mg-N L-1]
Da
ys o
f o
pe
ratio
n
Nitrogen loading rates
[kg-N m-3day-1]
A2A1
B2
B1
C2
C1
“Ca
. Je
tte
nia
ca
en
i”“C
a. B
roca
dia
sin
ica”
“Ca
. S
ca
lindu
asp.”
μ=
0.1
7 d
-1
t d=
4.1
d
R2
= 0
.98
μ=
0.1
1 d
-1
t d=
6.3
d
R2
= 0
.998
0.0
E+
00
2.0
E+
10
4.0
E+
10
6.0
E+
10
010
20
30
μ=
0.1
7 d
-1
t d=
4.1
d
R2
= 0
.97
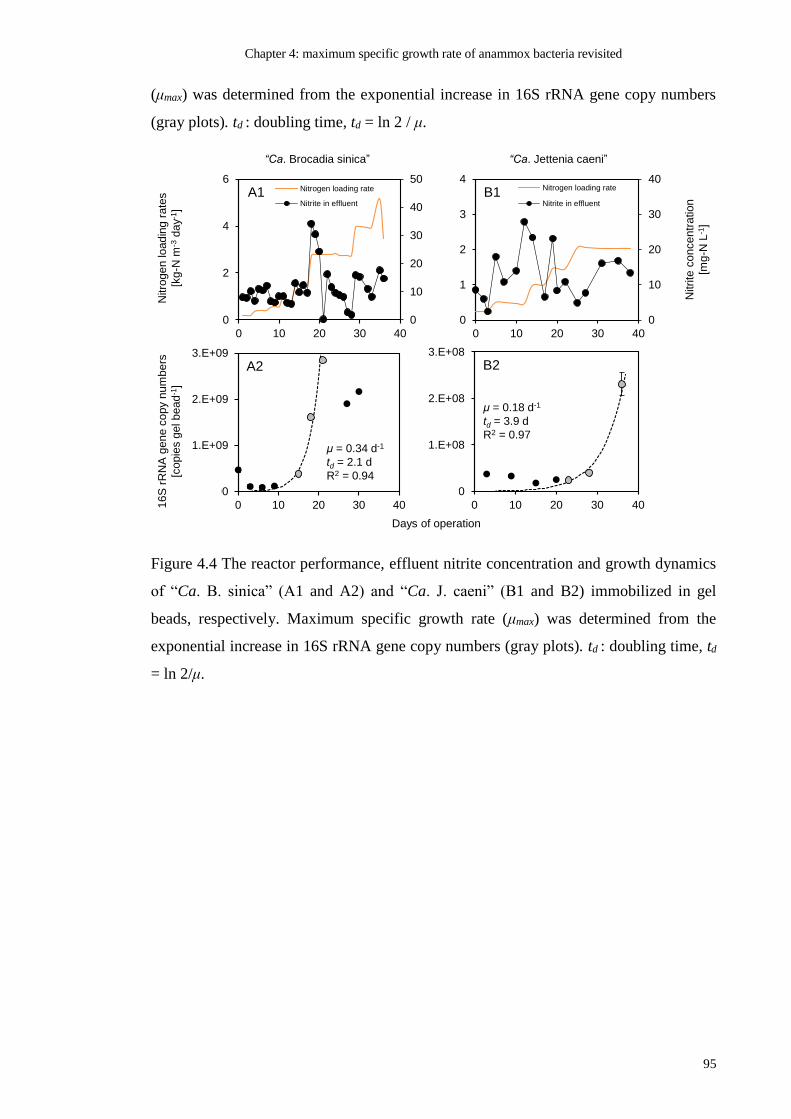
Chapter 4: maximum specific growth rate of anammox bacteria revisited
95
(μmax) was determined from the exponential increase in 16S rRNA gene copy numbers
(gray plots). td : doubling time, td = ln 2 / μ.
Figure 4.4 The reactor performance, effluent nitrite concentration and growth dynamics
of “Ca. B. sinica” (A1 and A2) and “Ca. J. caeni” (B1 and B2) immobilized in gel
beads, respectively. Maximum specific growth rate (μmax) was determined from the
exponential increase in 16S rRNA gene copy numbers (gray plots). td : doubling time, td
= ln 2/μ.
0.E+00
1.E+08
2.E+08
3.E+08
0 10 20 30 40
0.E+00
1.E+09
2.E+09
3.E+09
0 10 20 30 40
0
10
20
30
40
50
0
2
4
6
0 10 20 30 40
Nitrogen loading rate
Nitrite in effluent
0
10
20
30
40
0
1
2
3
4
0 10 20 30 40
Nitrogen loading rate
Nitrite in effluent
16S
rR
NA
gene c
opy n
um
bers
[copie
s g
el bead
-1]
A2
“Ca. Jettenia caeni”“Ca. Brocadia sinica”
A1
B2
B1
Nitrite
concentr
ation
[mg-N
L-1
]
Days of operation
Nitro
gen loadin
g r
ate
s
[kg
-N m
-3day
-1]
μ = 0.34 d-1
td = 2.1 d
R2 = 0.94
μ = 0.18 d-1
td = 3.9 d
R2 = 0.97

enrichment, growth kinetics and ecophysiology of anammox bacteria
96
Figure 4.5 EPS production at different growth phases. Reactor performance and nitrite
concentration in bulk phase in MBR (A). Temporal change in16S rRNA gene copy
numbers of “Ca. B. sinica” (B). Time course changes in extracellular protein and
polysaccharide content per biomass dry weight during cell growth (C). Principal
component analysis (PCA) on the spectrum of Fourier transform infrared spectroscopy
(FTIR) for EPS samples taken from different growth phases (D).
0.0E+00
5.0E+10
1.0E+11
1.5E+11
0 20 40 600
2
4
6
8
10
0.0
0.5
1.0
1.5
2.0
0 20 40 60
Nitrogen loading rate (NLR)
Nitrite concentration
Day 26
Day 32
Day 38Day 45
Day 0
Day 8
Day 14
Day 20
-0.5
-0.3
-0.1
0.1
0.3
0.5
0.7
0.9
0.0 0.2 0.4 0.6
Stationary phaseLog phase
0
20
40
60
80
100
120
0 20 40 60
Polysccachide
Protein
16S
rR
NA
gen
e c
opy n
um
bers
[co
pie
s m
L-1
]
Nitro
ge
n lo
ad
ing r
ate
s
[kg-N
m-3
day
-1]
Po
lyscca
ch
ide
and
pro
tein
co
nce
ntr
atio
n
[μg
per
mg
-dry
-we
ight-
bio
ma
ss]
C
A
D
B
Co
mp
art
me
nt 2 (
-)
Compartment 1 (-)
Days of operation Days of operation
Days of operation
Nitrite
co
nce
ntr
atio
n
[mg-N
L-1
]

Chapter 4: maximum specific growth rate of anammox bacteria revisited
97
Table 4.1 Specific primers and probes designed in this study.
Target species Name Sequence (5'-->3') Target
sitea
“Ca. Brocadia.
sinica”
BRS95
F GATGGGAACAACAACGTTCCA 95-115
BRS17
0R TTCTTTGACTGCCGACACCA 170-189
BRS13
0P
FAM-CCGAAAGGGTTGCTAATTCTCA-
MGB-NFQ 130-151
“Ca. Scalindua
sp.”
SCJ447
F GTAAACAGGTTAATACCCTGT 447-467
SCJ629
R TCAAGATCTACAGTTTCAGAT 629-649
SCJ512
P
FAM-CAGCAGCCGCGGTAATACAGA-
MGB-NFQ 512-532
“Ca. Jettenia
caeni”
JEC447
F GTAAGGGGGTGAATAGCCCTC 447-467
JEC629
R TCCAGCCCTATAGTATCAACT 629-649
JEC512
P
FAM-CAGCAGCCGCGGTAATACAGA-
MGB-NFQ 512-532
a: 16S rRNA position according to 16S rRNA gene sequence of Escherichia coli
numbering.
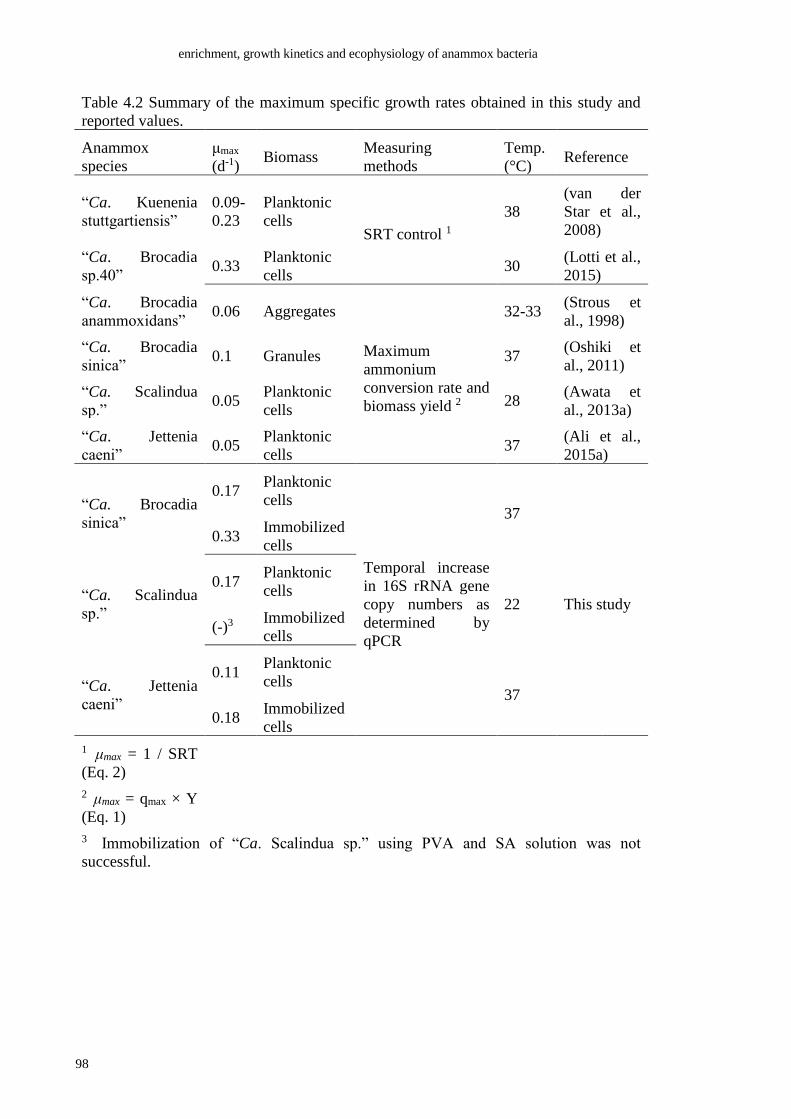
enrichment, growth kinetics and ecophysiology of anammox bacteria
98
Table 4.2 Summary of the maximum specific growth rates obtained in this study and
reported values.
Anammox
species
μmax
(d-1) Biomass
Measuring
methods
Temp.
(°C) Reference
“Ca. Kuenenia
stuttgartiensis”
0.09-
0.23
Planktonic
cells SRT control 1
38
(van der
Star et al.,
2008)
“Ca. Brocadia
sp.40” 0.33
Planktonic
cells 30
(Lotti et al.,
2015)
“Ca. Brocadia
anammoxidans” 0.06 Aggregates
Maximum
ammonium
conversion rate and
biomass yield 2
32-33 (Strous et
al., 1998)
“Ca. Brocadia
sinica” 0.1 Granules 37
(Oshiki et
al., 2011)
“Ca. Scalindua
sp.” 0.05
Planktonic
cells 28
(Awata et
al., 2013a)
“Ca. Jettenia
caeni” 0.05
Planktonic
cells 37
(Ali et al.,
2015a)
“Ca. Brocadia
sinica”
0.17 Planktonic
cells
Temporal increase
in 16S rRNA gene
copy numbers as
determined by
qPCR
37
This study
0.33 Immobilized
cells
“Ca. Scalindua
sp.”
0.17 Planktonic
cells 22
(-)3 Immobilized
cells
“Ca. Jettenia
caeni”
0.11 Planktonic
cells 37
0.18 Immobilized
cells
1 μmax = 1 / SRT
(Eq. 2)
2 μmax = qmax × Y
(Eq. 1)
3 Immobilization of “Ca. Scalindua sp.” using PVA and SA solution was not
successful.

Chapter 4: maximum specific growth rate of anammox bacteria revisited
99
4.7 REFERENCE
Ali, M., Okabe, S., 2015. Anammox-based technologies for nitrogen removal:
Advances in process start-up and remaining issues. Chemosphere 141, 144–153.
Ali, M., Oshiki, M., Awata, T., Isobe, K., Kimura, Z., Yoshikawa, H., Hira, D.,
Kindaichi, T., Satoh, H., Fujii, T., Okabe, S., 2015a. Physiological characterization of
anaerobic ammonium oxidizing bacterium “ C andidatus Jettenia caeni.” Environ.
Microbiol. 17, 2172–2189.
Ali, M., Oshiki, M., Okabe, S., 2014. Simple, rapid and effective preservation and
reactivation of anaerobic ammonium oxidizing bacterium “Candidatus Brocadia sinica.”
Water Res 57, 215–222.
Ali, M., Oshiki, M., Rathnayake, L., Ishii, S., Satoh, H., Okabe, S., 2015b. Rapid and
successful start-up of anammox process by immobilizing the minimal quantity of
biomass in PVA-SA gel beads. Water Res. 79, 147–157.
APHA, 1998. Standard Methods for the Examination of Water and Wastewater, 20th ed.
American Public Health Association, Washington DC.
Awata, T., Oshiki, M., Kindaichi, T., Ozaki, N., Ohashi, A., Okabe, S., 2013.
Physiological characterization of an anaerobic ammonium-oxidizing bacterium
belonging to the “Candidatus scalindua” group. Appl. Environ. Microbiol. 79, 4145–
4148.
Beun, J.J., Van Loosdrecht, M.C.M., Heijnen, J.J., 2002. Aerobic granulation in a
sequencing batch airlift reactor. Water Res. 36, 702–712.
Carvajal-Arroyo, J.M., Sun, W., Sierra-Alvarez, R., Field, J. a, 2013. Inhibition of
anaerobic ammonium oxidizing (anammox) enrichment cultures by substrates,
metabolites and common wastewater constituents. Chemosphere 91, 22–27.
Chase, E., Harwood, V.J., 2011. Comparison of the effects of environmental parameters
on growth rates of vibrio vulnificus biotypes I, II, and III by culture and quantitative
PCR analysis. Appl. Environ. Microbiol. 77, 4200–4207.
Cole, J.R., Wang, Q., Fish, J.A., Chai, B., McGarrell, D.M., Sun, Y., Brown, C.T.,
Porras-Alfaro, A., Kuske, C.R., Tiedje, J.M., 2014. Ribosomal Database Project: Data
and tools for high throughput rRNA analysis. Nucleic Acids Res. 42, 633–642.

enrichment, growth kinetics and ecophysiology of anammox bacteria
100
Cupples, A.M., Spormann, A.M., Perry, L., Mccarty, P.L., 2003. Growth of a
Dehalococcoides-like microorganism on vinyl chloride and cis-dichloroethene as
electron acceptors as determined by competitive PCR growth. Appl. Environ. Microbiol.
69, 953–959.
DuBois, M., Gilles, K. a., Hamilton, J.K., Rebers, P. a., Smith, F., 1956. Colorimetric
method for determination of sugars and related substances. Anal. Chem. 28, 350–356.
Hira, D., Toh, H., Migita, C.T., Okubo, H., Nishiyama, T., Hattori, M., Furukawa, K.,
Fujii, T., 2012. Anammox organism KSU-1 expresses a NirK-type copper-containing
nitrite reductase instead of a NirS-type with cytochrome cd1. FEBS Lett. 586, 1658–
1663.
Ishii, S., Segawa, T., Okabe, S., 2013. Simultaneous quantification of multiple food-
and waterborne pathogens by use of microfluidic quantitative PCR. Appl. Environ.
Microbiol. 79, 2891–2898.
Kindaichi, T., Awata, T., Suzuki, Y., Tanabe, K., Hatamoto, M., Ozaki, N., Ohashi, A.,
2011. Enrichment Using an Up-flow Column Reactor and Community Structure of
Marine Anammox Bacteria from Coastal Sediment. Microbes Environ. 26, 67–73.
Kindaichi, T., Tsushima, I., Ogasawara, Y., Shimokawa, M., Ozaki, N., Satoh, H.,
Okabe, S., 2007. In situ activity and spatial organization of anaerobic ammonium-
oxidizing (anammox) bacteria in biofilms. Appl. Environ. Microbiol. 73, 4931–4939.
Lackner, S., Gilbert, E.M., Vlaeminck, S.E., Joss, A., Horn, H., van Loosdrecht,
M.C.M., 2014. Full-scale partial nitritation/anammox experiences--an application
survey. Water Res. 55, 292–303.
Lammers, K., Arbuckle-Keil, G., Dighton, J., 2009. FT-IR study of the changes in
carbohydrate chemistry of three New Jersey pine barrens leaf litters during simulated
control burning. Soil Biol. Biochem. 41, 340–347.
Liu, X.-M., Sheng, G.-P., Luo, H.-W., Zhang, F., Yuan, S.-J., Xu, J., Zeng, R.J., Wu, J.-
G., Yu, H.-Q., 2010. Contribution of extracellular polymeric substances (EPS) to the
sludge aggregation. Environ. Sci. Technol. 44, 4355–4360.
Lotti, T., Kleerebezem, R., Abelleira-Pereira, J.M., Abbas, B., van Loosdrecht, M.C.M.,
2015. Faster through training: The anammox case. Water Res. 81, 261–268.
Lotti, T., Kleerebezem, R., Lubello, C., van Loosdrecht, M.C.M., 2014. Physiological
and kinetic characterization of a suspended cell anammox culture. Water Res. 60, 1–14.
Chapter 4: maximum specific growth rate of anammox bacteria revisited
101
Lotti, T., van der Star, W.R.L., Kleerebezem, R., Lubello, C., van Loosdrecht, M.C.M.,
2012. The effect of nitrite inhibition on the anammox process. Water Res. 46, 2559–
2569.
Lowry, O.H., Rosebrough, N.J., Farr, A.L., Randall, R.J., 1951. Protein measurement
with the Folin phenol reagent. J. Biol. Chem. 193, 265–275.
Markus C, S., Bart, M., Ana, D., Katinka, van de P.-S., Jack, van de V., Boran, K.,
Niftrik, L. van, Ingo, S., Irina, C., J, G.K., Michael, W., Jaap S, S.D., Marcel, K.,
Revsbech, N.P., Mendez, R., Jetten, M.S.M., Strous, M., 2005. Biomarkers for In Situ
Detection of Anaerobic Ammonium-Oxidizing (Anammox) Bacteria. Appl. Environ.
Microbiol. 71, 1677–1684.
Okabe, S., Characklis, W.G., 1992. Effects of temperature and phosphorous
concentration on microbial sulfate reduction by Desulfovibrio desulfuricans. Biotechnol.
Bioeng. 39, 1031–1042.
Okabe, S., Nielsen, P.H., Characklis, W.G., Charcklis, W.G., 1992. Factors affecting
microbial sulfate reduction by Desulfovibrio desulfuricans in continuous culture:
Limiting nutrients and sulfide concentration. Biotechnol. Bioeng. 40, 725–734.
Okabe, S., Oshiki, M., Takahashi, Y., Satoh, H., 2011. N2O emission from a partial
nitrification-anammox process and identification of a key biological process of N2O
emission from anammox granules. Water Res. 45, 6461–6470.
Okabe, S., Satoh, H., Watanabe, Y., 1999. In situ analysis of nitrifying biofilms as
determined by in situ hybridization and the use of microelectrodes. Appl. Environ.
Microbiol. 65, 3182–3191.
Oshiki, M., Awata, T., Kindaichi, T., Satoh, H., Okabe, S., 2013. Cultivation of
Planktonic Anaerobic Ammonium Oxidation (Anammox) Bacteria Using Membrane
Bioreactor. Microbes Environ. 28, 436–443.
Oshiki, M., Satoh, H., Okabe, S., 2016. Ecology and physiology of anaerobic
ammonium oxidizing bacteria. Environ. Microbiol. 18, 2784–2796.
Oshiki, M., Shimokawa, M., Fujii, N., Satoh, H., Okabe, S., 2011. Physiological
characteristics of the anaerobic ammonium-oxidizing bacterium “Candidatus Brocadia
sinica.” Microbiology 157, 1706–1713.

enrichment, growth kinetics and ecophysiology of anammox bacteria
102
Oshiki, M., Shinyako-Hata, K., Satoh, H., Okabe, S., 2015. Draft Genome Sequence of
an Anaerobic Ammonium-Oxidizing Bacterium,“Candidatus Brocadia sinica.” Genome
Announc. 3, 3–4.Copyright
Pernthaler, J., Frank Oliver, G., Wilhelm, S., Rudolf, A., 2001. Fluorescence in situ
Hybridization (FISH) with rRNA-targeted Oligonucleotide Probes. Methods Microbiol.
Mar. Microbiol. 30, 207–226.
Reichert-Schwillinsky, F., Pin, C., Dzieciol, M., Wagner, M., Hein, I., 2009. Stress- and
Growth Rate-Related Differences between Plate Count and Real-Time PCR Data during
Growth of Listeria monocytogenes. Appl. Environ. Microbiol. 75, 2132–2138.
Schmid, M., Twachtmann, U., Klein, M., Strous, M., Juretschko, S., Jetten, M., Metzger,
J.W., Schleifer, K.H., Wagner, M., 2000. Molecular evidence for genus level diversity
of bacteria capable of catalyzing anaerobic ammonium oxidation. Syst. Appl. Microbiol.
23, 93–106.
Strous, M., Fuerst, J., Kramer, E., Logemann, S., Muyzer, G., Van de Pas-Schoonen, K.,
Webb, R., Kuenen, J., Jetten, M., 1999. Missing Lithotroph Identified as New
Planctomycete. Nature 400, 446–449.
Strous, M., Heijnen, J.J., Kuenen, J.G., Jetten, M.S.M., 1998. The sequencing batch
reactor as a powerful tool for the study of slowly growing anaerobic ammonium-
oxidizing microorganisms. Appl. Microbiol. Biotechnol. 50, 589–596.
Tan, C.H., Koh, K.S., Xie, C., Tay, M., Zhou, Y., Williams, R., Ng, W.J., Rice, S. a,
Kjelleberg, S., 2014. The role of quorum sensing signalling in EPS production and the
assembly of a sludge community into aerobic granules. ISME J. 8, 1186–1197.
Trung, T.T., Hetzer, A., Göhler, A., Topfstedt, E., Wuthiekanun, V., Limmathurotsakul,
D., Peacock, S.J., Steinmetz, I., 2011. Highly sensitive direct detection and
quantification of Burkholderia pseudomallei bacteria in environmental soil samples by
using real-time PCR. Appl. Environ. Microbiol. 77, 6486–6494.
Tsushima, I., Kindaichi, T., Okabe, S., 2007a. Quantification of anaerobic ammonium-
oxidizing bacteria in enrichment cultures by real-time PCR. Water Res. 41, 785–794.
Tsushima, I., Ogasawara, Y., Kindaichi, T., Satoh, H., Okabe, S., 2007b. Development
of high-rate anaerobic ammonium-oxidizing (anammox) biofilm reactors. Water Res. 41,
1623–1634.

Chapter 4: maximum specific growth rate of anammox bacteria revisited
103
van de Graaf, A.A., de Bruijn, P., Robertson, L.A., Jetten, M.S.M., Kuenen, J.G., 1996.
Autotrophic growth of anaerobic ammonium-oxidizing micro-organisms in a fluidized
bed reactor. Microbiology 142, 2187–2196.
van der Star, W.R.L., Abma, W.R., Blommers, D., Mulder, J.-W., Tokutomi, T., Strous,
M., Picioreanu, C., van Loosdrecht, M.C.M., 2007. Startup of reactors for anoxic
ammonium oxidation: experiences from the first full-scale anammox reactor in
Rotterdam. Water Res. 41, 4149–4163.
van der Star, W.R.L., Miclea, A.I., van Dongen, U.G.J.M., Muyzer, G., Picioreanu, C.,
van Loosdrecht, M.C.M., 2008. The membrane bioreactor: a novel tool to grow
anammox bacteria as free cells. Biotechnol. Bioeng. 101, 286–294.

enrichment, growth kinetics and ecophysiology of anammox bacteria
104
5 MICROBIAL COMPETITION
AMONG ANAMMOX
BACTERIA IN NITRITE-
LIMITED BIOREACTORS
This chapter has been published as:
Zhang, L., Narita, Y., Gao, L., Ali, M., Oshiki, M., Ishii S and Okabe, S., 2017.
Microbial competition among anammox bacteria in nitrite-limited bioreactors. Water
Res, 125, 249-258.

Chapter 5: Microbial competition among anammox bacteria in nitrite-limited bioreactors
105
5.1 ABSTRACT
Phylogenetically diverse anammox bacteria have been detected in most of
anoxic natural and engineered ecosystems and thus regarded as key players in the global
nitrogen cycle. However, ecological niche differentiation of anammox bacteria remains
unresolved despite its ecological and practical importance. In this study, the microbial
competitions for a common substrate (nitrite) among three anammox species (i.e.
“Candidatus Brocadia sinica”, “Candidatus Jettenia caeni” and “Candidatus Kuenenia
stuttgartiensis”) were systematically investigated in nitrite-limited gel-immobilized
column reactors (GICR) and membrane bioreactors (MBRs) under different nitrogen
loading rates (NLRs). 16S rRNA gene-based population dynamics revealed that “Ca. J.
caeni” could proliferate only at low NLRs, whereas “Ca. B. sinica” outcompeted other
two species at higher NLRs in both types of reactors. Furthermore, FISH analysis
revealed that “Ca. J. caeni” was mainly present as spherical microclusters at the inner
part (low NO2- environment), whereas “Ca. B. sinica” was present throughout the gel
beads and granules. This spatial distribution supports the outcomes of the competition
experiments. However, the successful competition of “Ca. J. caeni” at low NLR could
not be explained with the Monod model probably due to inaccuracy of kinetic
parameters such as half saturation constant (Ks) for nitrite and a difference in the
maintenance rate (m). In addition, the growth of “Ca. K. stuttgartiensis” could not be
observed in any experimental conditions, suggesting possible unknown factor(s) is
missing. Taken together, NLR was one of factors determining ecological niche
differentiation of “Ca. B. sinica” and “Ca. J. caeni”.
5.2 INTRODUCTION
Anaerobic ammonium-oxidizing (anammox) bacteria are chemolithoautotrophic
bacteria that can oxidize ammonium to nitrogen gas with nitrite as the electron acceptor
(Jetten et al., 2005; Neumann et al., 2014). Since its discovery, anammox activities and
bacteria were detected from various natural and engineered ecosystems (Hu et al., 2011;
Sonthiphand et al., 2014) and thus regarded as an essential contributor in the global
nitrogen cycle (Kuypers et al., 2003).
Five candidatus genera (Brocadia, Kuenenia, Jettenia, Scalindua and Anammoxoglobus)
and 19 species have been reported to date (Ali and Okabe, 2015; Kartal et al., 2007;
Oshiki et al., 2016; Quan et al., 2008; Schmid et al., 2003; Strous et al., 1999, 1998).
enrichment, growth kinetics and ecophysiology of anammox bacteria
106
Observations of anammox bacterial diversity have demonstrated that “Ca. Scalindua”
dominated saline environments including marine sediments (i.e., Awata et al., 2013;
Schmid et al., 2007; Sonthiphand et al., 2014; Villanueva et al., 2014), whereas the
other four genera were mainly detected from engineered and fresh water ecosystems
(i.e., Egli et al., 2001; Hu et al., 2011; Schmid et al., 2000; Sonthiphand et al., 2014;
Strous et al., 1999). Although pure culture is still not available (Strous et al., 1999),
some physiological studies have been conducted using anammox bacteria cultures
enriched (>90%) in membrane bioreactors (MBRs) (Ali et al., 2015a; Awata et al., 2013;
Lotti et al., 2014; Oshiki et al., 2013; van der Star et al., 2008). Ecological and
physiological characteristics of anammox bacteria were recently summarized (Oshiki et
al., 2016), and Monod growth kinetic parameters of three anammox species (i.e.
“Candidatus Brocadia sinica”, “Candidatus Jettenia caeni” and “Candidatus Kuenenia
stuttgartiensis”) were listed in Table 1.
Extensive statistical analysis of the anammox 16S rRNA gene sequences deposited in
the public databases revealed distinct ecological niche differentiation of anammox
bacteria in natural and engineered ecosystems (Sonthiphand et al., 2014). For example,
“Ca. Brocadia” and “Ca. Kuenenia” was the second and third most abundant genus,
respectively, and commonly retrieved from freshwater natural and engineered
ecosystems. On the other hand, “Ca. Jettenia” was the lowest abundant genus among all
anammox bacterial genera and the majority of them was retrieved from engineered
ecosystems (e.g., wastewater treatment plants and bioreactors) (Sonthiphand et al.,
2014). Based on this analysis, it is most probably that salinity was an important factor
governing anammox bacterial distributions such as “Ca. Scalindua”. However, very
limited information is available to explain what and/or how extrinsic factors (i.e., DO,
NO2- and NH4
+ concentrations) affect ecological niche partitioning of anammox bacteria
in freshwater-related ecosystems including engineered ecosystems.
In lab-scale bioreactors, population shifts of anammox bacteria have been frequently
reported under various conditions: e.g., from “Ca. B. fulgida”-dominated population to
“Ca. Brocadia. sp.40”-dominated population (Park et al., 2010); similarly from “Ca. B.
fulgida” to “Ca. K. stuttgartiensis” (Park et al., 2015); from “Ca. Brocadia sp.” to “Ca.
K. stuttgartiensis” (van der Star et al., 2008); and from “Ca. B. anammoxidians” to “Ca.
Anammoxoglobus propionicus” (Kartal et al., 2007). This clearly suggested that genus-
or species-specific niche differentiation and competition exist. However, there is no
clear understanding about niche differentiation of anammox bacteria at present.

Chapter 5: Microbial competition among anammox bacteria in nitrite-limited bioreactors
107
It has been hypothesized that these population shifts were caused by different kinetic
and physiological properties of anammox bacteria (e.g., maximum specific growth rate,
affinity to a limiting substrate (e.g., NH4+ or NO2
-), susceptibility to various compounds
or utilization of fatty acids) (Ali et al., 2015a; Kartal et al., 2007, 2008; Oshiki et al.,
2016, 2011; Park et al., 2015; van der Star et al., 2008). Interestingly, “Ca. B. fulgida”
and “Ca. A. propionicus” out-competed other anammox bacteria in the presence of
acetate and propionate, respectively (Kartal et al., 2007; Kartal et al., 2008), suggesting
that these fatty acids are the primary factor in determining the dominance of anammox
bacteria. However, driving force (s) for above population shifts has never been
systematically investigated and experimentally verified yet so far.
In this work, we therefore investigated the competition for a common substrate (nitrite)
among three anammox genera; “Ca. Brocadia”, “Ca. Jettenia”, and “Ca. Kuenenia”,
which were commonly found in lab-scale bioreactors. Two different reactor systems,
gel-immobilized column reactor (GICR) and membrane bioreactor (MBR), were
inoculated with anammox enrichment cultures containing these three anammox species
and continuously operated for a long time with different nitrogen loading rates.
Population dynamics of each anammox species were monitored by measuring 16S
rRNA gene copy numbers with quantitative PCR. In addition, specific growth rates of
three species at different limiting substrate (nitrite) concentrations were simulated using
the Monod model to explain the competition results. The niche differentiation among
“Ca. Brocadia”, “Ca. Jettenia”, and “Ca. Kuenenia” was further discussed.
5.3 MATERIALS AND METHODS
Monod growth curve
Specific growth rates (μ) of “Ca. B. sinica”, “Ca. J. caeni” and “Ca. K.
stuttgartiensis” were simulated as a function of limiting substrate concentration using
the classical Monod equation, μ = μmax× S / (Ks + S), where μ is the specific growth rate
(h-1); μmax is the maximum specific growth rate (h-1), which was recently re-evaluated
for “Ca. B. sinica” and “Ca. J. caeni” (Zhang et al., 2017); S is the concentration of the
limiting substrate (nitrite in this study) (μM); Ks is the half-saturation constant (μM)
(Table 1).

enrichment, growth kinetics and ecophysiology of anammox bacteria
108
Anammox enrichment cultures
Planktonic free-living cells of “Ca. B. sinica” (>90%) and “Ca. J. caeni”
(>90%) were obtained from 2-liter MBRs that have been operated in our laboratory
(Oshiki et al., 2013a; Ali et al., 2015). “Ca. K. stuttgartiensis” coexisted in the MBR
culture of “Ca. J. caeni”, but their abundance was 1 - 3 orders of magnitude lower than
that of “Ca. J. caeni” on the basis of 16S rRNA gene copy number measurement. In
brief, the MBR was equipped with a hollow-fiber membrane unit composed of 300
polyethylene tubes (0.1 μm-pore, 1-mm diam., 70-mm long tubes). A peristaltic pump
MP-1000 (EYELA, Tokyo, Japan) was directly connected to the membrane unit. Water
level in the MBR was controlled using a water level sensor (HL-S1A, ASONE, Japan).
The MBR culture medium was continuously mixed using a magnetic stirrer working at
200 rpm. To maintain anoxic condition, a mixed gas (Ar: CO2 = 95:5) was purged into
the culture medium at a flowrate of 10 ml min-1. Throughout the cultivation, pH was not
controlled but it was always maintained within the range of 7.0 - 8.0. The inorganic
nutrient medium was supplied containing (mg L-1): FeSO4·7H2O (9.0), EDTA·2Na (5.0),
NaCl (1.0), KCl (1.4), CaCl2·2H2O (1.4), MgSO4·7H2O (1.0), NaHCO3 (84), KH2PO4
(54) and 0.5 mL L-1 trace element solution II (van de Graaf et al., 1996). Biomass
growth was induced by continuously supplying the nutrient medium, but the biomass
was completely retained in the MBR by membrane filtration.
Long-term competition experiments
Competitions among “Ca. B. sinica”, “Ca. J. caeni” and “Ca. K. stuttgartiensis” for a
common substrate (i.e., nitrite) were studied using three different forms of anammox
biomass: gel-immobilized cells in up-flow column reactors, planktonic free-living cells
in MBR and self-aggregated granules in an up-flow column reactor.
For the gel-immobilized column reactors (GICR), planktonic free-living anammox
bacteria (“Ca. B. sinica”, “Ca. J. caeni” and “Ca. K. stuttgartiensis”) were immobilized
in polyvinyl alcohol (PVA) (6%, w/v) - sodium alginate (SA) (2%, w/v) gel beads as
described previously (Ali et al., 2015b). The gel beads were then inoculated into the
column reactors (53.6 mL, Fujirika, Japan) with a packing ratio of 70% and cultivated at
37°C. The column reactors were continuously fed with the inorganic nutrient medium
containing (NH4)2SO4 and NaNO2 at three different nitrogen loading rates (NLRs) of
0.5, 0.7 and 2.7 kg-N m-3 day-1 (defined as G1, G2 and G3), respectively. The NLR was

Chapter 5: Microbial competition among anammox bacteria in nitrite-limited bioreactors
109
varied by changing the influent NH4+ and NO2
- concentrations (0.7 mM, 1 mM and 4
mM). The hydraulic retention time (HRT) was fixed at 1 h. The feed medium was
purged with nitrogen gas to maintain an anoxic condition.
For MBR experiments, enrichment cultures of “Ca. B. sinica”, “Ca. J. caeni” and “Ca.
K. stuttgartiensis” were mixed and inoculated into four MBRs (the working volume of
950 mL each). The MBRs were operated at 37°C and four different NLRs of 0.07, 0.10,
0.14 and 0.17 – 0.42 kg-N m-3 day-1 (defined as M1, M2, M3, and M4), respectively. In
MBR M1, M2 and M3, culture media containing different concentrations of NH4+ and
NO2- were supplied at a fixed HRT of 15.8 h. In MBR M4, influent NH4
+ and NO2-
concentrations were increased from 4 mM to 12 mM in a stepwise manner when the
residual nitrite concentration in the bulk liquid was close to a detection limit [around 1
μM]). Sludge retention time (SRT) was not controlled (except for sampling for water
quality and molecular analysis) for all runs.
For the self-aggregated granular up-flow column reactor, the NLR was ranged from 4.3
to 8.6 kg-N m-3 day-1 by changing the feeding rate with fixed NH4+ and NO2
-
concentration at 10 mM.
Chemical analysis
Influent and effluent samples of each reactor were collected, filtered through
0.2-μm-pore membranes (Advantec, Tokyo, Japan), and analyzed for concentrations of
NH4+, NO2
- and NO3- using ion-exchange chromatography (DX-100, DIONEX,
Sunnyvale, CA) with an Ionpac CS3 cation column and IonPac AS9 anion column
(Okabe et al., 2011). In addition, NO2- concentration of MBR permeate was also
measured colorimetrically according to the Standard Methods (Eaton et al., 2005). The
detection limit of NO2- measurement was around 1 μM.
DNA extraction and quantitative PCR
Gel beads samples and self-aggregated granules at the bottom of column reactors (close
to the influent port) were collected periodically. Suspended biomass (2 ml) in MBRs
was collected on a daily basis. The biomass samples were stored at -80°C until used for
DNA extraction. The DNA extraction was performed using Fast DNA spin kit (BIO101,
Qbiogene, Carlsbad, CA) according to the manufacturer’s instructions.
enrichment, growth kinetics and ecophysiology of anammox bacteria
110
Two TaqMan qPCR assays were applied to quantify the 16S rRNA gene copy numbers
of “Ca. B. sinica” and “Ca. J. caeni”, respectively (Zhang et al., 2017). TaqMan qPCR
assay for “Ca. K. stuttgartiensis” was newly developed in this study (Table S1). The
qPCR mixture (20 μL) contained 10 μL of 2× Premix ExTaq (Takara Bio), 0.4 μL each
forward and reverse primers (10 μM), 0.8 μL TaqMan probe (10 μM), 0.4 μL of 50×
ROX Reference Dye II (Takara Bio), and 2 μL template DNA. The qPCR was run in
MicroAmp Optical 96-well reaction plates (Applied Biosystems) and ABI prism 7500
sequence detection system (Applied Biosystems) with the following reaction conditions;
30 sec at 95°C, followed by 40 cycles of 5 sec at 95°C and 34 sec at 60°C. The standard
curves for quantification were prepared by the 10-fold dilutions of plasmid DNA
containing the target gene molecules ranging from 107 to 103 copies μL-1. The
amplification efficiencies were calculated as described previously (Ishii et al., 2013).
“Ca. B. sinica”, “Ca. J. caeni” and “Ca. K. stuttgartiensis” possess one (Oshiki et al.,
2015), two (Hira et al., 2012) and one (Strous et al., 2006) rrn operon in their genomes,
respectively.
Fluorescence in situ hydridization
Fluorescence in situ hybridization (FISH) analysis was conducted to evaluate
the spatial distribution of each anammox species in gel beads and self-aggregated
granules. However, the percentage of “Ca. K. stuttgartiensis” was too low to be
effectively detected by FISH for all samples. Oligonucleotide probe AMX820 (Schmid
et al., 2001) or BRS211 (newly designed in current study, optimal formamide (FA)
concentration was experimentally determined as 40%) was used to detect “Ca. B.
sinica”. A new probe (JEC152) for “Ca. J. caeni” was designed using the ARB software
(Ludwig et al., 2004) (Table S2). Optimal FA concentration for JEC152 was
determined to be 20% as described previously (Manz et al., 1992). EUB mix probe
composed of an equimolar EUB338 I, II and III was used to target most member of
Eubacteria. No cross hybridization occurred between each species was confirmed
experimentally. Biomass samples were fixed in 4% paraformaldehyde solution as
described previously (Pernthaler et al., 2001). Hybridization was performed according
to the protocol described previously (Okabe et al., 1999; Tsushima et al., 2007a). Cells
were observed under confocal laser scanning microscope (Fluoview FV 300, Olympus,
Tokyo, Japan), equipped with multi Ar laser (458nm, 488nm, and 514nm) and HeNe
Chapter 5: Microbial competition among anammox bacteria in nitrite-limited bioreactors
111
laser (543 nm and 633 nm). The images were analyzed by the software package (ver.
2.0) provided with the microscope.
5.4 RESULTS
Monod growth curves
The classical Monod model with the previously reported μmax and Ks for nitrite
was used to simulate the specific growth rates of “Ca. B. sinica”, “Ca. J. caeni” and “Ca.
K. stuttgartiensis” as a function of nitrite concentration at 37°C (Table 1 and Fig. 1).
“Ca. B. sinica”, which has the highest μmax, would overgrow at a nitrite concentration
of > 17 - 30 μM, below which “Ca. K. stuttgartiensis”, which has the highest affinity to
NO2- (lowest Ks), would win the competition. That is why it was hypothesized that “Ca.
B. sinica” is a growth rate (r) strategist and “Ca. K. stuttgartiensis” is an affinity (K)
strategist (Strous et al., 1999). In contrast, “Ca. J. caeni” seems to be outcompeted by
other two species under any NO2- concentration, indicating the weakest competitor
among the three anammox species.
Competition in gel-immobilized column reactors
Population dynamics of “Ca. B. sinica”, “Ca. J. caeni” and “Ca. K. stuttgartiensis”
immobilized in PVA-SA gel beads cultured in up-flow column reactors were measured
using qPCR assays. In reactor G1 (NLR = 0.5 kg-N d-1 m-3) (Fig. 2, A1 - C1), a stable
coexistence of “Ca. B. sinica” and “Ca. J. caeni” was established during the competition
experiment. The two species similarly increased with time; hence their relative
abundances were virtually constant during the entire experiment. Only “Ca. K.
stuttgartiensis” population (one order of magnitude lower than “Ca. B. sinica” and “Ca.
J. caeni”) decreased gradually (Fig. 2, B1).
In reactor G2 (NLR = 0.7 kg-N d-1 m-3) (Fig. 2, A2 – C2), only “Ca. B. sinica”
population increased after a short lag phase of 8 d and dominated total anammox
population, while both populations of “Ca. J. caeni” and “Ca. K. stuttgartiensis”
continuously decreased with time (Fig. 2, B2). The similar dominance of “Ca. B. sinica”
over “Ca. J. caeni” and “Ca. K. stuttgartiensis was observed in reactor G3 (NLR = 2.7
kg-N d-1 m-3) (Fig. 2, A3 - C3). It should be noted that the dominance of “Ca. B. sinica”

enrichment, growth kinetics and ecophysiology of anammox bacteria
112
over “Ca. J. caeni” and “Ca. K. stuttgartiensis could not be reverted by lowering the
NLR (data not shown).
Competition in MBRs
In MBR M1 (NLR = 0.07 kg-N d-1 m-3 and NO2- = 0.0 - 0.36 mM, Fig. 3, A1),
interestingly only “Ca. J. caeni” population increased with time, outcompeted “Ca. B.
sinica” and “Ca. K. stuttgartiensis”, and dominated the anammox population (Fig. 3, B1
and C1). “Ca. J. caeni” and “Ca. B. sinica” were unable to grow. The relative
abundances of “Ca. J. caeni”, “Ca. B. sinica”, and “Ca. K. stuttgartiensis” after 60 days
of cultivation were about 75%, 23%, and 2%, respectively.
In MBR M2 (NLR = 0.10 kg-N d-1 m-3 and NO2- = 0.0 - 3.88 mM, Fig. 3, A2), all three
species decreased gradually from the beginning of incubation, because the NLR was not
sufficiently high enough to support relatively high initial biomass concentrations (Fig. 3,
A2 and B2). However, a stable coexistence of “Ca. B. sinica” and “Ca. J. caeni” was
observed. The relative abundance has remained unchanged (ca. 50% each) for about 25
days, but thereafter the “Ca. B. sinica” gradually displaced “Ca. J. caeni” (Fig. 3, C2).
Unexpected high nitrite concentrations appeared at the beginning of operation was
resulted from the lag phase of the anammox bacteria.
In MBR M3 (NLR = 0.14 kg-N d-1 m-3 and NO2- = 0.0 - 0.43 mM, Fig. 3, A3), only “Ca.
B. sinica” could maintain its population, while the populations of “Ca. J. caeni” and
“Ca. K. stuttgartiensis” gradually decreased due to low NLR (Fig. 3, A3 and B3). After
60 days of cultivation, “Ca. B. sinica” dominated (83%) the anammox populations, and
“Ca. J. caeni” accounted for 17% (Fig. 3, C3).
In MBR M4 (NLR = 0.17 - 0.42 kg-N d-1 m-3 and NO2- = 0.0 to 0.7 mM, Fig. 3, A4),
after a short lag phase, only “Ca. B. sinica” gradually increased to 87% of total
anammox population, whereas “Ca. J. caeni” and “Ca. K. stuttgartiensis” decreased
(Fig. 3, A4 and B4). The relative abundance of “Ca. J. caeni” decreased from ca. 50%
to 13% after 40 days of cultivation (Fig. 3, C4).
Competition in granular reactor
Self-aggregated anammox granules containing three anammox species were
established and cultivated in an up-flow column reactor to further investigate the
population dynamics under high nitrogen loading rates (NLR= 4.3 – 8.6 kg-N d-1 m-3

Chapter 5: Microbial competition among anammox bacteria in nitrite-limited bioreactors
113
and NO2- = 9 - 11 mM at the bottom of reactor) (Fig. 4A). “Ca. B. sinica” and “Ca. J.
caeni” were almost equally abundant in the original granules; however, the abundance
of “Ca. K. stuttgartiensis” was one order magnitude lower than others (Fig. 4B). After
100 days of cultivation, “Ca. B. sinica” outcompeted “Ca. J. caeni” and “Ca. K.
stuttgartiensis” and became the dominated species (94%) (Fig. 4C). This observation
was in good agreement with the competition results of GICR and MBR operated at
relatively high NLRs.
FISH analysis
FISH analysis revealed clear habitat segregation within gel beads and self-
aggregated granules. Gel beads taken from the GICR G1 at day 69 demonstrated a
spherical microcluster-like growth pattern of “Ca. J. caeni”, which were surrounded by
“Ca. B. sinica” cells (Fig. 5A). The microclusters of “Ca. J. caeni” were mainly present
in the inner part of the gel beads. The cells of “Ca. B. sinica” and “Ca. J. caeni”
distributed more or less evenly in the original granules at day 0 of competition
experiment (Fig. 5B). However, after 90 days of cultivation, “Ca. B. sinica” was found
to proliferate and dominate throughout granules, while “Ca. J. caeni” was mainly
present at the inner part of granules as spherical microclusters (Fig. 5C), similar with
the phenomenon observed in gel beads.
5.5 DISCUSSION
Different anammox genera or species have been seldom found in the same habitat or
engineered reactors. In addition, population shifts were frequently observed during
long-term cultivations in engineered reactors (Kartal et al., 2008, 2007, Park et al., 2015,
2010a, 2010b; van der Star et al., 2008). This clearly indicates a well-defined (but as yet
unknown) ecological niche for each anammox bacteria. However, only little is known
about the niche differentiation of anammox bacteria so far despite their ecological and
practical importance. To our best knowledge, this is the first study to systematically
investigate the interspecies competition of anammox bacteria. It was hypothesized that
difference in kinetic and physiological characteristics is one of the important key factors
determining the niche differentiation. To verify this hypothesis, population dynamics of
three phylogenetically distant anammox bacterial species, “Ca. B. sinica”, “Ca. J. caeni”
and “Ca. K. stuttgartiensis”, were experimentally measured in two types of nitrite-
limited reactors, a gel-immobilized column reactor (GICR) and membrane bioreactor

enrichment, growth kinetics and ecophysiology of anammox bacteria
114
(MBR), at different nitrogen loading rates (NLRs). In this study, anammox bacteria
simply competed for a common single substrate (i.e., nitrite). Effluent ammonium
concentrations in all competition experiments were higher than nitrite (0 mM - 3.88 mM)
because the medium with a NH4+: NO2
- ratio = 1 was used as the feed; therefore
ammonium was not a limiting substrate . Hence, competition and kinetics are of crucial
importance for the population dynamics.
The observed competition results demonstrated that the individual anammox species
was able to develop specific niches due to their different responses to different NLRs.
“Ca. B. sinica” was able to outcompete “Ca. J. caeni” and “Ca. K. stuttgartiensis” at
high NLRs in both GICR and MBR, whereas “Ca. J. caeni” was able to proliferate only
at low NLRs. The NLR is directly linked to the growth rate of anammox bacteria.
The specific growth rates of the three anammox species in nitrite-limited continuous
reactors were also simulated using the classical Monod model with the currently
available kinetic parameters Ks and μmax (Table 1). Although Monod growth curve is
not sufficient enough to describe the population dynamics of each species, it still could
simulate the specific growth rates upon substrates, which is the vital parameter in the
competition. As the simulation demonstrated, “Ca. B. sinica” possess higher specific
growth rate than “Ca. J. caeni” under any nitrite concentrations (Fig. 1). However, this
is in contradiction to the observed experimental results. The successful competition of
“Ca. J. caeni” at low NLR could not be sufficiently explained with the difference in the
currently available kinetic parameters, especially Ks, because the Ks values of both
species were virtually the same (Table 1). The Ks values of “Ca. J. caeni” might not be
accurate enough because it seems that it was determined from the flocculated biomass
(the average diameter was 150 μm) (Ali et al., 2015) and thus regarded as apparent one.
In fact, the Ks value is significantly affected from the existence of substrate diffusion
limitation (Lotti et al., 2014). In addition, the reported Ks values for “Ca. B. sinca” and
“Ca. K. stuttgartiensis” varied widely (Fig. 1).
A sensitivity analysis of substrate affinity to nitrite (Ks) for “Ca. J. caeni” with fixed
maximum specific growth rate (μmax) in Table 1 was performed and compared with “Ca.
B. sinica”. The tested Ks were 0.1, 5 and 35.6 ± 0.92 (original) μM (Fig. S1). To grow
over “Ca. B. sinica”, whose Ks ranges from 13 – 55 μM, Ks for “Ca. J. caeni” had to be
reduced to 5 μM and when nitrite concertation is below 4 μM, respectively. The nitrite
concentration in M1 reactor during the initial period (~ day 4) was mostly below the
detection limit (1 μM), makes it possible for “Ca. J. caeni” to grow opportunely by re-

Chapter 5: Microbial competition among anammox bacteria in nitrite-limited bioreactors
115
considering the Ks. Taken together, sensitive analysis implied that expected competition
result is greatly dependent on the accuracy of Ks. Therefore, a re-evaluation of Ks using
planktonic free-living enriched cells for “Ca. J. caeni” without any substrate limitation
is strongly recommended.
Kinetic parameters such as μmax and Ks for “Ca. B. sinica”, “Ca. J. caeni”, and “Ca. K.
stuttgartiensis” were determined at 37°C (Table 1), which was an optimum temperature
of all three species (Ali et al., 2015; Oshiki et al., 2011; van der Star et al., 2008). The
effect of temperature on the obtained competition results could be excluded.
Furthermore, since both “Ca. B. sinica” and “Ca. J. caeni” have been successfully
enriched and cultured using the same medium composition (Zhang et al., 2017), the
medium composition should not be a differentiating factor for these two species.
Besides the possible inaccuracy of affinity constant determined previously, the
discrepancy between the classical Monod model prediction and experimental data may
also suggest an extension of the Monod model by incorporating the concept of
maintenance metabolism (Fuchslin et al., 2012). Since anammox bacteria were growing
at low NLRs (i.e., low growth rates) in this study, under such conditions the microbial
maintenance (endogenous decay) rate significantly impacts on the microbial
competition (Füchslin et al., 2012; Müller and Babel, 1996; Tros et al., 1996; van
Bodegom, 2007). In M1 reactor, “Ca. B. sinica” was outcompeted but in M2 reactor, it
could maintain the same percentage with “Ca. J. caeni”, suggesting a higher minimum
substrate concentration (Smin) for “Ca. B. sinica” to maintain and grow.
According to the extended Monod model, the growth rate of anammox bacteria is
directly linked to the nitrogen removal rate and maintenance rate which was assumed to
be proportional to biomass concentration (X) (Tros et al., 1996).
rg = Y rs – m X = μmax (S / Ks + S) X – m X eq. (1)
where rg is biomass growth rate (g-biomass m-3 d-1), Y is true growth yield (g-biomass
formed g-substrate consumed-1), rs is substrate utilization rate (g-substrate m-3 d-1), μmax
is true maximum specific growth rate (d-1), S is a limiting substrate concentration (g m-
3), Ks is half saturation constant (g m-3), X is biomass concentration (g-biomass m-3),
and m is specific maintenance rate (or endogenous decay rate) (d-1). The net growth rate
(μnet ) can be obtained by dividing eq. (1) by X as μnet = μ – m. Thus, the biomass
growth in the reactors was determined from the specific growth rate (μ) and specific
maintenance rate (m).

enrichment, growth kinetics and ecophysiology of anammox bacteria
116
The substrate concentration at which the net bacterial growth is zero (Smin) can be
related to m and expressed as follows;
Smin = m Ks / (Y qmax – m) eq. (2)
where, qmax is maximum specific substrate utilization rate (g-substrate g-
biomass-1d-1). However, the specific maintenance rate, m, of anammox bacteria species
is currently lacking because of a limited numbers of enrichment cultures and
experimental difficulty for slow-growing anammox bacteria (Fuchslin et al., 2012).
Only a wide range of m values was reported for “Ca. B. sinica” (Table 1). In addition,
the maintenance rate was considered to be strain, substrate and growth conditions
dependent (Fuchslin et al., 2003; Tros et al., 1996). Thus, the m of anammox bacteria
should be accurately determined or simulated under specific conditions in order to
estimate the Smin and sufficiently predict the competition between “Ca. B. sinica” and
“Ca. J. caeni” at very low nitrite concentrations.
Functionally similar anammox bacteria cannot coexist in the same environment due to
competitive exclusion or niche differentiation unless spatial heterogeneity exists and/or
environmental conditions temporally fluctuate. The growth or coexistence of two
anammox species, “Ca. B. sinica” and “Ca. J. caeni”, was, however, observed under
low NLR conditions in both GICR (G1) and MBR (M1 and M2). In the GICR (G1),
spatial gradient (variation) of NO2- concentration within the gel bead could be expected
due to substrate transport limitation (i.e., low NO2- concentration inside gel beads),
which may support the coexistence of both species. FISH analysis of gel beads revealed
that “Ca. J. caeni” was mainly present in the inner part of gel (low NO2- environment)
as spherical microclusters, while “Ca. B. sinica” was present throughout the gel beads
(Fig. 5, A1 – A3). This spatial distribution supports the observed competition results
that “Ca. J. caeni” was able to proliferate only under low NLR conditions, suggesting
the inner part of gel beads might be suitable for the habitat of “Ca. J. caeni”.
Furthermore, a similar spatial distribution of two species was also observed in self-
aggregated granules (Fig. 5, C1 – C3). The clustered (aggregated) growth of “Ca. J.
caeni” could be simply related to nitrite limitation which stimulates bacteria to
aggregate (Wimpenny and Colasanti, 1997) and/or explained as a self-protection
process to create nitrite concentration scarcity when it was high (Nogueira and Melo,
2006). Other than this unique spatial distribution, the general outcomes of competitions
were consistent, suggesting the results be independent of reactor type and biomass form.

Chapter 5: Microbial competition among anammox bacteria in nitrite-limited bioreactors
117
The coexistence of both species “Ca. B. sinica” and “Ca. J. caeni” was also observed in
the MBR M1 and M2, even though no significant temporal fluctuation of NO2-
concentration was observed. In this study, bacterial cells were completely retained in the
MBR (no biomass withdraw, meaning no SRT control), and the MBR was operated at
very low NLRs. Thus, both species were growing at very low rates or barely
maintaining their populations (the biomass growth rate could be nearly equal to or lower
than the maintenance (endogenous decay) rate, see eq. (1)), suggesting low competitive
exclusion force. Under such conditions, both species could coexist or survive even in
MBR. However, “Ca. B. sinica” could slowly take over and dominate if the MBR was
operated much longer period as seen in Fig. 3 C2, suggesting a difference in the
species-specific maintenance rate.
Based on extensive analysis of the anammox 16S rRNA gene sequences in the public
databases, “Ca. Jettenia” was found to be the lowest abundant genus among all
anammox bacterial genera (Sonthiphand et al., 2014). Only two species (“Ca. j. caeni”
and “Ca. J. asiatica”) under the genus “Ca. Jettenia” have been identified and enriched
so far (Ali et al., 2015a; Quan et al., 2008). The least detection frequency of “Ca.
Jettenia” in natural and man-made ecosystems may related to the present competition
results demonstrating that “Ca. Jettenia” was the weakest competitor among all
anammox genera.
Even though the classical Monod model prediction revealed that “Ca. K.
stuttgartiensis” could outcompete other two anammox species at low nitrite
concentrations (< 17 - 30 μM), it failed to grow under all tested conditions in this study.
One possible explanation for this result would be that the initial abundance of “Ca. K.
stuttgartiensis” was the lowest (1 to 3 orders of magnitude lower than others) in all
experiments. In our laboratory, “Ca. B. sinica”, “Ca. J. caeni”, “Ca. Brocadia sp.”, and
“Ca. Scalindua japonica” (a marine species) could be successfully enriched so far (Ali
et al., 2015; Awata et al., 2013; Oshiki et al., 2013). However, the cultivation of “Ca. K.
stuttgartiensis” was never successful in our laboratory regardless of more than 10 year’s
continuous efforts. This suggests that other unknown factor(s) are missing, for example,
trace elements in water used for making culture medium might be missing. Apparently,
resolving this missing factor(s) is essential to further understand the niche
differentiation of anammox bacteria.
Application of the anammox process to main-stream municipal wastewater
treatment is one of the most interesting and challenging topics currently (Ali and Okabe,

enrichment, growth kinetics and ecophysiology of anammox bacteria
118
2015). In general, the main-stream municipal wastewater is characterized as low
temperature and low nitrogen loading rates. It seems reasonable to suggest that “Ca. J.
caeni”, instead of “Ca. B. sinica” be selected as candidate species for main-stream
application based on our observation, nevertheless, by considering a fluctuation in the
influent nitrogen loading rates, “Ca. B. sinica” might be more versatile though it’s
actual performance, especially under low temperature, should be carefully assessed in
the future.
5.6 CONCLUSIONS
Microbial competitions for a common substrate (nitrite) among three anammox bacteria
species were investigated in nitrite-limited GICR and MBR at different nitrogen loading
rates (NLRs). The following conclusions can be withdrawn;
“Ca. J. caeni” could proliferate only at low NLRs, whereas “Ca. B. sinica”
dominated anammox population at high NLRs in both reactors.
FISH analysis revealed that “Ca. J. caeni” was mainly present as spherical
microclusters in the inner part (low NO2- environment), whereas “Ca. B. sinica”
was present throughout gel beads and granules. This spatial distribution could
explain the coexistence of “Ca. B. sinica” and “Ca. J. caeni”.
The growth of “Ca. K. stuttgartiensis” could not be observed in all experimental
conditions in this study, indicating possible unknown factor(s) was missing.
The classical and extended Monod models could not appropriately explain the outcomes
of the competition experiments due to inaccuracy of kinetic parameters such as Ks for
nitrite and missing information of maintenance rate (m). Further (re)evaluation of these
kinetic parameters are required.

Chapter 5: Microbial competition among anammox bacteria in nitrite-limited bioreactors
119
Figure 5.1 The Monod growth curves of “Ca. B. sinica”, “Ca. J. caeni” and “Ca. K.
stuttgartiensis”. The specific growth rate (μ) was simulated as a function of a limiting
substrate (nitrite) concentration by using the Monod equation. It should be noted that
since the Ks values were associated with relatively high standard deviations, the Monod
growth curves were calculated using the upper and lower limit of Ks values for “Ca. B.
sinica”, “Ca. J. caeni” and “Ca. K. stuttgartiensis”.
0.000
0.004
0.008
0.012
0.016
0 50 100 150 200 250 300
"Ca. B. sinica (55)"
μ_J.caeni (36.52)
"Ca. K. stuttgartiensis"
“Ca. B. sinica”
“Ca. J. caeni”
“Ca. K. stuttgartiensis”
Nitrite concentration [μM]
Sp
ecific
gro
wth
rate
, μ
[h-1
]

enrichment, growth kinetics and ecophysiology of anammox bacteria
120
Figure 5.2 Population dynamics of “Ca. B. sinica”, “Ca. J. caeni” and “Ca. K.
stuttgartiensis” in gel-immobilized column reactor (GICR) at 37°C. A1- A3: Nitrogen
(NH4+ and NO2
-) loading rate (NLR) and removal rate (NRR) and nitrite concentration
01
02
03
04
05
0
"Ca
. B.
sin
ica
""C
a. J
. ca
en
i""C
a. K
. stu
ttg
art
ien
sis
"
0.0
0.5
1.0
1.5
2.0
0.0
0.5
1.0
1.5
2.0
01
02
03
04
05
0
NL
RN
RR
Nitri
te c
on
ce
ntr
atio
n
0.0
0.5
1.0
1.5
2.0
0.0
0.5
1.0
1.5
2.0
01
02
03
04
05
0
NL
RN
RR
Nitri
te c
on
ce
ntr
atio
n
-1.0
0.0
1.0
2.0
3.0
4.0
0.0
1.0
2.0
3.0
4.0
01
02
03
04
05
0
NL
RN
RR
Nitri
te c
on
ce
ntr
atio
n
01
02
03
04
05
0
"Ca
. B.
sin
ica
"
"Ca
. J.
ca
en
i"
"Ca
. K.
stu
ttg
art
ien
sis
"
01
02
03
04
05
0
"Ca
. B.
sin
ica
""C
a. J
. ca
en
i""C
a. K
. stu
ttg
art
ien
sis
"
10
8
10
7
10
6
10
5
01
02
03
04
05
0
"Ca
. B.
sin
ica
""C
a. J
. ca
en
i""C
a. K
. stu
ttg
art
ien
sis
"
NLR and NRR
[kg-N m-3
d-1
]
B1
16S rRNA gene copy numbers
[copies gel bead-1
]
B2
B3
Nitrite concentration [mM]
A1.
NLR
= 0
.5
01
02
03
04
05
0
"Ca
. B.
sin
ica
""C
a. J
. ca
en
i""C
a. K
. stu
ttg
art
ien
sis
"
Relative abundance [%]
01
02
03
04
05
0
"Ca
. B.
sin
ica
""C
a. J
. ca
en
i""C
a. K
. stu
ttg
art
ien
sis
"
C1
C2
C3
A3
. N
LR
= 2
.7A
2.
NLR
= 0
.7
Relative abundance [%]16S rRNA gene copy numbers
[copies gel bead-1
]
Tim
e (d
ay)
Tim
e (d
ay)
Tim
e (d
ay)
(2n
dy-a
xis
)
(2n
dy-a
xis
)(2
nd
y-a
xis
)
(2n
dy-a
xis
)
(2n
dy-a
xis
)(2
nd
y-a
xis
)
10
8
10
7
10
6
10
5
10
8
10
7
10
6
10
5
10
7
10
6
10
5
10
4
10
5
10
4
10
3
10
2
10
1
10
5
10
4
10
3
10
2
10
1
(2n
dy-a
xis
)
(2n
dy-a
xis
)
10
0
75
50
25 0
20
15
10 5 0
10
0
75
50
25 0
0.0
5
0.0
4
0.0
3
0.0
2
0.0
1
0
10
0
75
50
25 0
0.1
0
0.0
8
0.0
6
0.0
4
0.0
2
0
(2n
dy-a
xis
)
G1 r
eacto
rG
2 r
eacto
rG
3 r
eacto
r

Chapter 5: Microbial competition among anammox bacteria in nitrite-limited bioreactors
121
at the bottom of the column reactors. B1- B3: Population dynamics of “Ca. B. sinica”,
“Ca. J. caeni” and “Ca. K. stuttgartiensis” in GICRs. C1- C3: Relative abundance of
“Ca. B. sinica”, “Ca. J. caeni” and “Ca. K. stuttgartiensis”, which were calculated based
on the 16S rRNA gene copy numbers.
0 20 40 60
"Ca. B. sinica"
"Ca. J. caeni"
"Ca. K. stuttgartiensis"
0 20 40 60
"Ca. B. sinica""Ca. J. caeni""Ca. K. stuttgartiensis"
Nitrite
co
nce
ntr
atio
n [m
M]
0 10 20 30 40
"Ca. B. sinica"
"Ca. J. caeni"
"Ca. K. stuttgartiensis"
0.0
0.1
0.2
0.3
0.4
0.5
0.0
0.1
0.2
0 10 20 30 40
NLR
NRR
Nitrite concentration
B2
16
S rR
NA
ge
ne
co
py n
um
be
rs
[co
pie
s m
L-1
]
0.0
0.1
0.2
0.3
0.4
0.5
0.0
0.1
0.2
0 20 40 60
NLRNRRNitrite concentration
B1
A2. NLR = 0.10
16
S rR
NA
ge
ne
co
py n
um
be
rs
[co
pie
s m
L-1
]
NL
R a
nd
NR
R
[kg
-N m
-3d
-1]
0 10 20 30 40
"Ca. B. sinica"
"Ca. J. caeni"
"Ca. K. stuttgartiensis"
Re
lative
ab
un
dan
ce [%
]
Re
lative
ab
un
dan
ce [%
]
C1 C2
A1. NLR = 0.07
Time (day)Time (day)
(2nd y-axis)
(2nd y-axis)
(2nd y-axis)(2nd y-axis)
108
107
106
105
105
104
103
102
10
(2nd y-axis)
(2nd y-axis)
108
107
106
105
105
104
103
102
10
100
75
50
25
0
0.020
0.015
0.010
0.005
0
100
75
50
25
0
0.020
0.015
0.010
0.005
0
M1 reactor M2 reactor

enrichment, growth kinetics and ecophysiology of anammox bacteria
122
Figure 5.3 Population dynamics of “Ca. B. sinica”, “Ca. J. caeni” and “Ca. K.
stuttgartiensis” in MBRs at 37°C. A1- A4: Nitrogen (NH4+and NO2
-) loading rate (NLR)
and removal rate (NRR) and nitrite concentration in the bulk phase. B1 – B4:
Population dynamics of “Ca. B. sinica”, “Ca. J. caeni” and “Ca. K. stuttgartiensis” in
MBRs. C1 – C4: Relative abundance of “Ca. B. sinica”, “Ca. J. caeni” and “Ca. K.
stuttgartiensis”, which were calculated based on the 16S rRNA gene copy numbers.
0.00
0.25
0.50
0.75
1.00
0.0
0.2
0.4
0.6
0 10 20 30 40
NLRNRRNitrite concentration
0.00
0.25
0.50
0.75
1.00
0.0
0.2
0.4
0.6
0 20 40 60
NLR
NRR
Nitrite concentration
16
S rR
NA
ge
ne
co
py n
um
be
rs
[co
pie
s m
L-1
]
NL
R a
nd
NR
R
[kg
-N m
-3d
-1]
0 10 20 30 40
"Ca. B. sinica""Ca. J. caeni""Ca. K. stuttgartiensis"
Nitrite
co
nce
ntr
atio
n [m
M]
0 20 40 60
"Ca. B. sinica"
"Ca. J. caeni"
"Ca. K. stuttgartiensis"
B3 B4
A3. NLR = 0.14 A4. NLR = 0.17 – 0.42
Re
lative
ab
un
dan
ce [%
]
0 10 20 30 40
"Ca. B. sinica""Ca. J. caeni""Ca. K. stuttgartiensis"
Re
lative
ab
un
dan
ce [%
]
0 20 40 60
"Ca. B. sinica"
"Ca. J. caeni"
"Ca. K. stuttgartiensis"
C3 C4
16
S rR
NA
ge
ne
co
py n
um
be
rs
[co
pie
s m
L-1
]
Time (day) Time (day)
(2nd y-axis) (2nd y-axis)
(2nd y-axis)
(2nd y-axis)
(2nd y-axis) (2nd y-axis)
100
75
50
25
0
0.10
0.08
0.06
0.04
0.02
0
0.010
0.008
0.006
0.004
0.002
0
107
106
105
108
107
106
105
104
103
102
10
105
104
103
102
10
100
75
50
25
0
M3 reactor M4 reactor

Chapter 5: Microbial competition among anammox bacteria in nitrite-limited bioreactors
123
Figure 5.4 Population dynamics of “Ca. B. sinica”, “Ca. J. caeni” and “Ca. Kuenenia
stuttgartiensis” in self-aggregated granules in an up-flow column reactor at 37°C. A:
Nitrogen (NH4+and NO2
-) loading rate (NLR) and removal rate (NRR) and nitrite
concentration at the bottom of the column reactor. B: Population dynamics of “Ca. B.
sinica”, “Ca. J. caeni” and “Ca. K. stuttgartiensis” in the column reactor. C: Relative
abundance of “Ca. B. sinica”, “Ca. J. caeni” and “Ca. K. stuttgartiensis” in granules,
which were calculated based on the 16S rRNA gene copy numbers.
0 20 40 60 80 100
"Ca. B. sinica"
"Ca. J. caeni"
"Ca. K. stuttgartiensis"
0.0
5.0
10.0
15.0
20.0
0.0
5.0
10.0
15.0
0 20 40 60 80 100
NLR
NRR
Nitrite concentration
16
S rR
NA
ge
ne
co
py n
um
be
rs
[co
pie
s m
g-d
ry-w
eig
ht-
bio
mass
-1]
NL
R a
nd
NR
R
[kg
-N m
-3d
-1]
Nitrite
co
nce
ntr
atio
n [m
M]
B
A. NLR = 4.3 - 8.6
0 20 40 60 80 100
"Ca. B. sinica"
"Ca. J. caeni"
"Ca. K. stuttgartiensis"
Re
lative
ab
un
dan
ce [%
]
C
Time (day)
(2nd y-axis)
108
107
106
105
104
100
75
50
25
0
Granule reactor

enrichment, growth kinetics and ecophysiology of anammox bacteria
124
Figure 5.5 Fluorescence in situ hybridization (FISH) images of the cross sections of gel
beads and self-aggregated granules. The gel beads were taken from G1 reactor on day
69, and the granules were taken on day 0 and 90, respectively. In situ hybridization was
performed with tetramethylrhodamine-5-isothiocyanate (TRITC) labeled BRS211 probe
(red) for “Ca. B. sinica” and fluoresceine isothiocyanate (FITC) labeled JEC152 probe
(green) for “Ca. J. caeni” for all samples. A1 – A3: gel beads at day 69, B1 – B3: self-
aggregated granules at day 0, and C1 – C3: self-aggregated granules at day 90. “Ca. K.
stuttgartiensis” could not be detected in all experiments due to low abundance. “Surface”
means the surface of gel beads and granules. Scale bars indicate 20 μm (A), 50 μm (B),
and 50 μm (C, except for C1, 200 μm). (For color figures, the reader is referred to the
web version of this article).
A1 surfacesurfacesurface
20 μm
A2 A3G
el bead
at
69 d
ay
surfaceB1 B2 B3
50 μm
Gra
nule
s
at
0 d
ay
50 μm
surfaceC1 C2 C3
C2
C3
200 μm
surface
Gra
nule
s
at 90 d
ay
surface surface

Chapter 5: Microbial competition among anammox bacteria in nitrite-limited bioreactors
125
Table 5.1 Physiological characteristics of “Ca. Jettenia caeni”, “Ca. Brocadia sinica”
and “Ca. Kuenenia stuttgartiensis”.
Parametera “Ca. Jettenia
caeni”
“Ca. Brocadia
sinica”
“Ca. Kuenenia
stuttgartiensis”
Optimal Temp. (°C) 37 37 37
Growth pH 6.5 - 8.5 7.0 - 8.8 6.5 - 9.0
Biomass yield
(mmol-C [mmol-
NH4+]-1)
0.056 0.063 n.dd
µmax (h-1)b 0.0075 0.014 0.0096
Affinity constant
(Ks)c
NH4+ (µM) 17.1 ± 4.3 28 ± 4 n.d
NO2- (µM) 35.6 ± 0.92 34 ± 21 0.2 - 3
Maintenance rate,
m (h-1) n.d 0.0029 – 0.0081 n.d
Oxidiation rate
(μmol g-protein-1
min-1)
Formate 6.7 ± 0.6 n.d 5.8 ± 0.6
Acetate 0.79 ± 0.07 n.d 0.31 ± 0.03
Propionate 0.64 ± 0.05 n.d 0.12 ± 0.01
Tolerance
NO2- (mM) 11 <16 13, 25
NH4+ (mM) >20 n.d n.d
Sulfide (µM) 540 n.d 10 - 300
Salinity (mM) 68 mM <513 mM 50 - 200 mM
Reference Ali et al., 2015;
Zhang et al., 2017
Oshiki et al., 2011,
2013; Zhang et al.,
2017
Egli et al., 2001;
Strous et al., 2006;
Dapean-Mora et al.,
2007; van der Star et
al., 2008; Kartal et
al., 2007
a: The form of biomass used for characterizing “Ca. B. sinica” and “Ca. K.
stuttgartiensis” were suspended planktonic cells, for “Ca. J. caeni”, it was in flocculated
biomass with an average particle diameter at 150 μm;
b: μmax of “Ca. J. caeni” and “Ca. B. sinica” were determined based on temporal
increase in 16S rRNA gene copy numbers as determined by qPCR, for "Ca. K.
stuttgartiensis", the μmax was determined based on sludge retention time (SRT) control;
c: Ks for ammonium and nitrite were determined based on Michaelis–Menten kinetics;

enrichment, growth kinetics and ecophysiology of anammox bacteria
126
d: n.d; not determined.
5.7 REFERENCE
Ali, M. and Okabe, S., 2015. Anammox-based technologies for nitrogen removal:
Advances in process start-up and remaining issues. Chemosphere 141, 144–153.
Ali, M., Oshiki, M., Awata, T., Isobe, K., Kimura, Z., Yoshikawa, H., Hira, D.,
Kindaichi, T., Satoh, H., Fujii, T., Okabe, S., 2015a. Physiological characterization of
anaerobic ammonium oxidizing bacterium “Candidatus Jettenia caeni.” Environ.
Microbiol. 17, 2172–2189.
Ali, M., Oshiki, M., Rathnayake, L., Ishii, S., Satoh, H., Okabe, S., 2015b. Rapid and
successful start-up of anammox process by immobilizing the minimal quantity of
biomass in PVA-SA gel beads. Water Res. 79, 147–157.
Awata, T., Oshiki, M., Kindaichi, T., Ozaki, N., Ohashi, A., Okabe, S., 2013.
Physiological characterization of an anaerobic ammonium-oxidizing bacterium
belonging to the “Candidatus scalindua” group. Appl. Environ. Microbiol. 79, 4145–
4148.
Bollmann, A., Bar-Gilissen, M.-J., Laanbroek, H.J., 2002. Growth at low ammonium
concentrations and starvation response as potential factors involved in niche
differentiation among ammonia-oxidizing bacteria. Appl. Environ. Microbiol. 68, 4751–
4757.
Daims, H., Brühl, A., Amann, R., Schleifer, K.-H., Wagner, M., 1999. The domain-
specific probe eub338 is insufficient for the detection of all bacteria: development and
evaluation of a more comprehensive probe set. Syst. Appl. Microbiol. 22, 434–444.
Eaton, A.D., Franson, M.A.H., Association, A.P.H., Association, A.W.W., Federation,
W.E., 2005. Standard methods for the examination of water & wastewater, standard

Chapter 5: Microbial competition among anammox bacteria in nitrite-limited bioreactors
127
methods for the examination of water and wastewater. American Public Health
Association.
Egli, K., Fanger, U., Alvarez, P.J.J., Siegrist, H., van der Meer, J.R., Zehnder, A.J.B.,
2001. Enrichment and characterization of an anammox bacterium from a rotating
biological contactor treating ammonium-rich leachate. Arch. Microbiol. 175, 198–207.
Füchslin, H.P., Rüegg, I., Van Der Meer, J.R., Egli, T., 2003. Effect of integration of a
GFP reporter gene on fitness of Ralstonia eutropha during growth with 2,4-
dichlorophenoxyacetic acid. Environ. Microbiol. 5, 878–887.
Füchslin, H.P., Schneider, C., Egli, T., 2012. In glucose-limited continuous culture the
minimum substrate concentration for growth, Smin, is crucial in the competition
between the enterobacterium Escherichia coli and Chelatobacter heintzii, an
environmentally abundant bacterium. ISME J. 6, 777–789.
Hira, D., Toh, H., Migita, C.T., Okubo, H., Nishiyama, T., Hattori, M., Furukawa, K.,
Fujii, T., 2012. Anammox organism KSU-1 expresses a NirK-type copper-containing
nitrite reductase instead of a NirS-type with cytochrome cd1. FEBS Lett. 586, 1658–
1663.
Hu, B., Shen, L., Xu, X., Zheng, P., 2011. Anaerobic ammonium oxidation (anammox)
in different natural ecosystems. Biochem. Soc. Trans. 39, 1811–1816.
Ishii, S., Segawa, T., Okabe, S., 2013. Simultaneous quantification of multiple food-
and waterborne pathogens by use of microfluidic quantitative PCR. Appl. Environ.
Microbiol. 79, 2891–2898.
Jetten, M.S.M., Cirpus, I., Kartal, B., van Niftrik, L., van de Pas-Schoonen, K.T.,
Sliekers, O., Haaijer, S., van der Star, W., Schmid, M., van de Vossenberg, J., Schmidt,
I., Harhangi, H., van Loosdrecht, M., Gijs Kuenen, J., Op den Camp, H., Strous, M.,
2005. 1994-2004: 10 years of research on the anaerobic oxidation of ammonium.
Biochem. Soc. Trans. 33, 119–123.
Kartal, B., Rattray, J., van Niftrik, L. a, van de Vossenberg, J., Schmid, M.C., Webb,
R.I., Schouten, S., Fuerst, J. a, Damsté, J.S., Jetten, M.S.M., Strous, M., 2007.
Candidatus “Anammoxoglobus propionicus” a new propionate oxidizing species of
anaerobic ammonium oxidizing bacteria. Syst. Appl. Microbiol. 30, 39–49.
Kartal, B., van Niftrik, L., Rattray, J., van de Vossenberg, J.L.C.M., Schmid, M.C.,
Sinninghe Damsté, J., Jetten, M.S.M., Strous, M., 2008. Candidatus “Brocadia fulgida”:

enrichment, growth kinetics and ecophysiology of anammox bacteria
128
an autofluorescent anaerobic ammonium oxidizing bacterium. FEMS Microbiol. Ecol.
63, 46–55.
Kuypers, M.M.M., Sliekers, A.O., Lavik, G., Schmid, M., Jørgensen, B.B., Kuenen,
J.G., Sinninghe Damsté, J.S., Strous, M., Jetten, M.S.M., 2003. Anaerobic ammonium
oxidation by anammox bacteria in the Black Sea. Nature 422, 608–611.
Lotti, T., Kleerebezem, R., Lubello, C., van Loosdrecht, M.C.M., 2014. Physiological
and kinetic characterization of a suspended cell anammox culture. Water Res. 60, 1–14.
Ludwig, W., Strunk, O., Westram, R., Richter, L., Meier, H., Yadhukumar, Buchner, A.,
Lai, T., Steppi, S., Jobb, G., Förster, W., Brettske, I., Gerber, S., Ginhart, A.W., Gross,
O., Grumann, S., Hermann, S., Jost, R., König, A., Liss, T., Lüssmann, R., May, M.,
Nonhoff, B., Reichel, B., Strehlow, R., Stamatakis, A., Stuckmann, N., Vilbig, A.,
Lenke, M., Ludwig, T., Bode, A., Schleifer, K.-H., 2004. ARB: a software environment
for sequence data. Nucleic Acids Res. 32, 1363–1371.
Manz, W., Amann, R., Ludwig, W., Wagner, M., Schleifer, K.-H., 1992. Phylogenetic
Oligodeoxynucleotide Probes for the Major Subclasses of Proteobacteria: Problems and
Solutions. Syst. Appl. Microbiol. 15.
Matsumoto, S., Katoku, M., Saeki, G., Terada, A., Aoi, Y., Tsuneda, S., Picioreanu, C.,
van Loosdrecht, M.C.M., 2010. Microbial community structure in autotrophic nitrifying
granules characterized by experimental and simulation analyses. Environ. Microbiol. 12,
192–206.
Müller, R.H., Babel, W., 1996. Growth rate-dependent expression of phenol-
assimilation pathways in Alcaligenes eutrophus JMP 134 - the influence of formate as
an auxiliary energy source on phenol conversion characteristics. Appl. Microbiol.
Biotechnol. 46, 156–162.
Neumann, S., Wessels, H.J.C.T., Rijpstra, W.I.C., Sinninghe Damsté, J.S., Kartal, B.,
Jetten, M.S.M., van Niftrik, L., 2014. Isolation and characterization of a prokaryotic cell
organelle from the anammox bacterium Kuenenia stuttgartiensis. Mol. Microbiol. 94,
794–802.
Nogueira, R., Melo, L.F., 2006. Competition between Nitrospira spp. and Nitrobacter
spp. in nitrite-oxidizing bioreactors. Biotechnol. Bioeng. 95, 169–175.

Chapter 5: Microbial competition among anammox bacteria in nitrite-limited bioreactors
129
Okabe, S., Oshiki, M., Takahashi, Y., Satoh, H., 2011. N2O emission from a partial
nitrification–anammox process and identification of a key biological process of N2O
emission from anammox granules. Water Res 45, 6461–6470.
Oshiki, M., Awata, T., Kindaichi, T., Satoh, H., Okabe, S., 2013. Cultivation of
planktonic anaerobic ammonium oxidation (anammox) bacteria using membrane
bioreactor. Microbes Environ. 28, 436–443.
Oshiki, M., Satoh, H., Okabe, S., 2016. Ecology and physiology of anaerobic
ammonium oxidizing bacteria. Environ. Microbiol. 18, 2784–2796.
Oshiki, M., Shimokawa, M., Fujii, N., Satoh, H., Okabe, S., 2011. Physiological
characteristics of the anaerobic ammonium-oxidizing bacterium “Candidatus Brocadia
sinica.” Microbiology 157, 1706–1713.
Oshiki, M., Shinyako-Hata, K., Satoh, H., Okabe, S., 2015. Draft genome sequence of
an anaerobic ammonium-oxidizing bacterium,“Candidatus Brocadia sinica.” Genome
Announc. 3, 3–4.Copyright
Park, H., Rosenthal, A., Jezek, R., Ramalingam, K., Fillos, J., Chandran, K., 2010.
Impact of inocula and growth mode on the molecular microbial ecology of anaerobic
ammonia oxidation (anammox) bioreactor communities. Water Res. 44, 5005–5013.
Park, H., Sundar, S., Ma, Y., Chandran, K., 2015. Differentiation in the microbial
ecology and activity of suspended and attached bacteria in a nitritation-anammox
process. Biotechnol. Bioeng. 112, 272–279.
Pernthaler, J., Frank Oliver, G., Wilhelm, S., Rudolf, A., 2001. Fluorescence in situ
Hybridization (FISH) with rRNA-targeted Oligonucleotide Probes. Methods Microbiol.
Mar. Microbiol. 30, 207–226.
Quan, Z.-X., Rhee, S.-K., Zuo, J.-E., Yang, Y., Bae, J.-W., Park, J.R., Lee, S.-T., Park,
Y.-H., 2008. Diversity of ammonium-oxidizing bacteria in a granular sludge anaerobic
ammonium-oxidizing (anammox) reactor. Environ. Microbiol. 10, 3130–3139.
Schmid, M., Twachtmann, U., Klein, M., Strous, M., Juretschko, S., Jetten, M., Metzger,
J.W., Schleifer, K.H., Wagner, M., 2000. Molecular evidence for genus level diversity
of bacteria capable of catalyzing anaerobic ammonium oxidation. Syst. Appl. Microbiol.
23, 93–106.
Schmid, M., Walsh, K., Webb, R., Rijpstra, W.I., van de Pas-Schoonen, K., Verbruggen,
M.J., Hill, T., Moffett, B., Fuerst, J., Schouten, S., Sinninghe Damsté, J.S., Harris, J.,
enrichment, growth kinetics and ecophysiology of anammox bacteria
130
Shaw, P., Jetten, M., Strous, M., 2003. Candidatus “Scalindua brodae”, sp. nov.,
Candidatus “Scalindua wagneri”, sp. nov., Two New Species of Anaerobic Ammonium
Oxidizing Bacteria. Syst. Appl. Microbiol. 26, 529–538.
Schmid, M.C., Maas, B., Dapena, A., van de Pas-Schoonen, K., van de Vossenberg, J.,
Kartal, B., van Niftrik, L., Schmidt, I., Cirpus, I., Kuenen, J.G., Wagner, M., Sinninghe
Damste, J.S., Kuypers, M., Revsbech, N.P., Mendez, R., Jetten, M.S.M., Strous, M.,
2005. Biomarkers for In Situ Detection of Anaerobic Ammonium-Oxidizing (Anammox)
Bacteria. Appl. Environ. Microbiol. 71, 1677–1684.
Schmid, M.C., Risgaard-Petersen, N., van de Vossenberg, J., Kuypers, M.M.M., Lavik,
G., Petersen, J., Hulth, S., Thamdrup, B., Canfield, D., Dalsgaard, T., Rysgaard, S., Sejr,
M.K., Strous, M., den Camp, H.J.M.O., Jetten, M.S.M., 2007. Anaerobic ammonium-
oxidizing bacteria in marine environments: widespread occurrence but low diversity.
Environ. Microbiol. 9, 1476–1484.
Sonthiphand, P., Hall, M.W., Neufeld, J.D., 2014. Biogeography of anaerobic
ammonia-oxidizing (anammox) bacteria. Front. Microbiol. 5, 399.
Strous, M., Fuerst, J., Kramer, E., Logemann, S., Muyzer, G., Van de Pas-Schoonen, K.,
Webb, R., Kuenen, J., Jetten, M., 1999. Missing Lithotroph Identified as New
Planctomycete. Nature 400, 446–449.
Strous, M., Heijnen, J.J., Kuenen, J.G., Jetten, M.S.M., 1998. The sequencing batch
reactor as a powerful tool for the study of slowly growing anaerobic ammonium-
oxidizing microorganisms. Appl. Microbiol. Biotechnol. 50, 589–596.
Strous, M., Pelletier, E., Mangenot, S., Rattei, T., Lehner, A., Taylor, M.W., Horn, M.,
Daims, H., Bartol-Mavel, D., Wincker, P., Barbe, V., Fonknechten, N., Vallenet, D.,
Segurens, B., Schenowitz-Truong, C., Médigue, C., Collingro, A., Snel, B., Dutilh, B.E.,
Op den Camp, H.J.M., van der Drift, C., Cirpus, I., van de Pas-Schoonen, K.T.,
Harhangi, H.R., van Niftrik, L., Schmid, M., Keltjens, J., van de Vossenberg, J., Kartal,
B., Meier, H., Frishman, D., Huynen, M. a, Mewes, H.-W., Weissenbach, J., Jetten,
M.S.M., Wagner, M., Le Paslier, D., 2006. Deciphering the evolution and metabolism
of an anammox bacterium from a community genome. Nature 440, 790–794.
Tros, M.E., Bosma, T.N.P., Schraa, G., Zehnder, A.J.B., 1996. Measurement of
minimum substrate concentration (S(min)) in a recycling fermentor and its prediction

Chapter 5: Microbial competition among anammox bacteria in nitrite-limited bioreactors
131
from the kinetic parameters of Pseudomonas sp. strain B13 from batch and chemostat
cultures. Appl. Environ. Microbiol. 62, 3655–3661.
Tsushima, I., Ogasawara, Y., Kindaichi, T., Satoh, H., Okabe, S., 2007a. Development
of high-rate anaerobic ammonium-oxidizing (anammox) biofilm reactors. Water Res. 41,
1623–1634.
Tsushima, I., Ogasawara, Y., Shimokawa, M., Kindaichi, T., Okabe, S., 2007b.
Development of a super high-rate Anammox reactor and in situ analysis of biofilm
structure and function. Water Sci. Technol. 55, 9.
van Bodegom, P., 2007. Microbial maintenance: a critical review on its quantification.
Microb. Ecol. 53, 513–523.
van de Graaf, A.A., de Bruijn, P., Robertson, L.A., Jetten, M.S.M., Kuenen, J.G., 1996.
Autotrophic growth of anaerobic ammonium-oxidizing micro-organisms in a fluidized
bed reactor. Microbiology 142, 2187–2196.
van der Star, W.R.L., Miclea, A.I., van Dongen, U.G.J.M., Muyzer, G., Picioreanu, C.,
van Loosdrecht, M.C.M., 2008. The membrane bioreactor: a novel tool to grow
anammox bacteria as free cells. Biotechnol. Bioeng. 101, 286–294.
Villanueva, L., Speth, D.R., van Alen, T., Hoischen, A., Jetten, M.S.M., 2014. Shotgun
metagenomic data reveals significant abundance but low diversity of “Candidatus
Scalindua” marine anammox bacteria in the Arabian Sea oxygen minimum zone. Front.
Microbiol. 5, 31.
Wimpenny, J.W.T., Colasanti, R., 1997. A unifying hypothesis for the structure of
microbial biofilms based on cellular automaton models. FEMS Microbiol. Ecol.
Zhang, L., Narita, Y., Gao, L., Ali, M., Oshiki, M., Okabe, S., 2017. Maximum specific
growth rate of anammox bacteria revisited. Water Res. 116, 296–303.

enrichment, growth kinetics and ecophysiology of anammox bacteria
132
6 TREHALOSE ASSOCIATED
OSMOSTRESS RESPONSE IN
“CA. BROCADIA SINICA” AND
“CA. SCALINDUA JAPONICA”
This chapter has been summarized for submission as:
Zhang, L, Oshiki, M and Okabe, S. Trehalose associated osmostress response in “Ca.
Brocadia sinica” and “Ca. Scalindua japonica”.

Chapter 6: Trehalose associated osmostress response in “ca. brocadia sinica” and “ca. scalindua japonica”
133
6.1 Abstract
Anaerobic ammonium oxidizing (anammox) bacteria is the newly discovered
central contributor to global nitrogen cycle. They have a ubiquitous distribution cross a
variety of natural and man-made eco-systems. However, ecological niche differentiation
of anammox bacteria remains a black box despite its ecological and practical
importance. In this study, we systematically investigated the role of salinity in the niche
partitioning between “Ca. Brocadia sinica” and “Ca. Scalindua japonica”. Individual
adaptation and interspecific competition demonstrated the salinity as one important
differentiating factor. In addition, we found “Ca. B. sinica” synthesize up to 3.9 × 10⁻² ±
6.0 × 10⁻³ μmole mg-BSA-1 trehalose upon salinity increase, while “Ca. S. japonica”
significant incorporate K+ with limited production of trehalose. These findings lead to a
better understanding of niche partitioning from bioenergetic aspects and was able to
provide alternative views on natural distribution of anammox bacteria. Lastly,
phylogenetic analysis on trehalose biosynthesis (trehalose 6 phosphatase/trehalose 6
phosphate synthase pathways) implied the distinct distance between “Ca. B. sinica” and
“Ca. S. japonica”, raises the probability that this function be acquired from horizonal
gene transfer or faded during evolution.

enrichment, growth kinetics and ecophysiology of anammox bacteria
134
6.2 INTRODUCTION
Standing on 21,752 16S rRNA gene sequences compiled from 111 studies of
diverse physical environmental conditions, the major determinant of microbial
community composition is found to be salinity rather than temperature, pH, or other
physical and chemical factors (Lozupone and Knight, 2007). Although a recent study
demonstrated nitrogen loading rate as a factor in the niche differentiation of two
freshwater anaerobic ammonium oxidizing (anammox) bacterial species (“Ca. B. sinica”
and “Ca. J. caeni”) (Zhang et al., 2017a), a statistical study looking at over 6000
anammox 16S rRNA gene sequences from the public database, also indicated salinity as
the most important factor governing anammox bacterial distributions, with “Ca.
Scalindua” dominated in saline environments (mostly marine) while “Ca. Brocadia”
were mostly found in freshwater environments (Sonthiphand et al., 2014). However,
verification of salinity as a niche factor for anammox bacteria, especially between so-
called marine and freshwater anammox species, has never been systematically
investigated. Detailed understanding on the extent of the effect of salinity on adaptation,
genetic basis and ecological significance of anammox bacteria are all poorly understood
at this moment, despite its importance in understanding the contribution of anammox
bacteria to global nitrogen cycle. In fact, both “Ca. Brocadia” and “Ca. Scalindua” have
been identified in estuary area with a moderate salinity (Sonthiphand et al., 2014). One
study used a mixed population of “Ca. K. stuttgartiensis” and “Ca. S. wagneri” adapting
to 3% salinity, after up to one year’s operation still 70% of the anammox population
belongs to “Ca. K. stuttgartiensis” (Kartal et al., 2006a). These contradictory
observations stress the necessity for more precise physiological investigations to reveal
the role of salinity in niche partitioning of anammox bacteria.
Bacteria’s ability to adapt to fluctuations in the osmolarity of the growth
environment is of fundamental importance for their survival (Welsh et al., 1991). To
grow in high salinity environments, an intracellular osmolarity that is equal to or higher
than that of the surrounding environment is required (Oren, 1999). In general, high
intracellular osmotic pressure could be achieved either by uptake and accumulation of
inorganic ions such as K+ (salting-in strategy) or by in vivo synthesis and/or uptake of
compatible organic solutes (Nieto et al., 1998). It is acknowledged that the strategy of
organic osmotic solutes biosynthesis is energetically very expensive, the more so with
larger organic molecules such as disaccharides (12 carbon atoms) (Oren, 1999).
Therefore, the amount of energy needed to produce the osmotic solutes may greatly

Chapter 6: Trehalose associated osmostress response in “ca. brocadia sinica” and “ca. scalindua japonica”
135
exceed the energy requirement for the biosynthesis of cell components including
proteins, nucleic acid, cell walls, etc. In fact, the biomass yield efficiency of “Ca. S.
japonica” has been found to be salinity dependent (Awata et al., 2015), might suggest
the energy requirement of osmoadaptation. However, details regarding osmostress
response of anammox bacteria remains poorly understood at this moment and whether
and how this characteristic interferes with the niche partitioning in between either
remains to be investigated in more detail.
Here, two anammox species (“Ca. B. sinica” and “Ca. S. japonica”) were
focused on. Aiming to evaluate respective response to salinity between freshwater and
marine anammox species. We conducted several physiological characterizations
including continuous adaptation and interspecific competition combined with
physiological measurements and phylogenetic identification. From the results obtained,
we demonstrated that salinity is one key factor in niche partitioning between “Ca. B.
sinica” and “Ca. S. japonica”. Based on information from genomes and batch tests, we
found “Ca. B. sinica” synthesize trehalose, an extremely energy-expensive organic
compatible solute under salinity fluctuation. While “Ca. S. japonica” uptook K+ and
produce very limited trehalose under salinity change. Taken together, results obtained
here suggest that the trehalose associated osmostress response in “Ca. B. sinica” and
“Ca. S. japonica” could be one of the factor shaping the distinct niche upon salinity in
between.
6.3 MATERIALS AND MEHODS
Anammox bacteria
Planktonic cells of “Ca. B. sinica” (> 90%) and “Ca. S. japonica” (> 90%) were
enriched and cultivated using 2-liter MBRs (Mamoru Oshiki et al., 2013; Zhang and
Okabe, 2017) and operated at room temperature. In brief, MBR was equipped with a
hollow-fiber membrane unit composed of 300 polyethylene tubes (0.1 μm-pore, 1-mm
diam., 70-mm long tubes). A peristaltic pump MP-1000 (EYELA, Tokyo, Japan) was
directly connected to the membrane. Water level inside the reactor was controlled using
a water level sensor (HL-S1A, ASONE, Japan). The culture medium inside the MBR

enrichment, growth kinetics and ecophysiology of anammox bacteria
136
was kept mixed using a magnetic stirrer working at 200 rpm. To avoid the
contamination of oxygen, mixed gas (Ar: CO2 = 95:5) was purged into the cell culture
at a flowrate of 10 ml min-1. Throughout the cultivation, pH was not controlled but it
was always maintained within the range of 7.0 - 8.0. The inorganic nutrient medium
was supplied containing (mg L-1): FeSO4·7H2O (9.0), EDTA·4Na (5.0), NaCl (1.0),
KCl (1.4), CaCl2·2H2O (1.4), MgSO4·7H2O (1.0), NaHCO3 (84), KH2PO4 (54). For “Ca.
S. japonica”, the inorganic nutrient medium was supplied with 20 g L-1 of SEALIFE
(Marine Tech, Tokyo, Japan), an artificial sea salt, CaCl2·2H2O (114 mg L-1),
MgSO4·7H2O (99 mg L-1), KHCO3 (500 mg L-1), KH2PO4 (24.4 mg L-1), 0.5 mL L-1
trace element solution I & II (van de Graaf et al., 1996). The detailed information of the
artificial mineral medium of SEALIFE was described previously (Kindaichi et al., 2011;
Mamoru Oshiki et al., 2013).
Specific anammox activity (SAA) tests
SAA was measured according to previous description (Oshiki et al., 2011). In
brief, Biomass were collected and washed with mineral medium without NH4+ and NO2
-
for three times and 5 mL of biomass were dispensed into 12.5 mL glass serum vials
sealed with butyl rubber stoppers and aluminum caps. Gas in the headspace of the vials
was exchanged with highly pure Helium gas (>99.9999%) by vacuuming and purging
using a gas exchange equipment (model IP-8, SANSHIN, Yokohama, Japan). Vials
were incubated at room temperature for “Ca. S. japonica” and 37 °C for “Ca. B. sinica”
overnight to consume the residual ammonium and nitrite. Before batch tests, 14N-NH4Cl,
15N-NaNO2 were added from anoxic stock solutions to each vial using gas tight syringe
(VICI, Baton Rouge, LA, USA). Salinity was adjusted by changing the concentration of
SEALIFE. Incubation was continued for 4 h. Fifty microliter of headspace gas was
collected at a frequency of one hour and subjected to a gas chromatograph (GCMS-
QP2010SE, Shimadzu, Japan) equipped with a CP-Pora Bond Q fused silica capillary
column (Agilent Technologies, Santa Clara, CA, USA), and m/z = 28, 29 and 30 were
monitored. Concentration of 28N2, 29N2, and 30N2 gas were determined by gas
chromatography mass spectrometry for quantitative analysis according to previous
description (Amano et al., 2007; Waki et al., 2010). The specific ammonium oxidation
rate was determined by measuring 29N2 production rate. Calculation was based on a
standard curve prepared with 30N2 standard gas (>98% purity, Cambridge Isotope

Chapter 6: Trehalose associated osmostress response in “ca. brocadia sinica” and “ca. scalindua japonica”
137
laboratories, Tewksbury, MA, USA) (M Oshiki et al., 2013). Biomass concentration
subjected to batch analysis was determined as protein concentration and converted to g-
VSS L-1 as described before (Oshiki et al., 2011). In brief, collected biomass was
subjected to centrifugation (18,200×g for 10 min) and the biomass pellet was
resuspended in 1 mL 10% (w/v) sodium dodecyl sulfate (SDS) solution. Protein
concentration in the supernatant was determined using Lowry method (LOWRY et al.,
1951) with DC protein Assay Kit (Bio-Rad) following manufacturer’s instruction. All
the anaerobic activity tests were carried out as duplicate.
Adaptation and competition in MBR
Before conducting competition experiment, culture of “Ca. B. sinica” and “Ca.
S. japonica” were first adapted to 1% salinity (increase/decrease salinity stepwisely).
For “Ca. B. sinica”, ammonium and nitrite concentration was started with 10 mM and
reduced to 5.0 mM upon increase of salinity, repectively. Nitrite concentration in bulk
phase was carefully monitored to avoid nitrite inhibition when increase the salinity. For
“Ca. S. japonica”, ammonium and nitrite concentration was kept at 10 mM along with
decrease of salinity.
After successful adaptation, two cultures were mixed as equal 16S rRNA gene
copy numbers. In the competition experiment, the inorganic nutrient medium was
supplied containing: 10 g L-1 of SEALIFE (Marine Tech, Tokyo, Japan) as 1% salinity,
CaCl2·2H2O (114 mg L-1), MgSO4·7H2O (99 mg L-1), KHCO3 (500 mg L-1), KH2PO4
(24.4 mg L-1), 0.5 mL/L trace element solution I&II (van de Graaf et al., 1996). The
ammonium and nitrite were started with 2 mM and increased to 8 mM stepwisely.
Chemical analysis
The water samples from bulk phase of the MBRs were collected, filtered
through 0.2-μm-pore membranes (Advantec, Tokyo, Japan), and analyzed for
concentration of NH4+, NO2
- and NO3- using ion-exchange chromatography (DX-100,
DIONEX, Sunnyvale, CA) with an Ionpac CS3 cation column and IonPac AS9 anion
column (Okabe et al., 2011). In addition, the NO2- concentrations from MBR were also

enrichment, growth kinetics and ecophysiology of anammox bacteria
138
measured colorimetrically according to the Standard Methods (Eaton et al., 2005).
Water quality of “Ca. S. japonica” culture and competition containing salinity was
measured only using colorimetric method according to standard methods (Eaton et al.,
2005) due to the high ionic strength of the medium. Nitrogen loading rate (NLR) and
nitrogen removal rate (NRR) were calculated as described previously (Tsushima et al.,
2007).
DNA extraction and quantitative PCR
Suspended biomass (2 ml) in MBR were collected routinely to following the
population dynamics in competition study. The biomass samples were centrifuged at
14000 rpm for 10 min and biomass pellets were preserved at -80°C till DNA extraction.
The DNA extraction was performed using Fast DNA spin kit (BIO101, Qbiogene,
Carlsbad, CA) per manufacturer’s instructions.
TaqMan qPCR assays were applied to target the 16S rRNA genes of “Ca. B.
sinica” and “Ca. S. japonica” to follow their population dynamics (Zhang et al., 2017b).
Possible contamination between two cultures were also confirmed using qPCR, where
no cross-contamination was observed (data not shown). The qPCR mixture (20 μL)
contained 10 μL of 2× Premix ExTaq (Takara Bio), 0.4 μL each forward and reverse
primers (10 μM), 0.8 μL TaqMan probe (10 μM), 0.4 μL of the 50× ROX Reference
Dye II (Takara Bio), and 2 μL template DNA. The qPCR was run in MicroAmp Optical
96-well reaction plates (Applied Biosystems) and ABI prism 7500 sequence detection
system (Applied Biosystems) with the following reaction conditions. 30 sec at 95°C,
followed by 40 cycles of 5 sec at 95°C and 34 sec at 60°C. The standard curves for
quantification were prepared by the 10-fold dilutions of plasmid DNA containing the
target gene molecules ranging from 107 to 103 copies/μl. The amplification efficiencies
were calculated as described previously (Ishii et al., 2013). “Ca. B. sinica” and “Ca. S.
japonica” possesses one rrn operon in their genomes, respectively (Oshiki et al., 2017,
2015).

Chapter 6: Trehalose associated osmostress response in “ca. brocadia sinica” and “ca. scalindua japonica”
139
Fluorescence in situ hybridization
Purity of the adapted enrichment culture of “Ca. B. sinica” and “Ca. S.
japonica” were examined using fluorescence in situ hybridization (FISH) analysis.
Oligonucleotide probe AMX820 was used to detect 16S rRNA gene of “Ca. B. sinica”
(Schmid et al., 2000, 2005). Probe Sca1129b was used to target 16S rRNA gene of “Ca.
S. japonica” (Kindaichi et al., 2011). The AMX820 and Sca1129b probes were
synthesized and labeled at the 5’ end with the tetramethylrhodamine (TRITC) or
fluorescein isothiocyanate (FITC) by TakaraBio. Biomass samples were collected from
the reactors and fixed in 4% paraformaldehyde solution as described previously
(Pernthaler et al., 2001). The fixed cells were washed three times with phosphate
buffered saline solution (pH 7.2) using filter column with 0.2-μm-pore black
polycarbonate membrane filters (25 mm-diam; Adventec). Hybridization was performed
according to the protocol described previously (Okabe et al., 1999). Cells were observed
under confocal laser scanning microscope (Fluoview FV 300, Olympus, Tokyo, Japan),
equipped with multi Ar laser (458nm, 488nm, 514nm), HeNe laser (543nm) and HeNe
laser (633nm). The image was analyzed by the software package (ver. 2.0) provided
with the microscope.
Genomic acquisition and phylogenetic analysis
Presence and absence of functional proteins related to ion transportation (Na+:
H+ antiporter, a multisubunit Na+:H+ antiporter similar to MnhABCDEFG and K+
uptake) and organic compatible compounds biosynthesis (glycerol, glycine betaine,
ectoine, glucosylglycerol, sucrose and trehalose) (Oren, 1999) were examined in
reported genomes of anammox species using blast protein search.
Protein sequences of trehalose 6 phosphatase/trehalose 6 phosphate synthase
from publicly available “Ca. S. japonica” genome were blasted using NCBI protein
blast. Protein sequences of other bacterial and archaeal combined with ones from
anammox species were aligned and used to construct a maximum likelihood tree in
Mega (Tamura et al., 2011).

enrichment, growth kinetics and ecophysiology of anammox bacteria
140
Quantification of Na+, K+ and trehalose measurements.
Biomass in the measurement of SAA was used for determining Intracellular
concentration of Na+, K+ and trehalose. Briefly, intracellular concentration of Na+ and
K+ was determined using inductively coupled plasma emission spectrometer (ICPE-
9000, Shimadzu, Japan). Extraction of intracellular Na+, K+ followed previous reports
(Youssef et al., 2014). In brief, 5 mL biomass suspension was collected and subjected to
centrifuge at 10 000 g and 10 min. cell pellets were washed in sterile isotonic NaCl
solution. After removal of all traces of medium, the pellet was frozen at -20ºC overnight
followed by thawing in 1 ml solution of 10% perchloric acid (PCA). Thawed pellets
were vortexed for 5 min, followed by incubation at room temperature for 2 hours during
which cells lysed and proteins precipitated. Extracts were then centrifuged at 10 000 g
for 15 min. Protein concentration was determined according to Lowry method. The
supernatant, containing the cell-free, protein-free, extract was used for quantification of
intracellular ions.
Intracellular trehalose concentration was determined after the SAA tests and
procedure was performed according to previous reports with little modification (Parrou
and François, 1997). Firstly, 5 mL biomass suspension was collected and subjected to
centrifuge (10 min at 10 000 g at 4 °C). Cell pellets were carefully drained to remove
the culture medium, resuspended in 0.25 mL of 0.25 M Na2CO3 using pipetting of
Eppendorf tubes, and incubated at 95 °C for 4 h. The mixture was brought to pH 5.2 by
addition of 0.15 mL of 1 M acetic acid and 0.6 mL of 0.2 M Na-acetate, pH 5.2. After
mixing, mixture was centrifuged at 14000 rpm for 10 min to recover the supernatant.
Concentration of trehalose in the supernatant was directly determined enzymatically
(Neves et al., 1994) using a commercially available trehalose assay kit (Megazyme,
Wicklow, Ireland). Protein concentration was determined using Lowery method.

Chapter 6: Trehalose associated osmostress response in “ca. brocadia sinica” and “ca. scalindua japonica”
141
6.4 RESULTS
Adaptation of “Ca. B. sinica” and “Ca. S. japonica” culture
Whether salinity is the factor of niche partitioning was illustrated by individual
adaptation and interspecific competition. Cultures of “Ca. B. sinica” and “Ca. S.
japonica” were firstly adapted to 1% salinity under room temperature (Fig. 1). In culture
of “Ca. B. sinica”, nitrogen loading rate was increased from 0.3 to 1.2 kg-N d-1 m-3 and
reduced to 0.3 kg-N d-1 m-3 when salinity started to increase till 1% (Fig. 1, A1). For
“Ca. B. sinica”, the whole adaptation process took up to 90 days before stable
performance could be obtained. Similarly, nitrogen loading rate in the culture of “Ca. S.
japonica” was maintained at 0.5 kg-N d-1 m-3 while salinity was gradually decreased
from 2% to 1% (Fig. 1, B1). Compared with “Ca. B. sinica”, this adaptation process for
“Ca. S. japonica” was considerably short (15 days). During the whole operation, nitrite
concentration in bulk phase was always maintained close to 0 mg L-1 to avoid nitrite
inhibition. The stoichiometry of nitrite to ammonium consumption was 1.25 ± 0.33 in
“Ca. B. sinica” culture, 1.23 ± 0.12 in “Ca. S. japonica” culture, respectively (Fig. 1,
A2&B2). The purity of both culture after successful adaptation was examined using
FISH as illustrated in Fig. 1, A3&B3. More than 95% purity for both cultures were
obtained.
Competition between “Ca. B. sinica” and “Ca. S. japonica”
Competition of adapted “Ca. B. sinica” and “Ca. S. japonica” at 1% salinity was
started by directly mixing equal quantity as 16S rRNA gene copy numbers (Fig. 2).
Nitrogen loading rate was increased from 0.08 to 0.51 kg-N d-1 m-3 (Fig. 2, A1). At day
20, we observed a sharp increase in the nitrite concentration up to 37 mg-N L-1 in bulk
phase (Fig. 2, A2), therefore nitrogen loading rate was reduced to 0.24 kg-N d-1 m-3 and
nitrite accumulation disappeared accordingly. Population dynamics corresponded
closely with the reactor performance. During the initial phase, we observed a constant
level of “Ca. S. japonica” 16S rRNA gene copy numbers with a dramatical decrease of
“Ca. B. sinica”. Thereafter, from day 16, “Ca. S. japonica” started growing

enrichment, growth kinetics and ecophysiology of anammox bacteria
142
exponentially and completely outcompeted “Ca. B. sinica” (relative abundance of “Ca.
S. japonica” increased from 45.9% at day 0 to 96.8% at day 33) (Fig. 2, A3).
Osmoadaptive capabilities inferred from genomes.
We queried the “Ca. B. sinica” and “Ca. S. japonica” genomes (Oshiki et al.,
2017, 2015) for genes putatively involved in osmoadaptation. For ion transportation, at
least two Na+ extrusion mechanisms employing the proton electrochemical gradient as
the driving force for exporting Na+ exist in the genome of “Ca. S. japonica”: A Na+: H+
antiporter of the NhaA, NhaD family, and a multisubunit Na+: H+ antiporter similar to
MnhABCDEFG. However, Na+: H+ antiporter of the NhaA, NhaD family was missing
in the genome of “Ca. B. sinica”. As for potassium uptake, 2 clusters similar to the
ATP-dependent low affinity K+ transporter (Trk) exist in both genomes, each consisting
of the membrane component TrkH and the NAD-binding component TrkA. A voltage-
gated K+ channel of the Kef-type, most probably functioning as a facilitated diffusion
K+ uniporter driven by the membrane potential (Youssef et al., 2014), was also
identified in both genomes.
On the other hand, genes responsible for compatibles organic solutes were also
examined in both genome. As shown in Table 1, we examined both genomes for genes
responsible for possible organic compatible solutes, including glycerol, glycine betaine,
ectoine, glucosylglycerol, sucrose and trehalose (Oren, 1999). Genes for glycerol,
glycine betaine, ectoine and sucrose are missing in both genomes. Genome of “Ca. B.
sinica” contained only one copy of glucosylglycerol-phosphate synthase (EC number:
2.4.1.213) part of the synthesizing system while “Ca. S. japonica” genome didn’t
possess related genes. More importantly, both genomes contain genes necessary for the
synthesis of trehalose (Table 2). Out of five mechanisms known for trehalose
biosynthesis (Avonce et al., 2006), three were identified in the genome of “Ca. B. sinica”
with one being found in the genome of “Ca. S. japonica”. In “Ca. S. japonica”, only
genes encoding TPS/TPP pathway were identified: the nucleotide triphosphate
diphosphatease (EC number: 3.6.1.9, KO number: K04765) responsible for converting
a-D-glucose-1P to UDP-glucose, trehalose 6-Phosphate synthase (EC number: 2.4.1.15,
KO number: K00697) responsible for converting UDP-Glucose to Trehalose 6-
phosphate, trehalose 6-phosphate phosphatase (EC number: 3.1.3.12, KO number:
K01087) responsible for converting trehalose 6-phosphate to trehalose. In the genome

Chapter 6: Trehalose associated osmostress response in “ca. brocadia sinica” and “ca. scalindua japonica”
143
of “Ca. B. sinica”, in addition to above TPS/TPP pathway, another two pathways were
identified. TreT pathway: Trehalose glucosyltransferase (EC number: 2.4.1.245, KO
number: K13057) responsible for converting ADP-glucose to trehalose. The third
pathway could be separated into two pathways using glycogen as the source with
different intermediates (maltooliogosyltrehalose or maltose). TreY/TreZ pathway:
maltooligosyl-trehalose synthase (TreY, EC number: 5.499.15, KO number: K06044)
responsible for converting glycogen into maltooligosyltrehalose and Maltooligosyl-
Trehalose Trehalohydrolase (TreZ, EC number: 3.2.1.141, KO number: K01236)
responsible for converting maltooligosyltrehalose to trehalose. TS pathway: maltose
alpha-D-glucosyltransferase / alpha-amylase (EC number: 3.2.1.1, KO number: K05343)
responsible for converting glycogen into maltose, maltose alpha-D-glucosyltransferase /
alpha-amylase (EC number: 5.499.16, KO number: K05343) responsible for converting
maltose to trehalose.
Specific anammox activity, trehalose biosynthesis and Na+, K+ uptake.
To experimentally identify and verify the osmoadaptative mechanisms adopted
by “Ca. B. sinica” and “Ca. S. japonica”, batch tests with measurement of specific
anammox activity (SAA), intracellular trehalose and K+ concentration were conducted
(Fig. 3 & 4). At 0% salinity, biomass of “Ca. B. sinica” had a SAA of 1816.1 ± 183.4
μmole g-VSS-1 h-1. At 0.5% salinity, the SAA maintained but reduced to 100.5 ± 36.2
μmole g-VSS-1 h-1 at 3% salinity. No SAA could be detected at 4%, 5% salinity and
negative control without substrates (Fig. 3A). Intracellular trehalose concentrations in
“Ca. B. sinica” cells were highest when grown at low salinities (0.5% and 1%), yielding
3.8 × 10⁻² ± 2.6 × 10⁻³ and 3.9 × 10⁻² ± 6.0 × 10⁻³ μmole mg-BSA-1, respectively (Fig.
3B). At 0% salinity, only 2.4 × 10⁻³ ± 1.5 × 10⁻⁴ μmole mg-BSA-1 trehalose was
produced. Interestingly, concentration of trehalose was rather constant at salinities
higher than 1%, yielding 1.7 × 10⁻² ± 3.0 × 10⁻⁴ to 2.4 × 10⁻² ± 9.9 × 10⁻⁴ μmole mg-
BSA-1. Intracellular Na+ concentration gradually increased from 1.2 ± 0.1 to 18.1 ± 4.3
μmole mg-BSA-1 from 0% to 4% salinity, but only slightly increased at 5% salinity,
yielding 19.5 ± 1.0 μmole mg-BSA-1. Intracellular K+ levels in “Ca. B. sinica” were

enrichment, growth kinetics and ecophysiology of anammox bacteria
144
relatively stable at all salinities examined yielding at around 0.2 μmole mg-BSA-1 (Fig.
3C).
In “Ca. S. japonica”, highest SAAs were observed from 0.5% to 2% salinities,
from 843.9 ± 89.3 to 889.3 ± 182.7 μmole g-VSS-1 h-1 (Fig. 4A). SAA was gradually
decreased by increasing salinity further to 5% as 527.9 ± 153.1 μmole g-VSS-1 h-1. No
SAA could be observed at 0% salinity and negative control. Salinity dependent
production of intracellular trehalose was also observed, but quite limited compared with
“Ca. B. sinica” (Fig. 4B). Trehalose concentrations increased from 1.4 × 10⁻³ ± 1.0 ×
10-3 (0.5%) to 5.2 × 10⁻³ ± 2.9 × 10⁻⁴ (5%) μmole mg-BSA-1. It’s interesting that though
with no SAA could be detected, trehalose level was higher at 0% salinity than 0.5%
salinity. Similar with “Ca. B. sinica”, Na+ gradually increased from 1.1 ± 0.1 to 24.1 ±
2.0 μmole mg-BSA-1 from 0% to 5% salinity. Interestingly, significant increase of
intracellular K+ concentration was observed for “Ca. S. japonica” (Fig. 4C). It increased
from 0.27 ± 0.01 to 0.78 ± 0.02 μmole mg-BSA-1 corresponding to 0.5% to 5% salinity.
Phylogenetic analysis of trehalose 6 phosphatase/trehalose 6
phosphate synthase system
Phylogenetic trees rooted by the trehalose 6 phosphatase/trehalose 6 phosphate
synthase protein sequences from “Ca. S. japonica” were constructed to illustrate the
evolutionary context of this osmoadaptative mechanism. For trehalose 6 phosphatase
and trehalose 6 phosphate synthase, online blast using protein sequences from “Ca. B.
sinica” and “Ca. S. japonica” only yields 21% and 30% similarity, respectively (data
not shown). Further, “Ca. B. sinica” proteins together with other freshwater anammox
species (i.e. “Ca. B. fulgida”, “Ca. B. sapporoensis”, “Ca. J. caeni” and “Ca. B.
caroliniensis”) formed a coherent cluster that was distantly away from “Ca. S. japonica”
and other bacterial and archaeal phyla (Fig. 5).

Chapter 6: Trehalose associated osmostress response in “ca. brocadia sinica” and “ca. scalindua japonica”
145
6.5 DISCUSSION:
Anammox species “Ca. B. sinica” and “Ca. S. japonica” in this study can
apparently carve out separate niches due to their differential responses to salinity. We
demonstrate that the following: (1) longer period is required for “Ca. B. sinica” to adapt
to saline condition. (2) weaker competency of adapted “Ca. B. sinica” compared with
“Ca. S. japonica” under saline condition. (3) species specific distribution of trehalose
biosynthetic and ion transportation capabilities in anammox bacteria. (4) Synthesis of
trehalose and K+ uptake in “Ca. B. sinica” and “Ca. S. japonica” responding to
osmostress, respectively and (5) a phylogenetic distinction exists between genus “Ca. S.
japonica” and other anammox species regarding trehalose 6 phosphatase/trehalose 6
phosphate synthase system.
Niche differentiation from bioenergetic aspects
Our study is for the first time be able to directly compare the physiological
response of two phylogenetically distinct anammox species (i.e. “Ca. B. sinica” and “Ca.
S. japonica”) to salinity fluctuation using highly enriched cultures. It took considerably
longer time for “Ca. B. sinica” (~ 3 months) to adapt to 1% salinity compared with “Ca.
S. japonica” (from 2% to 1%, 15 days). In mixed culture at 1% salinity, though adapted,
“Ca. B. sinica” was completely outcompeted by “Ca. S. japonica”. Salinity is therefore
a key factor in the niche partitioning between “Ca. B. sinica” and “Ca. S. japonica”.
Indeed, results of individual adaptation and mixed competition argues for the need to
employ considerations from bioenergetic aspects. Quantification of intracellular
trehalose and K+ concentration demonstrates that “Ca. B. sinica” synthesize trehalose
(up to 3.9 × 10⁻² ± 6.0 × 10⁻³ μmole mg-BSA-1) to respond to salinity change. Their
concentrations are highest at lower media salinities. Alternatively, “Ca. S. japonica” did
not synthesize much trehalose (up to 5.2 × 10⁻³ μmol mg-BSA-1) but uptaking K+
significantly upon salinity increase, highest concentration at higher salinities. Previous
studies has demonstrated the importance of trehalose as compatible solutes at lower
salinities (Regev et al., 1990). In fact, trehalose-accumulating cyanobacteria are mostly
filamentous strains isolated from terrestrial habitats or from freshwater and coastal areas
with low salinities, resulting in a mostly a rather low degree of salt resistance
(Hagemann, 2011). Besides osmolarity balancing, trehalose has also been found to
protect membrane and act as a stress response (Hershkovitz et al., 1991; Hincha and
enrichment, growth kinetics and ecophysiology of anammox bacteria
146
Hagemann, 2004). Role of trehalose is therefore could not be fully justified. The
concentration of K+ in “Ca. S. japonica” was generally lower compared with other
halophiles like Halobacteriales due to a lower concentration of salt medium (Awata et
al., 2013; Youssef et al., 2014). In current study, we observed a much higher
intracellular Na+ concentration than K+ (~ 30 times). Similar phenomenon was also
found in halophile Halomonas elongata (Vreeland et al., 1983). In most microorganisms,
a minimum concentration of Na+ is essential for growth. However, in case of high
intracellular Na+ concentration, all intracellular systems should be adapted to such
condition. Proteins in halophilic archaea have been found to highly adapted and
magnificently engineered to maintain proper functions in medium containing 2 to 5 M
inorganic salts (Dennis and Shimmin, 1997). This might be the reason “Ca. S. japonica”,
a halophile, could maintain stable SAA at moderate salinity. But for “Ca. B. sinica”,
high concentration of Na+ flooding into the cell resulted in a significant reduction of
SAA at salinity higher than 1%, should be the result of dysfunction of proteins. The
plateau of intracellular Na+ increase in Fig. 3C may indicate the self-protection by
tightening the cell membrane from “Ca. B. sinica” to avoid further increase in the Na+
concentration. However, molecular mechanism of this specific response to salinity
should be investigated further.
Trehalose is an alpha – linked disaccharide composed of 12 carbons. Roughly,
to synthesize two molecules trehalose from carbon dioxide by autotrophs, 218
molecules ATP is required to balance the osmolarity that can be compensated by 1
molecule KCl, only 0.50 – 0.67 ATP is required for accumulation (Oren, 1999).
Therefore, it could be explained as one of the reasons that energy allocation to trehalose
biosynthesis constrained the growth of “Ca. B. sinica”, resulting in being outcompeted
by “Ca. S. japonica” under 1% saline condition. As for the controversy phenomenon
observed before (Kartal et al., 2006b), it is considered that either because aggregated
granules were used which delay the selection rate due to diffusion limitation, or species
“Ca. Kuenenia stuttgartiensis” adopted ion transportation rather than trehalose synthesis
for osmoadaptation. But the latter one requires further verification.
Ecological significance inferred from osmoadaptation
Identification of trehalose associated osmostress response and analysis of its
phylogenetic affiliation was able to provide valuable insights into the natural
distribution of “Ca. B. sinica” and “Ca. S. japonica”. It is recognized that nutrients
levels including ammonium and nitrite are lower in marine environments (Beman and

Chapter 6: Trehalose associated osmostress response in “ca. brocadia sinica” and “ca. scalindua japonica”
147
Francis, 2006; Santoro et al., 2008) compared with freshwater environments including
man-made ecosystems like wastewater treatment plants (Dragon and Marciniak, 2010;
Martens-Habbena et al., 2009; van der Star et al., 2007). Therefore, it could be expected
that “Ca. S. japonica” tend to uptaking K+ instead of synthesizing large amount of
trehalose. So far, genus “Ca. Scalindua”, though considered as halophile, has never been
identified from salt environment higher than marine conditions (Hu et al., 2011;
Sonthiphand et al., 2014). Two factors might be involved. Anammox bacteria obtain
very limited amounts of energy from dissimilatory metabolism. Its electron donor
(ammonium) is relatively oxidized, so that only little energy could be gained. Further,
most of the energy generated has to be used to produce NADPH, reducing power
required for CO2 fixation (Oren, 1999), resulting a lower biomass yield value (0.063
mmol C [mmol N]-1, 0.03 mmol C [mmol N]-1 for “Ca. B. sinica” and “Ca. S.
japonica”, respectively). Therefore, though minor amount, production of trehalose may
still be a harsh burden for already “heavy-loaded” “Ca. S. japonica”. Meanwhile,
absence of nitrifiers (Oren, 1999) in high salt environment leads to less production of
nitrite, one key substrate for anammox bacteria, might further limit growth of anammox
bacteria under such condition. For freshwater anammox species from genera “Ca.
Brocadia”, “Ca. Jettenia”, “Ca. Kuenenia”, their distributions regarding salinity have
been limited to river estuaries with low salinities. This is not only because the not-yet-
ready intracellular systems for high salt concentrations, but also because of the huge
amounts of energy investment for trehalose biosynthesis if such strategy is the common
trait in between. Although adaptation experiment showed “Ca. B. sinica” was able to
adapt to saline condition, they could not survive due to interspecific competition, where
only robust growth matters. Interestingly, it is revealed from phylogenetic analysis that
group of freshwater anammox species was distinctly away from the marine species
regarding trehalose metabolisms. It may indicate such function in “Ca. S. japonica” was
faded out during evolution, but require further verification.
Engineering implication
Anammox bacteria has received considerable attention in industrial application
owing to its economic potential in reducing power and organic inputs for nitrogen
removal (Kartal et al., 2010). Saline is always expected in highly concentrated industrial
wastewater (landfill leachate, livestock wastewater, etc.) and sometime, municipal
wastewater. In Hongkong, sea water is used as a substitute for toilet flushing due to
lacking freshwater resource, resulting in an elevated salinity concentration in municipal

enrichment, growth kinetics and ecophysiology of anammox bacteria
148
wastewater to around 5-6 g/L (Wu et al., 2008) or higher if more sea water is directly
utilized (Chen et al., 2003). Previous works has demonstrated several successful
adaptation of anammox biomass to high saline environment (30 g/L) (Jin et al., 2011;
Kartal et al., 2006b). From the results of current work, it seems more energetically
beneficial and timely if “Ca. S. japonica” is used rather than “Ca. B. sinica” for saline
wastewater regarding nitrogen removal. Indeed, “Ca. S. japonica” demonstrated a stable
activity at high salinity (4 and 5%) where “Ca. B. sinica” completely lost its activity.
Such capacity is desired for salinity fluctuation. However, effects of other factors
including operating temperature, organic compounds, dissolved oxygen concentrations
and substrate concentrations from wastewater should be carefully assessed together for
further application.
6.6 CONCLUSION
This study highlights the role of salinity in the niche partitioning between “Ca. B. sinica”
and “Ca. S. japonica”, and provides ecological and engineering implications to the
observed difference in osmostress response.
The complexity and multiplicity of osmostress response in “Ca. B. sinica” and “Ca. S.
japonica” reported here, for the first time, partly revealed the physiological response of
anammox bacteria to salinity. Yet multiple unanswered questions were raised regarding
the origin and motivation of this distinct preference. Detailed biological mechanism of
osmostress response was still remained to be investigated. Nevertheless, main
conclusions could be withdrawn as follows:
i. It took considerably longer time for “Ca. B. sinica” (~3 months) to adapt to 1%
salinity compared with “Ca. S. japonica” (15 days). At 1% salinity, adapted
“Ca. B. sinica” could not compete with “Ca. S. japonica” for growth.
ii. “Ca. B. sinica” synthesize trehalose, an extremely energy expensive
compatible organics responding to salinity change. Alternatively, “Ca. S.
japonica” up taking K+ and produce much less trehalose.
iii. Trehalose associated osmostress response could limited competency of “Ca.
B. sinica” with “Ca. S. japonica”, one of the reasons shaping the distinct

Chapter 6: Trehalose associated osmostress response in “ca. brocadia sinica” and “ca. scalindua japonica”
149
niche upon salinity in between.
6.7 REFERENCES
Ali, M., Haroon, M.F., Narita, Y., Zhang, L., Rangel Shaw, D., Okabe, S., Saikaly, P.E.,
2016. Draft Genome Sequence of the Anaerobic Ammonium-Oxidizing Bacterium
“ Candidatus Brocadia sp. 40.” Genome Announc. 4, e01377-16.
doi:10.1128/genomeA.01377-16
Ali, M., Oshiki, M., Awata, T., Isobe, K., Kimura, Z., Yoshikawa, H., Hira, D.,
Kindaichi, T., Satoh, H., Fujii, T., Okabe, S., 2015. Physiological characterization
of anaerobic ammonium oxidizing bacterium “ C andidatus Jettenia caeni.”
Environ. Microbiol. 17, 2172–2189. doi:10.1111/1462-2920.12674
Amano, T., Yoshinaga, I., Okada, K., 2007. Detection of anammox activity and
diversity of anammox bacteria-related 16S rRNA genes in coastal marine sediment
in Japan. Microbes Environ. 22, 232–242. doi:http://doi.org/10.1264/jsme2.22.232
Avonce, N., Mendoza-Vargas, A., Morett, E., Iturriaga, G., 2006. Insights on the
evolution of trehalose biosynthesis. BMC Evol. Biol. 6, 109. doi:10.1186/1471-
2148-6-109
Awata, T., Kindaichi, T., Ozaki, N., Ohashi, A., 2015. Biomass Yield Efficiency of the
Marine Anammox Bacterium, “Candidatus Scalindua sp.,” is Affected by Salinity.
Microbes Environ. 30, 86–91. doi:10.1264/jsme2.ME14088
Awata, T., Oshiki, M., Kindaichi, T., Ozaki, N., Ohashi, A., Okabe, S., 2013.
Physiological characterization of an anaerobic ammonium-oxidizing bacterium
belonging to the “Candidatus scalindua” group. Appl. Environ. Microbiol. 79,
4145–4148. doi:10.1128/AEM.00056-13
Beman, J.M., Francis, C.A., 2006. Diversity of ammonia-oxidizing archaea and bacteria
in the sediments of a hypernutrified subtropical estuary: Bahía del Tóbari, Mexico.
Appl. Environ. Microbiol. 72, 7767–7777. doi:10.1128/AEM.00946-06
Chen, G.-H., Wong, M.-T., Okabe, S., Watanabe, Y., 2003. Dynamic response of
nitrifying activated sludge batch culture to increased chloride concentration. Water
Res. 37, 3125–35. doi:10.1016/S0043-1354(03)00207-0

enrichment, growth kinetics and ecophysiology of anammox bacteria
150
Dennis, P.P., Shimmin, L.C., 1997. Evolutionary divergence and salinity-mediated
selection in halophilic archaea. Microbiol. Mol. Biol. Rev. 61, 90–104.
Dragon, K., Marciniak, M., 2010. Chemical composition of groundwater and surface
water in the Arctic environment (Petuniabukta region, central Spitsbergen). J.
Hydrol. 386, 160–172. doi:10.1016/j.jhydrol.2010.03.017
Eaton, A.D., Franson, M.A.H., Association, A.P.H., Association, A.W.W., Federation,
W.E., 2005. Standard Methods for the Examination of Water & Wastewater,
Standard Methods for the Examination of Water and Wastewater. American Public
Health Association.
Gori, F., Tringe, S.G., Kartal, B., Machiori, E., Jetten, M.S.M., 2011. The metagenomic
basis of anammox metabolism in Candidatus “Brocadia fulgida.” Biochem. Soc.
Trans. 39, 1799–1804. doi:10.1042/BST20110707
Hagemann, M., 2011. Molecular biology of cyanobacterial salt acclimation. FEMS
Microbiol. Rev. 35, 87–123. doi:10.1111/j.1574-6976.2010.00234.x
Hershkovitz, N., Oren, A., Cohen, Y., 1991. Accumulation of trehalose and sucrose in
cyanobacteria exposed to matric water stress. Appl. Environ. Microbiol. 57, 645–
648.
Hincha, D.K., Hagemann, M., 2004. Stabilization of model membranes during drying
by compatible solutes involved in the stress tolerance of plants and
microorganisms. Biochem. J. 383, 277–283. doi:10.1042/BJ20040746
Hu, B., Shen, L., Xu, X., Zheng, P., 2011. Anaerobic ammonium oxidation (anammox)
in different natural ecosystems. Biochem. Soc. Trans. 39, 1811–1816.
doi:10.1042/BST20110711
Ishii, S., Segawa, T., Okabe, S., 2013. Simultaneous quantification of multiple food-
and waterborne pathogens by use of microfluidic quantitative PCR. Appl. Environ.
Microbiol. 79, 2891–2898. doi:10.1128/AEM.00205-13
Jin, R.-C., Ma, C., Mahmood, Q., Yang, G.-F., Zheng, P., 2011. Anammox in a UASB
reactor treating saline wastewater. Process Saf. Environ. Prot. 89, 342–348.
doi:10.1016/j.psep.2011.05.001
Kartal, B., Koleva, M., Arsov, R., van der Star, W., Jetten, M.S.M., Strous, M., 2006a.
Adaptation of a freshwater anammox population to high salinity wastewater. J.
Biotechnol. 126, 546–53. doi:10.1016/j.jbiotec.2006.05.012

Chapter 6: Trehalose associated osmostress response in “ca. brocadia sinica” and “ca. scalindua japonica”
151
Kartal, B., Koleva, M., Arsov, R., van der Star, W., Jetten, M.S.M., Strous, M., 2006b.
Adaptation of a freshwater anammox population to high salinity wastewater. J.
Biotechnol. 126, 546–53. doi:10.1016/j.jbiotec.2006.05.012
Kartal, B., Kuenen, J.G., van Loosdrecht, M.C.M., 2010. Engineering. Sewage
treatment with anammox. Science 328, 702–3. doi:10.1126/science.1185941
Kindaichi, T., Awata, T., Suzuki, Y., Tanabe, K., Hatamoto, M., Ozaki, N., Ohashi, A.,
2011. Enrichment Using an Up-flow Column Reactor and Community Structure of
Marine Anammox Bacteria from Coastal Sediment. Microbes Environ. 26, 67–73.
doi:10.1264/jsme2.ME10158
LOWRY, O.H., ROSEBROUGH, N.J., FARR, A.L., RANDALL, R.J., 1951. Protein
measurement with the Folin phenol reagent. J. Biol. Chem. 193, 265–75.
doi:10.1088/1751-8113/44/8/085201
Lozupone, C. a, Knight, R., 2007. Global patterns in bacterial diversity. Proc. Natl.
Acad. Sci. 104, 11436–11440. doi:10.1073/pnas.0611525104
Martens-Habbena, W., Berube, P.M., Urakawa, H., de la Torre, J.R., Stahl, D. a, 2009.
Ammonia oxidation kinetics determine niche separation of nitrifying Archaea and
Bacteria. Nature 461, 976–9. doi:10.1038/nature08465
Narita, Y., Zhang, L., Kimura, Z. ichiro, Ali, M., Fujii, T., Okabe, S., 2017. Enrichment
and physiological characterization of an anaerobic ammonium-oxidizing bacterium
“Candidatus Brocadia sapporoensis.” Syst. Appl. Microbiol.
doi:10.1016/j.syapm.2017.07.004
Neves, M.J., Terenzi, H.F., Leone, F.A., Jorge, J.A., 1994. Quantification of trehalose in
biological samples with a conidial trehalase from the thermophilic fungus
Humicola grisea var. thermoidea. World J. Microbiol. Biotechnol. 10, 17–19.
doi:10.1007/BF00357555
Nieto, N.J., Ventosa, A., Oren, A., 1998. Biology of Moderately Halophilic Aerobic
Bacteria 62, 504–544.
Okabe, S., Oshiki, M., Takahashi, Y., Satoh, H., 2011. N2O emission from a partial
nitrification–anammox process and identification of a key biological process of
N2O emission from anammox granules. Water Res 45, 6461–6470.
doi:http://dx.doi.org/10.1016/j.watres.2011.09.040

enrichment, growth kinetics and ecophysiology of anammox bacteria
152
Okabe, S., Satoh, H., Watanabe, Y., 1999. In situ analysis of nitrifying biofilms as
determined by in situ hybridization and the use of microelectrodes. Appl. Environ.
Microbiol. 65, 3182–3191. doi:10.2965/jswe.22.763
Oren, A., 1999. Bioenergetic aspects of halophilism. Microbiol. Mol. Biol. Rev. 63,
334–48.
Oshiki, M., Awata, T., Kindaichi, T., Satoh, H., Okabe, S., 2013. Cultivation of
Planktonic Anaerobic Ammonium Oxidation (Anammox) Bacteria Using
Membrane Bioreactor. Microbes Environ. 28, 436–443.
doi:10.1264/jsme2.ME13077
Oshiki, M., Ishii, S., Yoshida, K., Fujii, N., Ishiguro, M., Satoh, H., Okabe, S., 2013.
Nitrate-dependent ferrous iron oxidation by anaerobic ammonium oxidation
(anammox) bacteria. Appl. Environ. Microbiol. 79, 4087–93.
doi:10.1128/AEM.00743-13
Oshiki, M., Mizuto, K., Kimura, Z., Kindaichi, T., Satoh, H., Okabe, S., 2017. Genetic
diversity of marine anaerobic ammonium-oxidizing bacteria as revealed by
genomic and proteomic analyses of “ Candidatus Scalindua japonica.” Environ.
Microbiol. Rep. 9, 550–561. doi:10.1111/1758-2229.12586
Oshiki, M., Shimokawa, M., Fujii, N., Satoh, H., Okabe, S., 2011. Physiological
characteristics of the anaerobic ammonium-oxidizing bacterium “Candidatus
Brocadia sinica.” Microbiology 157, 1706–1713. doi:10.1099/mic.0.048595-0
Oshiki, M., Shinyako-Hata, K., Satoh, H., Okabe, S., 2015. Draft Genome Sequence of
an Anaerobic Ammonium-Oxidizing Bacterium,“Candidatus Brocadia sinica.”
Genome Announc. 3, 3–4. doi:10.1128/genomeA.00267-15.Copyright
Parrou, J.L., François, J., 1997. A simplified procedure for a rapid and reliable assay of
both glycogen and trehalose in whole yeast cells. Anal. Biochem. 248, 186–188.
doi:10.1006/abio.1997.2138
Pernthaler, J., Frank Oliver, G., Wilhelm, S., Rudolf, A., 2001. Fluorescence in situ
Hybridization (FISH) with rRNA-targeted Oligonucleotide Probes. Methods
Microbiol. Mar. Microbiol. 30, 207–226.
Regev, R., Peri, I., Gilboa, H., Avi-Dor, Y., 1990. 13C NMR study of the interrelation
between synthesis and uptake of compatible solutes in two moderately halophilic

Chapter 6: Trehalose associated osmostress response in “ca. brocadia sinica” and “ca. scalindua japonica”
153
eubacteria. Bacterium Ba1 and Vibro costicola. Arch. Biochem. Biophys. 278,
106–112. doi:10.1016/0003-9861(90)90237-S
Santoro, A.E., Francis, C.A., De Sieyes, N.R., Boehm, A.B., 2008. Shifts in the relative
abundance of ammonia-oxidizing bacteria and archaea across physicochemical
gradients in a subterranean estuary. Environ. Microbiol. 10, 1068–1079.
doi:10.1111/j.1462-2920.2007.01547.x
Schmid, M., Twachtmann, U., Klein, M., Strous, M., Juretschko, S., Jetten, M., Metzger,
J.W., Schleifer, K.H., Wagner, M., 2000. Molecular evidence for genus level
diversity of bacteria capable of catalyzing anaerobic ammonium oxidation. Syst.
Appl. Microbiol. 23, 93–106.
Schmid, M.C., Maas, B., Dapena, A., van de Pas-Schoonen, K., van de Vossenberg, J.,
Kartal, B., van Niftrik, L., Schmidt, I., Cirpus, I., Kuenen, J.G., Wagner, M.,
Sinninghe Damste, J.S., Kuypers, M., Revsbech, N.P., Mendez, R., Jetten, M.S.M.,
Strous, M., 2005. Biomarkers for In Situ Detection of Anaerobic Ammonium-
Oxidizing (Anammox) Bacteria. Appl. Environ. Microbiol. 71, 1677–1684.
doi:10.1128/AEM.71.4.1677-1684.2005
Sonthiphand, P., Hall, M.W., Neufeld, J.D., 2014. Biogeography of anaerobic
ammonia-oxidizing (anammox) bacteria. Front. Microbiol. 5, 399.
doi:10.3389/fmicb.2014.00399
Speth, D.R., Lagkouvardos, I., Wang, Y., Qian, P.Y., Dutilh, B.E., Jetten, M.S.M., 2017.
Draft Genome of Scalindua rubra, Obtained from the Interface Above the
Discovery Deep Brine in the Red Sea, Sheds Light on Potential Salt Adaptation
Strategies in Anammox Bacteria. Microb. Ecol. 74, 1–5. doi:10.1007/s00248-017-
0929-7
Speth, D.R., Russ, L., Kartal, B., op den Camp, H.J.M., Dutilh, B.E., Jetten, M.S.M.,
2015. Draft Genome Sequence of Anammox Bacterium “Candidatus Scalindua
brodae,” Obtained Using Differential Coverage Binning of Sequencing Data from
Two Reactor Enrichments. Genome Announc. 3, e01415-14.
doi:10.1128/genomeA.01415-14
Strous, M., Pelletier, E., Mangenot, S., Rattei, T., Lehner, A., Taylor, M.W., Horn, M.,
Daims, H., Bartol-Mavel, D., Wincker, P., Barbe, V., Fonknechten, N., Vallenet,
D., Segurens, B., Schenowitz-Truong, C., Médigue, C., Collingro, A., Snel, B.,
Dutilh, B.E., Op den Camp, H.J.M., van der Drift, C., Cirpus, I., van de Pas-

enrichment, growth kinetics and ecophysiology of anammox bacteria
154
Schoonen, K.T., Harhangi, H.R., van Niftrik, L., Schmid, M., Keltjens, J., van de
Vossenberg, J., Kartal, B., Meier, H., Frishman, D., Huynen, M. a, Mewes, H.-W.,
Weissenbach, J., Jetten, M.S.M., Wagner, M., Le Paslier, D., 2006. Deciphering
the evolution and metabolism of an anammox bacterium from a community
genome. Nature 440, 790–4. doi:10.1038/nature04647
Tamura, K., Peterson, D., Peterson, N., Stecher, G., Nei, M., Kumar, S., 2011. MEGA5:
Molecular evolutionary genetics analysis using maximum likelihood, evolutionary
distance, and maximum parsimony methods. Mol. Biol. Evol. 28, 2731–2739.
doi:10.1093/molbev/msr121
Tsushima, I., Ogasawara, Y., Kindaichi, T., Satoh, H., Okabe, S., 2007. Development of
high-rate anaerobic ammonium-oxidizing (anammox) biofilm reactors. Water Res.
41, 1623–1634. doi:10.1016/j.watres.2007.01.050
van de Graaf, A.A., de Bruijn, P., Robertson, L.A., Jetten, M.S.M., Kuenen, J.G., 1996.
Autotrophic growth of anaerobic ammonium-oxidizing micro-organisms in a
fluidized bed reactor. Microbiology 142, 2187–2196. doi:10.1099/13500872-142-
8-2187
van de Vossenberg, J., Woebken, D., Maalcke, W.J., Wessels, H.J.C.T., Dutilh, B.E.,
Kartal, B., Janssen-Megens, E.M., Roeselers, G., Yan, J., Speth, D., Gloerich, J.,
Geerts, W., van der Biezen, E., Pluk, W., Francoijs, K.-J., Russ, L., Lam, P.,
Malfatti, S. a, Tringe, S.G., Haaijer, S.C.M., Op den Camp, H.J.M., Stunnenberg,
H.G., Amann, R., Kuypers, M.M.M., Jetten, M.S.M., 2013. The metagenome of
the marine anammox bacterium “Candidatus Scalindua profunda” illustrates the
versatility of this globally important nitrogen cycle bacterium. Environ. Microbiol.
15, 1275–89. doi:10.1111/j.1462-2920.2012.02774.x
van der Star, W.R.L., Abma, W.R., Blommers, D., Mulder, J.-W., Tokutomi, T., Strous,
M., Picioreanu, C., van Loosdrecht, M.C.M., 2007. Startup of reactors for anoxic
ammonium oxidation: experiences from the first full-scale anammox reactor in
Rotterdam. Water Res. 41, 4149–63. doi:10.1016/j.watres.2007.03.044
Vreeland, R.H., Mierau, B.D., Litchfield, C.D., Martin, E.L., 1983. Relationship of the
internal solute composition to the salt tolerance of Halomonas elongata. Can. J.
Microbiol. 29, 407–414. doi:10.1139/m83-066
Waki, M., Yasuda, T., Suzuki, K., Sakai, T., Suzuki, N., Suzuki, R., Matsuba, K.,
Yokoyama, H., Ogino, A., Tanaka, Y., Ueda, S., Takeuchi, M., Yamagishi, T.,

Chapter 6: Trehalose associated osmostress response in “ca. brocadia sinica” and “ca. scalindua japonica”
155
Suwa, Y., 2010. Rate determination and distribution of anammox activity in
activated sludge treating swine wastewater. Bioresour. Technol. 101, 2685–90.
doi:10.1016/j.biortech.2009.10.081
Welsh, D.T., Reed, R.H., Herbert, R. a, 1991. The role of trehalose in the
osmoadaptation of Escherichia coli NCIB 9484: interaction of trehalose, K+ and
glutamate during osmoadaptation in continuous culture. J. Gen. Microbiol. 137,
745–750. doi:10.1099/00221287-137-4-745
Wu, Y., Tam, N.F.Y., Wong, M.H., 2008. Effects of salinity on treatment of municipal
wastewater by constructed mangrove wetland microcosms. Mar. Pollut. Bull. 57,
727–34. doi:10.1016/j.marpolbul.2008.02.026
Youssef, N.H., Savage-Ashlock, K.N., McCully, A.L., Luedtke, B., Shaw, E.I., Hoff,
W.D., Elshahed, M.S., 2014. Trehalose/2-sulfotrehalose biosynthesis and glycine-
betaine uptake are widely spread mechanisms for osmoadaptation in the
Halobacteriales. ISME J. 8, 636–649. doi:10.1038/ismej.2013.165
Zhang, L., Narita, Y., Gao, L., Ali, M., Oshiki, M., Ishii, S., Okabe, S., 2017a.
Microbial competition among anammox bacteria in nitrite-limited bioreactors.
Water Res. 125, 249–258. doi:10.1016/j.watres.2017.08.052
Zhang, L., Narita, Y., Gao, L., Ali, M., Oshiki, M., Okabe, S., 2017b. Maximum
specific growth rate of anammox bacteria revisited. Water Res. 116, 296–303.
doi:10.1016/j.watres.2017.03.027
Zhang, L., Okabe, S., 2017. Rapid cultivation of free-living planktonic anammox cells.
Water Res. 127, 204–210. doi:10.1016/j.watres.2017.10.029

enrichment, growth kinetics and ecophysiology of anammox bacteria
156
Table 6.1 Blast hit of genes related to organic compatible solutes regulation in the
genomes of “Ca. B. sinica” and “Ca. S. japonica”.
Organic compatible solutes
Anammox
species
Glyce
rol
Glycine
betaine
Ectoi
ne
Glucosylgly
cerol
Sucro
se
Trehal
ose
Refere
nce of
genom
e
“Ca. B.
sinica”
n.d*. n.d. n.d. n.d. n.d. Y (Oshiki
et al.,
2015)
“Ca. S.
japonica”
n.d. n.d. n.d. n.d. n.d. Y (Oshiki
et al.,
2017)
*n.d. not detected.

Chapter 6: Trehalose associated osmostress response in “ca. brocadia sinica” and “ca. scalindua japonica”
157
Table 6.2 Genomic evidence for ion transportation and trehalose biosynthesis in
anammox bacteria from sequenced genomes.
Genus Species
Genomic evidence
Referen
ce
Ion transportation Trehalose
biosynthesis
Na+:H+
antiporter
Multisubu
nit Na+:H+
antiporter
similar to
MnhABC
DEFG
K+
transport
ation
TPS/
TPP
Tr
eT
TreY/
TreZ
“Ca.
Scalin
dua”
“Ca. S.
japonica” Y Y Y Y N N
(Oshiki
et al.,
2017)
“Ca. S.
profunda” Y Y Y Y N N
(van de
Vossen
berg et
al.,
2013)
“Ca. S.
brodae” Y Y Y N Y N
(Speth
et al.,
2015)
“Ca. S. rubra” N Y Y N Y N
(Speth
et al.,
2017)
“Ca.
Kuene
nia”
“Ca. K.
stuttgartiensis” N Y Y Y Y Y
(Strous
et al.,
2006)
“Ca.
Jetteni
a”
“Ca. J. caeni” N Y Y Y Y Y
(Ali et
al.,
2015)
“Ca.
Brocad
ia”
“Ca. B. sinica” N Y Y Y Y Y
(Oshiki
et al.,
2015)
“Ca. B.
sapporoensis” Y Y Y Y Y Y
(Ali et
al.,
2016;
Narita
et al.,
2017)
“Ca. B.
fulgida” N Y N Y N Y
(Gori et
al.,
2011)

enrichment, growth kinetics and ecophysiology of anammox bacteria
158
Figure 6.1 Adaptation of “Ca. B. sinica” and “Ca. S. japonica” to 1% salinity. A1&B1:
Nitrogen loading, removal rates and salinity. A2&B2: temporal dynamic of
influent ammonium, nitrite and effluent ammonium, nitrite and nitrate
concentration. A3&B3: Confocal microscopic images of FISH analysis for adapted
free-living planktonic cells of “Ca. B. sinica” (A3) and “Ca. S. japonica” (B3) in
MBRs. Cells were hybridized with combination of TRITC-labeled AMX820 probe
(red) and FITC-labeled EUB mix probe (green) for “Ca. B. sinica” and FITC-
labeled EUB338 mix probe (green) and TRITC-labelled probe Sca1129b (red) for
“Ca. S. japonica”. Anammox bacteria were shown in yellow for both panels.
White bars indicate 20 and 10 μm.
0
0.5
1
1.5
2
2.5
3
0.0
0.3
0.6
0.9
1.2
1.5
0 50 100 150
"Ca. Brocadia sinica"
Nitrogen loading rate (NLR)
Nitrogen removal rate(NRR)
Salinity (%)
0
100
200
300
400
0 50 100 150
"Ca. Brocadia sinica" Influent Ammonium
Influent nitrite
Effluent ammonium
Effluent nitrite
Effluent nitrate
0
0.5
1
1.5
2
2.5
3
0.0
0.3
0.6
0.9
1.2
1.5
0 10 20 30 40 50
"Ca. Scalindua japonica"
Nitrogen loading rate (NLR)
Nitrogen removal rate(NRR)
Salinity (%)
0
100
200
300
0 10 20 30 40 50
"Ca. Scalindua japonica" Influent AmmoniumInfluent nitriteEffluent ammoniumEffluent nitriteEffluent nitrate
Days of operation
Nitro
ge
n l
oa
din
g a
nd
re
mo
val
rate
[kg
-N m
-3d
-1]
Nitro
ge
n l
oa
din
g a
nd
re
mo
val
rate
[kg
-N m
-3d
-1]
Sa
linity
[%]
Sa
linity
[%]
Co
nce
ntr
atio
n [
mg
-N L
-1]
Co
nce
ntr
atio
n [
mg
-N L
-1]
A1 B1
A2 B2
A3 B3

Chapter 6: Trehalose associated osmostress response in “ca. brocadia sinica” and “ca. scalindua japonica”
159
Figure 6.2 Reactor performance and population dynamics of “Ca. B. sinica” and “Ca. S.
japonica” after mixed as equal 16S rRNA gene copy numbers in MBR at 1% salinity
under room temperature. A: Nitrogen (NH4+and NO2
-) loading rate and removal rate
and salinity in the MBR. B: Temporal dynamic of influent ammonium, nitrite and
effluent ammonium, nitrite and nitrate concentration. C: Absolute population
dynamics and relative abundance (dash line) of “Ca. B. sinica” and “Ca. S.
japonica” in the MBR.
0
0.5
1
1.5
2
2.5
3
0.0
0.2
0.4
0.6
0.8
1.0
0 5 10 15 20 25 30
Mixed culture
Nitrogen loading rate (NLR)
Nitrogen removal rate(NRR)
Salinity (%)
0
30
60
90
120
150
0 5 10 15 20 25 30
Mixed culture
Influent Ammonium
Influent nitrite
Effluent ammonium
Effluent nitrite
Effluent nitrate
0%
20%
40%
60%
80%
100%
1.0E+08
1.0E+09
1.0E+10
0 10 20 30 40
Ca. Brocadia sinica
Ca. Scalindua japonica
16
S r
RN
Ag
ene
co
py
num
be
rs [
co
pie
s m
L-1
]
Re
lative
ab
und
ance
[%
]
Nitro
ge
n l
oa
din
g a
nd
re
mo
val
rate
[kg
-N m
-3d
-1]
Sa
linity
[%]
Co
nce
ntr
atio
n [
mg
-N L
-1]
Mixed culture
A
B
C
Days of operation

enrichment, growth kinetics and ecophysiology of anammox bacteria
160
Figure 6.3 Specific anammox activity (SAA), intracellular trehalose and Na+, K+
concentration of “Ca. B. sinica” at defined salinity. A: SAA of “Ca. B. sinica”
indicated by nitrogen gas production rates. B: Intracellular trehalose
concentration. C: Intracellular Na+ and K+ concentration. Batch tests were
performed as duplicate.
0.0E+00
2.0E-02
4.0E-02
6.0E-02
Nosubstrate
0% 0.5% 1% 2% 3% 4% 5%
0
500
1000
1500
2000
Nosubstrate
0% 0.5% 1% 2% 3% 4% 5%
“Ca. B. sinica”
“Ca. B. sinica”A
B
Tre
ha
lose
co
nce
ntr
atio
n
[μm
olm
g-B
SA
-1]
Sp
ecific
ana
mm
ox
activi
ty
[µm
ole
. g
-VS
S-1
. h
-1]
Salinity
0
0.2
0.4
0.6
0.8
1
0
5
10
15
20
25
30
Nosubstrate
(0%)
0% 0.50% 1% 2% 3% 4% 5%
"Ca. B. sinica"
Na+ K+
C
Intr
ace
llula
r io
n c
once
ntr
atio
n
[μm
olm
g-B
SA
-1]
Intr
ace
llula
r io
n c
once
ntr
atio
n
[μm
ol
mg
-BS
A-1
]

Chapter 6: Trehalose associated osmostress response in “ca. brocadia sinica” and “ca. scalindua japonica”
161
Figure 6.4 Specific anammox activity (SAA), intracellular trehalose and Na+, K+
concentration of “Ca. S. japonica” at defined salinity. A: SAA of “Ca. S. japonica”
indicated by nitrogen gas production rates. B: Intracellular trehalose
concentration. C: Intracellular Na+ and K+ concentration. Batch tests were
performed as duplicate.
0
0.2
0.4
0.6
0.8
1
0
5
10
15
20
25
30
Nosubstrate
(2.5%)
0% 0.50% 1% 2% 3% 4% 5%
"Ca. S. japonica"
Na+ K+
0.0E+00
2.0E-02
4.0E-02
6.0E-02
Nosubstrate
(2.5%)
0% 0.5% 1% 2% 3% 4% 5%
0
500
1000
1500
2000
Nosubstrate
(2.5%)
0% 0.5% 1% 2% 3% 4% 5%
“Ca. S. japonica”
“Ca. S. japonica”A
B
Tre
ha
lose
co
nce
ntr
atio
n
[μm
olm
g-B
SA
-1]
Sp
ecific
ana
mm
ox
activi
ty
[µm
ole
. g
-VS
S-1
. h
-1]
C
Intr
ace
llula
r io
n c
once
ntr
atio
n
[μm
ol
mg
-BS
A-1
]
Salinity
Intr
ace
llula
r io
n c
once
ntr
atio
n
[μm
olm
g-B
SA
-1]

enrichment, growth kinetics and ecophysiology of anammox bacteria
162
Figure 6.5 Maximum likelihood phylogenetic tree inferred from trehalose-6-phosphate
synthase/ trehalose-6-phosphatase protein sequence alignments for members of
anammox bacteria as well as other bacterial and archaeal species. The tree was rooted
using trehalose-6-phosphatase (A)/trehalose-6-phosphate synthase (B) protein
sequence of “Ca. B. sinica”. The scale bar represents the number of nucleotide
changes per sequence position. Pie charts at the nodes represent the confidence of
the branch topology results, and bootstrap values greater than 50% are filled in
black (the neighborjoining method, NJ, for the upper-left sector, the maximum-
likelihood method, ML, for the upper-right sector, or the maximum-parsimony
method, MP, for the bottom sector). 200, 1000, 200 resamplings for ML, NJ and
MP method, respectively.
A

Chapter 6: Trehalose associated osmostress response in “ca. brocadia sinica” and “ca. scalindua japonica”
163
Fig. 5 (continued).
B

enrichment, growth kinetics and ecophysiology of anammox bacteria
164
7 INTEGRATION AND
PERSPECTIVES
7.1 Integration
The experiments described in current thesis addressed several aspects of the
niche differentiation and eco-physiology of the anaerobic ammonium oxidizing
(anammox) bacteria. In chapters 3, a method for rapid cultivating anammox planktonic
cells was developed. In chapter 4, maximum specific growth rate of three anammox
species was re-evaluated. In chapter 5 and 6, factors effecting the niche partitioning of
anammox bacteria were systematically studied. In the light of the results obtained in
these chapters, several general conclusions and research directions with regard to
enrichment, specific growth rates, niche differentiation of anammox bacteria can be
made and discussed.
Enrichment
It is still not possible to achieve pure culture of anammox bacteria. Therefore,
for ecophysiologycal and biochemical study, enriched culture with high purity and
planktonic cells is essential. In this chapter, we developed a reliable method for
cultivating planktonic anammox cell with high purity within 35 days. The significance

Chapter 7: integration and perspectives
165
of this work is to provide much easier access of planktonic anammox culture to
researchers working on anammox. Along with the method development, we partly
characterized the growth pattern of anammox cells immobilized in gel beads, where we
found less aggregation occur compared with natural granules. This observation may
further facilitate the development of pure culture of anammox bacteria.
Maximum specific growth rate
Maximum specific growth rate is the essential information, not only in
practical application, but also for interpretation of microbial ecology and niche
differentiation. Several endevors have been input to this evaluation and measurement,
however, due to the lack of appropriate culture and measureing methods, no consistent
results could be obtained so far. Here we re-evaluated the maximum specific growth
rate of three phylogenetical different anammox species using planktonic cell culture and
immobilized gel beads combined with real time quantitative PCR targeting the
exponential growth period. As expected, much faster maximum specific growth rates
were obtained and the doubling time of anammox bacteria may actually approaching 2
days. Hence, may not be appropriate to be described as slow-growing bacteria.
Niche differentiation
In chapter 5 and chapter 6, we systematically investigated two factors in the
niche differentiation of anammox bacteria. In chapter 5, we operated three types of
reactors with different kind of biomass (suspended planktonic cells, biomass
immobilized in gel beads and naturally aggregated granules) under different nitrogen
loading rates (NLRs). Here we selected NLR because of the much easier operation
condition compared with nitrite concentrations, especially in MBR systems. In addition,
NLR is one of the parameters can be controlled in real wastewater treatment process,
therefore, applicable in the future for microbial manipulation. Population dynamics of
three anammox species from genera “Ca. Brocadia”, “Ca. Kuenenia” and “Ca. Jettenia”
were followed quantitatively using qPCR. Unexpectedly, “Ca. J. caeni” could
outcompete “Ca. B. sinica” at low NLR while at high NLR, “Ca. J. caeni” was
completely outcompeted by “Ca. B. sinica”. In addition, “Ca. K. stuttgatiensis” could
not grow under all NLRs supplied, argues for other more fundamental factors restricting

enrichment, growth kinetics and ecophysiology of anammox bacteria
166
the growth of this specific species. Although NLR was the controlling parameter, as the
limiting substrate, nitrite is the sole nutrient that anamox speciss are competeing for.
The over grow of “Ca. J. caeni” could not be simply explained by the Monod curves
since “Ca. B. sinica” possesses higher maximum specific growth rate and higher
affinity than “Ca. J. caeni” according to reported values. However, the accuracy if Ks
from “Ca. J. caeni” is arguable. It was measured using a culture with flocculated
biomass (average particle size at ~150 μm). Therefore, a much lower Ks is expected and
should be able to provide better understanding of the population dynamics. Another
factor is the maintenance rate of both species. According to the results obtained, it is
speculated that “Ca. B. sinica” possess higher maintenance rate than “Ca. J. caeni”,
therefore could not grow under limited NLR.
So far genus “Ca. scalinuda” were mostly detected in marine environments
requiring salinity. However, one study tried to adapt a mix culture containing “Ca.
Kuenenia” and “Ca. Scalindua” to high salinity condition, but after one year’s operation,
still 70% of biomass belongs to “Ca. Kuenenia”. Based on that, the author argued that
salinity is not a niche differencing factor for “Ca. Kuenenia” and “Ca. Scalindua”.
However, both survey from so far detected 16S rRNA gene sequences and
environmental detections suggested that salinity is the factor involved in “Ca. Scalindua”
and other genera. In chapter 6, we therefore systematically investigated whether salinity
is the differentiating factor between “Ca. Brocadia sinica” and “Ca. Scalindua japonica”.
Individual adaptation and interspecific competition demonstrated the salinity as one
important differentiating factor. In addition, we identified the osmoadaptive strategy
employed by “Ca. B. sinica” as trehalose synthesis and K+ uptake for “Ca. S. japonica”,
respectively. These findings lead to the understanding of niche partitioning from
bioenergetic aspects and was able to provide alternative views on natural distribution of
anammox bacteria. Lastly, phylogenetic analysis on trehalose biosynthesis (trehalose 6
phosphatase/trehalose 6 phosphate synthase pathways) implied the distinct distance
between “Ca. B. sinica” and “Ca. S. japonica”, raises the probability that this function
be acquired from horizonal gene transfer rather than an ancestral trait. As for the
phenomenon observed by Kartal et al., 2006, it is considered that either because
aggregated granules were used which delay the selection rate due to diffusion limitation,
or species “Ca. Kuenenia stuttgartiensis” adopted ion transportation rather than
trehalose synthesis for osmoadaptation. But the latter one requires further verification.

Chapter 7: integration and perspectives
167
Engineering implication.
At present, application of anammox process to real wastewater is attracting
great attention. Although the method developed in chapter 3 is mainly used for
physiological and biochemical experiments, accurate kinetic information could also be
obtained and is of importance for mathematical modelling and plant design. This is the
case of maximum specific growth rate determined in chapter 4. Information in chapter 5
and chapter 6 provided important and useful information for species selection for
specific waterwater (either with different NLR or different salinity). It is recommended
that high NLR influent be treated with “Ca. Brocadia sinica” while high salinity ones be
treated with “Ca. Scalindua japonica”.
7.2 Perspectives
In this endeavour, free-living planktonic anammox cell culture could be
cultivated rapidly. The maximum specific growth rate of three anammox species were
re-evaluated. And niche differentiation between anammox species were illustrated. Still
there is a lot of room in this research area that requires further attention from the
researchers.
Although single cell and high purity could be obtained for anammox bacteria at
this moment, pure culture is still necessary and essential to obtain more precise and
accurate information from anammox bacteria, particularly the growth kinetics. In
addition, with the development of genomic technology, single cell genomics may
applicable for anammox bacteria and more accurate description from genome and
transcription could be achieved.
Ecophysiology of anammox bacteria is still essential knowledge for
understanding their ecological significance and role in global nitrogen cycle. Definitely,
more planktonic cell culture from other anammox species are in a great demand to
explore the physiological diversity of anammox bacteria. And to interpret their natural
distribution. Indeed, combined with genomic information, more physiological trait
could be revealed and more insight could be provided.
Characteristics of “Ca. Sclindua” were far from enough despite their huge
contribution to global nitrogen cycle. Further efforts were required to study this unique
genus.

enrichment, growth kinetics and ecophysiology of anammox bacteria
168
7.3 Curriculum Vitae and List of publications:
Lei ZHANG was born in Shanghai, China in 1989. After attending the Tongji
university, he obtained his bachelor diploma as degree of engineering in the field of
water and wastewater treatment in 2012. In Hokkaido university, he studied
environmental engineering and microbiology and finished his studies with a Master’s
thesis on the microbial ecological competition regarding anaerobic ammonium
oxidizing (anammox) bacteria in 2014. Right after the Master course, he decided to
proceed to PhD course in the same laboratory and continued work on the eco-
physiology of anammox bacteria, which result in current thesis.
1. Rapid cultivation of free-living planktonic anammox cells
Zhang, L and Okabe, S. Water Research, 2017, 127, 204-210.
2. Microbial competition among anammox bacteria in nitrite-limited bioreactors
Zhang, L., Narita, Y., Gao, L., Ali, M., Oshiki, M., Ishii, S., Okabe, S. Water
Research, 2017, 125, 249-258.
3. Maximum specific growth rate of anammox bacteria revisited
Zhang, L., Narita, Y., Gao, L., Ali, M., Oshiki, M., Okabe S. Water Research,
2017, 116, 296-303.
4. Enrichment and physiological characterization of an anaerobic ammonium-
oxidizing bacterium 'Candidatus Brocadia sapporoensis'
Narita, Y., Zhang, L., Kimura, Z., Ali, M., Fujii, T., Okabe, S. Systematic and
Applied Microbiology, accepted (in press).
5. Draft genome sequence of the anaerobic ammonium-oxidizing bacterium
"Candidatus Brocadia sp. 40"
Ali, M, Haroon, M.F., Narita, Y., Zhang, L., Rangel Shaw, D., Okabe, S.,
Saikaly, P.E. Genome Announcements, 2016, 4(6), e01377-16.
6. Source identification of nitrous oxide emission pathways from a single-stage
nitritation-anammox granular reactor
Ali, M., Rathnayake, R.M., Zhang, L., Ishii, S., Kindaichi, T., Satoh, H., Toyoda,
S., Yoshida, N., Okabe, S. Water Research, 2016, 102, 147-157
7. Enrichment, growth kinetics and niche differentiation of anammox bacteria. Zhang,
L, Narita, Y and Okabe, S. (In preparation)

Chapter 7: integration and perspectives
169
8. Trehalose associated osmostress response in “Ca. Brocadia sinica” and “Ca.
Scalindua japonica”. Zhang, L, Oshiki, M and Okabe, S. (In preparation)