lecture 3.1 to 3.2 bt
TRANSCRIPT
Today’s Agenda
Attendance / Announcements
◦ Projects due at Start of Class
◦ Quiz Wednesday
◦ Need Graphing Calculators (TI-83,84,..)
Section 3.1, 3.2
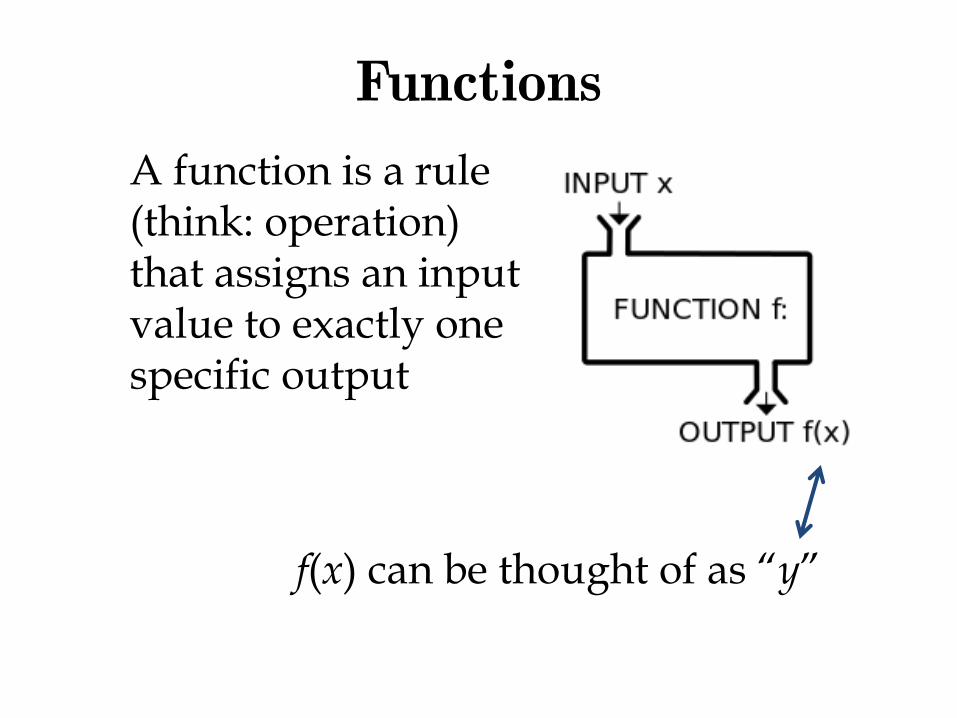
Functions
A function is a rule (think: operation) that assigns an input value to exactly one specific output
f(x) can be thought of as “y”
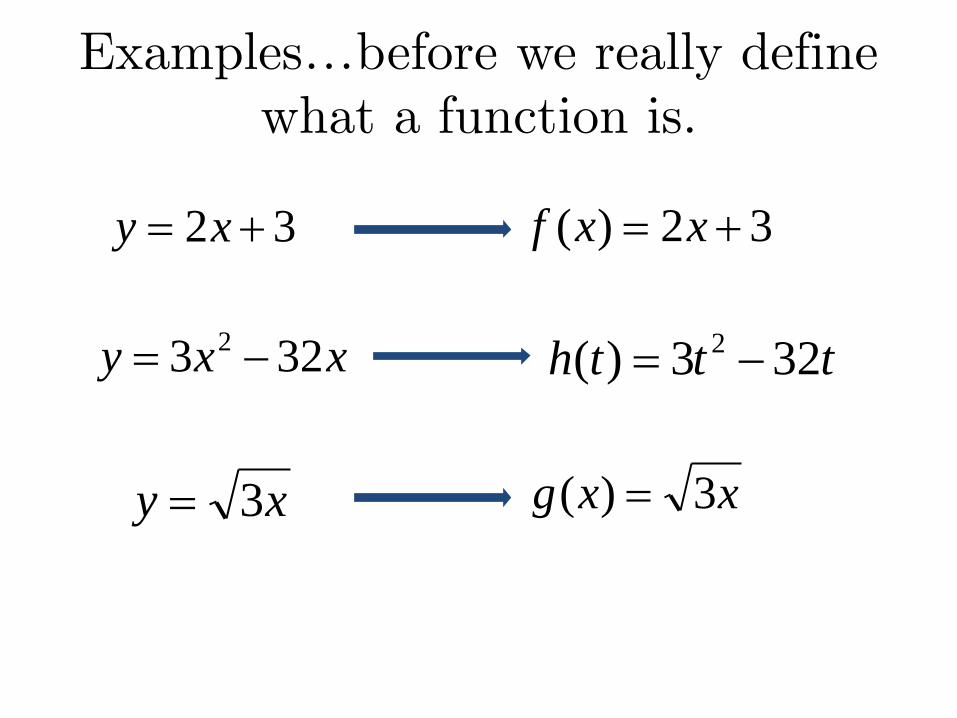
Examples…before we really define what a function is.
32 xy 32)( xxf
xxy 323 2 ttth 323)( 2
xy 3 xxg 3)(
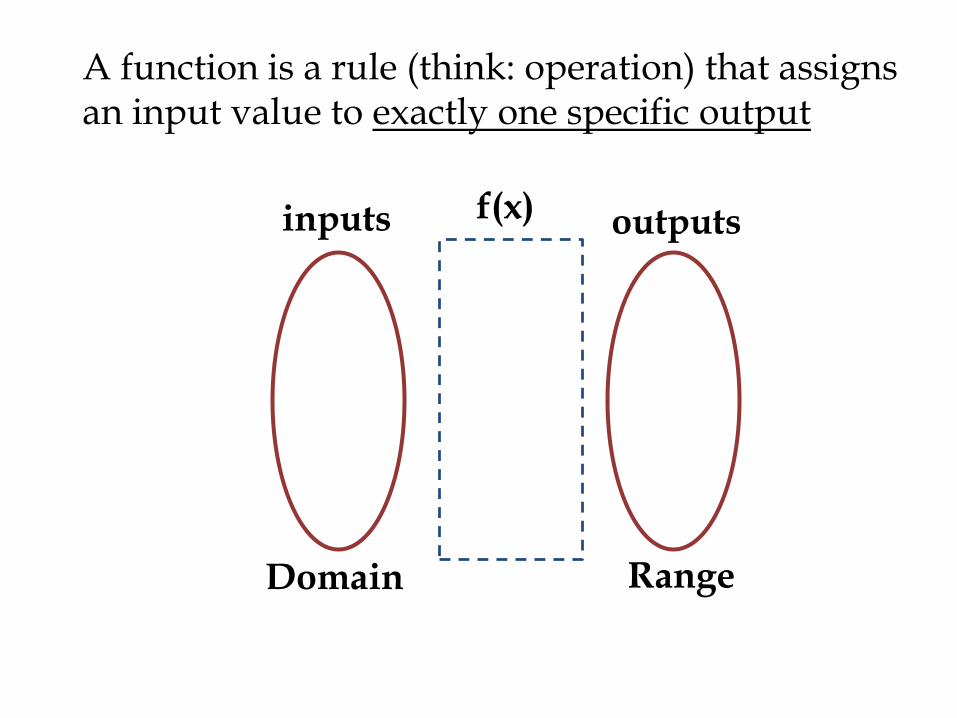
A function is a rule (think: operation) that assigns an input value to exactly one specific output
inputs outputsf(x)
Domain Range
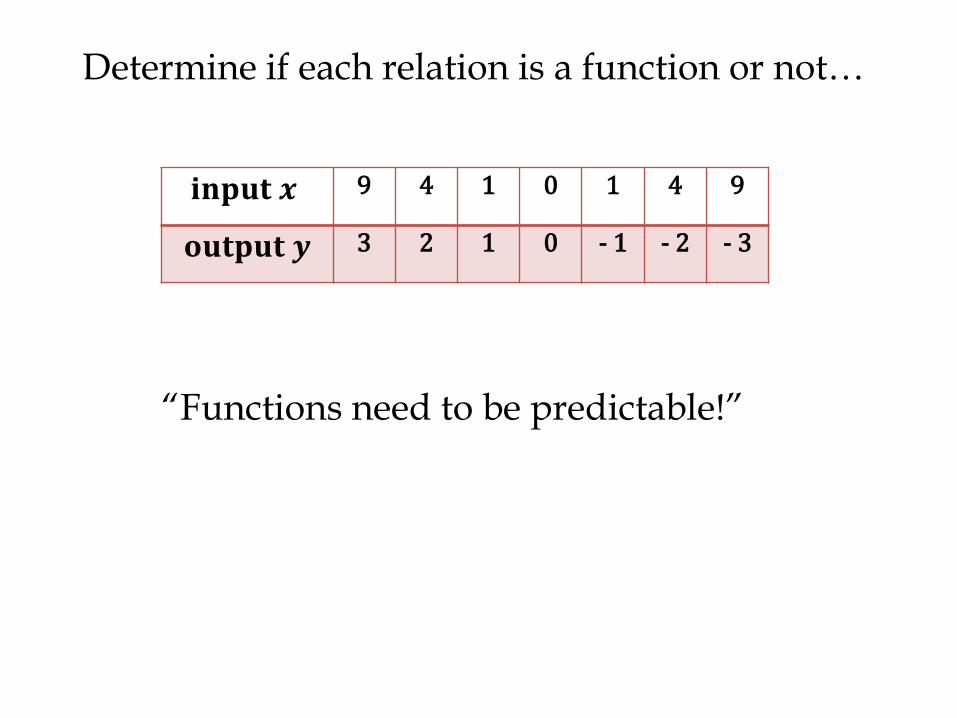
Determine if each relation is a function or not…
𝐢𝐧𝐩𝐮𝐭 𝒙 9 4 1 0 1 4 9
𝐨𝐮𝐭𝐩𝐮𝐭 𝒚 3 2 1 0 - 1 - 2 - 3
“Functions need to be predictable!”
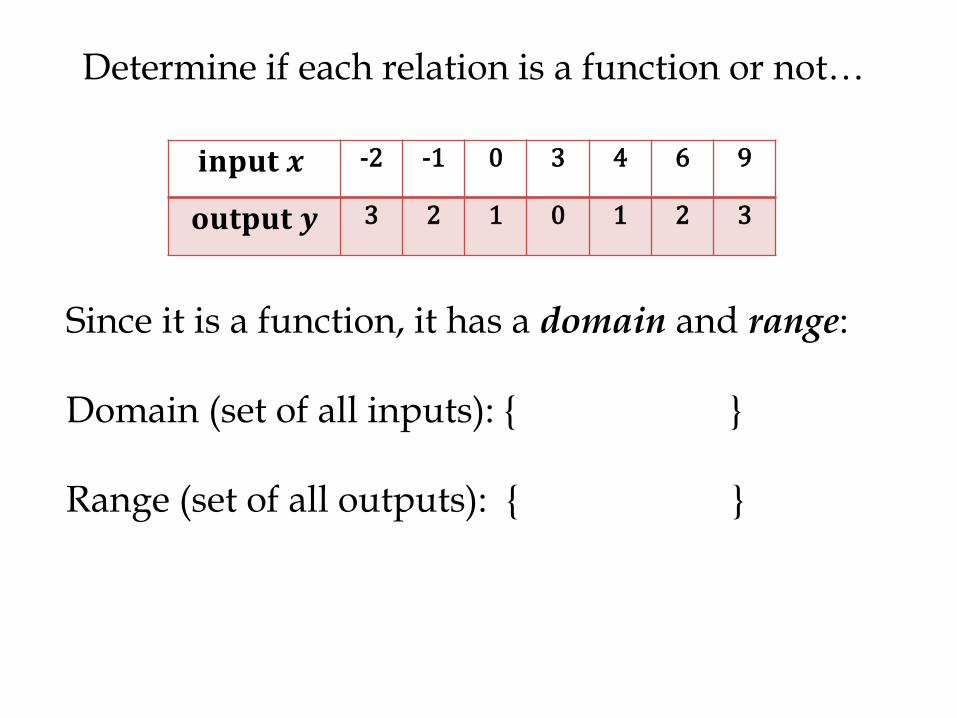
Determine if each relation is a function or not…
𝐢𝐧𝐩𝐮𝐭 𝒙 -2 -1 0 3 4 6 9
𝐨𝐮𝐭𝐩𝐮𝐭 𝒚 3 2 1 0 1 2 3
Since it is a function, it has a domain and range:
Domain (set of all inputs): { }
Range (set of all outputs): { }
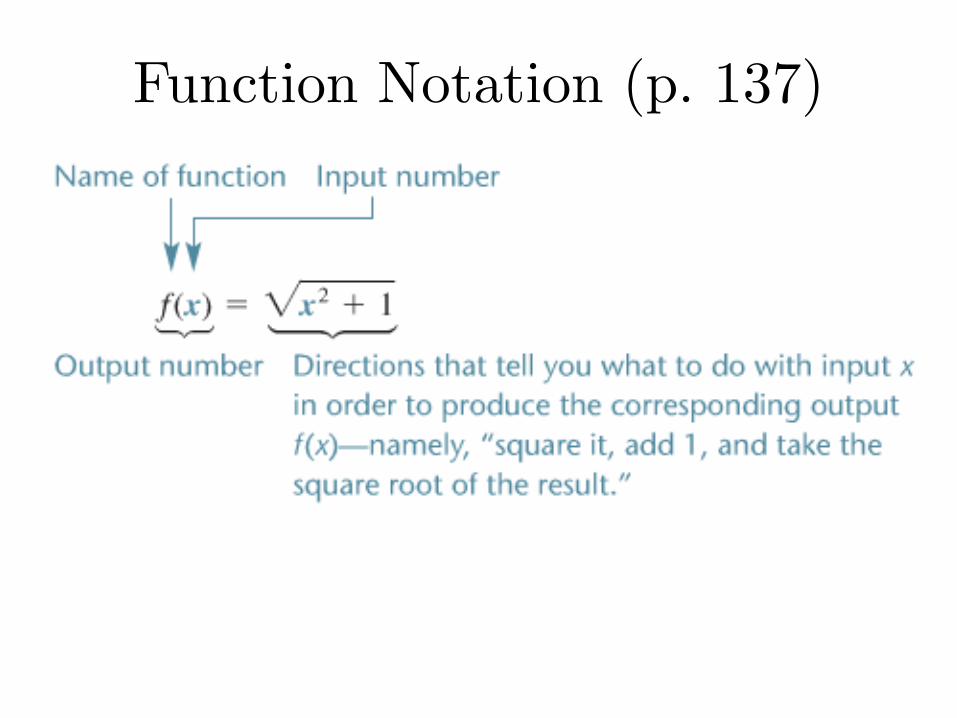
Function Notation (p. 137)
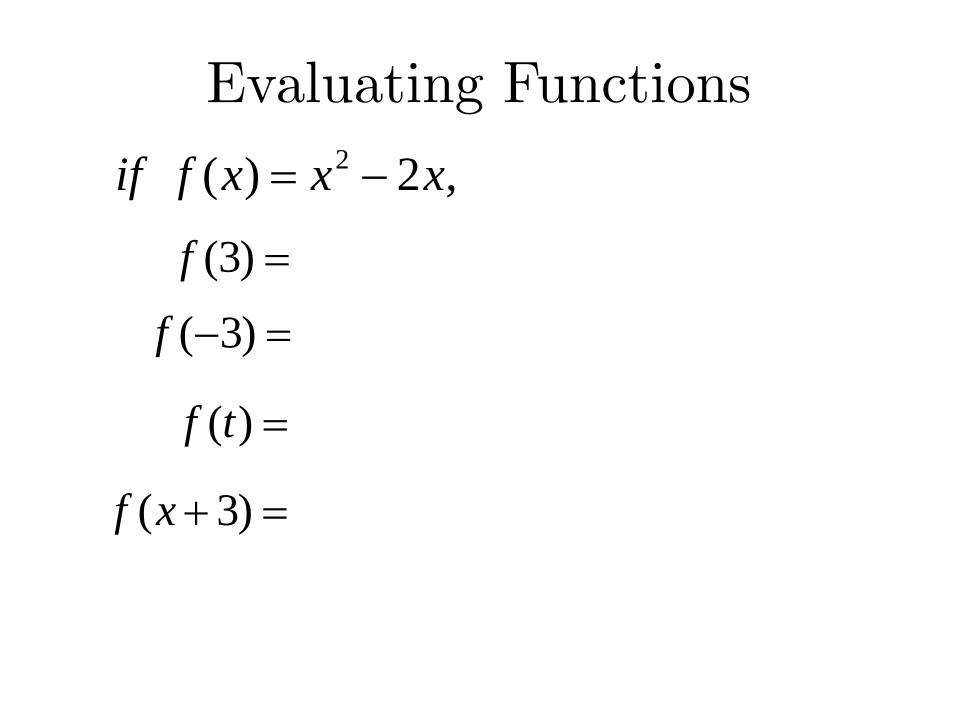
Evaluating Functions
,2)( 2 xxxfif
)3(f
)3(f
)(tf
)3(xf
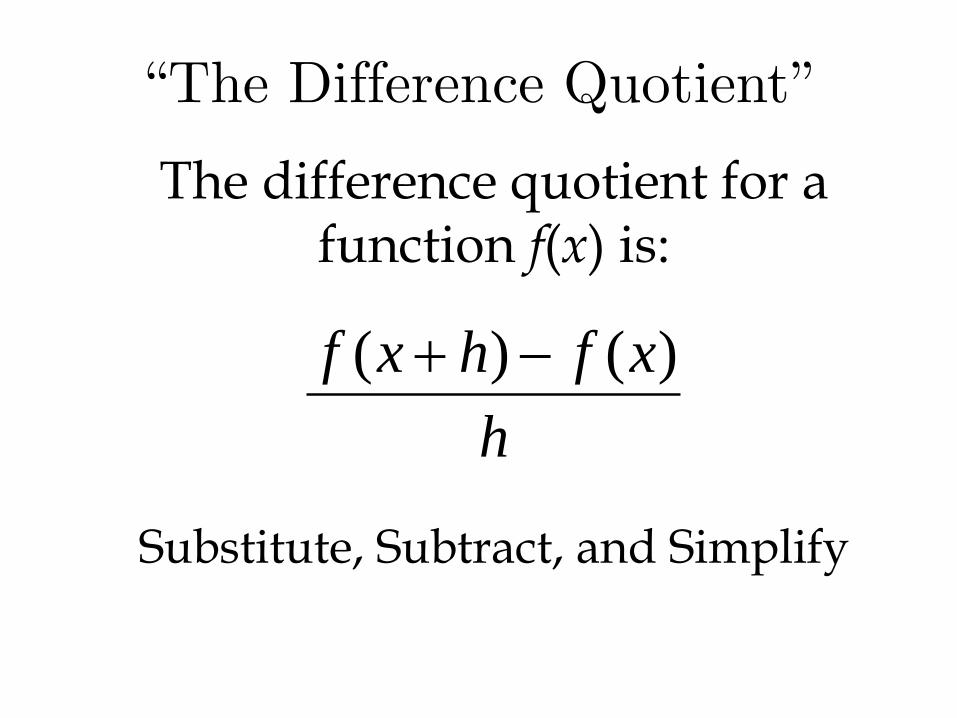
“The Difference Quotient”
The difference quotient for a function f(x) is:
h
xfhxf )()(
Substitute, Subtract, and Simplify
h
xfhxf )()(
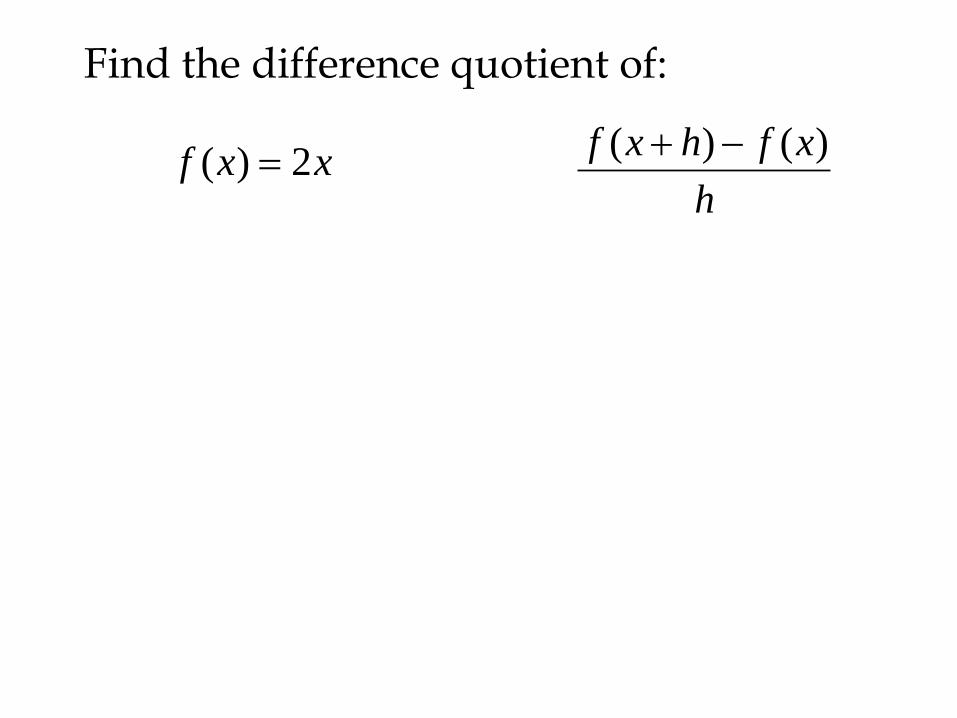
Find the difference quotient of:
xxf 2)(
h
xfhxf )()(
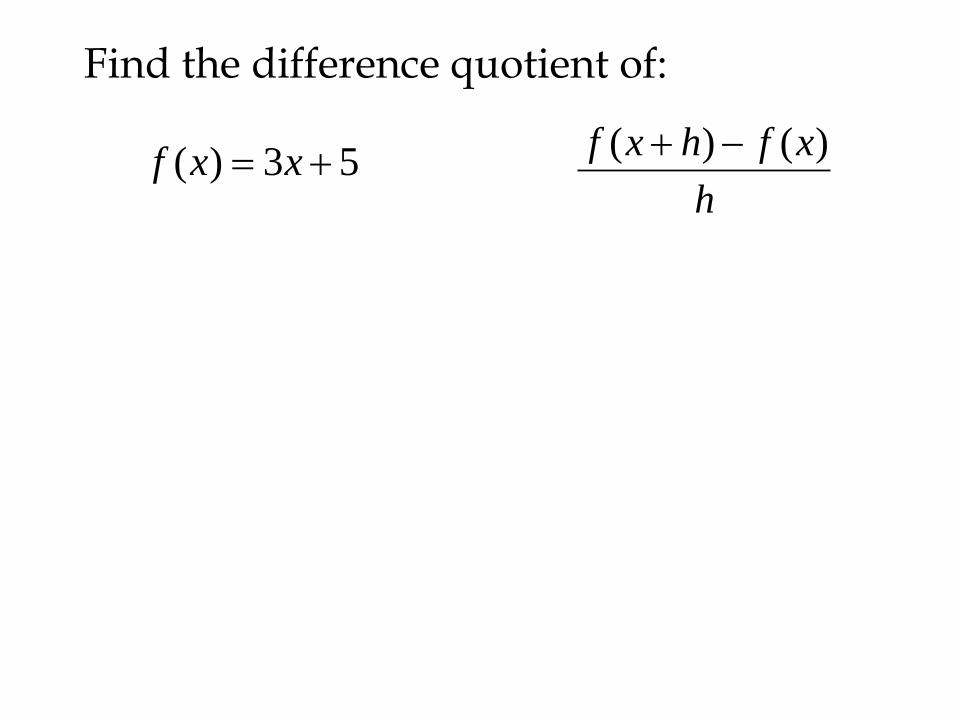
Find the difference quotient of:
53)( xxf
Finding Domains of Functions
The domain of a function is the set of values where the function is defined.
So, to find domains, we need to think about where functions are NOT defined!
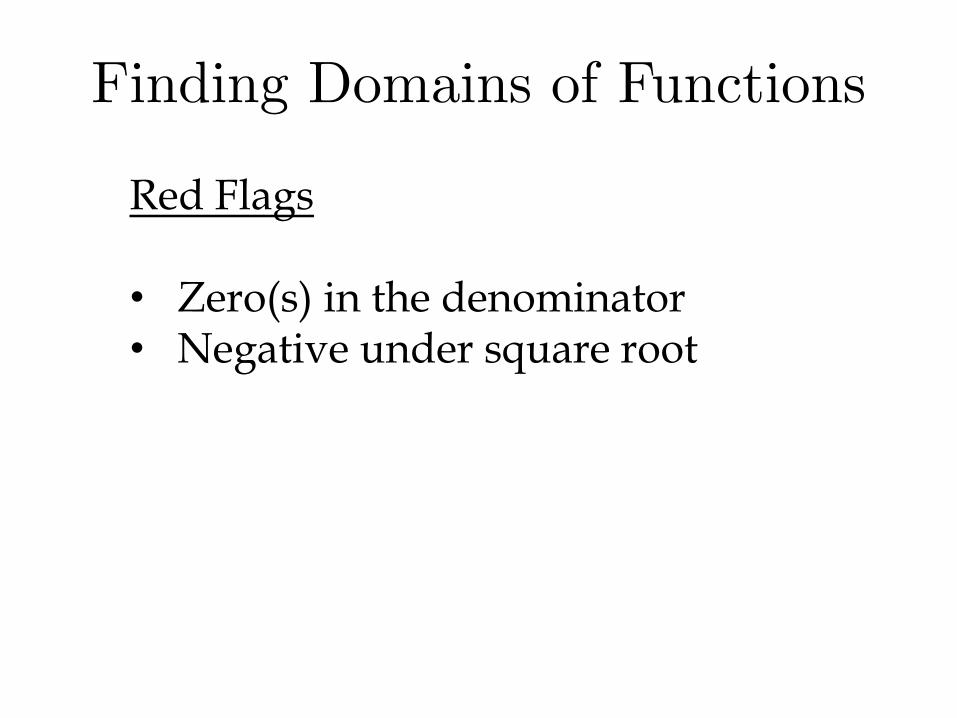
Finding Domains of Functions
Red Flags
• Zero(s) in the denominator• Negative under square root

Finding Domains of Functions
𝑓 𝑥 = 2𝑥 + 5 2
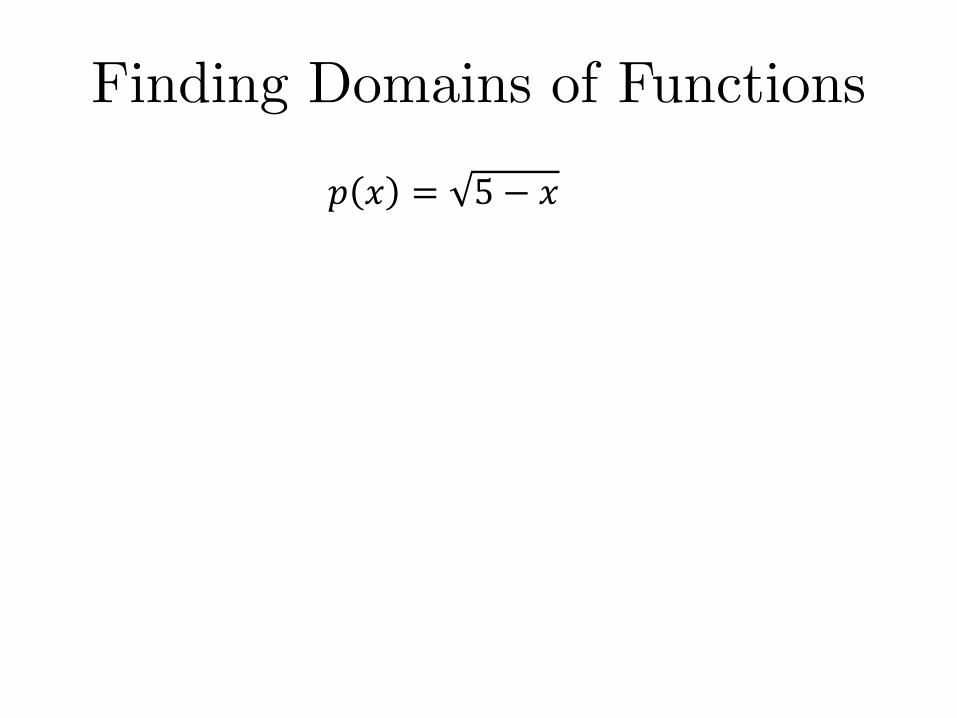
Finding Domains of Functions
𝑝 𝑥 = 5 − 𝑥
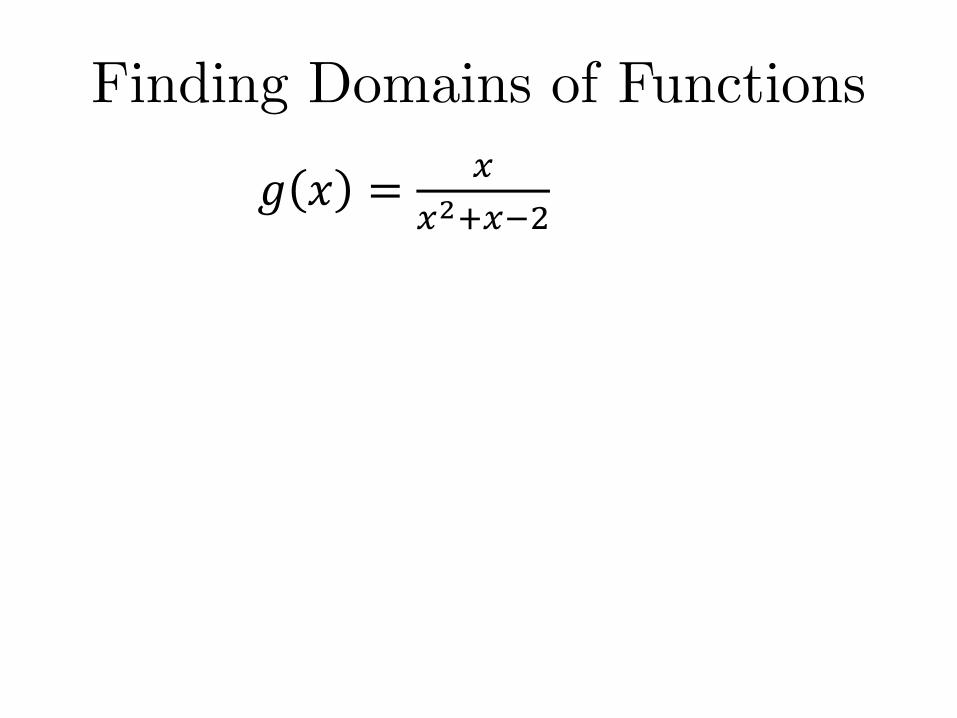
Finding Domains of Functions
𝑔 𝑥 =𝑥
𝑥2+𝑥−2
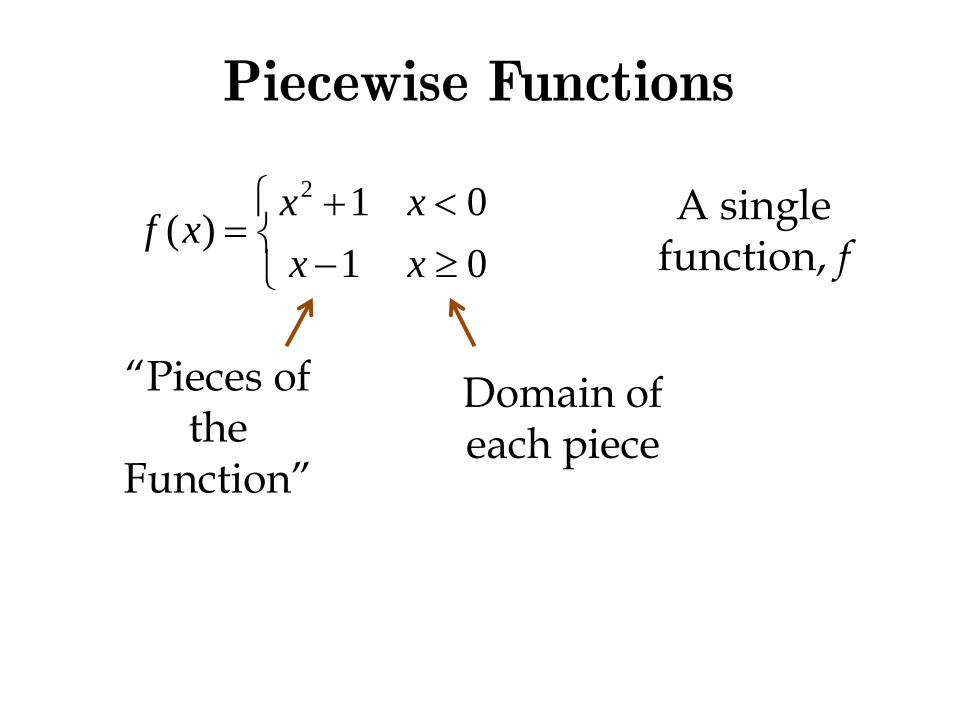
Piecewise Functions
01
01)(
2
xx
xxxf
“Pieces of the
Function”
Domain of each piece
A single function, f
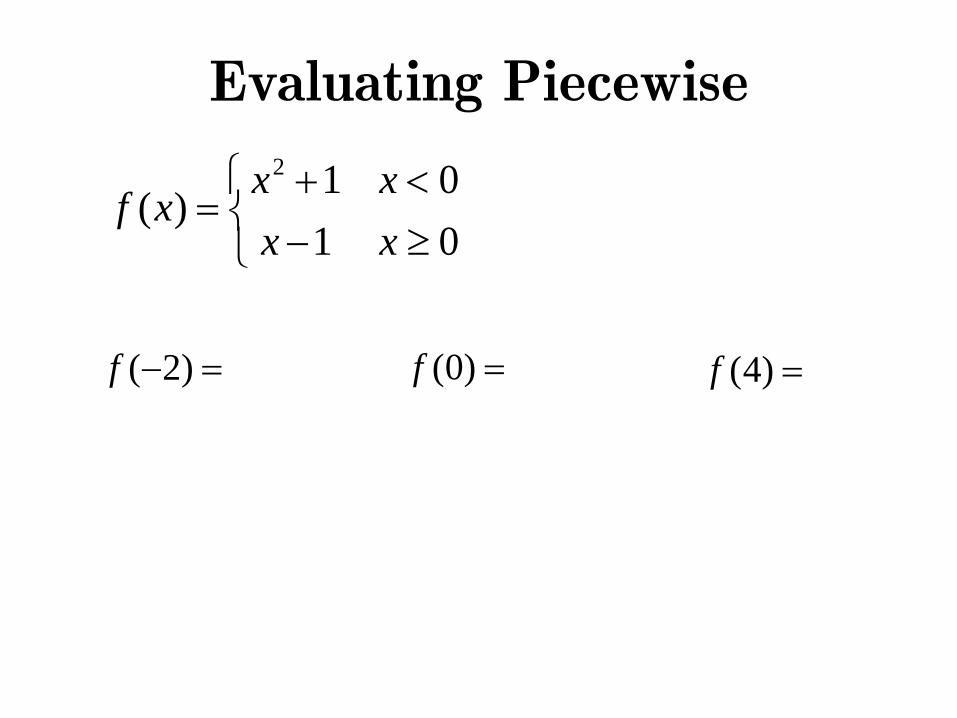
Evaluating Piecewise
01
01)(
2
xx
xxxf
)2(f )0(f )4(f
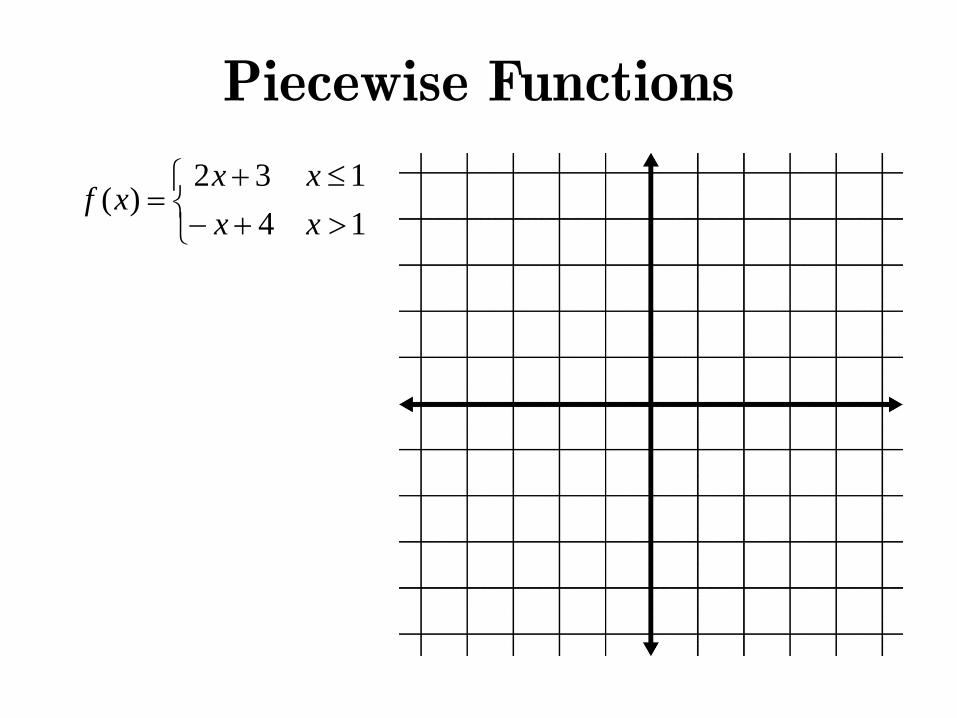
Piecewise Functions
14
132)(
xx
xxxf
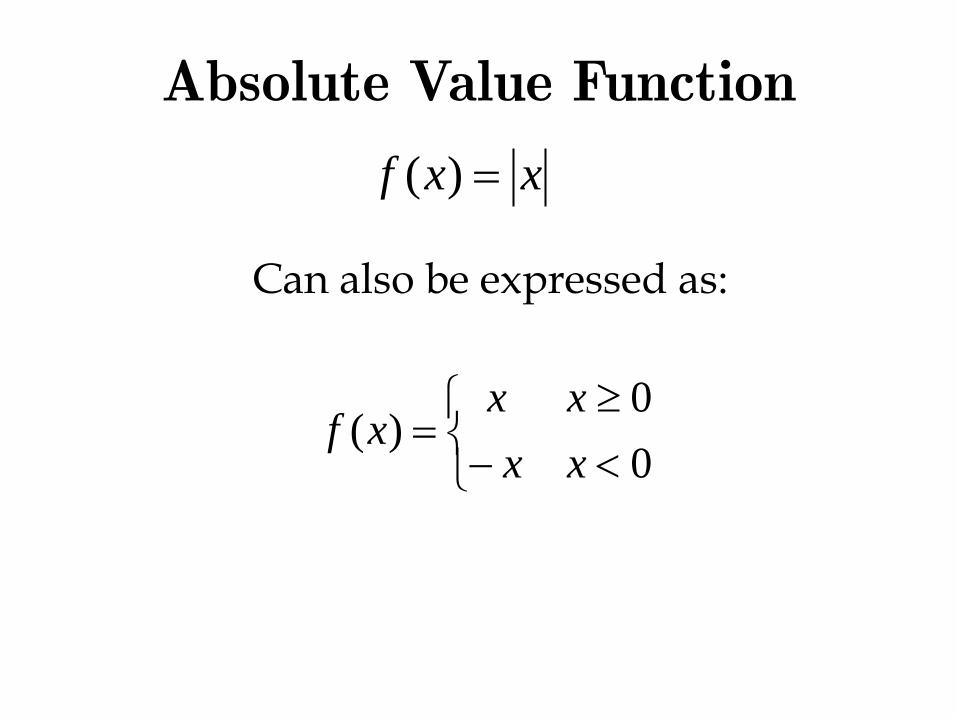
Absolute Value Function
xxf )(
Can also be expressed as:
0
0)(
xx
xxxf
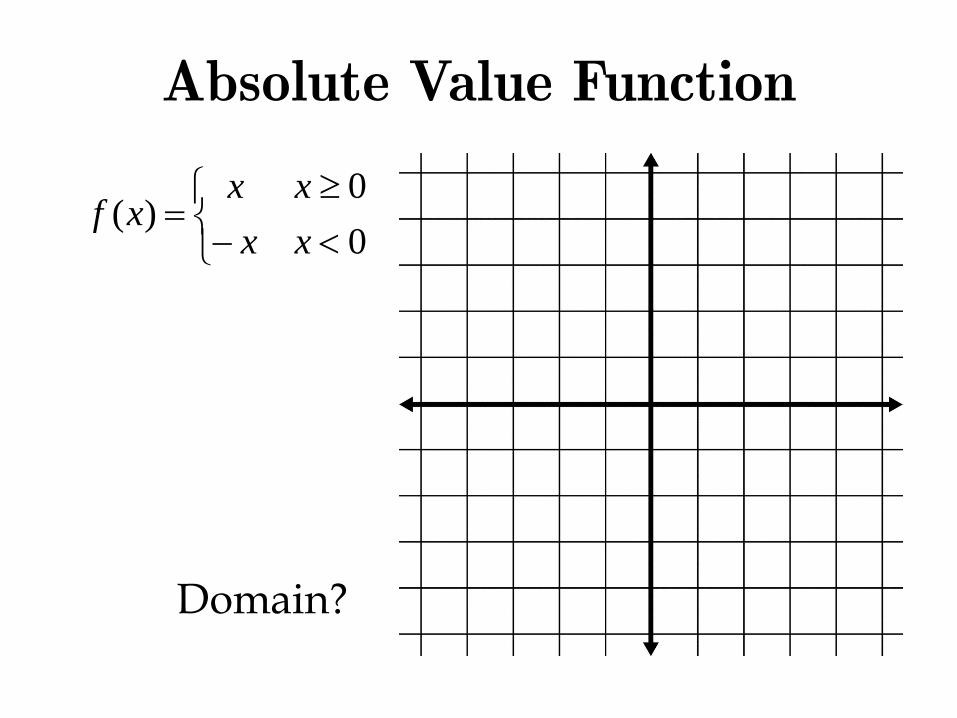
Absolute Value Function
0
0)(
xx
xxxf
Domain?
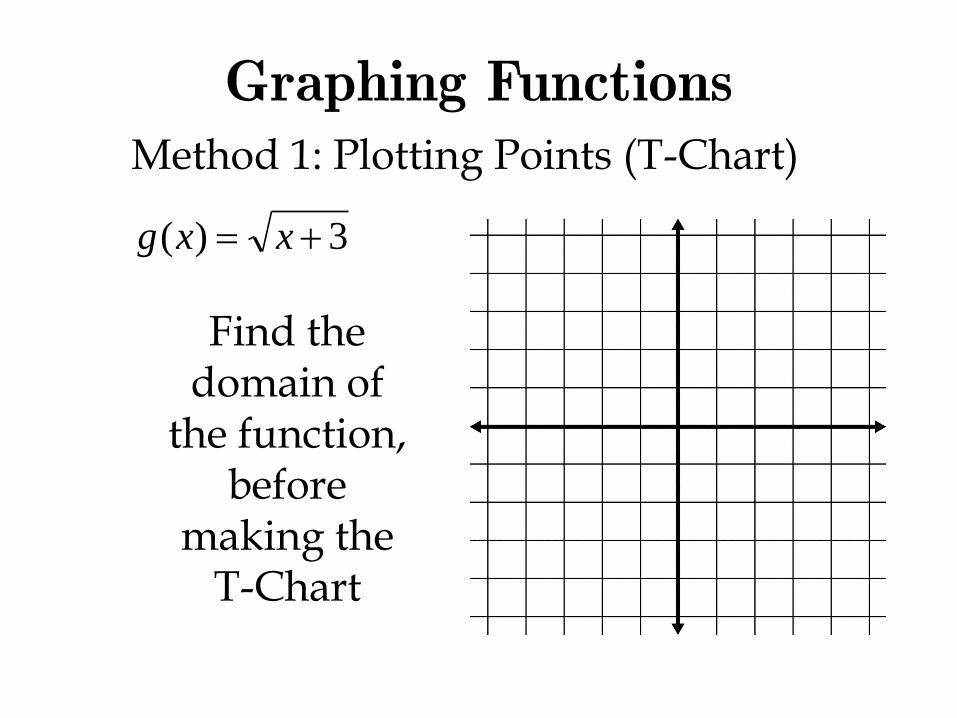
Graphing FunctionsMethod 1: Plotting Points (T-Chart)
3)( xxg
Find the domain of
the function, before
making the T-Chart
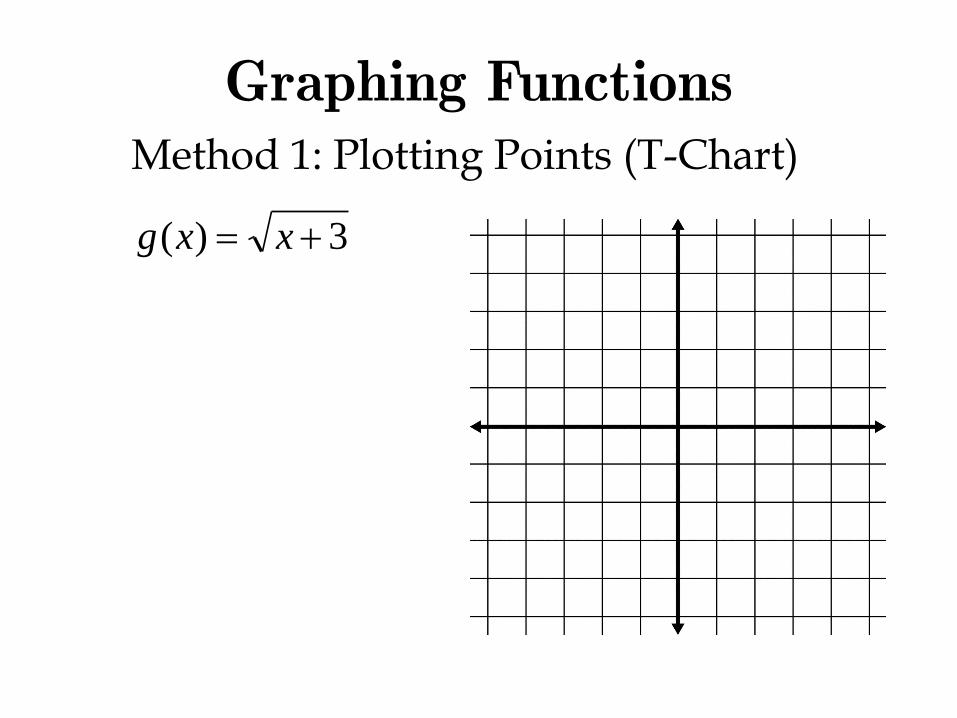
Graphing FunctionsMethod 1: Plotting Points (T-Chart)
3)( xxg

Graphing FunctionsMethod 1: Plotting Points (T-Chart)
xxf 2)(
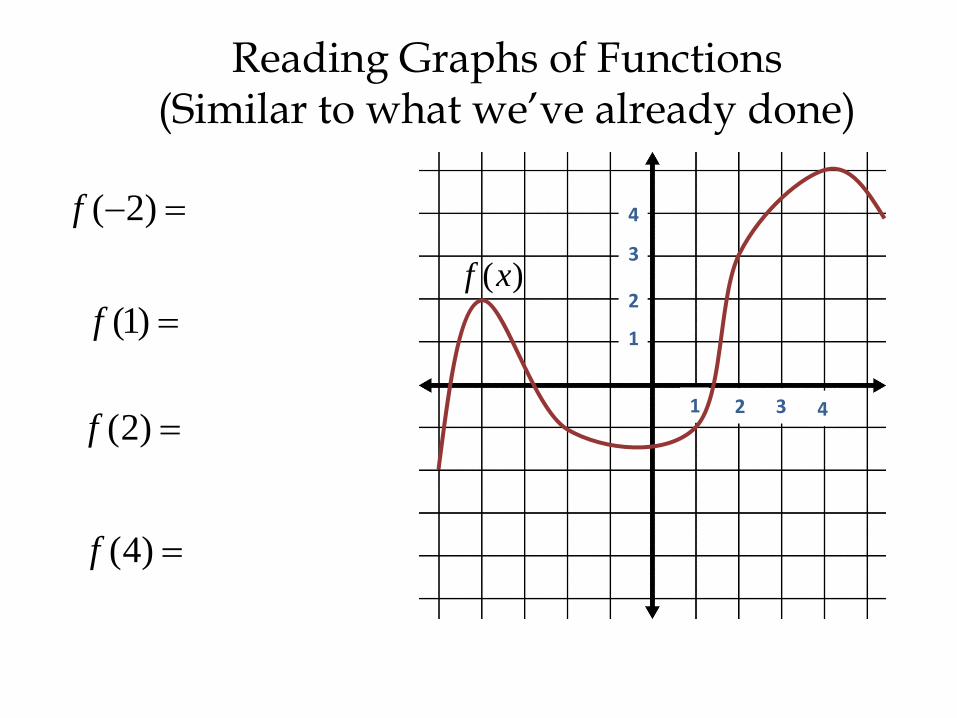
Reading Graphs of Functions(Similar to what we’ve already done)
1 2 3 4
1
2
3
4
)(xf
)2(f
)1(f
)2(f
)4(f
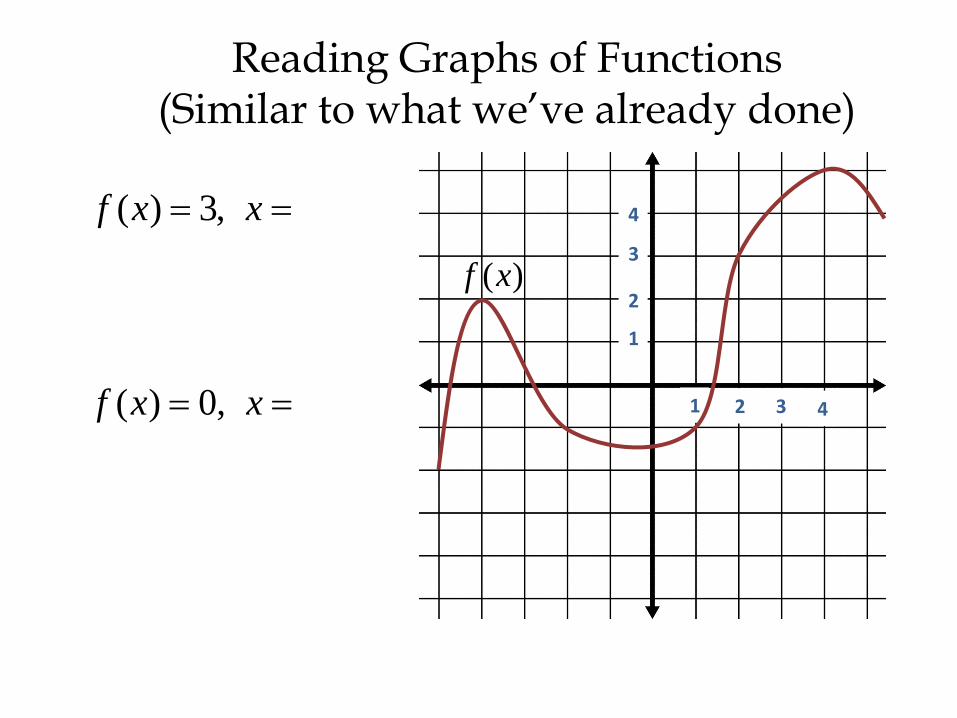
Reading Graphs of Functions(Similar to what we’ve already done)
1 2 3 4
1
2
3
4
)(xf
xxf ,3)(
xxf ,0)(
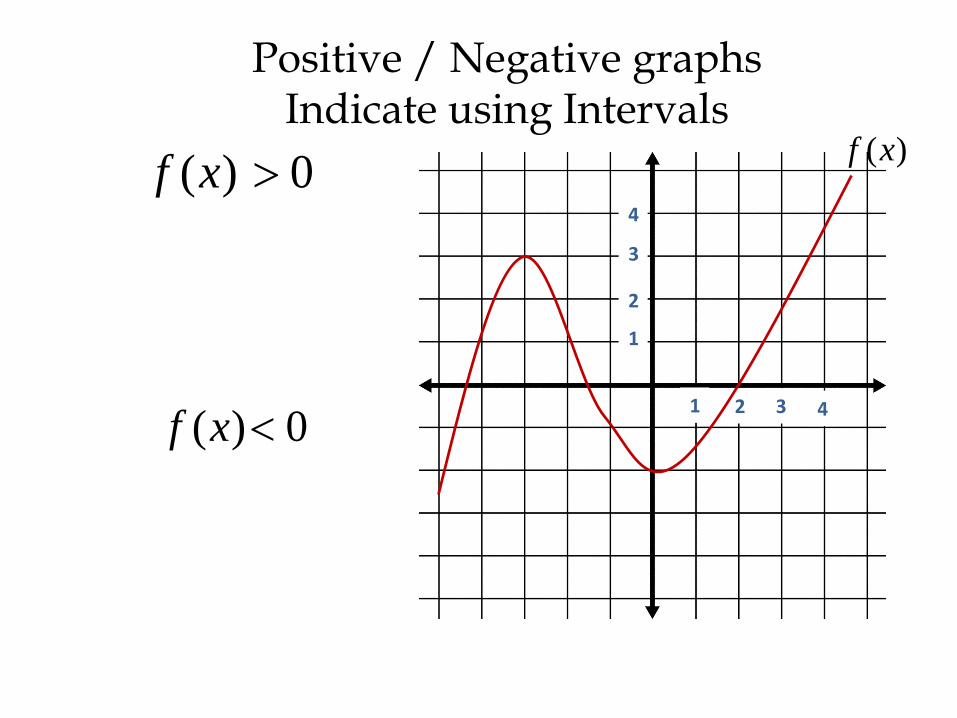
Positive / Negative graphsIndicate using Intervals
1 2 3 4
1
2
3
4
)(xf0)( xf
0)( xf
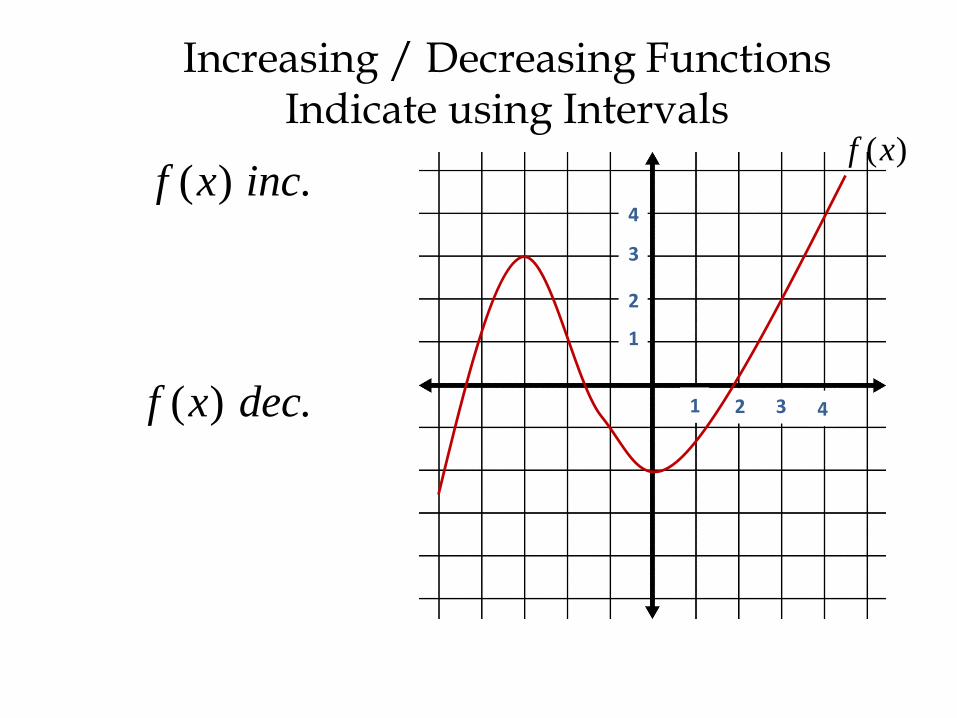
Increasing / Decreasing FunctionsIndicate using Intervals
1 2 3 4
1
2
3
4
)(xf.)( incxf
.)( decxf
Graphing Functions
Determining if a graph is a function
The Vertical Line Test
This is a visual representation of what we did last class…Each input cannot have more than one output (not predictable)
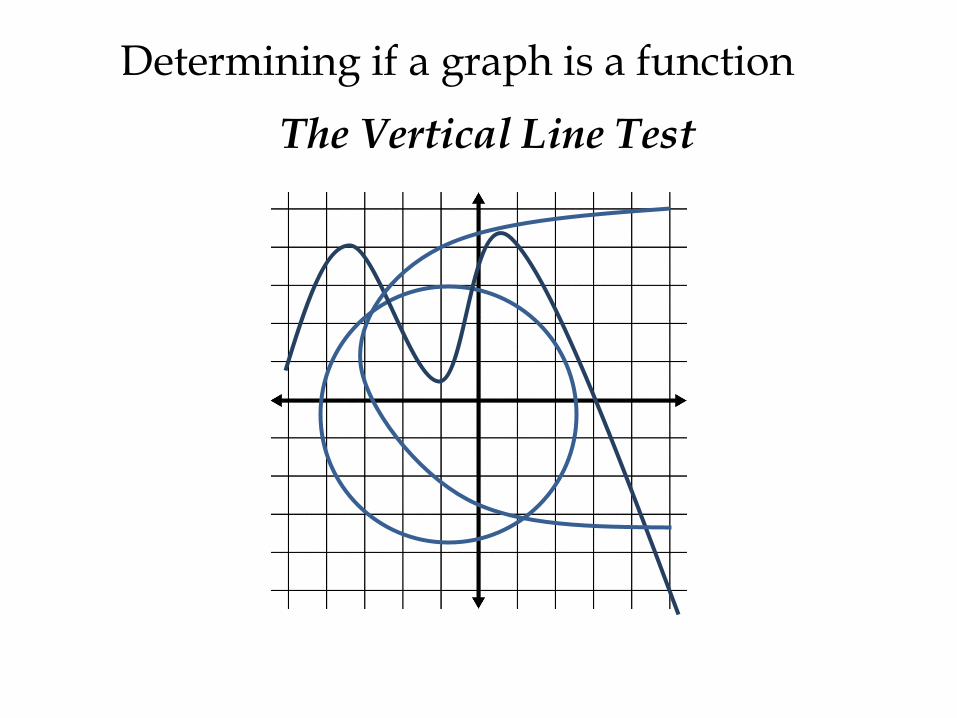
Determining if a graph is a function
The Vertical Line Test
Classwork
• Go over worksheets as class
Classwork / Homework
Page 140
9 – 19 odd,
23 – 29 odd,
35 – 45 odd, 51
Graphing Worksheet