lecture 10: classification and logistic regression
TRANSCRIPT

CS109A Introduction to Data SciencePavlos Protopapas, Kevin Rader and Chris Tanner
Lecture 10: Classification and Logistic Regression

CS109A, PROTOPAPAS, RADER, TANNER
Announcements
• Project assignments coming out Wednesday. Email helpline TODAY if you haven’t submitted preferences.
• HW2: grades coming tonight.
• HW3: due Wed @ 11:59pm.
• HW4: individual assignment. No working with other students. Feel free to use Ed, OHs, and Google like normal.
2

CS109A, PROTOPAPAS, RADER, TANNER
Lecture Outline
• Classification: Why not Linear Regression?
• Binary Response & Logistic Regression
• Estimating the Simple Logistic Model
• Classification using the Logistic Model
• Multiple Logistic Regression
• Extending the Logistic Model
• Classification Boundaries

CS109A, PROTOPAPAS, RADER, TANNER
Advertising Data (from earlier lectures)
TV radio newspaper sales
230.1 37.8 69.2 22.1
44.5 39.3 45.1 10.4
17.2 45.9 69.3 9.3
151.5 41.3 58.5 18.5
180.8 10.8 58.4 12.9
4
Youtcome
response variabledependent variable
Xpredictorsfeatures
covariates
p predictors
nob
serv
atio
ns

CS109A, PROTOPAPAS, RADER, TANNER
Heart Data
Age Sex ChestPain RestBP Chol Fbs RestECG MaxHR ExAng Oldpeak Slope Ca Thal AHD
63 1 typical 145 233 1 2 150 0 2.3 3 0.0 fixed No
67 1 asymptomatic 160 286 0 2 108 1 1.5 2 3.0 normal Yes
67 1 asymptomatic 120 229 0 2 129 1 2.6 2 2.0 reversable Yes
37 1 nonanginal 130 250 0 0 187 0 3.5 3 0.0 normal No
41 0 nontypical 130 204 0 2 172 0 1.4 1 0.0 normal No
response variable Yis Yes/No

CS109A, PROTOPAPAS, RADER, TANNER
Heart Data
These data contain a binary outcome HD for 303 patients who presented with chest pain. An outcome value of:
• Yes indicates the presence of heart disease based on an angiographic test,
• No means no heart disease. There are 13 predictors including:
• Age• Sex (0 for women, 1 for men)• Chol (a cholesterol measurement), • MaxHR• RestBPand other heart and lung function measurements.

CS109A, PROTOPAPAS, RADER, TANNER
Classification

CS109A, PROTOPAPAS, RADER, TANNER
Classification
Up to this point, the methods we have seen have centered around modeling and the prediction of a quantitative response variable (ex, number of taxi pickups, number of bike rentals, etc). Linear regression (and Ridge, LASSO, etc) perform well under these situations
When the response variable is categorical, then the problem is no longer called a regression problem but is instead labeled as a classification problem.
The goal is to attempt to classify each observation into a category (aka, class or cluster) defined by Y, based on a set of predictor variables X.
CS109A, PROTOPAPAS, RADER, TANNER
Typical Classification Examples
The motivating examples for this lecture(s), homework, and coming labs are based [mostly] on medical data sets. Classification problems are common in this domain:
• Trying to determine where to set the cut-off for some diagnostic test (pregnancy tests, prostate or breast cancer screening tests, etc...)
• Trying to determine if cancer has gone into remission based on treatment and various other indicators
• Trying to classify patients into types or classes of disease based on various genomic markers

CS109A, PROTOPAPAS, RADER, TANNER
Why not Linear Regression?

1111
Given a dataset:
where the 𝑦 are categorical (sometimes referred to as qualitative), we would like to be able to predict which category 𝑦 takes on given 𝑥. A categorical variable 𝑦 could be encoded to be quantitative. For example, if 𝑦represents concentration of Harvard undergrads, then 𝑦 could take on the values:
Simple Classification Example
11
{(x1, y1), (x2, y2), · · · , (xN , yN )}
y =
8<
:
1 if Computer Science (CS)2 if Statistics3 otherwise
.
Linear regression does not work well, or is not appropriate at all, in this setting.

CS109A, PROTOPAPAS, RADER, TANNER
Simple Classification Example (cont.)
A linear regression could be used to predict y from x. What would be wrong with such a model?
The model would imply a specific ordering of the outcome, and would treat a one-unit change in y equivalent. The jump from y = 1 to y = 2 (CS to Statistics) should not be interpreted as the same as a jump from y = 2 to y = 3 (Statistics to everyone else).
Similarly, the response variable could be reordered such that y = 1 represents Statistics and y = 2 represents CS, and then the model estimates and predictions would be fundamentally different.
If the categorical response variable was ordinal (had a natural ordering, like class year, Freshman, Sophomore, etc.), then a linear regression model would make some sense but is still not ideal.

CS109A, PROTOPAPAS, RADER, TANNER
Even Simpler Classification Problem: Binary Response
The simplest form of classification is when the response variable 𝑦 has only two categories, and then an ordering of the categories is natural. For example, an upperclassmen Harvard student could be categorized as (note, the 𝑦 = 0 category is a "catch-all" so it would involve both River House students and those who live in other situations: off campus, etc):
Linear regression could be used to predict 𝑦 directly from a set of covariates (like sex, whether an athlete or not, concentration, GPA, etc.), and if %𝑦 ≥ 0.5, we could predict the student lives in the Quad and predict other houses if %𝑦 < 0.5.
y =
⇢1 if lives in the Quad0 otherwise
.
CS109A, PROTOPAPAS, RADER, TANNER
Even Simpler Classification Problem: Binary Response (cont)
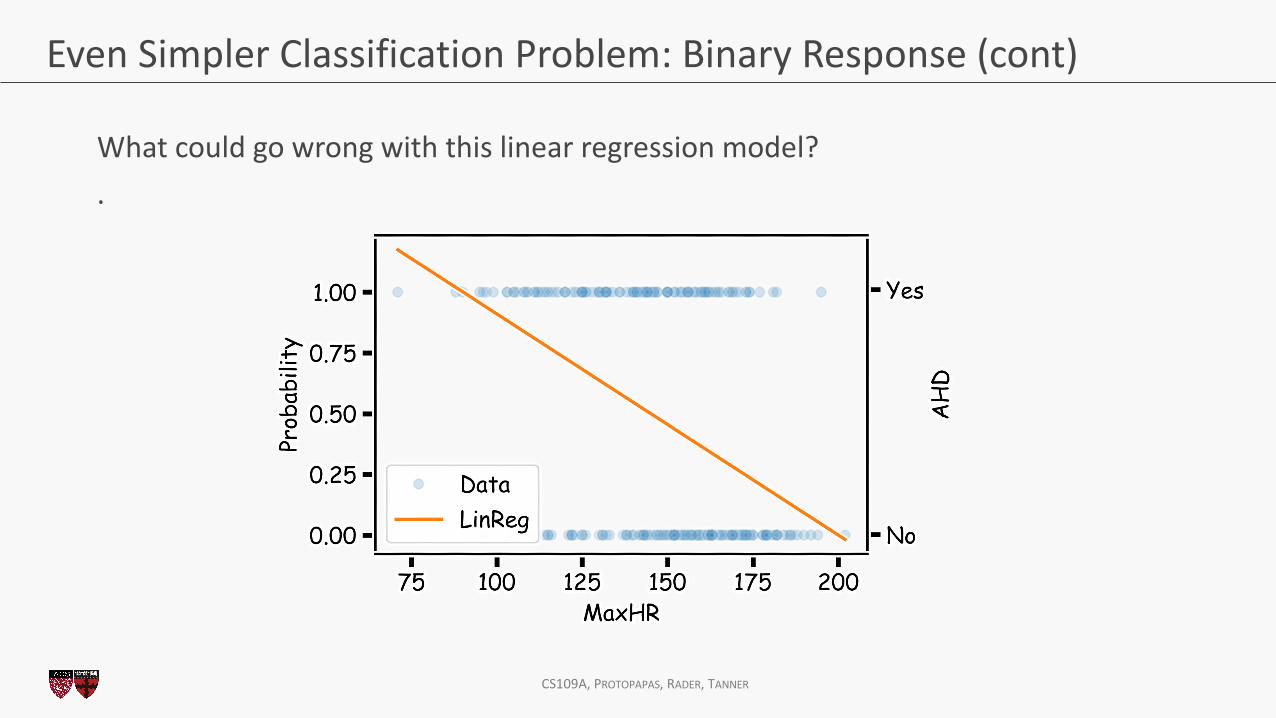
What could go wrong with this linear regression model? .

CS109A, PROTOPAPAS, RADER, TANNER
Even Simpler Classification Problem: Binary Response (cont)
The main issue is you could get non-sensical values for 𝑦. Since this is modeling 𝑃(𝑦 = 1) , values for %𝑦 below 0 and above 1 would be at odds with the natural measure for 𝑦. Linear regression can lead to this issue.

CS109A, PROTOPAPAS, RADER, TANNER
Binary Response & Logistic Regression

CS109A, PROTOPAPAS, RADER, TANNER
Pavlos Game #45
𝑌 = 𝑓(𝑥)
Think of a function that would do this for us

CS109A, PROTOPAPAS, RADER, TANNER
Logistic Regression
Logistic Regression addresses the problem of estimating a probability, 𝑃 𝑦 = 1 , to be outside the range of [0,1]. The logistic regression model uses a function, called the logistic function, to model 𝑃 𝑦 = 1 :
P (Y = 1) =e�0+�1X
1 + e�0+�1X=
1
1 + e�(�0+�1X)

CS109A, PROTOPAPAS, RADER, TANNER
Logistic Regression
As a result the model will predict 𝑃 𝑦 = 1 with an 𝑆-shaped curve, which is the general shape of the logistic function.
𝛽5 shifts the curve right or left by c = −898:
.
𝛽; controls how steep the 𝑆-shaped curve is. Distance from ½ to almost 1 or ½ to almost 0 to ½ is <
8:
Note: if 𝛽; is positive, then the predicted 𝑃 𝑦 = 1 goes from zero for small values of 𝑋 to one for large values of 𝑋 and if 𝛽; is negative, then the 𝑃 𝑦 = 1 has opposite association.
19

CS109A, PROTOPAPAS, RADER, TANNER
Logistic Regression
20
−𝛽5𝛽;
2𝛽;
𝛽;4

CS109A, PROTOPAPAS, RADER, TANNER
Logistic Regression
21
P (Y = 1) =1
1 + e�(�0+�1X)

CS109A, PROTOPAPAS, RADER, TANNER
Logistic Regression
22
P (Y = 1) =1
1 + e�(�0+�1X)

CS109A, PROTOPAPAS, RADER, TANNER
Logistic Regression
With a little bit of algebraic work, the logistic model can be rewritten as:
The value inside the natural log function @(AB;);C@(AB;), is called the odds, thus logistic
regression is said to model the log-odds with a linear function of the predictors or features, 𝑋. This gives us the natural interpretation of the estimates similar to linear regression: a one unit change in 𝑋 is associated with a 𝛽; change in the log-odds of 𝑌 = 1; or better yet, a one unit change in 𝑋 is associated with an 𝑒8:change in the odds that 𝑌 = 1 .
ln
✓P (Y = 1)
1� P (Y = 1)
◆= �0 + �1X.

CS109A, PROTOPAPAS, RADER, TANNER
Estimating the Simple Logistic Model
CS109A, PROTOPAPAS, RADER, TANNER
Estimation in Logistic Regression
Unlike in linear regression where there exists a closed-form solution to finding the estimates, E𝛽F’s, for the true parameters, logistic regression estimates cannot be calculated through simple matrix multiplication.
Questions:
• In linear regression what loss function was used to determine the parameter estimates?
• What was the probabilistic perspective on linear regression?
• Logistic Regression also has a likelihood based approach to estimating parameter coefficients.

CS109A, PROTOPAPAS, RADER, TANNER
Estimation in Logistic Regression
Probability 𝑌 = 1: 𝑝Probability 𝑌 = 0: 1 − 𝑝
𝑃 𝑌 = 𝑦 = 𝑝I(1 − 𝑝)(;CI)
where:𝑝 = 𝑃(𝑌 = 1|𝑋 = 𝑥) and therefore pdepends on X.Thus not every p is the same for each individual measurement.

CS109A, PROTOPAPAS, RADER, TANNER
Likelihood
The likelihood of a single observation for p given x and y is:
Given the observations are independent, what is the likelihood function for p?
𝐿 𝑝Q 𝑌Q = 𝑃 𝑌Q = 𝑦Q = 𝑝QIR 1 − 𝑝Q ;CIR
𝐿 𝑝 𝑌 =SQ
𝑃 𝑌Q = 𝑦Q =SQ
𝑝QIR 1 − 𝑝Q ;CIR
𝑙 𝑝 𝑌 = − log 𝐿 𝑝 𝑌 = −XQ
𝑦Q log 𝑝Q + 1 − 𝑦Q log(1 − 𝑝Q)

CS109A, PROTOPAPAS, RADER, TANNER
Loss Function
How do we minimize this?
Differentiate, equate to zero and solve for it!
But jeeze does this look messy?! It will not necessarily have a closed form solution.
So how do we determine the parameter estimates? Through an iterative approach (we will talk about this at length in future lectures).
𝑙 𝑝 𝑌 = −XQ
𝑦Q log1
1 + 𝑒C8ZR+ 1 − 𝑦Q log 1 −
11 + 𝑒C8ZR Q
CS109A, PROTOPAPAS, RADER, TANNER
Heart Data: logistic estimation
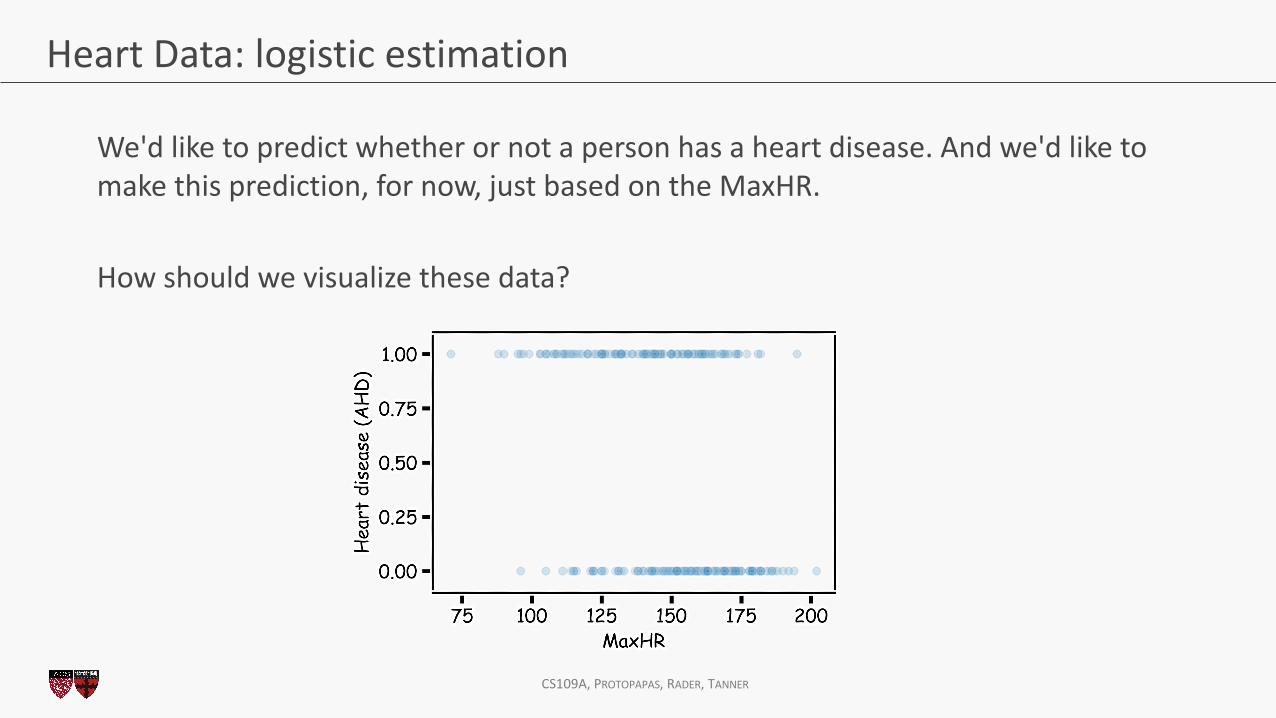
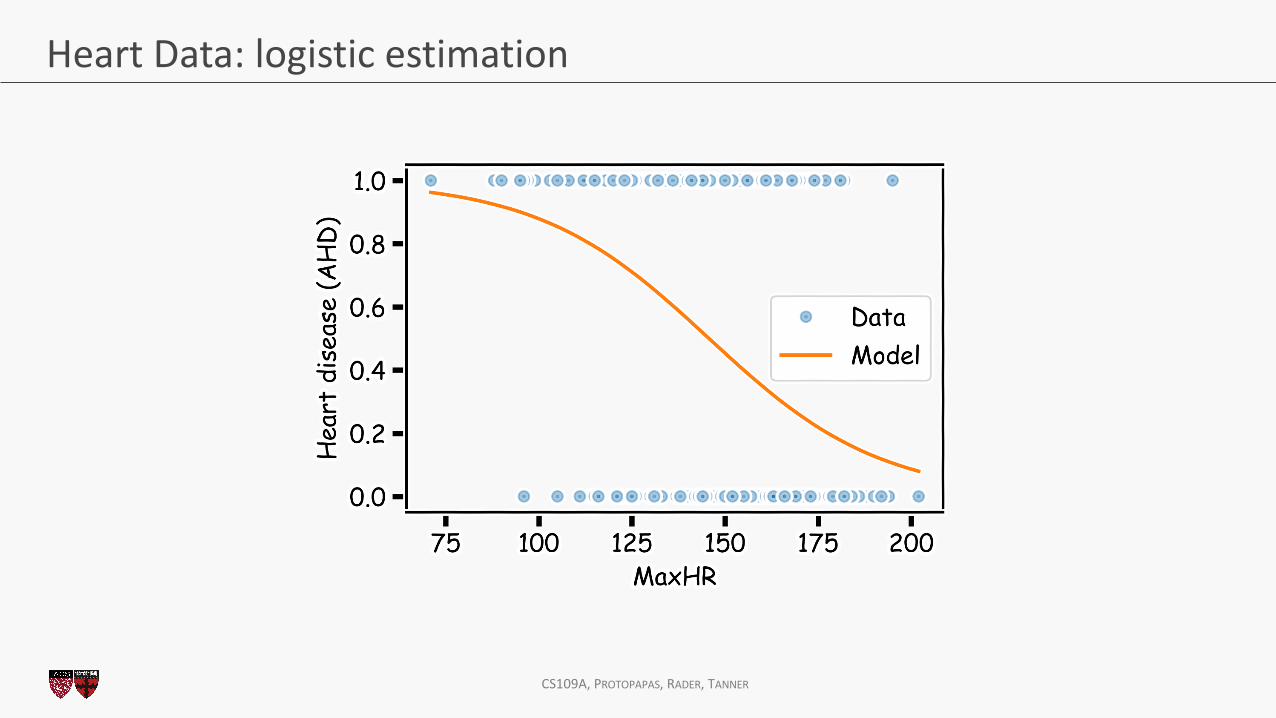
We'd like to predict whether or not a person has a heart disease. And we'd like to make this prediction, for now, just based on the MaxHR.
How should we visualize these data?
CS109A, PROTOPAPAS, RADER, TANNER
Heart Data: logistic estimation

CS109A, PROTOPAPAS, RADER, TANNER
Heart Data: logistic estimation
There are various ways to fit a logistic model to this data set in Python. The most straightforward in sklearn is via linear_model.LogisticRegression.

CS109A, PROTOPAPAS, RADER, TANNER
Heart Data: logistic estimation
Answer some questions:
• Write down the logistic regression model.
• Interpret E𝛽;.
• Estimate the probability of heart decease for someone (like Pavlos) with
MaxHR≈200?
• If we were to use this model purely for classification, how would we do so? See any
issues?

CS109A, PROTOPAPAS, RADER, TANNER
Categorical Predictors
Just like in linear regression, when the predictor, 𝑋, is binary, the interpretation of the model simplifies (and there is a quick closed form solution).
In this case, what are the interpretations of E𝛽5 and E𝛽;?
For the heart data, let 𝑋 be the indicator that the individual is a male or female. What is the interpretation of the coefficient estimates in this case?
The observed percentage of HD for women is 26% while it is 55% for men.
Calculate the estimates for E𝛽5 and E𝛽; if the indicator for HD was predicted from the gender indicator.

CS109A, PROTOPAPAS, RADER, TANNER
Statistical Inference in Logistic Regression
The uncertainty of the estimates E𝛽5 and E𝛽; can be quantified and used to calculate both confidence intervals and hypothesis tests.
The estimate for the standard errors of these estimates, likelihood-based, is based on a quantity called Fisher's Information (beyond the scope of this class), which is related to the curvature of the log-likelihood function.
Due to the nature of the underlying Bernoulli distribution, if you estimate the underlying proportion 𝑝Q, you get the variance for free! Because of this, the inferences will be based on the normal approximation (and not t-distribution based).
Of course, you could always bootstrap the results to perform these inferences as well.

CS109A, PROTOPAPAS, RADER, TANNER
Classification using the Logistic Model

CS109A, PROTOPAPAS, RADER, TANNER
Using Logistic Regression for Classification
How can we use a logistic regression model to perform classification?
That is, how can we predict when 𝑌 = 1 vs. when 𝑌 = 0?
We mentioned before, we can classify all observations for which ]𝑃(𝑌 = 1) ≥0.5 to be in the group associated with 𝑌 = 1 and then classify all observations for which ]𝑃 𝑌 = 0 < 0.5 to be in the group associated with 𝑌 = 0.
Using such an approach is called the standard Bayes classifier.
The Bayes classifier takes the approach that assigns each observation to the most likely class, given its predictor values.

CS109A, PROTOPAPAS, RADER, TANNER
Using Logistic Regression for Classification
When will this Bayes classifier be a good one? When will it be a poor one?
The Bayes classifier is the one that minimizes the overall classification error rate. That is, it minimizes:
1𝑛XQB;
_
𝐼(𝑦Q ≠ %𝑦Q)
Is this a good Loss function to minimize? Why or why not?
The Bayes classifier may be a poor indicator within a group. Think about the Heart Data scatter plot...

CS109A, PROTOPAPAS, RADER, TANNER
Using Logistic Regression for Classification
This has potential to be a good classifier if the predicted probabilities are on both sides of 0 and 1.
How do we extend this classifier if 𝑌 has more than two categories?

CS109A, PROTOPAPAS, RADER, TANNER
Multiple Logistic Regression

CS109A, PROTOPAPAS, RADER, TANNER
Multiple Logistic Regression
It is simple to illustrate examples in logistic regression when there is just one predictors variable. But the approach ‘easily’ generalizes to the situation where there are multiple predictors.A lot of the same details as linear regression apply to logistic regression. Interactions can be considered. Multicollinearity is a concern. So is overfitting. Etc...So how do we correct for such problems? Regularization and checking though train, test, and cross-validation!We will get into the details of this, along with other extensions of logistic regression, in the next lecture.

CS109A, PROTOPAPAS, RADER, TANNER
Classifier with two predictors
How can we estimate a classifier, based on logistic regression, for the following plot?
CS109A, PROTOPAPAS, RADER, TANNER
Multiple Logistic Regression
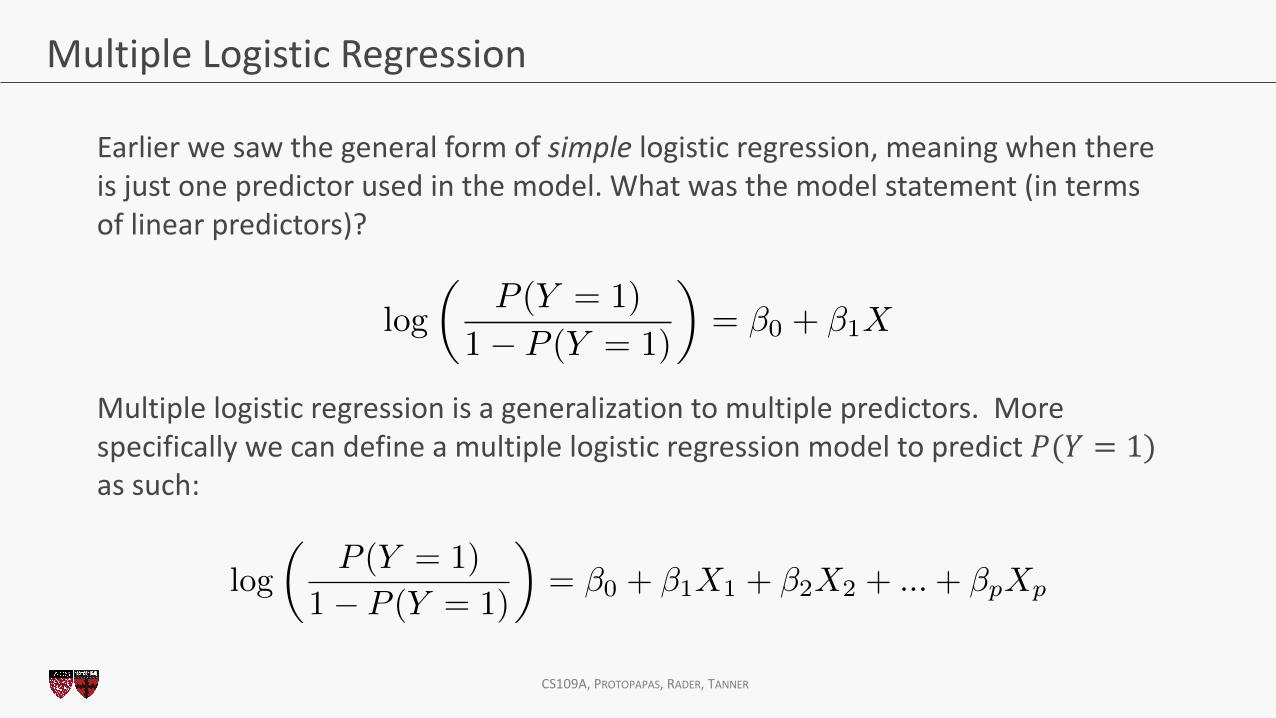
Earlier we saw the general form of simple logistic regression, meaning when there is just one predictor used in the model. What was the model statement (in terms of linear predictors)?
Multiple logistic regression is a generalization to multiple predictors. More specifically we can define a multiple logistic regression model to predict 𝑃(𝑌 = 1)as such:
log
✓P (Y = 1)
1� P (Y = 1)
◆= �0 + �1X
log
✓P (Y = 1)
1� P (Y = 1)
◆= �0 + �1X1 + �2X2 + ...+ �pXp

CS109A, PROTOPAPAS, RADER, TANNER
Fitting Multiple Logistic Regression
The estimation procedure is identical to that as before for simple logistic regression: • a likelihood approach is taken, and the function is maximized across all parameters 𝛽5, 𝛽;,… , 𝛽c using an iterative method like Newton-Raphson.
The actual fitting of a Multiple Logistic Regression is easy using software (of course there's a python package for that) as the iterative maximization of the likelihood has already been hard coded.
In the sklearn.linear_model package, you just have to create your multidimensional design matrix 𝑋 to be used as predictors in the LogisticRegression function.

CS109A, PROTOPAPAS, RADER, TANNER
Interpretation of Multiple Logistic Regression
Interpreting the coefficients in a multiple logistic regression is similar to that of linear regression.
Key: since there are other predictors in the model, the coefficient E𝛽F is the association between the 𝑗ef predictor and the response (on log odds scale). But do we have to say? Controlling for the other predictors in the model.
We are trying to attribute the partial effects of each model controlling for the others (aka, controlling for possible confounders}.

CS109A, PROTOPAPAS, RADER, TANNER
Interpreting Multiple Logistic Regression: an Example
Let's get back to the Heart Data. We are attempting to predict whether someone has HD based on MaxHR and whether the person is female or male. The simultaneous effect of these two predictors can be brought into one model.
Recall from earlier we had the following estimated models:
log
\P (Y = 1)
1� \P (Y = 1)
!= 6.30� 0.043 ·XMaxHR
log
\P (Y = 1)
1� \P (Y = 1)
!= �1.06 + 1.27 ·Xgender

CS109A, PROTOPAPAS, RADER, TANNER
Interpreting Multiple Logistic Regression: an Example
The results for the multiple logistic regression model are:

CS109A, PROTOPAPAS, RADER, TANNER
Some questions
1. Estimate the odds ratio of HD comparing men to women using this model.
2. Is there any evidence of multicollinearity in this model?
3. Is there any confounding in this problem?

CS109A, PROTOPAPAS, RADER, TANNER
Interactions in Multiple Logistic Regression
Just like in linear regression, interaction terms can be considered in logistic regression. An interaction terms is incorporated into the model the same way, and the interpretation is very similar (on the log-odds scale of the response of course).
Write down the model for the Heart data for the 2 predictors plus the interactions term.

CS109A, PROTOPAPAS, RADER, TANNER
Interpreting Multiple Logistic Regression: an Example
The results for the multiple logistic regression model are:

CS109A, PROTOPAPAS, RADER, TANNER
Some questions
1. Write down the complete model. Break this down into the model to predict log-odds of heart disease (HD) based on MaxHR for women and the same model for men. How is this different from the previous model (without interaction)?
2. Interpret the results of this model. What does the coefficient for the interaction term represent?
3. Estimate the odds ratio of HD comparing men to women using this model [trick question].
4. Is there any evidence of multicollinearity in this model?
5. Is there any confounding in this problem?

CS109A, PROTOPAPAS, RADER, TANNER
Extending the Logistic Model

CS109A, PROTOPAPAS, RADER, TANNER
Model Diagnostics in Logistic Regression
In linear regression, when is the model appropriate (aka, what are the assumptions)?
In logistic regression, when is the model appropriate? We don't have to worry about the distribution of the residuals (we get that for free).
What we do have to worry about is how 𝑌 'links' to 𝑋 in its relationship. More specifically, we assume the 'S'-shaped (aka, sigmoidal) curve follows the logistic function. How could we check this?

CS109A, PROTOPAPAS, RADER, TANNER
Alternatives to logistic regression
Why was the logistic function chosen to model how a binary response variable can be predicted from a quantitative predictor?
Because it it takes as inputs values in (0,1) and outputs values (−∞,∞) so that the estimation of 𝛽 is unbounded.
This is not the only function that does this. Any suggestions?
Any inverse CDF function for an unbounded continuous distribution can work as the `link’ between the observed values for 𝑌 and how it relates `linearly' to the predictors.
So what are possible other choices? What differences do they have? Why is logistic regression preferred?

CS109A, PROTOPAPAS, RADER, TANNER
Logistic vs Normal pdf
The choice of link function determines the shape of the S’ shape. Let's compare the pdf's for the Logistic and Normal distributions (called a ’probit’ model, econometricians love these):
So what?

CS109A, PROTOPAPAS, RADER, TANNER
Logistic vs Normal pdf
Choosing a distribution with longer tails will make for a shape that asymptotes more slowly (likely a good thing for model fitting).

CS109A, PROTOPAPAS, RADER, TANNER
Classification Boundaries

CS109A, PROTOPAPAS, RADER, TANNER
Classification boundaries
Recall that we could attempt to purely classify each observation based on whether the estimated 𝑃(𝑌 = 1) from the model was greater than 0.5.
When dealing with ‘well-separated’ data, logistic regression can work well in performing classification.
We saw a 2-D plot last time which had two predictors, 𝑋;, 𝑋< and depicted the classes as different colors. A similar one is shown on the next slide.

CS109A, PROTOPAPAS, RADER, TANNER
2D Classification in Logistic Regression: an Example
CS109A, PROTOPAPAS, RADER, TANNER
2D Classification in Logistic Regression: an Example
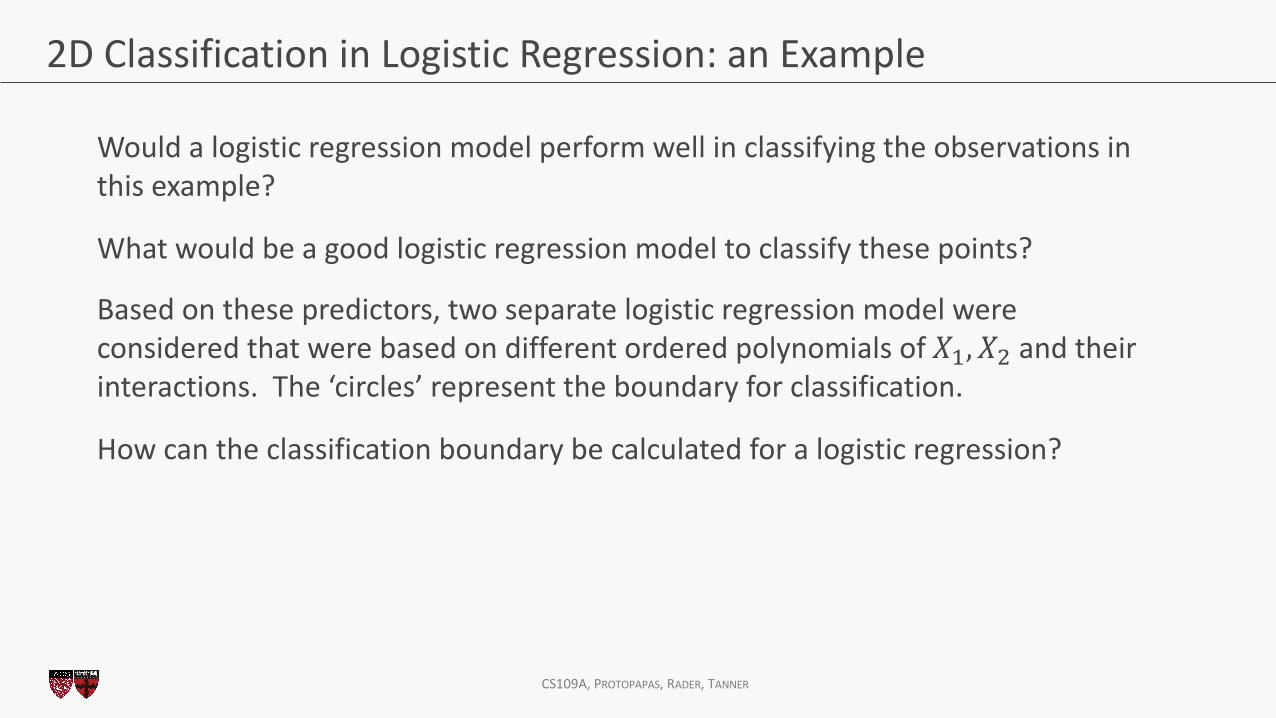
Would a logistic regression model perform well in classifying the observations in this example?
What would be a good logistic regression model to classify these points?
Based on these predictors, two separate logistic regression model were considered that were based on different ordered polynomials of 𝑋;, 𝑋< and their interactions. The ‘circles’ represent the boundary for classification.
How can the classification boundary be calculated for a logistic regression?

CS109A, PROTOPAPAS, RADER, TANNER
2D Classification in Logistic Regression: an Example
In the previous plot, which classification boundary performs better? How can you tell? How would you make this determination in an actual data example?
We could determine the misclassification rates in left out validation or test set(s)