lecture 1 digital data collection
TRANSCRIPT


1. Introduction to Digital Data Collection-Day #1
2. Data collection using open source KoBoToolbox-Day#2
3. Introduction to SmartSheet Data Collection Day#3
Course Outline

Introduction to Digital Data Collection
Day #1
As researchers today see the immense advantages of using mobile survey apps over paper-based forms

Data Visualization Introduction Outline
• What is digital data Collection?• The advantages of Digital Data Collection• Challenges of Digital Data Collection• Guide to Digital Data Collection• Digital Data Collection Steps• Top Open-Source Data Collection Tools and Research• Case Studies

Problems in Data Collection and Management
1. Data reliability (will we get the same data, when collected again?)
2. Data validity (Are we measuring what we say we are measuring?)
3. Data integrity (Is the data free of manipulation?)4. Data accuracy/precision (Is the data measuring the
“indicator” accurately?)5. Data timeliness (Are you getting the data in time?)6. Data security/confidentiality (Loss of data / loss of privacy)
What do the following mean?

1. Device: Use electronic devices (such as mobile phones, tablets, netbooks/laptops) to collect data/information.
2. Mobile data collection apps is a method of compiling qualitative and quantitative information with the help of a mobile device (e.g. smart mobile phone, tablet or iPad, etc.)
What is Digital Data Collection?
3. Data collection software/Tools Programme enables digitized data collection (free platforms such as OpenDataKitfor Android phones, Visual Basic/Java etc. for laptops)is a digitalised system for the collection and storage ofqualitative and quantitative data in an electronic form toeliminate the use of paper (for example surveys) and allowdata to be quickly exported for data analysis and reporting.

What is Digital Data Collection?
4. Data Transmission: Data from the field is transmitted to a server/remote location (manually or electronically)
5. Data Aggregation and Analysis: Data can be made available in excel, csv files. Aggregate tables and customized reports can be generated for analysis and sharing

• Work Smarter-Capture data at real time data from the point of collection
• Save time and money, Access anytime , anywhere
• Capturing data offline-allow researchers that are working in places with unreliable internet to store a backup of their data on their mobile device and upload it once an internet connection is available.
• Speed and Efficiency• Data Quality• Visibility and Tracking
The Advantages of Digital Data Collection

The Advantages of Digital Data Collection
• Built-in logical flow and validation checks improves data quality
• Ability to collect new types of data – Location (GIS), media (pictures, audio)
• Easy to manage and analyze large amounts of data
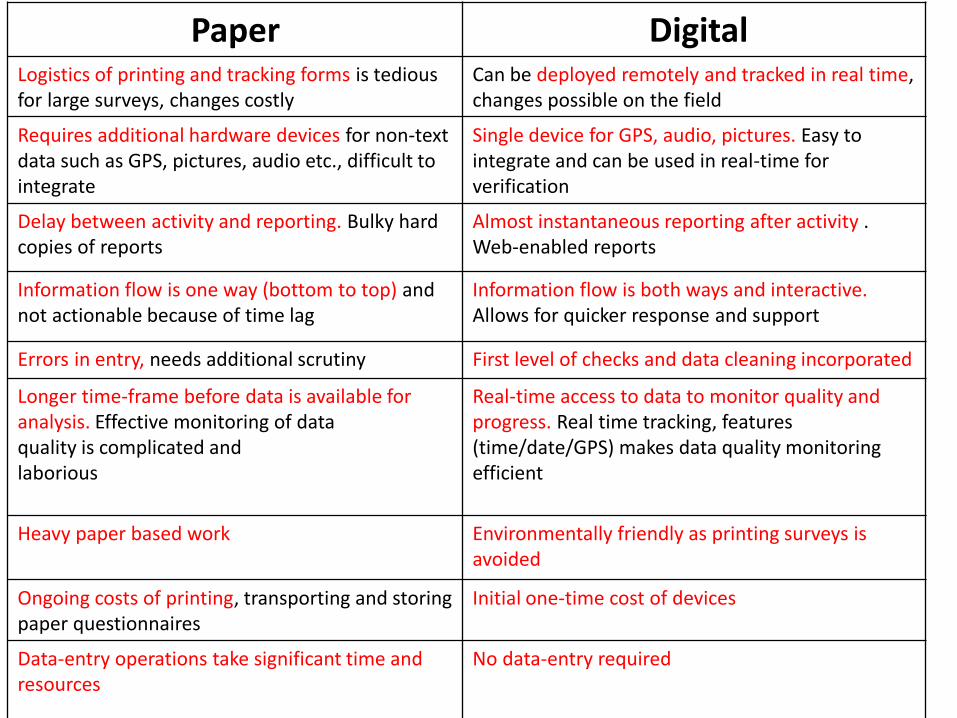
Paper DigitalLogistics of printing and tracking forms is tedious for large surveys, changes costly
Can be deployed remotely and tracked in real time, changes possible on the field
Requires additional hardware devices for non-text data such as GPS, pictures, audio etc., difficult to integrate
Single device for GPS, audio, pictures. Easy to integrate and can be used in real-time for verification
Delay between activity and reporting. Bulky hard copies of reports
Almost instantaneous reporting after activity . Web-enabled reports
Information flow is one way (bottom to top) and not actionable because of time lag
Information flow is both ways and interactive. Allows for quicker response and support
Errors in entry, needs additional scrutiny First level of checks and data cleaning incorporated
Longer time-frame before data is available for analysis. Effective monitoring of dataquality is complicated andlaborious
Real-time access to data to monitor quality and progress. Real time tracking, features (time/date/GPS) makes data quality monitoring efficient
Heavy paper based work Environmentally friendly as printing surveys is avoided
Ongoing costs of printing, transporting and storing paper questionnaires
Initial one-time cost of devices
Data-entry operations take significant time and resources
No data-entry required
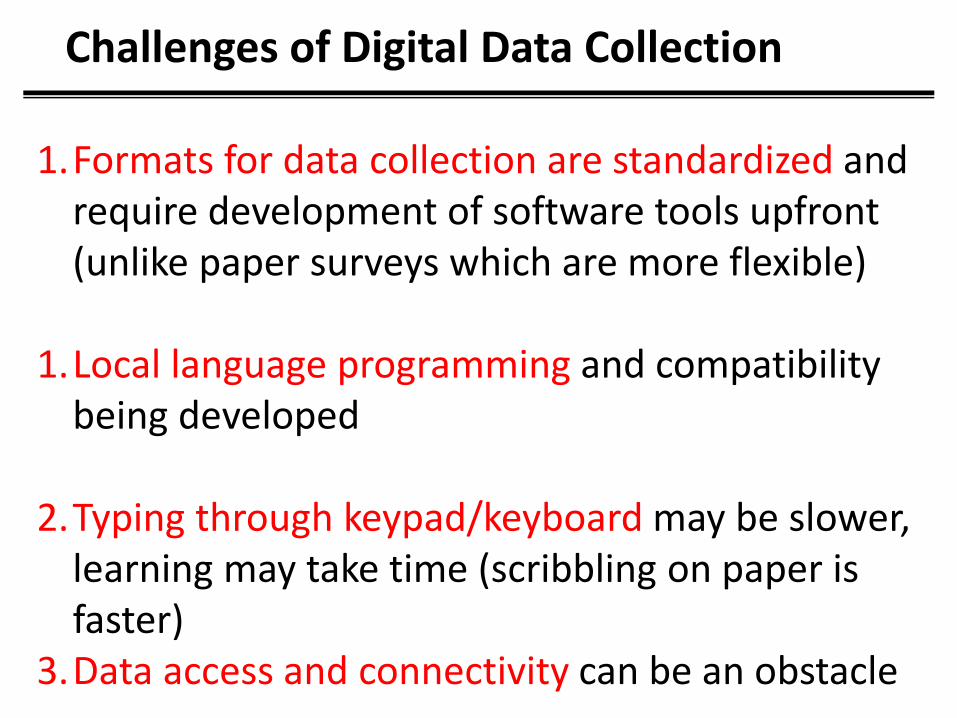
1.Formats for data collection are standardized and require development of software tools upfront (unlike paper surveys which are more flexible)
1.Local language programming and compatibility being developed
2.Typing through keypad/keyboard may be slower, learning may take time (scribbling on paper is faster)
3.Data access and connectivity can be an obstacle
Challenges of Digital Data Collection
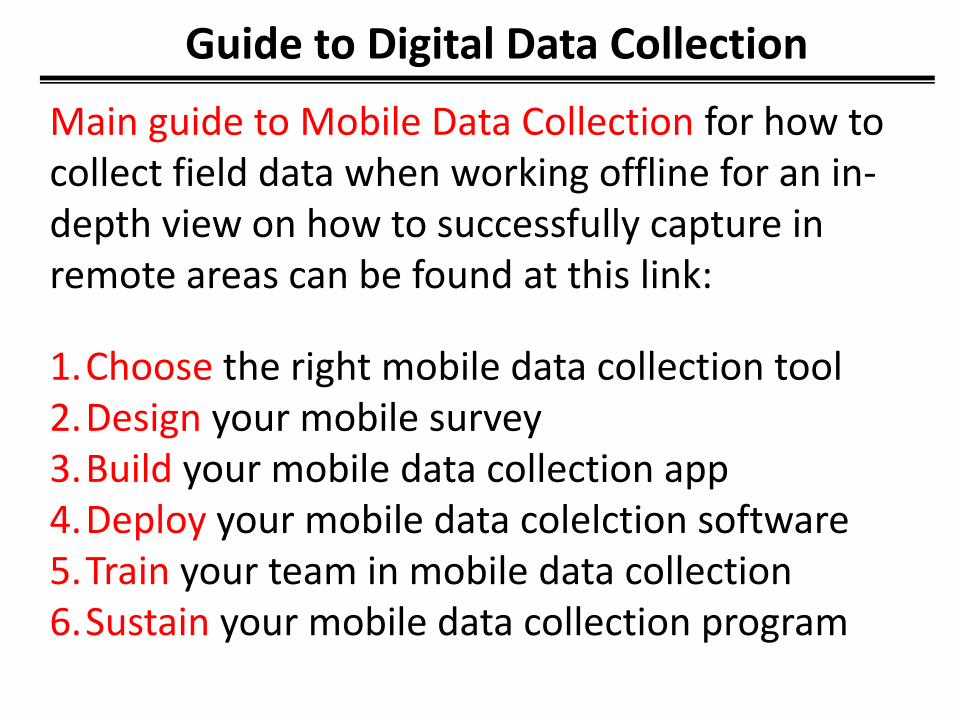
1.Choose the right mobile data collection tool2.Design your mobile survey3.Build your mobile data collection app4.Deploy your mobile data colelction software5.Train your team in mobile data collection6.Sustain your mobile data collection program
Guide to Digital Data Collection
Main guide to Mobile Data Collection for how to collect field data when working offline for an in-depth view on how to successfully capture in remote areas can be found at this link:
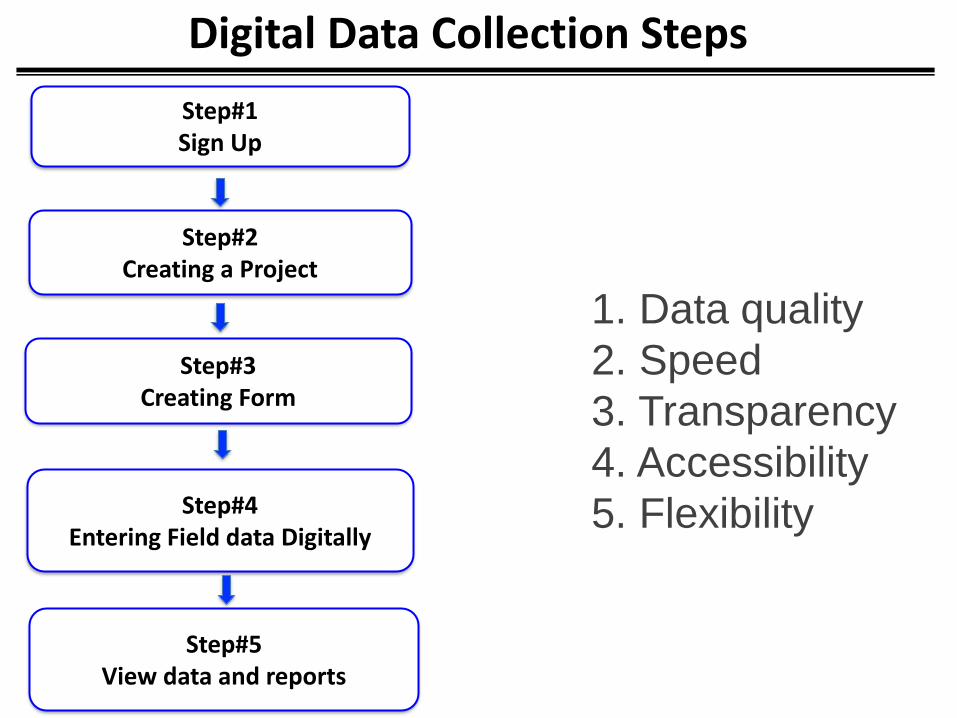
Step#1Sign Up
Digital Data Collection Steps
Step#2Creating a Project
Step#3Creating Form
Step#4Entering Field data Digitally
Step#5View data and reports
1. Data quality
2. Speed
3. Transparency
4. Accessibility
5. Flexibility

Longitudinal Data (Panel Data)Track the same sample at different points in time. The sample can consist ofindividuals, households, establishments, and so on. This type of data collectionsaves time and improves data quality in longitudinal research because iteliminates the need to re-enter baseline data each time the same subject isassessed.
Cross-sectional DataRecording data at a single one point in time, a so-called, snapshot of apopulation is a cross-sectional study. This data is only collected once. Thesetypes of studies are always observational, wherein researchers recordinformation about their subjects without manipulating the study environment.
Longitudinal vs Cross-sectional Data Collection
Digital Data Collection Types

Data sources and data collection Methods
Four types of data sources and data collection
methods are distinguished in this section – in
particular.

1. Administrative data:
Administrative data refer to the set of data derived
from an administrative source, that is by an
“organisational unit responsible for implementing an
administrative regulation (or group of regulations), for
which the corresponding register of units and the
transactions are viewed as a source of statistical data
(OECD Glossary of Statistical Terms)
http://stats.oecd.org/glossary/

2. Statistical Surveys:
Statistical surveys refer to both sample surveys and
censuses. They refer to an investigation about the
characteristics of a given population by means of
collecting data from a sample of that population
(sample survey) or from the whole population
(census) and estimating their characteristics through
the systematic use of statistical methodology.

3. Modelling:
Modelling here refers to the estimation of a
variable/data item which cannot be
measured directly, but is estimated based
on measurable and observable data.

4. In-situ measurement
In-situ measurement refers to techniques to
collect detailed consumption data based on a
measuring device which for example can be
installed at the point of final consumption.

Each of these data sources has some
advantages and disadvantages. Ideally the
objective is to collect data by the most
efficient means possible.
Summary of advantages and disadvantages related to statistical techniques is shown in table 2.1

Method Advantages Disadvantages
Statistical Surveys
• Comprehensive information
• Good data quality
• Can be used directly and as an input for model calculations
• Good response rates when surveys are covered by
legislation
• Resource intensive and expensive
• Time consuming
• High survey burden
• If voluntary, response rates can be low
• Data validation required
Administrative data
• Low survey burden
• Greater number of records allows more detailed
breakdowns
• Avoids duplication by making use of existing data
• No sample error
• Dependency on third parties
• Definitions and information may not match statistical
needs
• Often requires substantial effort to set up and may be legal
barriers to use
Modelling
• Allows quantification of variables that which cannot be
directly measured or observed
• Save resources (money and staff)
• Low survey burden
• Quick results
• Can be used to adapt or improve survey results
• Can be used to reduce survey frequency
• Worse data quality compared to surveys
• No Stand-alone methodology: cannot be calculated
without input data
• Quality of results depend on accuracy of input data and the
design of the model
“In situ” measurements
• Detailed information on individual appliances, information
on patterns of use of the equipment
• High quality of the results
• Input data for surveys and/or modelling
• Invasive for respondents: difficulties in finding respondents
willing to participate
• High burden in terms of time and human resources
• Expensive, so often small samples, and less representative
• Constraints in monitoring equipment: limitation in the
number of metering devices and monitoring incidences
Table 2.1: Summary of advantages and disadvantages related to statistical techniques

Top Open-Source Data collection tools and Research
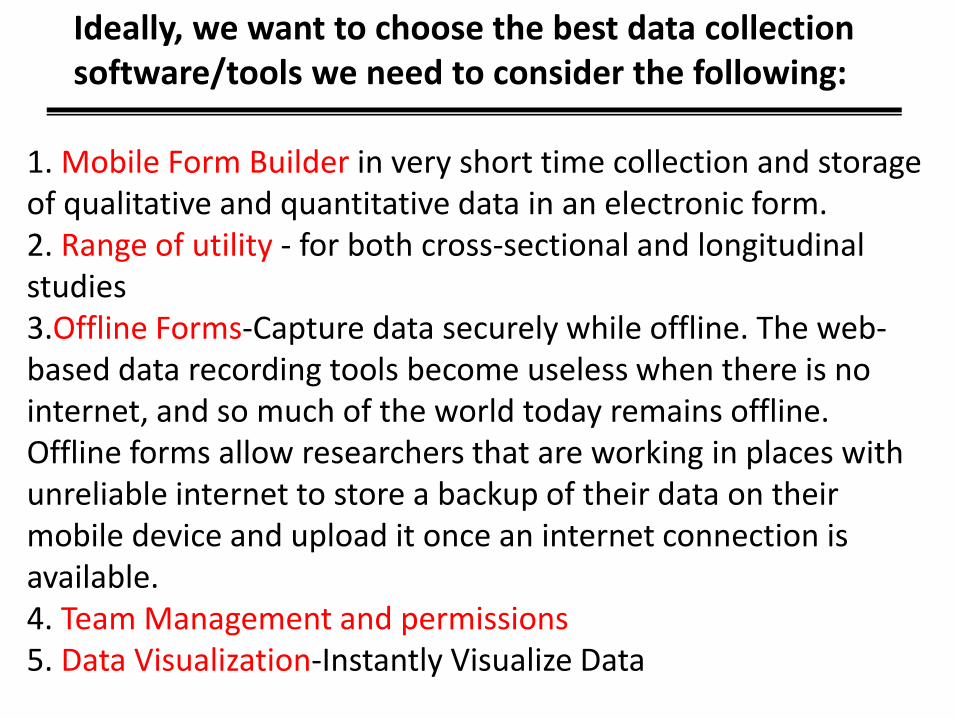
1. Mobile Form Builder in very short time collection and storage of qualitative and quantitative data in an electronic form.2. Range of utility - for both cross-sectional and longitudinal studies3.Offline Forms-Capture data securely while offline. The web-based data recording tools become useless when there is no internet, and so much of the world today remains offline.Offline forms allow researchers that are working in places with unreliable internet to store a backup of their data on their mobile device and upload it once an internet connection is available.4. Team Management and permissions5. Data Visualization-Instantly Visualize Data
Ideally, we want to choose the best data collection software/tools we need to consider the following:

Top Open-Source Data collection tools and research
1. KoboToolbox (Android & Web): Simple, robust, and powerful tools for data collection (https://www.kobotoolbox.org ). KoBoToolbox is a free, open-source tool for mobile data gathering developed by the Harvard Humanitarian Initiative. KoBo Toolbox is widely used for data entry in humanitarian organizations like the International Rescue Committee (IRC), United Nations Office for the Coordination of Humanitarian Affairs and Save the Children.
Features: Study builder, offline forms, open source, community Cost: Free, open sourceAvailability: Android and Web.

2. Open Data Kit (Android) (ODK) (https://opendatakit.org), a suite of tools that enable efficient and timely data collection on cell phones. ODK is designed to let users own, visualize, and share data without the difficulties of setting up and maintaining servers. The tools are easy to use, deploy, and scale. They also go beyond open source - they're based on open standards and supported by a larger community.
Features: Study builder, offline forms, community
Cost: Free, open source
Availability: Android
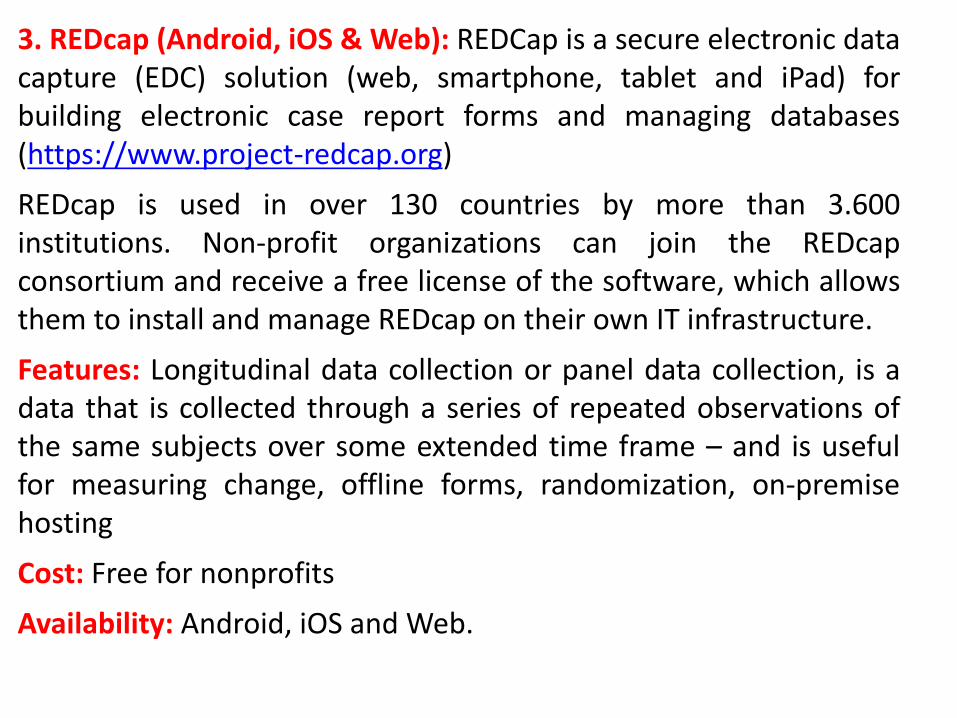
3. REDcap (Android, iOS & Web): REDCap is a secure electronic datacapture (EDC) solution (web, smartphone, tablet and iPad) forbuilding electronic case report forms and managing databases(https://www.project-redcap.org)
REDcap is used in over 130 countries by more than 3.600institutions. Non-profit organizations can join the REDcapconsortium and receive a free license of the software, which allowsthem to install and manage REDcap on their own IT infrastructure.
Features: Longitudinal data collection or panel data collection, is adata that is collected through a series of repeated observations ofthe same subjects over some extended time frame – and is usefulfor measuring change, offline forms, randomization, on-premisehosting
Cost: Free for nonprofits
Availability: Android, iOS and Web.

4. JetForm (iOS and Android): Jotforms, a reputable simple online formbuilder, has expanded its range with a new mobile data recording app calledJotforms mobile. Thousands of customizable form templates. Createregistration forms, order forms, contact forms, surveys, and more! Over10,000,000 Users. No Coding Needed. Free Forever. Publish Anywhere. NoTrial. Powerful Integrations. (https://www.jotform.com ) This app allows usersto collect various types of data, such as voice recordings, barcodes,geolocations and electronic signatures and then build, view, access, sort, fillout, share, and organise all this data in a single place. The utility of using amobile data recording app, in this case, enables it to function offline and utiliseiOS and Android push notifications to alert the user of new respondents orchanges in data. PDF copies of submitted information can even be downloadedor shared.One of Jotforms distinct features is Kiosk Mode. Kiosk mode turnsyour tablet or iPad into a fixed survey station.
Features: Mobile form builder, Offline data gathering, Kiosk Mode.Cost: Free basic accounts, paid pro and enterprise plans availableAvailability: iOS and Android

5. Google Forms (Web): Best simple and easy form builder to collectdata online. it is a survey administration software included as part ofthe free, web-based Google Docs Editors suite offered by Google. Theservice also includes Google Docs, Google Sheets, Google Slides,Google Drawings, Google Sites, and Google Keep. Google Forms is onlyavailable as a web application. (https://www.google.com/intl/en-GB/forms/about/).
6. Smartsheet is a popular tool for collaborating with colleagues,tracking project progress, managing shared calendars, and sharingdocuments.
Features: Use a form, for example, to collect survey responses, intake project requests, or gather product orders, collaboration, file sharing, mobility, reportingCost: Free 30-day account using your personal email address. The Individual package is $14 per month and is good for people who want to be more efficient and collaborate with anyone involved in a project.Availability: Diverse functionality and cloud-based project management platform that uses an enhanced spreadsheet-like interface.
https://www.smartsheet.com/?_ga=2.14829750.1463977109.1628410423-806558848.1628254497

Case Study#1Using Open Source KoBoToolbox for Digital surveys Data Collection for Gender Equity and Social Inclusion (GESI)

UPNG STUDENTS-GENDER Gender Equity Social Inclusion (GESI)
Implementation Baseline Review

The purpose of the survey is to identify organizationalstrengths and limitations, attitudinal, behavioural andstructural, which exist in this institution to promote or inhibitGESI practice. Individual Consent Form will be filled in for alldata collection activities and all information gathered will betreated with the strictest confidence.
You will not be asked to provide your name. Moreimportantly, Ethical Clearance has been sought frominstitutional Research Protocols and the Department ofHigher Education Research Science Technology (DHERST) forthe necessary data collection methods which includesindividual survey questionnaires, document analysis,observation guidelines, focus group workshop and leadersin-depth interviewing.
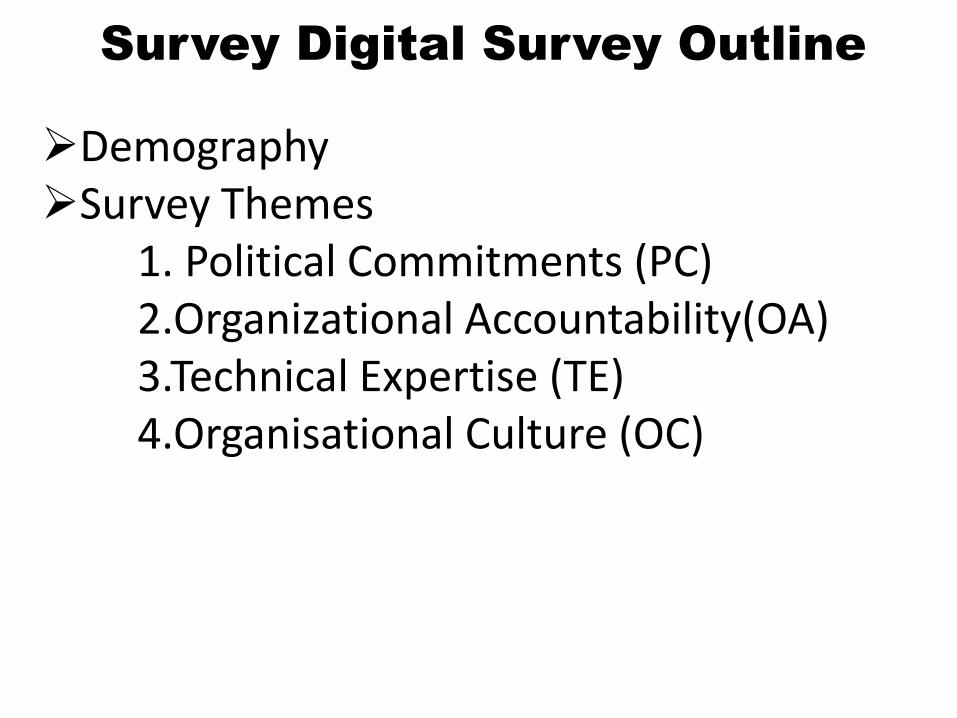
Survey Digital Survey Outline
➢Demography➢Survey Themes
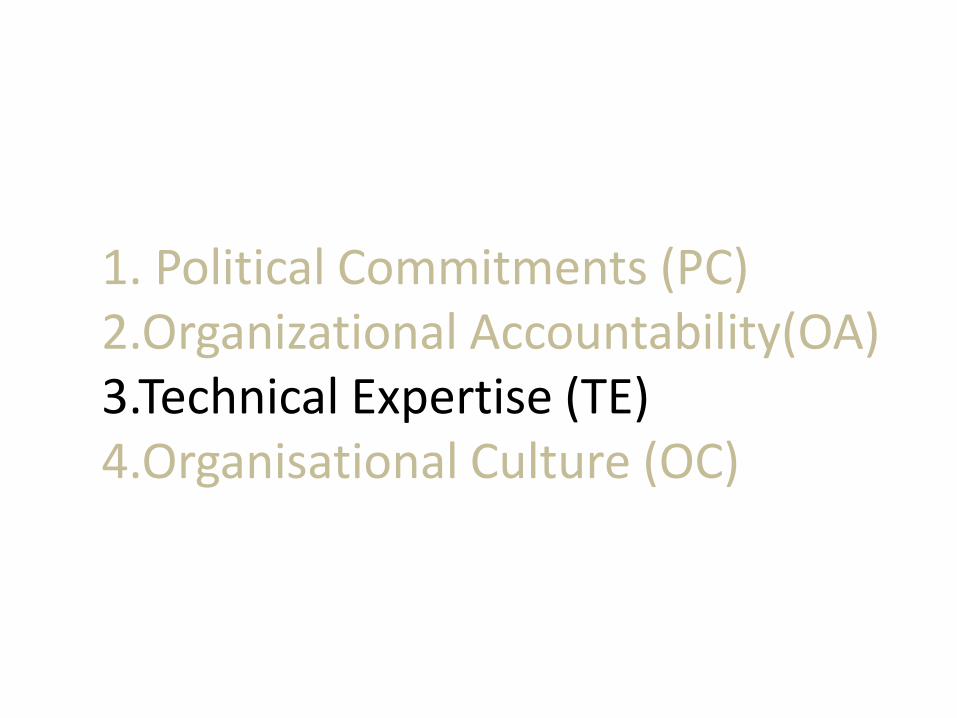
1. Political Commitments (PC)2.Organizational Accountability(OA)3.Technical Expertise (TE)4.Organisational Culture (OC)

DEMOGRAPHYDemography is the statistical study of populations, especially human beings. Demographic analysis can cover whole societies or groups defined by criteria such as education, nationality, religion, and ethnicity.
Demographic information allows you to better understand certain background characteristics of an audience, whether it's their age, race, ethnicity, income, work situation, marital status, etc.

Gender Participation-UPNG
106 Out of 230
124 Out of 230
53%
Female47%
MaleGender Participation

Age Range-UPNG
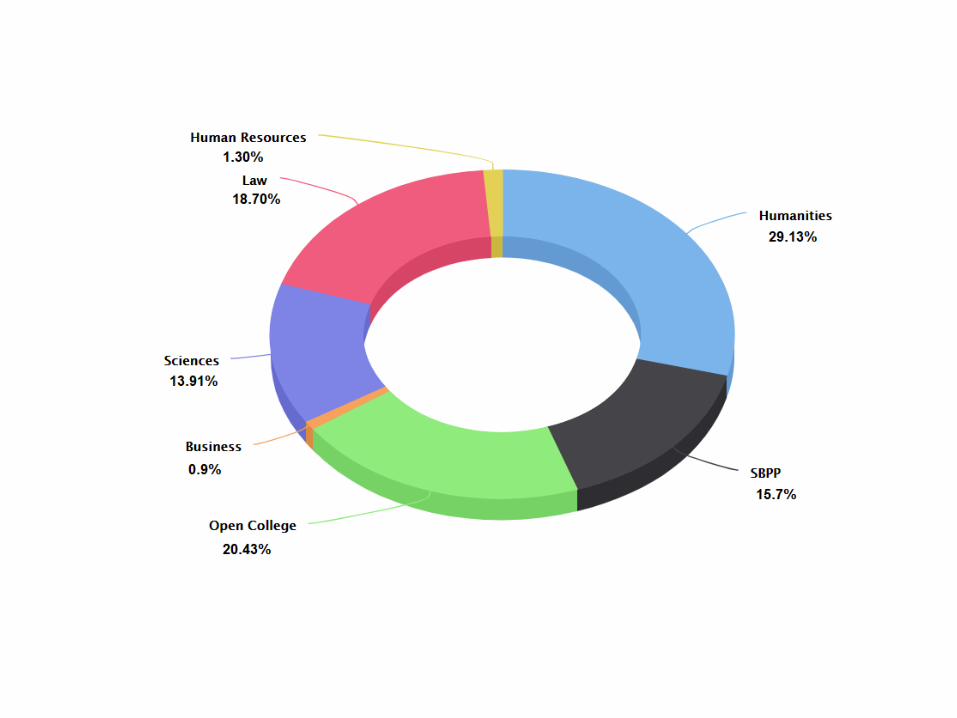
School or Discipline-UPNG

1. Political Commitments (PC)2.Organizational accountability(OA)3.Technical Expertise (TE)4.Organisational Culture (OC)
Survey Themes-UPNG
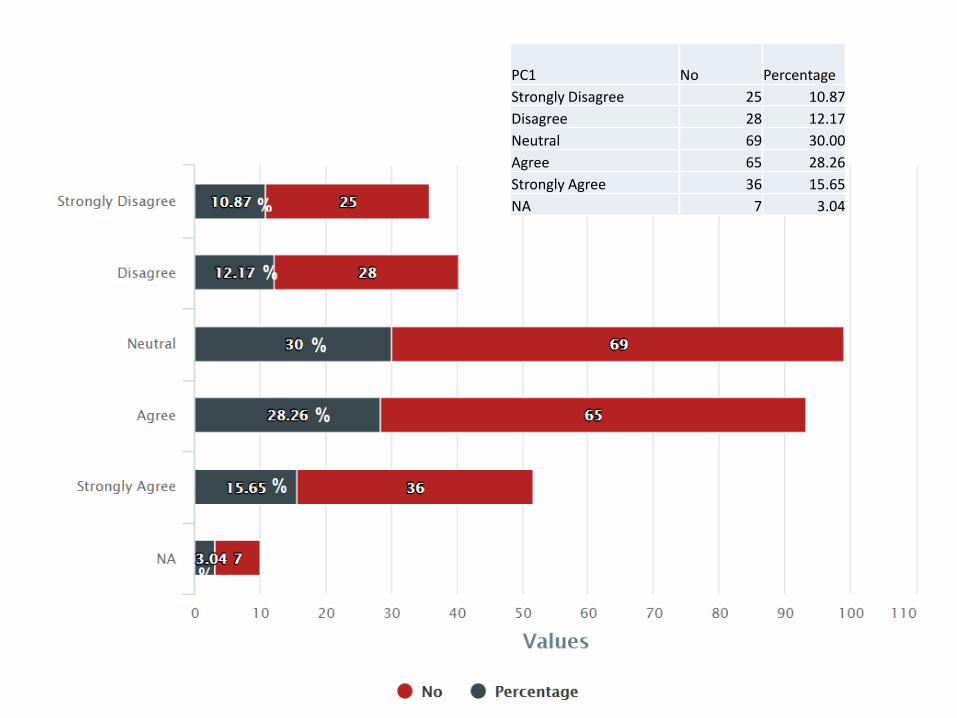
PC-Q1: I believe that the Academic Board/Steering Committee supports diversity and inclusion.
PC1 No Percentage
Strongly Disagree 25 10.87
Disagree 28 12.17
Neutral 69 30.00
Agree 65 28.26
Strongly Agree 36 15.65
NA 7 3.04

PC3 No Percentage
Unsure 157 50.32051
Yes 109 34.9359
NO 37 11.85897
NA 9 2.884615
157
50.32%
2.9%
9
11.9%
34.93%
37
109

1. Political Commitments (PC)2.Organizational Accountability(OA)3.Technical Expertise (TE)4.Organisational Culture (OC)
Survey Theme

1. Political Commitments (PC)2.Organizational Accountability(OA)3.Technical Expertise (TE)4.Organisational Culture (OC)
Survey Theme
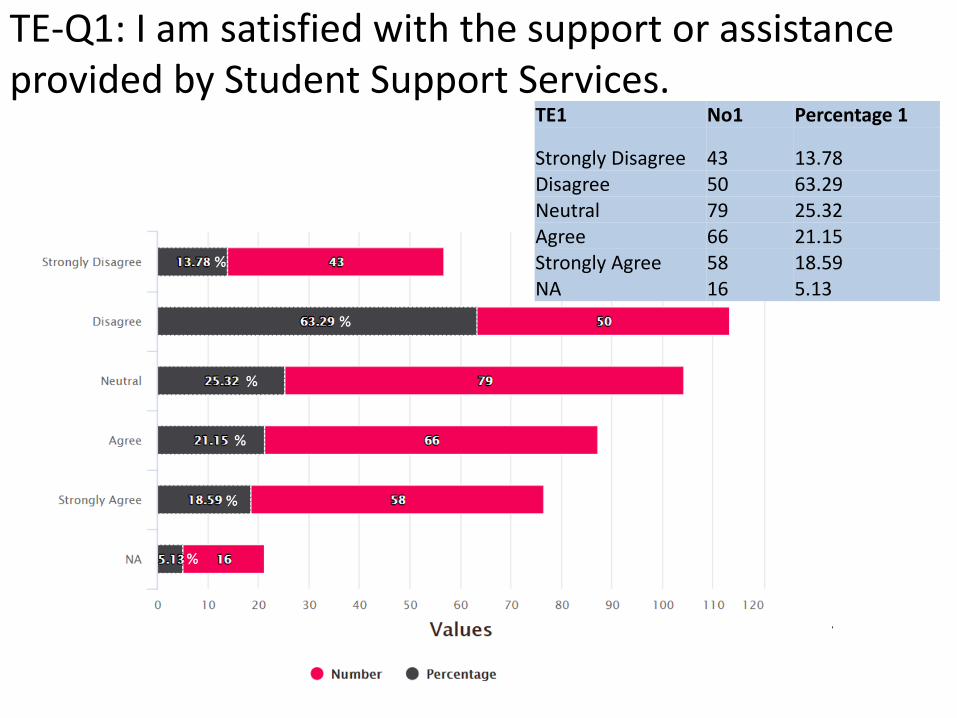
TE-Q1: I am satisfied with the support or assistance provided by Student Support Services.
TE1 No1 Percentage 1
Strongly Disagree 43 13.78Disagree 50 63.29Neutral 79 25.32Agree 66 21.15Strongly Agree 58 18.59NA 16 5.13

TE2 No 2 Percentage 2
No 85 27.24
Yes 105 93.75
Unsure 112 35.90
NA 10 3.21
TE-Q2: Sexual Harassment is an unwelcome sexual advance, unwelcome request for sexual favours or other unwelcome conduct of a sexual nature which, in the circumstances, a reasonable person, aware of those circumstances, would anticipate the possibility that the person would feel offended, humiliated or intimidated.

TE-Q3: Do you know where you can go in this institution to formally report, or make a complaint about, an experience of sexual harassment?
TE3 No3 Percentage 3
I know very little about this 94 30.13
I know everything about this 8 2.56
I know some knowledge about this 79 25.32
NA 13 4.17
I know a lot about this 6 1.92
I know nothing about this 112 35.90

TE-Q4: This institution has a clearly stated policy on sexual harassment and sexual assault that sets out procedures for lodging a complaint.
TE4 No 4 Percentage 4
No 48 15.38
Yes 66 36.26
Unsure 182 58.33
NA 16 5.13
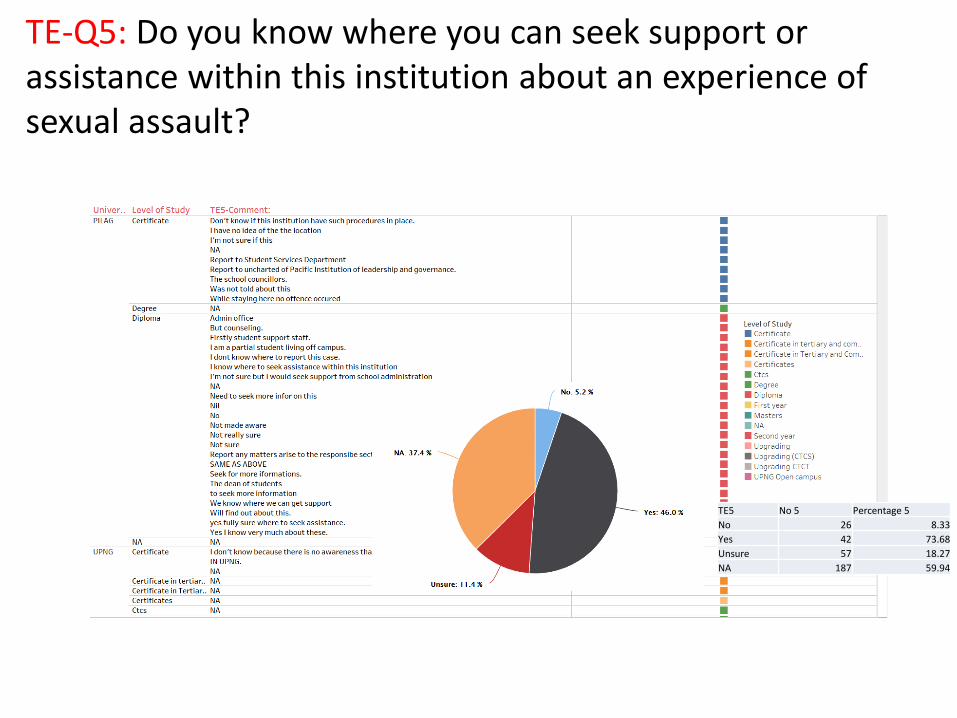
TE-Q5: Do you know where you can seek support or assistance within this institution about an experience of sexual assault?
TE5 No 5 Percentage 5
No 26 8.33
Yes 42 73.68
Unsure 57 18.27
NA 187 59.94

TE-Q6: Do you know where you can go in this institution to formally report, or make a complaint about an experience on sexual assault?
TE6 No 6 Percentage 6
I know very little about this 9 3.00
I know some knowledge about this 1 0.33
NA 290 96.67
1. Political Commitments (PC)2.Organizational Accountability(OA)3.Technical Expertise (TE)4.Organisational Culture (OC)
Survey Theme
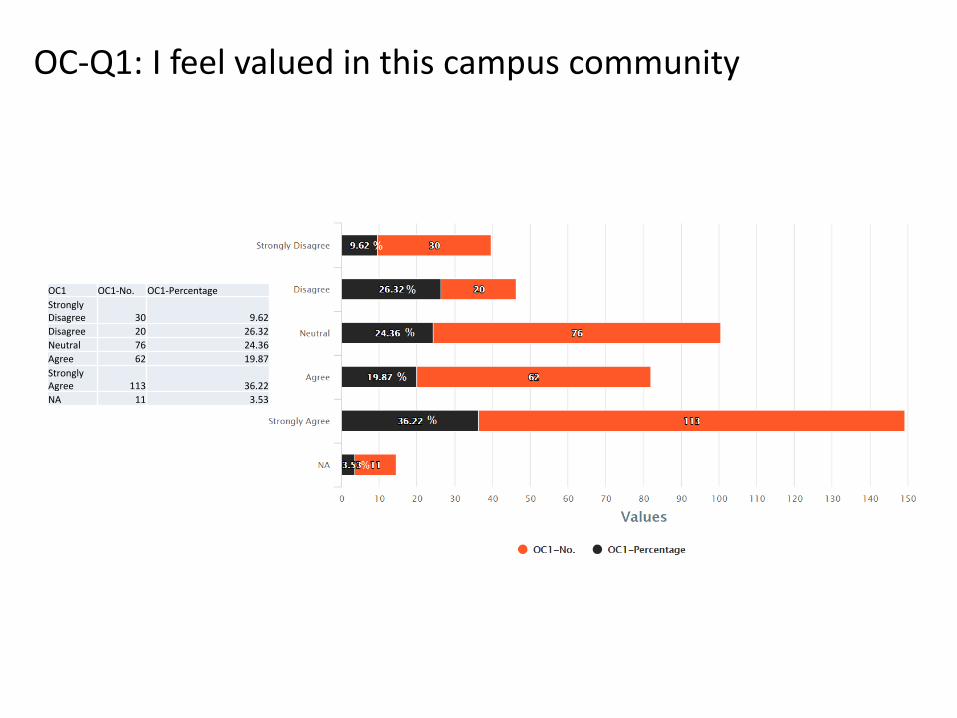
OC-Q1: I feel valued in this campus community
OC1 OC1-No. OC1-Percentage
Strongly Disagree 30 9.62
Disagree 20 26.32
Neutral 76 24.36
Agree 62 19.87
Strongly Agree 113 36.22
NA 11 3.53

OC-Q2: In general, how would you rate your overall experiences of this institution’s environment?
OC2-Supportive
OC2-Supportive-No
OC2-Supportive-Percentage
OC2-Fair
OC2-Fair-No.
OC2-Fair-Percentage
OC2-Respectful
OC2-Respectful-No.
OC2-Respectful-Percentage
OC2-Welcoming
OC2-Welcoming-No.
OC2-Welcoming-Percentage
OC2-Inclusive
OC2-Inclusive-No.
OC2-Inclusive-Percentage
Strongly Disagree 30 9.62
Strongly Disagree 33 10.58
Strongly Disagree 29 9.29
Strongly Disagree 23 7.37
Strongly Disagree 21 6.73
Disagree 41 13.14Disagree 45 14.42
Disagree 41 13.14
Disagree 39 12.50
Disagree 30 9.62
Neutral 75 24.04Neutral 96 30.77
Neutral 79 25.32
Neutral 70 22.44
Neutral 89 28.53
Agree 72 23.08Agree 61 19.55Agree 60 19.23Agree 65 20.83Agree 77 24.68
Strongly Agree 76 24.36
Strongly Agree 55 17.63
Strongly Agree 77 24.68
Strongly Agree 86 27.56
Strongly Agree 66 21.15
NA 18 5.77NA 22 7.05NA 26 8.33NA 29 9.29NA 29 9.29

OC-Q2: In general, how would you rate your overall experiences of this institution’s environment?

OC-Q3: Institution takes efforts to provide reasonable, safe and secure accommodation to female students, persons with disabilities and special needs, and single mothers as head of family. How would you rate this?OC3 OC3-No. OC3-Percentage
Strongly Disagree 47 15.06Disagree 45 71.43Neutral 63 20.19Agree 76 24.36Strongly Agree 71 22.76
NA 10 3.21
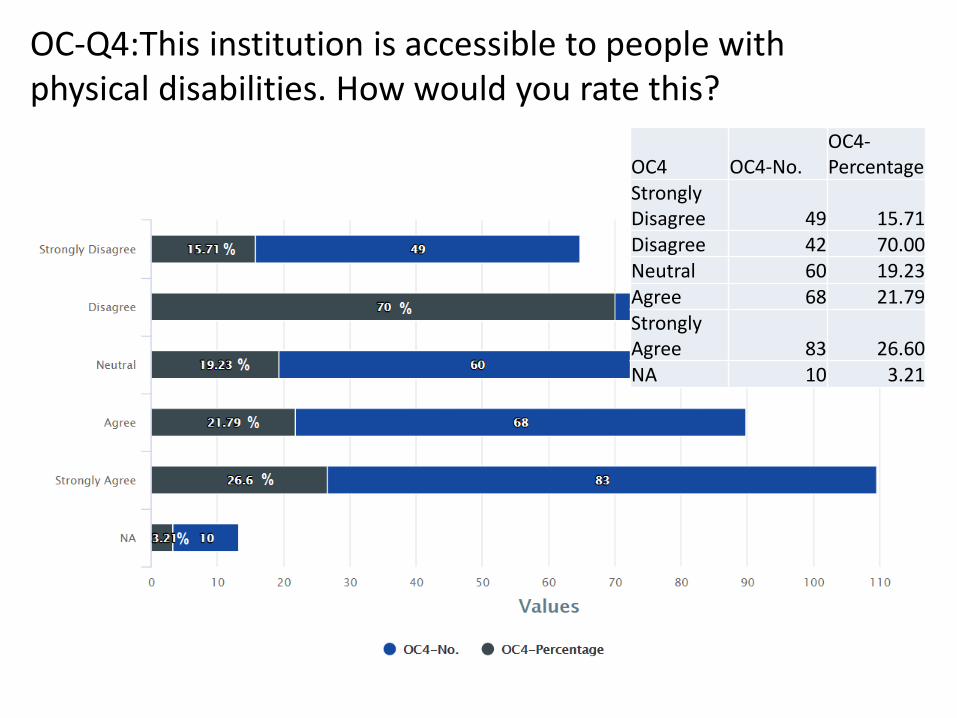
OC-Q4:This institution is accessible to people with physical disabilities. How would you rate this?
OC4 OC4-No. OC4-Percentage
Strongly Disagree 49 15.71Disagree 42 70.00Neutral 60 19.23Agree 68 21.79Strongly Agree 83 26.60NA 10 3.21

OC-Q5: Appointments to important committees or special projects are available to people from underrepresented groups. How would you rate this?
OC5 OC5-No. OC5-Percentage
Strongly Disagree 32 10.26
Disagree 70 68.63
Neutral 102 32.69
Agree 71 22.76
Strongly Agree 29 9.29
NA 8 2.56

OC-Q6:People of different backgrounds and abilities have respect for each other in this institution.
OC6 OC6-No. OC6-Percentage
Strongly Disagree 31 9.94
Disagree 46 69.70
Neutral 66 21.15
Agree 77 24.68
Strongly Agree 85 27.24
NA 7 2.24

OC-Q7: I feel confident and comfortable reporting harassment, bullying, gender based violence or discrimination. How would you rate this?
OC7 OC7-No. OC7-Percentage
Strongly Disagree 49 15.71
Disagree 40 52.63
Neutral 76 24.36
Agree 71 2.76
Strongly Agree 60 19.23
NA 16 5.13
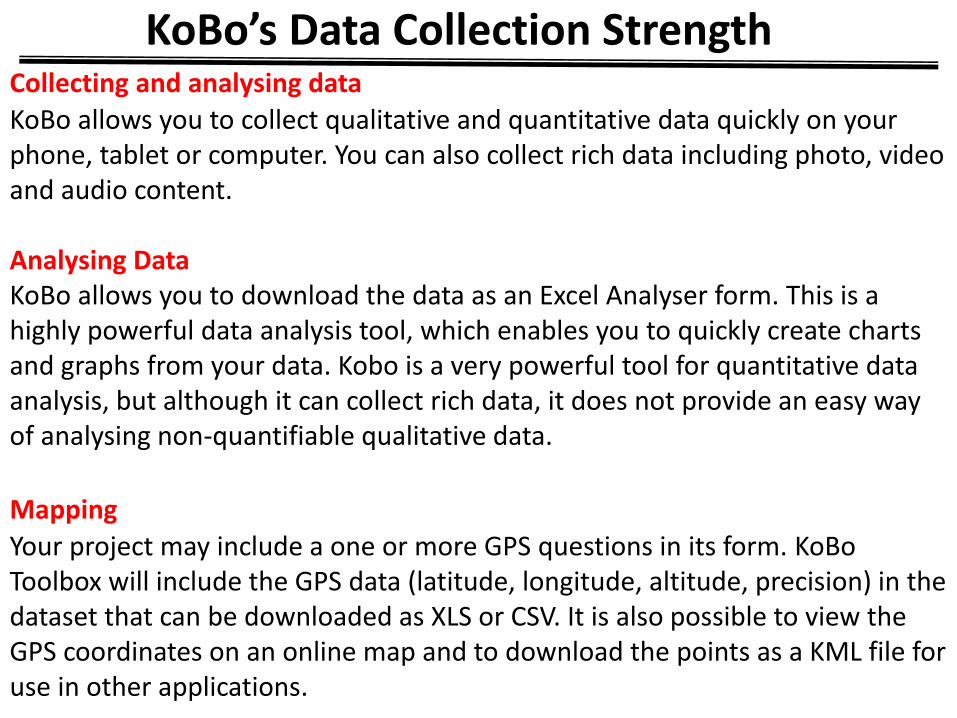
KoBo’s Data Collection StrengthCollecting and analysing data
KoBo allows you to collect qualitative and quantitative data quickly on your phone, tablet or computer. You can also collect rich data including photo, video and audio content.
Analysing DataKoBo allows you to download the data as an Excel Analyser form. This is a highly powerful data analysis tool, which enables you to quickly create charts and graphs from your data. Kobo is a very powerful tool for quantitative data analysis, but although it can collect rich data, it does not provide an easy way of analysing non-quantifiable qualitative data.
Mapping
Your project may include a one or more GPS questions in its form. KoBoToolbox will include the GPS data (latitude, longitude, altitude, precision) in the dataset that can be downloaded as XLS or CSV. It is also possible to view the GPS coordinates on an online map and to download the points as a KML file for use in other applications.
KoBo’s Data Collection Strength
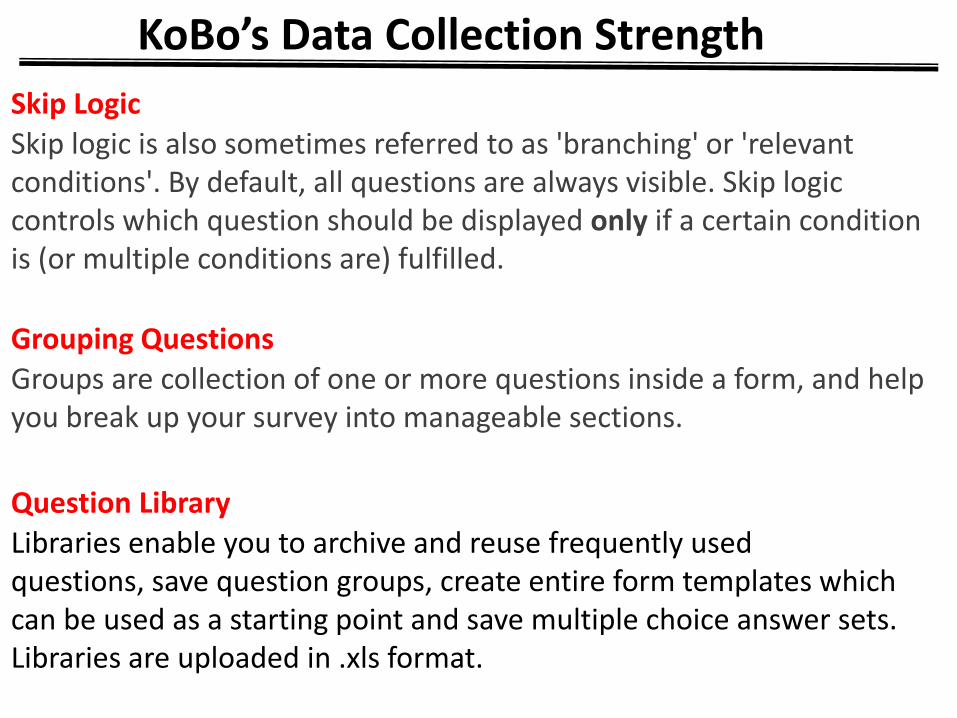
Skip Logic
Skip logic is also sometimes referred to as 'branching' or 'relevant conditions'. By default, all questions are always visible. Skip logic controls which question should be displayed only if a certain condition is (or multiple conditions are) fulfilled.
Grouping Questions
Groups are collection of one or more questions inside a form, and help you break up your survey into manageable sections.
Question Library
Libraries enable you to archive and reuse frequently used questions, save question groups, create entire form templates which can be used as a starting point and save multiple choice answer sets. Libraries are uploaded in .xls format.

Collecting data offlineAll data collection can take place offline. When a user enters data it is stored first on the device. KoBoCollect can be set to attempt sending the information through a network connection immediately or only at a later stage when the interviewer or supervisor wants to upload finalized forms.
Support KoBo offers an online community support network. Questions posted on the network will be answered by other users or KoBo staff.
https://support.kobotoolbox.org/
KoBo’s Data Collection Strength

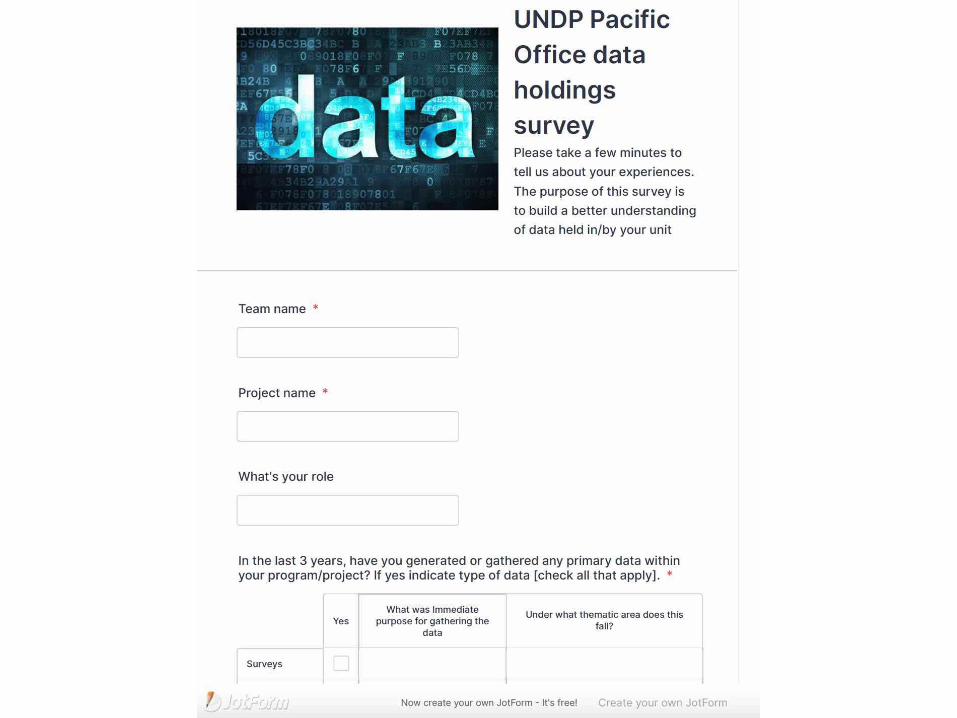
Case Study#2Using JetForm (iOS and Android (Free basic accounts, paid pro and enterprise plans available ) for UNDP Pacific Office data holdings survey


Case Study#3 QUALITATIVE STUDY ON BARRIERS AND SUPPORTIVE FACTORS TO THE USE OF BIOGAS ENERGY TO IMPROVE HEALTH AND WELLBEING IN GUAMBOT VILLAGE –Naweab District
Rapid KABP (Biogas) Survey on The Healthy Island Concept at Guambot Village-NawaebDistrict -Morobe Province
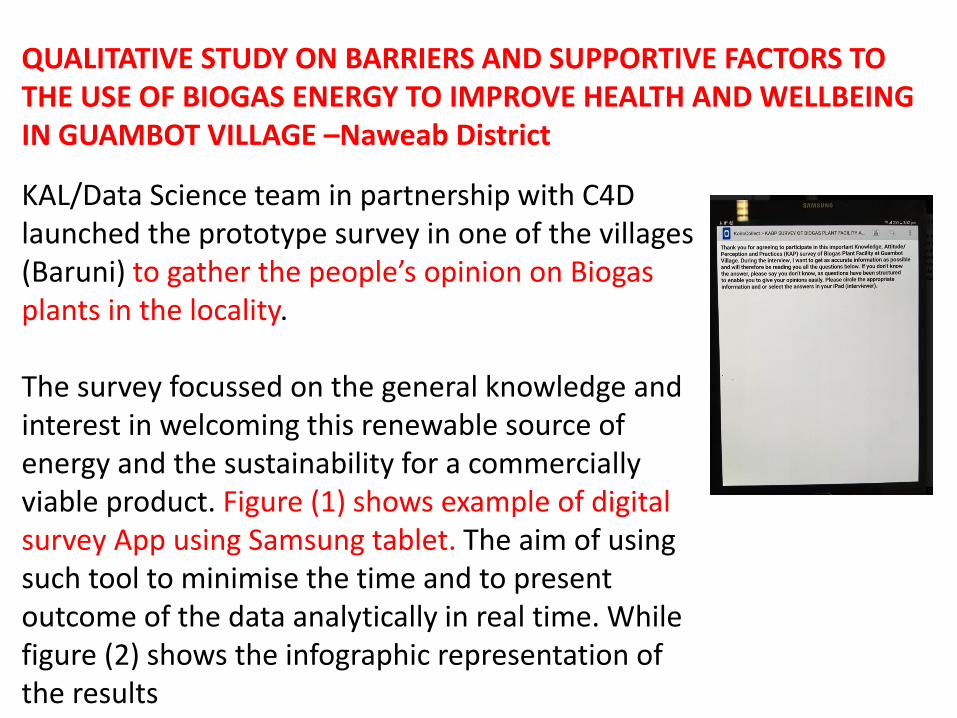
KAL/Data Science team in partnership with C4D launched the prototype survey in one of the villages (Baruni) to gather the people’s opinion on Biogas plants in the locality.
The survey focussed on the general knowledge and interest in welcoming this renewable source of energy and the sustainability for a commercially viable product. Figure (1) shows example of digital survey App using Samsung tablet. The aim of using such tool to minimise the time and to present outcome of the data analytically in real time. While figure (2) shows the infographic representation of the results
QUALITATIVE STUDY ON BARRIERS AND SUPPORTIVE FACTORS TO THE USE OF BIOGAS ENERGY TO IMPROVE HEALTH AND WELLBEING IN GUAMBOT VILLAGE –Naweab District

Nawaeb District
Boana
Guambot Village 4 Hamlets
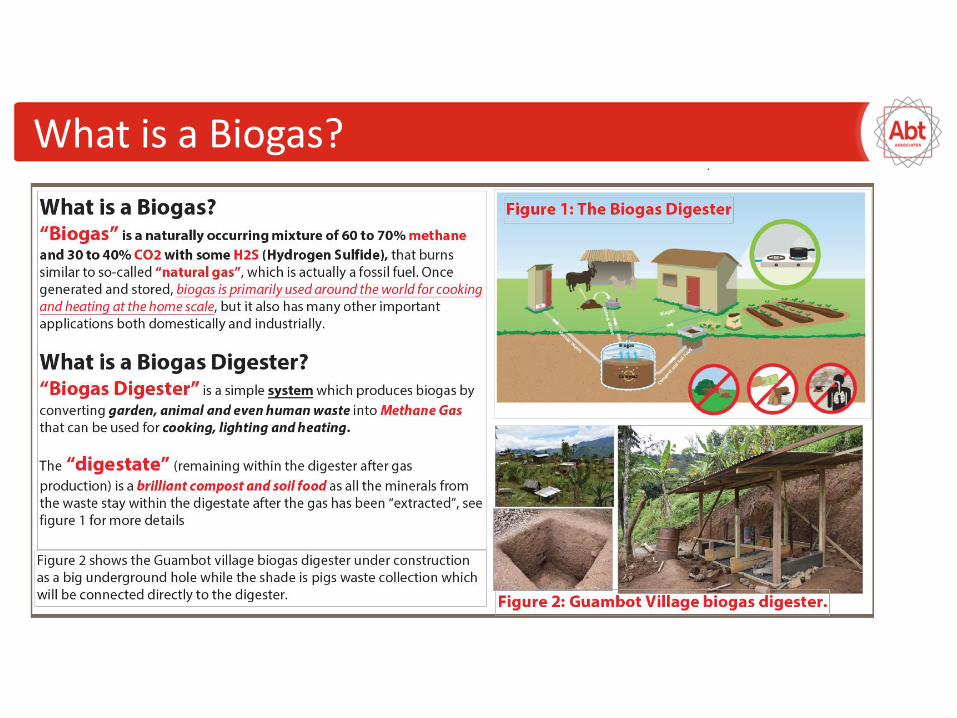
What is a Biogas?
Demographic Data/Questions

Village name : 262 out of 270 respondents answered this question
49
50
125 37
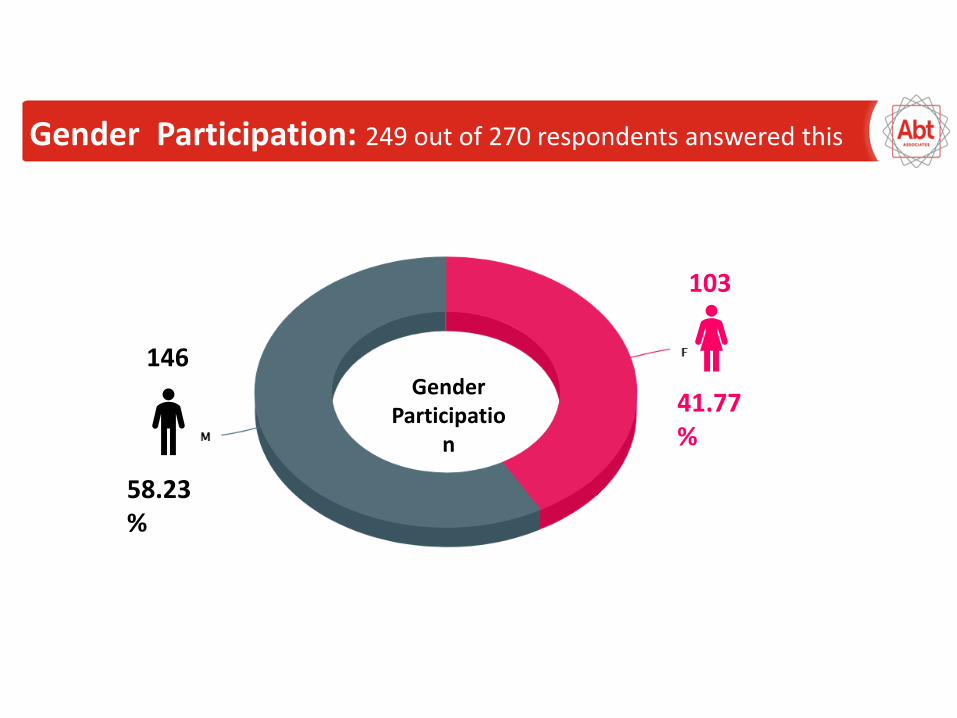
58.23%
41.77%
Gender Participatio
n
146
103
Gender Participation: 249 out of 270 respondents answered this
question

74.61%
9%
1.6%
14.84%
Participants Education
Primary
Other
Tertiary
Secondary
Education: 256 out of 270 respondents answered this question

Participants Age: 249 out of 270 respondents answered this
question
29.83%
47.2%
17.34%
5.65%
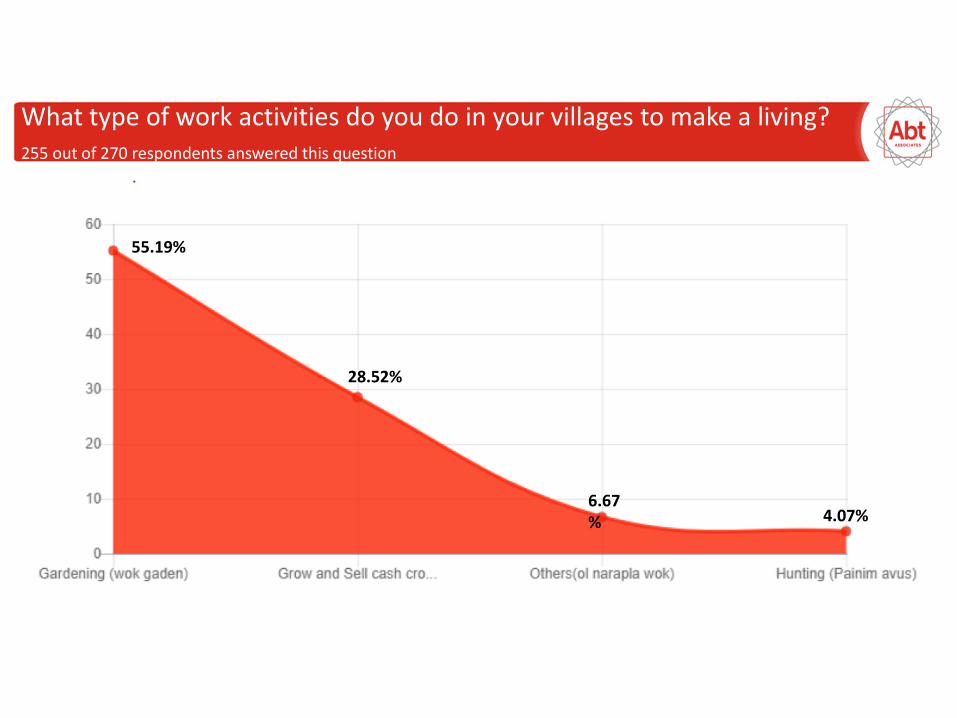
What type of work activities do you do in your villages to make a living? 255 out of 270 respondents answered this question
28.52%
55.19%
6.67% 4.07%

The type of respondent (263 out of 270)
87.78%
5.19%2.22% 0.74%1.48%

AWARNESS LEVEL
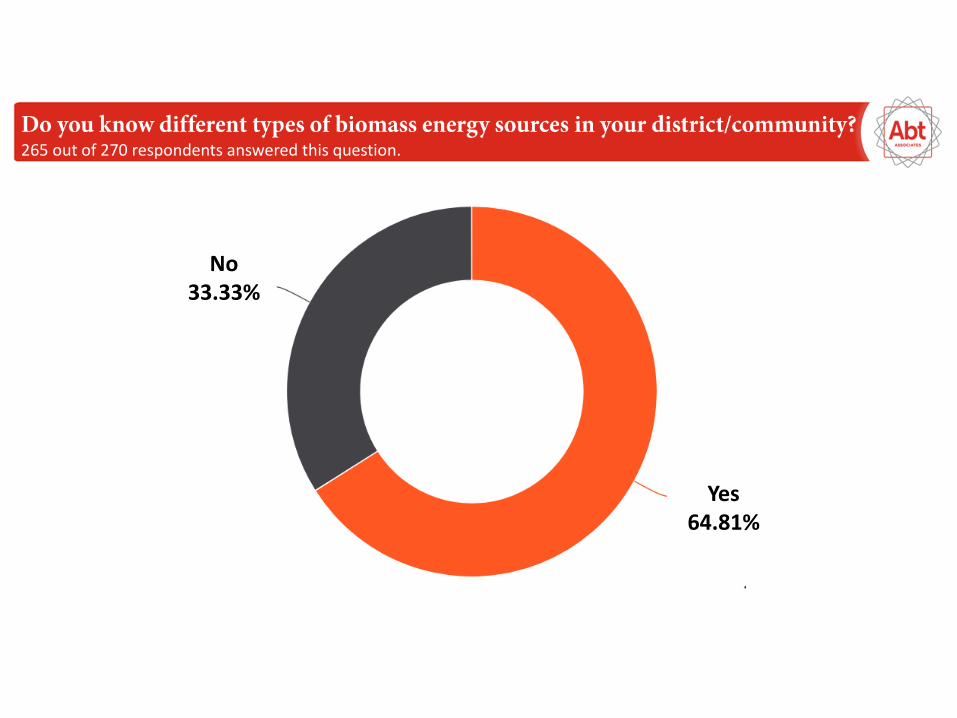
Yes64.81%
No33.33%
265 out of 270 respondents answered this question.

What are the main sources of biomass energy that you know and use in your
district/community? 261 out of 270 respondents answered this question
Firewood70%
Farm Residue20.74%
Charcoal20%
Others11.11%
Liquid8.89%Biogas
9.63%

Are you aware of any methods that are used to produce biogas in a sustainable manner?
Yes29.63%
No12.96%
I don’t Know37.04%

Do you think biogas production technology is good for the environment in your community?262 out of 270 respondents answered this question
Yes71.48%
I don’t know19.26%
No6.3%
244 out of 270 respondents answered this question.If yes39.63%
21.48%
14.44%
9.63%
5.19%

Is it worth investing in biogas technology in your district/community? 255 out of 270 respondents answered this question
87.78%
5.56%
1.11%

Do you think biogas energy is an important source of economic development for your district/community?265 out of 270 respondents answered this question
Income Generatio
n27.78%
8.15%
1.11%
88.89%
Reduce environment pollution27.04%
Revenue14.44%
Employment 14.07%
Others
3.33%
If yes

The biogas project uses human and animal wastes to generate gas energy. 249 out of 270 respondents answered this question.
82.22%
7.41%2.59%
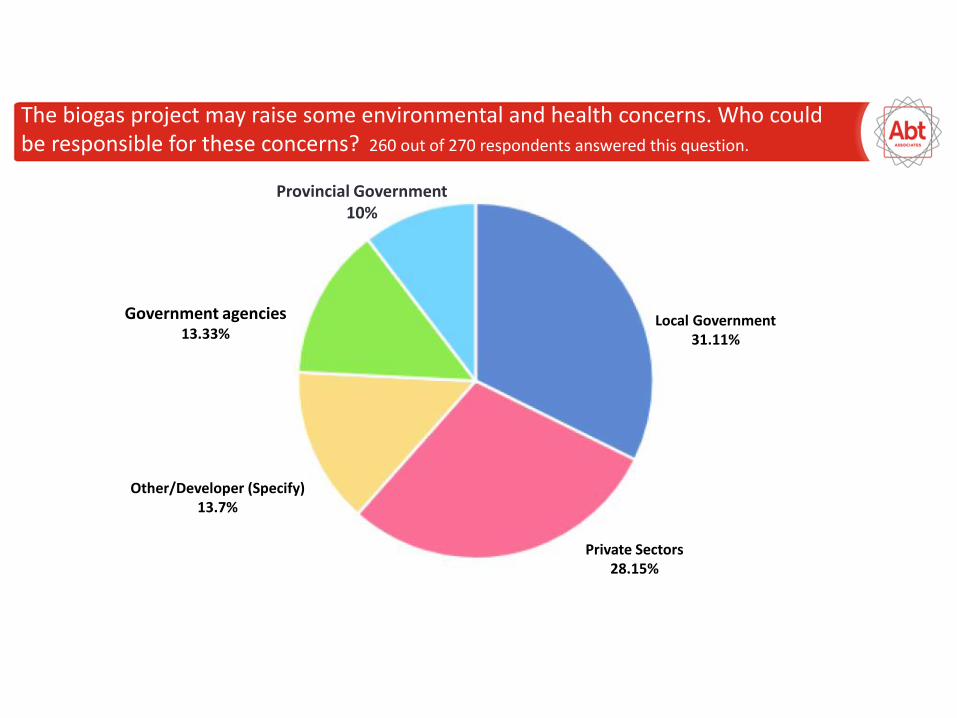
The biogas project may raise some environmental and health concerns. Who could be responsible for these concerns? 260 out of 270 respondents answered this question.
Local Government 31.11%
Private Sectors28.15%
Other/Developer (Specify)13.7%
Government agencies13.33%
Provincial Government10%
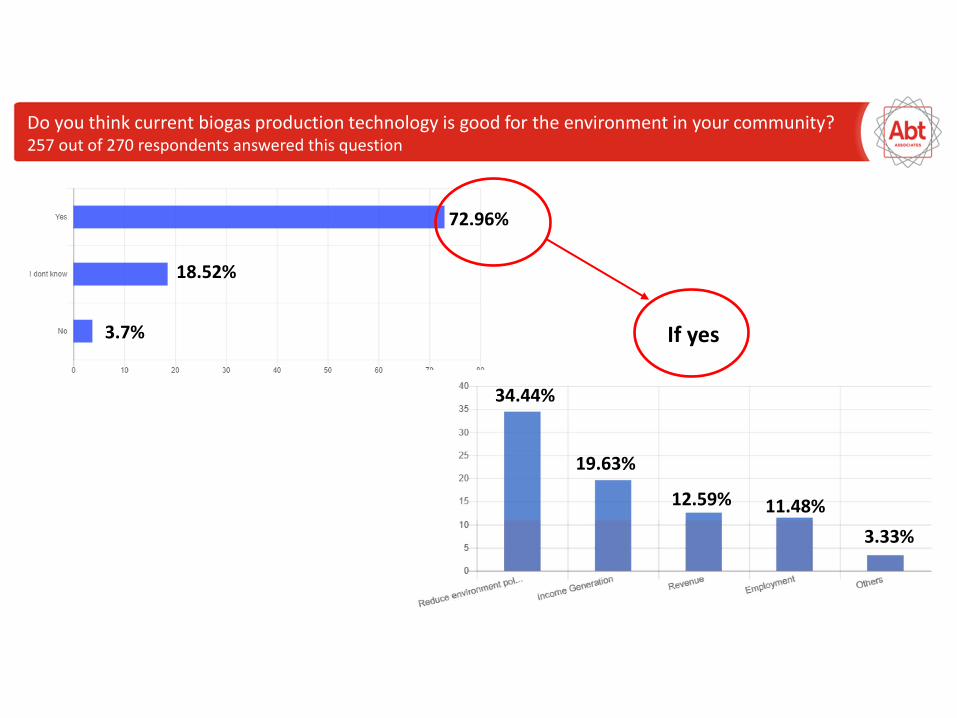
Do you think current biogas production technology is good for the environment in your community? 257 out of 270 respondents answered this question
72.96%
18.52%
3.7% If yes
34.44%
19.63%
12.59% 11.48%
3.33%

Can biogas production be done in a sustainable manner? 243 out of 270 respondents answered this question
138Yes
51.11%
101I don’t Know
37.41%
4No
1.48%
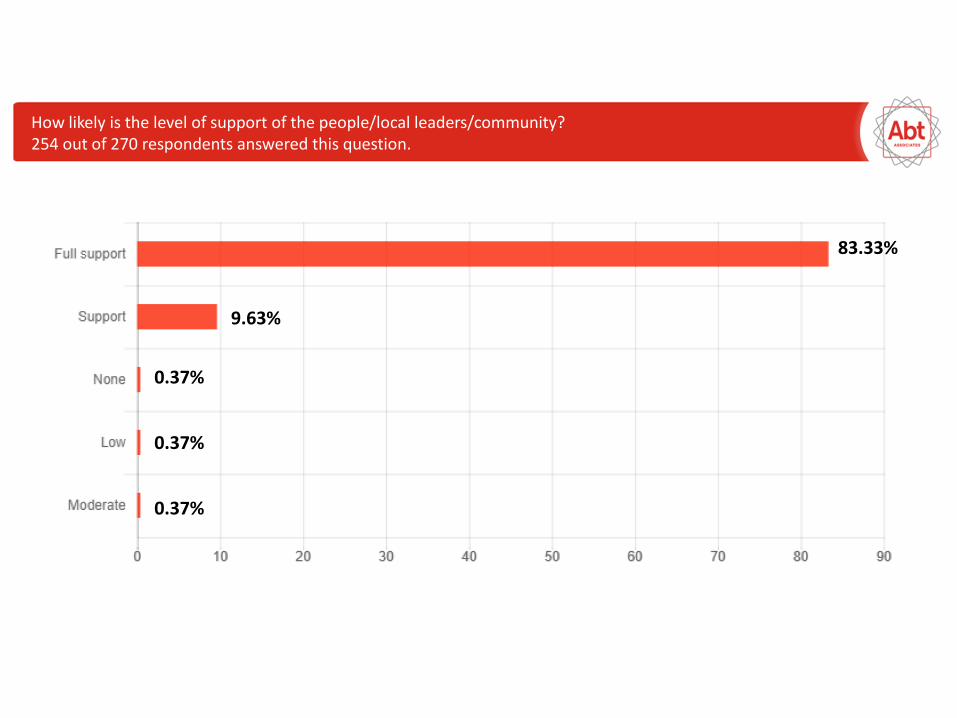
How likely is the level of support of the people/local leaders/community?254 out of 270 respondents answered this question.
0.37%
9.63%
83.33%
0.37%
0.37%

Which of the following can improve the biogas energy production in your district/community? 259 out of 270 respondents answered this question
Technology43.7%
Policies18.15%
Revenue14.44%
Legislation8.89%
Others7.41%
Acts3.33%
ATTITUDE/PERCEPTION

Is it worth investing in biogas technology in your district/community? 255 out of 270 respondents answered this question
87.78%
5.56%
1.11%

Can you mention institutions that are supposed to be supervising the biogas energy sector in your district/community? 265 out of 270 respondents answered this question
38.89%
34.81%
17.41%15.19%
11.85%

Challenges

Are there any challenges in the biogas energy sector in your district/community? 259 out of 270 respondents answered this question
No34.81%
Yes61.11%
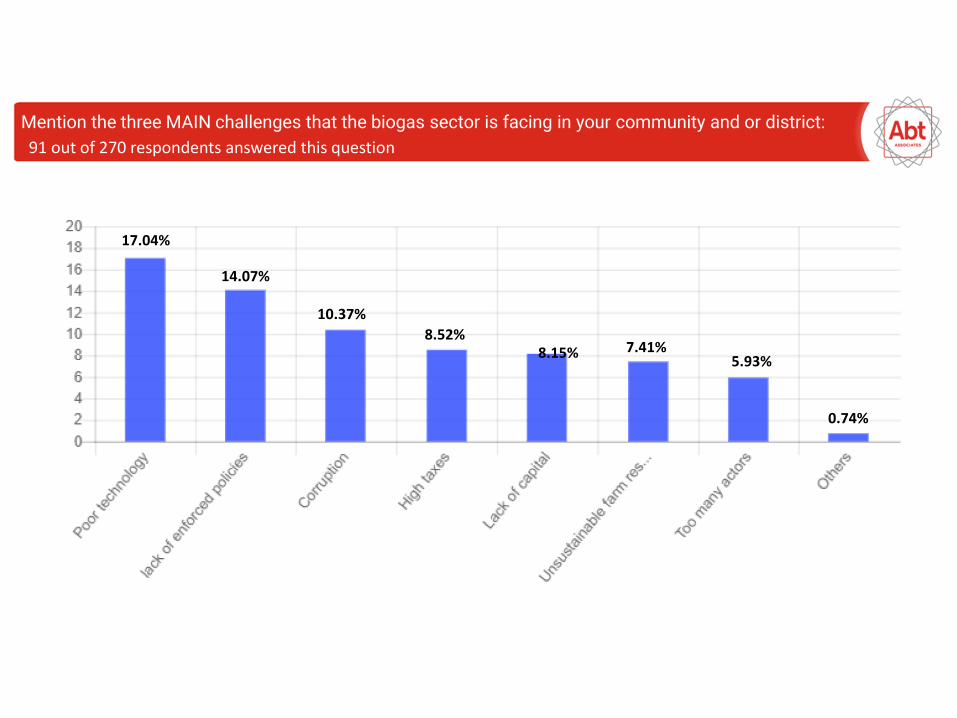
Mention the three MAIN challenges that the biogas sector is facing in your community and or district:
91 out of 270 respondents answered this question
17.04%
14.07%
10.37%
8.52%7.41%8.15%
5.93%
0.74%

Do you have any challenges using different energy sources? 264 out of 270 respondents answered this question.
38.52%
28.52%
25.56%
5.19%

What source is the most appropriate one? 262 out of 270 respondents answered this question
Easily Accessible
53.33%
Cheap41.85%
Reliable21.11%
Efficient14.44%
Others
Firewood
Liquid8.89%
Farm Residue
Biogas
Charcoal

Are there likely to be any resistance , harmful norms, taboos or beliefs against this move or initiative? 57 out of 270 respondents answered this question
No44.81%
I don’t know25.56%
Yes24.81%

Who do you think are the implementers in the biogas energy sector in your district/community? 264 out of 270 respondents answered this question.
40%
38.52%
15.19%
13.33%
4.44%
27.04%
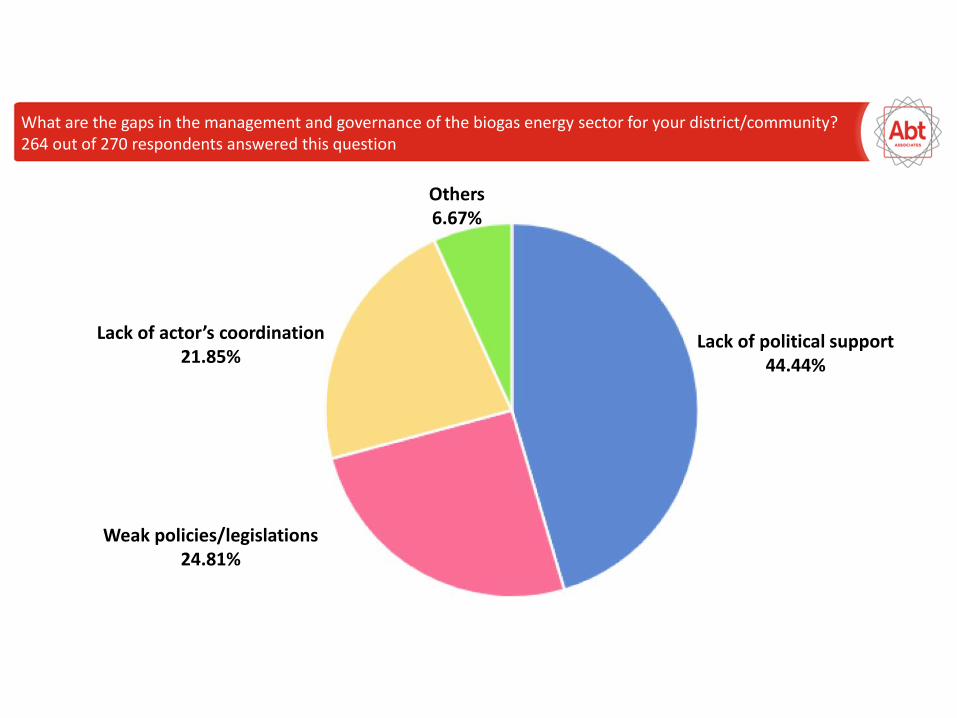
What are the gaps in the management and governance of the biogas energy sector for your district/community? 264 out of 270 respondents answered this question
Lack of political support44.44%
Weak policies/legislations24.81%
Lack of actor’s coordination21.85%
Others6.67%
Opportunities
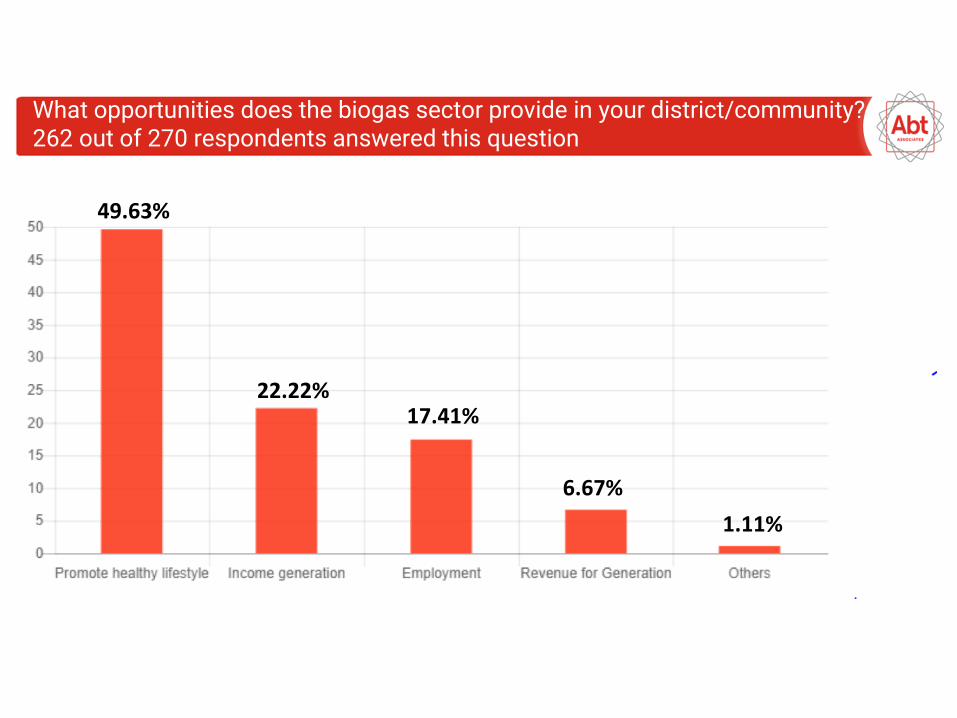
What opportunities does the biogas sector provide in your district/community? 262 out of 270 respondents answered this question
49.63%
22.22%17.41%
6.67%
1.11%

What is your opinion on the demand of the biogas energy for your district /community? 265 out of 270 respondents answered this question
60%
28.15%
6.3%
2.22%
1.48%

Thank You