lecture 01: introduction to machine learningjcrouser/sds293/lectures/01... · ·...
TRANSCRIPT
LECTURE 01:
INTRODUCTION TO MACHINE LEARNINGSDS 293: Machine LearningSeptember 11, 2017

Introductions & background
• 2017 on: Asst. Prof. in CS (Smith)
• 2015 to 2017: Visiting Asst. Prof. in SDS (Smith)
• 2013 – 2015: Research Scientist (MITLL)
• 2010 – 2013: PhD in Visual Analytics (Tufts)
• 2008 – 2010: MSc in Educational Tech. (Tufts)
• 2004 – 2008: BA in CS and Math (Smith)
Jordan( he / him,
computer scientist)
Office hours: Mondays 10:30 to noon and by appointment
Ford 355 (office) or Ford 343 (Lab)

People
3 Minute Biographies:-Your name and pronouns-Your year, school, and major / area of focus-Technical background
- Programming language(s) you know/like- Stats courses you’ve taken
3 Questions:-What brought you to this course?-What’s one big thing you hope to get out of it?-What’s one problem / idea / curiosity that sometimes
keeps you up at night?

Outline
• About this course
• What is Machine (a.k.a. Statistical) Learning?
• Example problems
• Data science refresher
• Structure of this course

Resources: course website
cs.smith.edu/~jcrouser/SDS293
Resources: slack channel
sds293.slack.com

Resources: tutorials, mini-courses, etc.
datacamp.com/groups/sds293-machine-learningFree access to ALL content until March 2018

Some context: my research
ComputationalModeling
CognitiveScience
InteractionDesign
Visualization

About this course
ComputationalModelingMachine
Learning

What is machine learning?
Image credit: Coursera

What is machine learning?
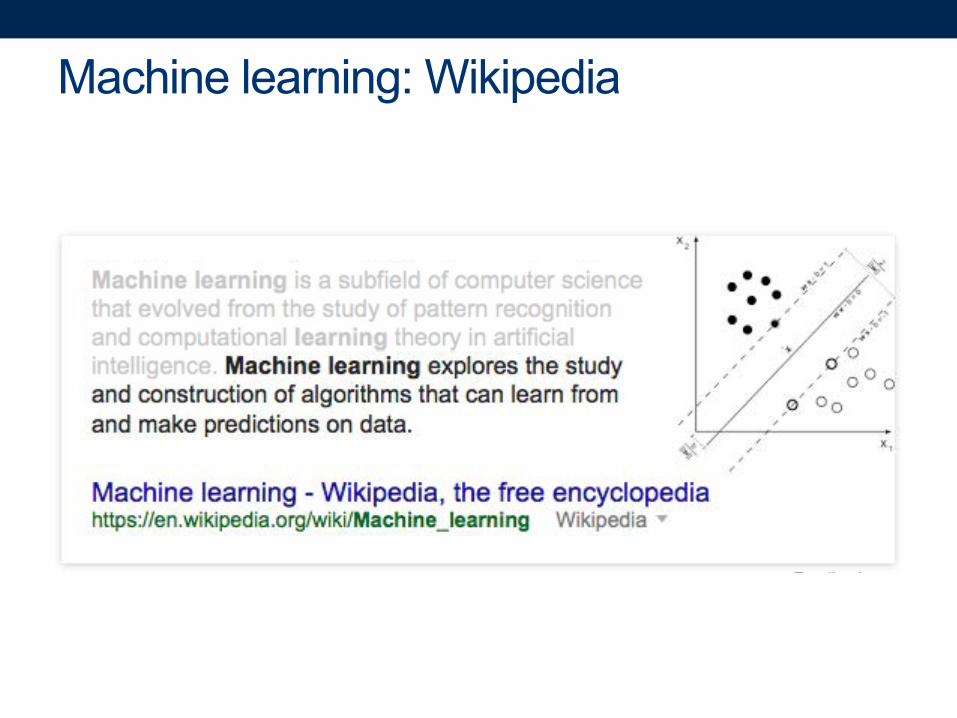
Machine learning: Wikipedia
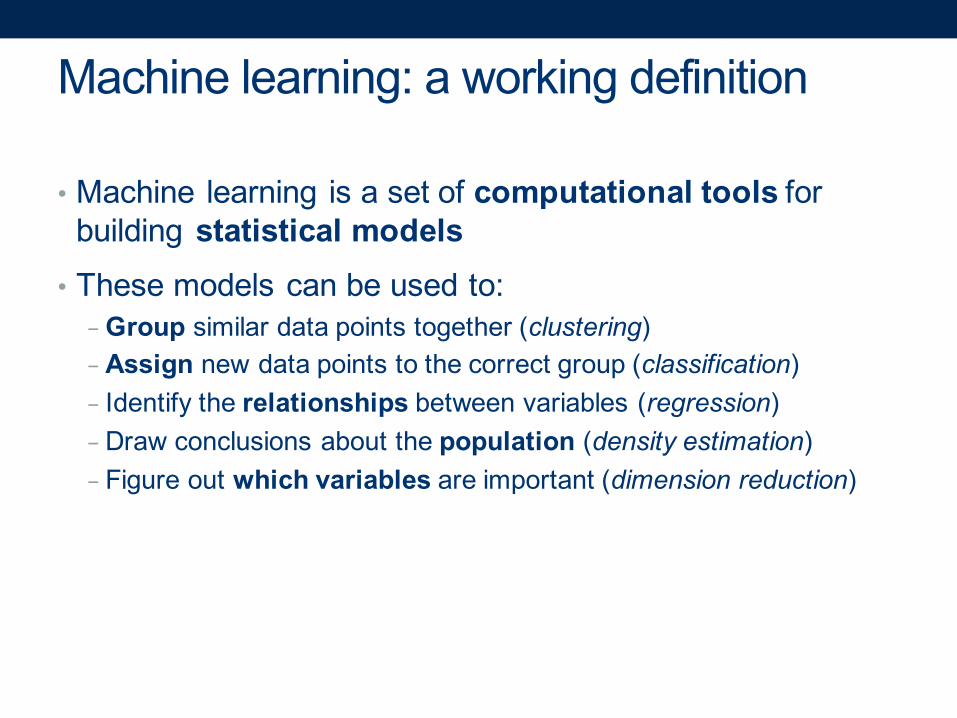
Machine learning: a working definition
• Machine learning is a set of computational tools for building statistical models
• These models can be used to:-Group similar data points together (clustering)-Assign new data points to the correct group (classification)- Identify the relationships between variables (regression)-Draw conclusions about the population (density estimation)- Figure out which variables are important (dimension reduction)

Example: men & money in the mid-Atlantic

Example: men & money in the mid-Atlantic
• Wage dataset available in the ISLR package
• Sample: 3000 male earners from the mid-Atlantic, surveyed between 2003 and 2009
• Dimensions:- Year each datapoint was collected - Age of respondent - Martial status - Race- Educational attainment- Job class- Health- Whether or not they have health insurance- Wage

Example: men & money in the mid-Atlantic
• Question: what is the effect of an earner’s age, education, and the year on his wage?
• Find some friends, then go explore the data at:
cs.smith.edu/~jcrouser/SDS293/examples/wage.html
#protipin classes with Jordan,
This icon means“your turn to talk”

Example: men & money in the mid-Atlantic
cs.smith.edu/~jcrouser/SDS293/examples/wage.html

wage vs. age

wage vs. year
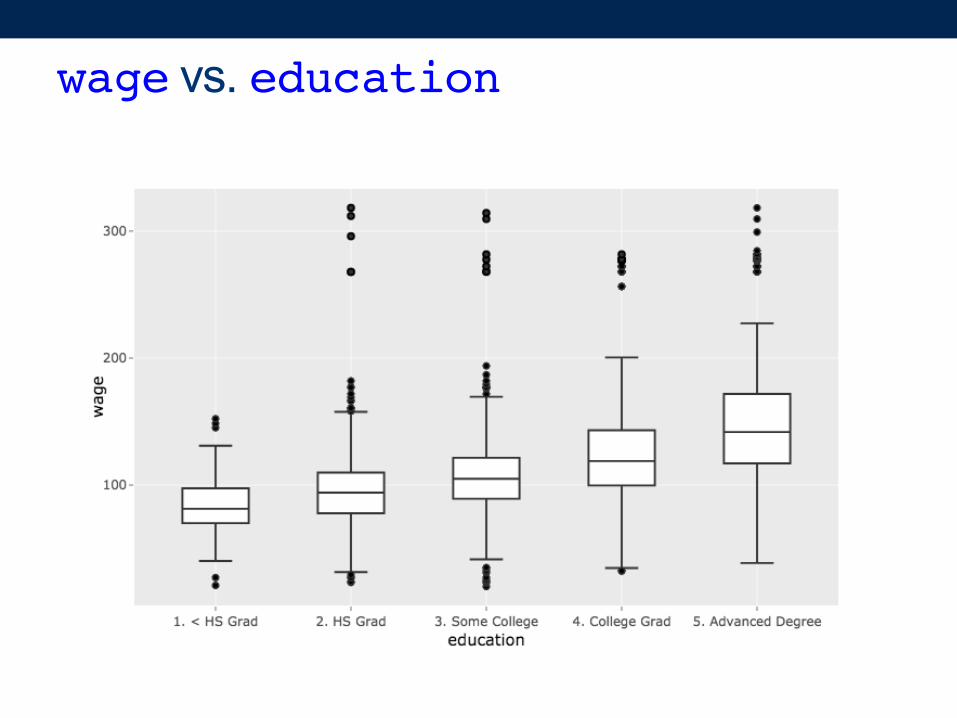
wage vs. education

Example: men & money in the mid-Atlantic
• If we had to pick just one, we should probably use education
• In reality, the best predictor is probably a combination of all three
Supervised machine learning
• In this example, we used the value of input variables to predict the value of output variables
• Another way to think about this:
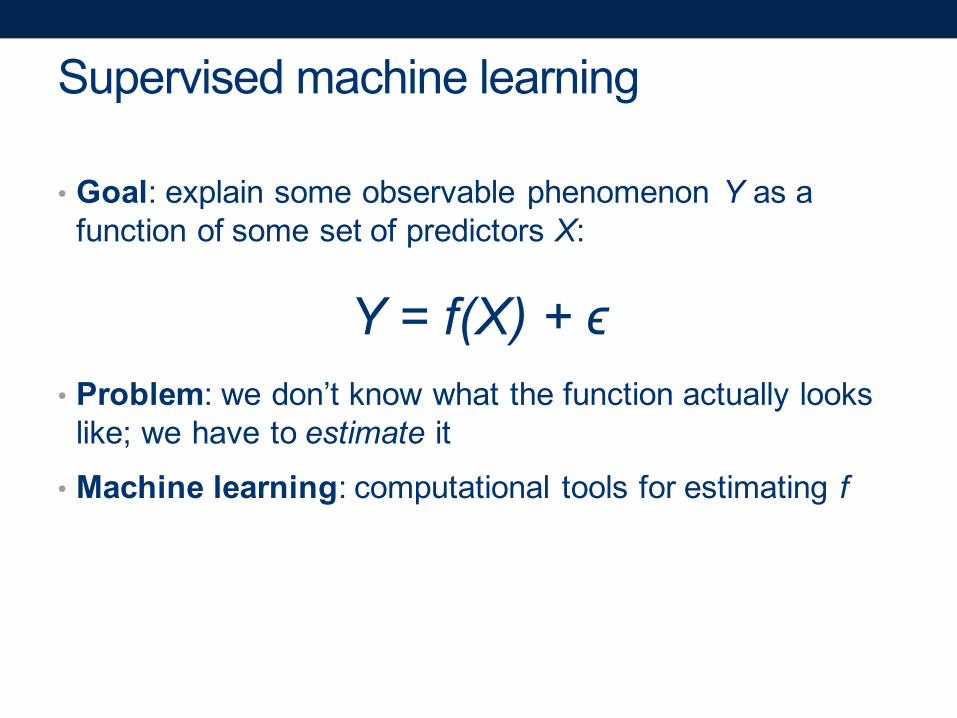
Supervised machine learning
• Goal: explain some observable phenomenon Y as a function of some set of predictors X:
Y = f(X) + ϵ• Problem: we don’t know what the function actually looks
like; we have to estimate it
• Machine learning: computational tools for estimating f
Unsupervised machine learning
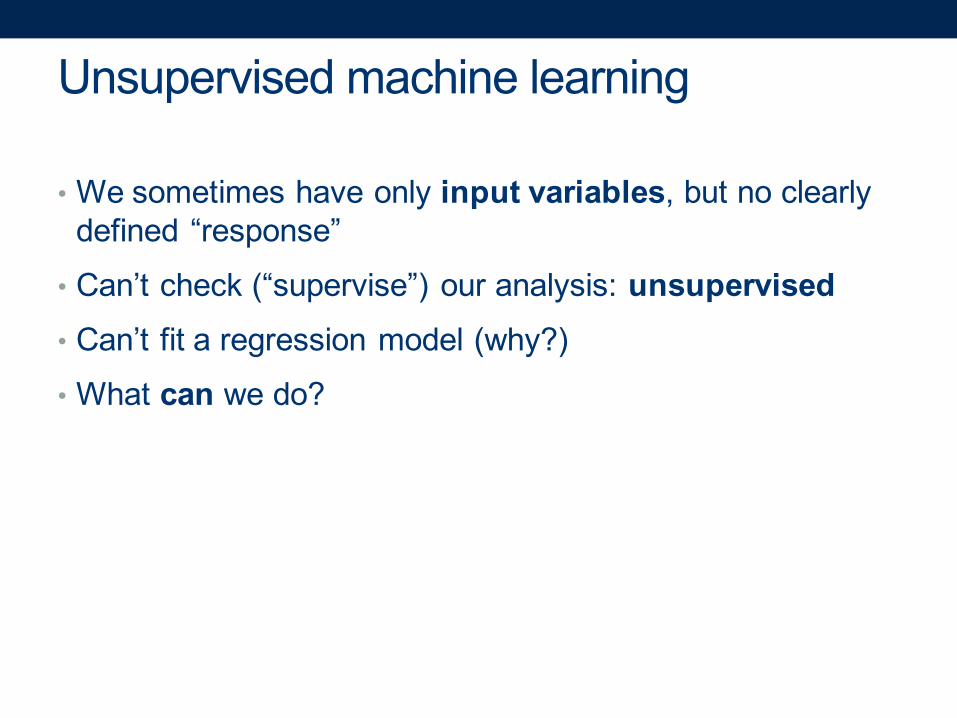
• We sometimes have only input variables, but no clearly defined “response”
• Can’t check (“supervise”) our analysis: unsupervised• Can’t fit a regression model (why?)
• What can we do?
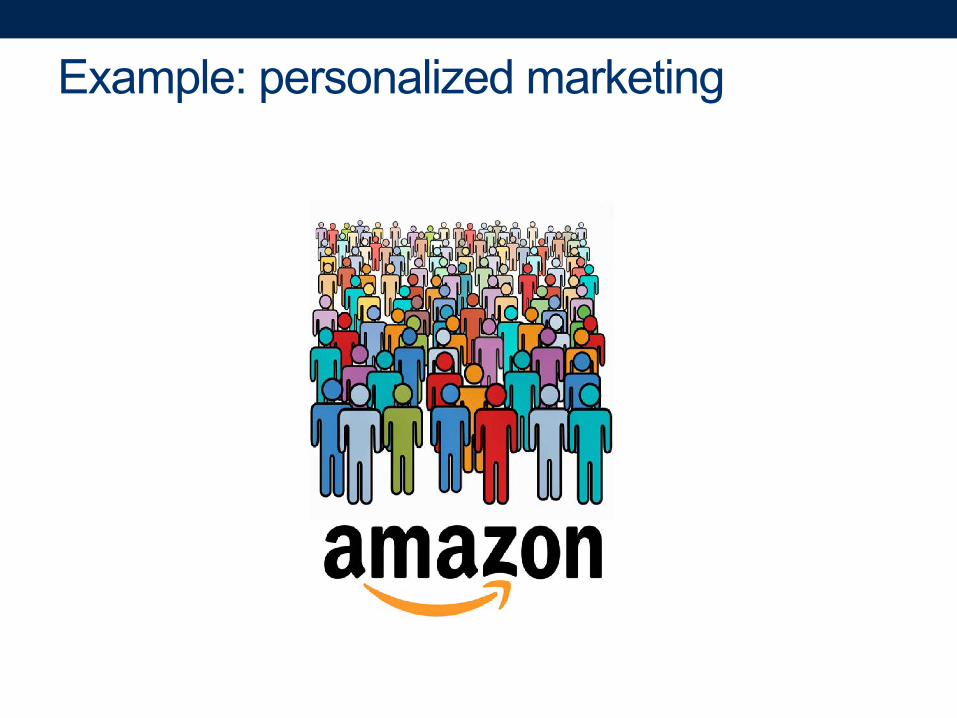
Example: personalized marketing

Example: personalized marketing

Example: personalized marketing
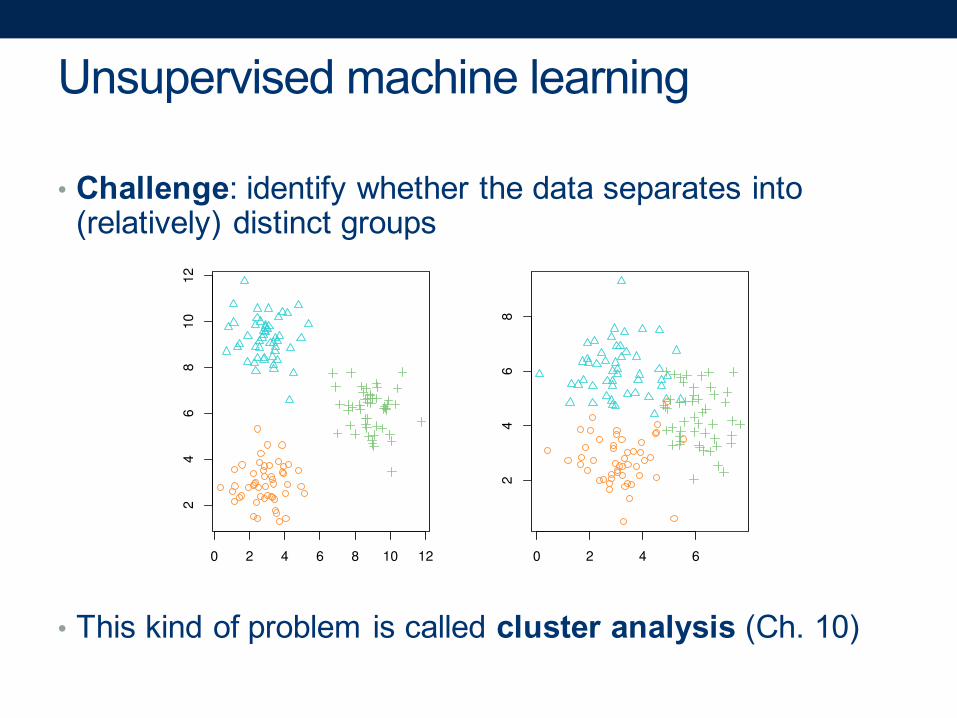
Unsupervised machine learning
• Challenge: identify whether the data separates into (relatively) distinct groups
• This kind of problem is called cluster analysis (Ch. 10)
0 2 4 6 8 10 12
24
68
10
12
0 2 4 6
24
68
X1X1
X2
X2
Data science refresher: what is “data”?
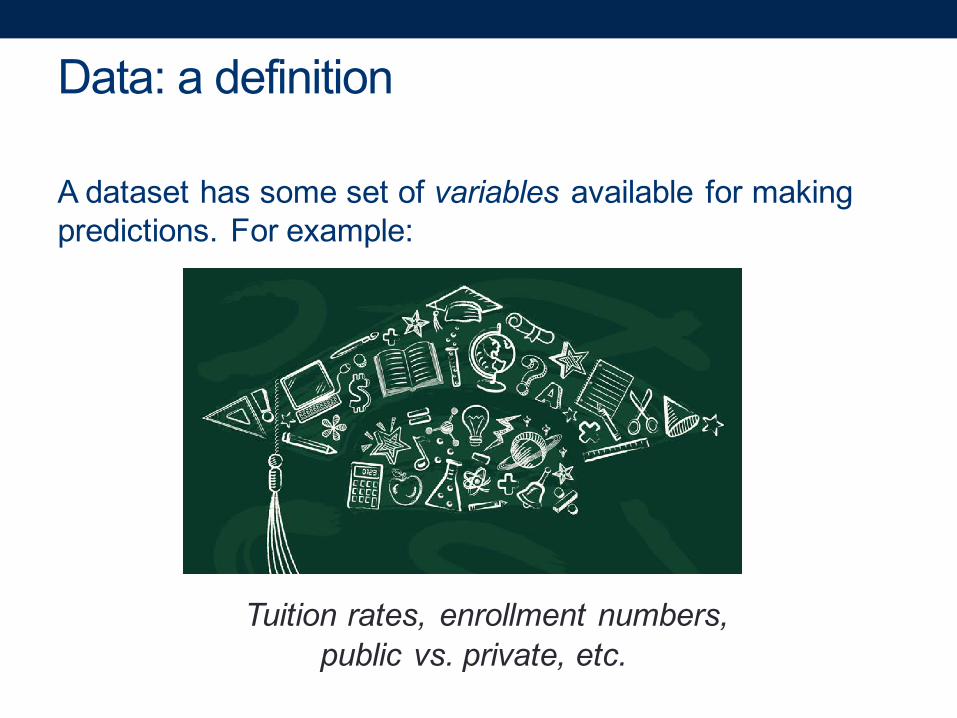
Data: a definition
A dataset has some set of variables available for making predictions. For example:
Tuition rates, enrollment numbers,public vs. private, etc.

Data: a definition
Each variable may be either independent or dependent:
- An independent variable (iv) is not controlled or affected by another variable (e.g., time in a time-series dataset)
- A dependent variable (dv) is affected by a variation in one or more associated independent variables (e.g., temperature in a region)

Data: a definition
A dataset also contains a set of observations (also called records) over these variables. For example:
tuition = $46,288, enrollment = 2,563,private, etc.

A dataset also contains a set of observations (also called records) over these variables. For example:
Data: a definition
tuition = $16,115, enrollment = 28,635,public, etc.

One way to think about this:
Tuition Enrollment Public vs. Private …
Smith College $46,288 2,563 private
UMass Amherst $16,115 28,635 public
Hampshire College $48,065 1,400 private
Mount HolyokeCollege $43,886 2,189 private
Amherst College $50,562 1,792 private
⋮
VARIABLES
OB
SER
VATI
ON
S

Another way to think about this
class school_obs:
def __init__(tuition, enrollment,
pub_or_priv):
self.tuition = tuition
self.enrollment = enrollment
self.pub_or_priv = pub_or_priv
smith = school_obs(46288, 2563, “private”)
umass = school_obs(16115, 28635, “public”)
VAR
IAB
LES
OBSERVATIONS
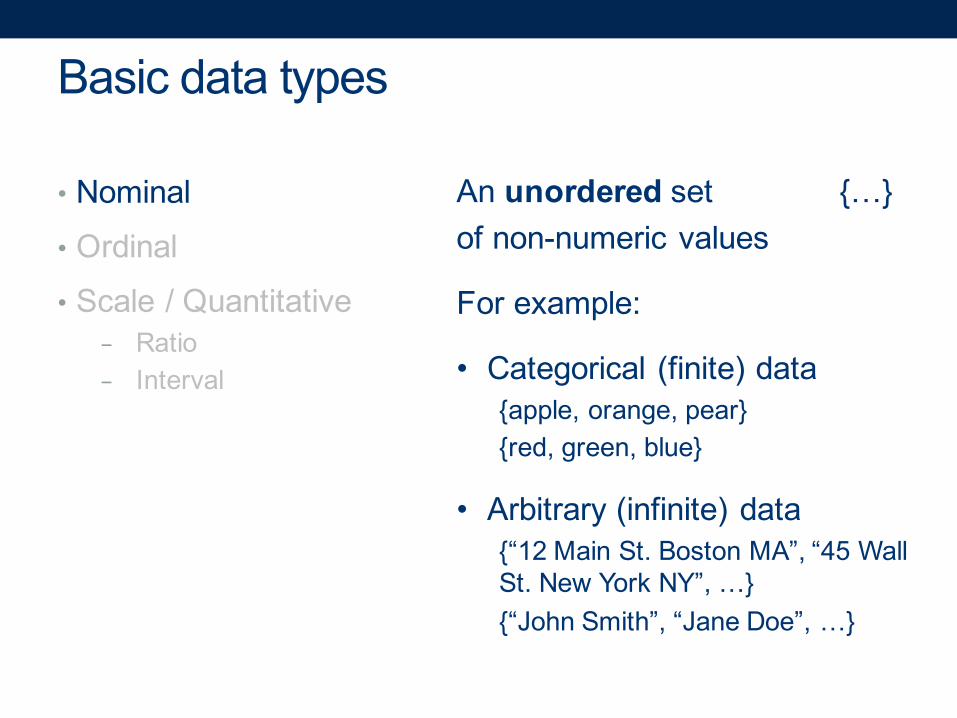
Basic data types
• Nominal
• Ordinal
• Scale / Quantitative- Ratio- Interval
An unordered set {…}of non-numeric values
For example:
• Categorical (finite) data{apple, orange, pear}{red, green, blue}
• Arbitrary (infinite) data{“12 Main St. Boston MA”, “45 Wall St. New York NY”, …}{“John Smith”, “Jane Doe”, …}

An ordered set <…>(also known as a tuple)
For example:
• Numeric: <2, 4, 6, 8>• Binary: <0, 1>• Non-numeric:
<G, PG, PG-13, R>
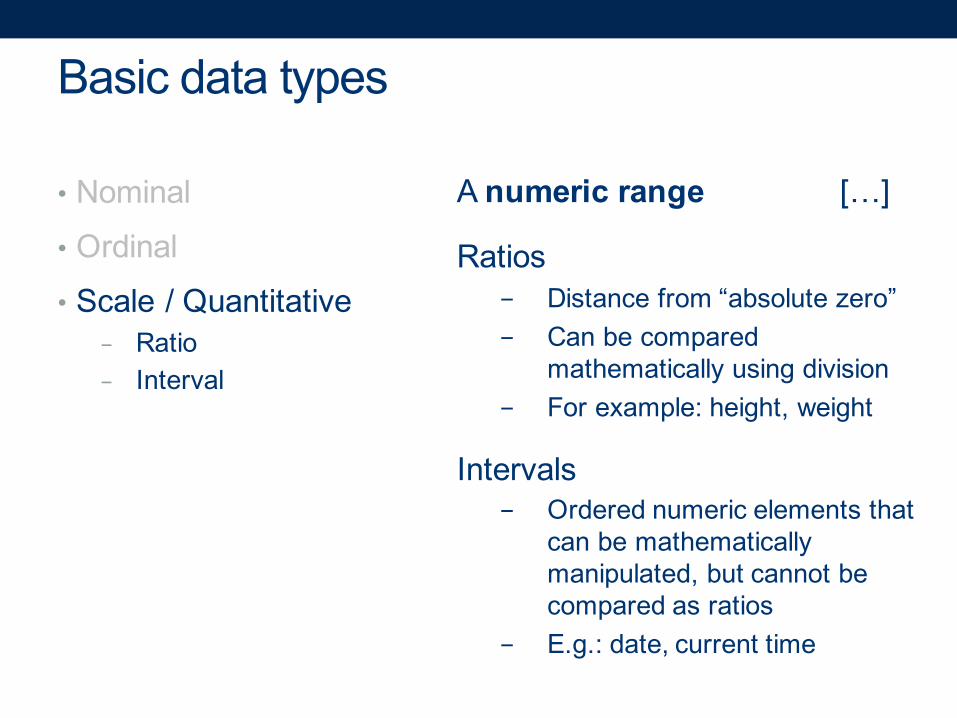
Basic data types
• Nominal
• Ordinal
• Scale / Quantitative- Ratio- Interval
Basic data types
• Nominal
• Ordinal
• Scale / Quantitative- Ratio- Interval
A numeric range […]
Ratios- Distance from “absolute zero”- Can be compared
mathematically using division- For example: height, weight
Intervals- Ordered numeric elements that
can be mathematically manipulated, but cannot be compared as ratios
- E.g.: date, current time

Converting between basic data types
• Q → O [0, 100] → <F, D, C, B, A>
• O → N <F, D, C, B, A> → {C, B, F, D, A}
• N → O (??)- {John, Mike, Bob} → <Bob, John, Mike>- {red, green, blue} → <blue, green, red>
• O → Q (??)- Hashing?- Bob + John = ??
Discussion: what do you notice?Readings in Information Visualization: Using Vision To Think. Card, Mackinglay, Schneiderman, 1999
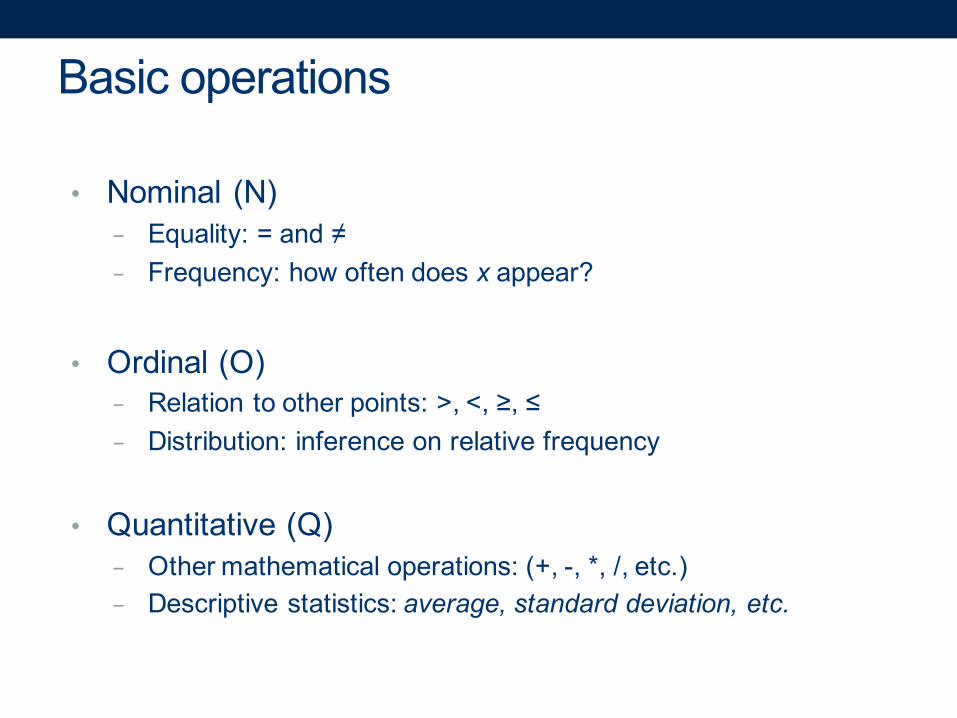
Basic operations
• Nominal (N)- Equality: = and ≠- Frequency: how often does x appear?
• Ordinal (O)- Relation to other points: >, <, ≥, ≤- Distribution: inference on relative frequency
• Quantitative (Q)- Other mathematical operations: (+, -, *, /, etc.)- Descriptive statistics: average, standard deviation, etc.
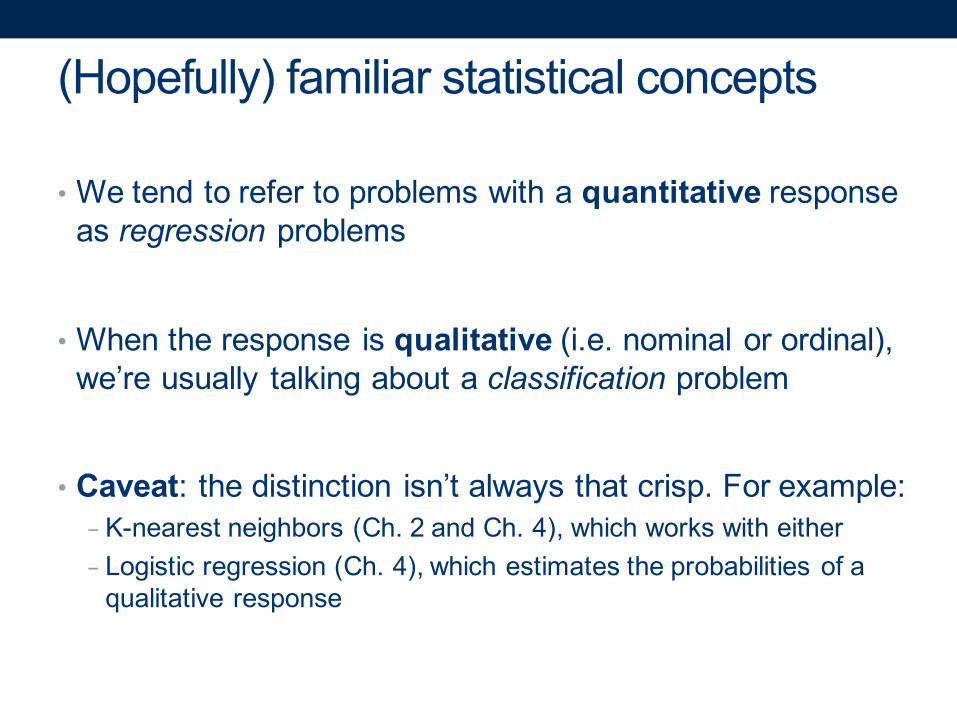
(Hopefully) familiar statistical concepts
• We tend to refer to problems with a quantitative response as regression problems
• When the response is qualitative (i.e. nominal or ordinal), we’re usually talking about a classification problem
• Caveat: the distinction isn’t always that crisp. For example:- K-nearest neighbors (Ch. 2 and Ch. 4), which works with either- Logistic regression (Ch. 4), which estimates the probabilities of a
qualitative response
What we’ll cover in this class
• Ch. 2: Statistical Learning Overview (next class)
• Ch. 3: Linear Regression
• Ch. 4: Classification
• Ch. 5: Resampling Methods
• Ch. 6: Linear Model Selection• Ch. 7: Beyond Linearity
• Ch. 8: Tree-Based Methods
• Ch. 9: Support Vector Machines
• Ch. 10: Unsupervised Learning
General information
• Course website:cs.smith.edu/~jcrouser/SDS293
•Slack Channel is live:sds293.slack.com
• Syllabus (with slides before each lecture)• Textbook• Assignments• Grading• Accommodations
About the textbook
• Digital edition available for free at: www.statlearning.com
• Lots of useful R source code (including labs)
• The ISLR package includes all the datasets referenced in the book: > install.packages(‘ISLR’)
• Many excellent GitHub repositories of solution sets available
...wait, what?
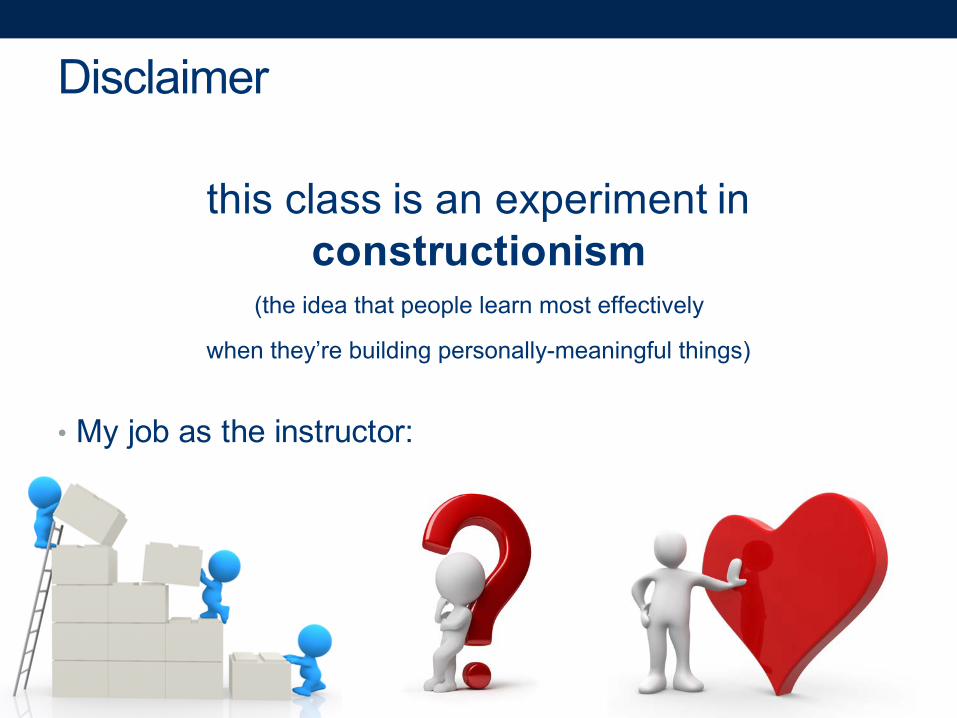
Disclaimer
this class is an experiment in constructionism
(the idea that people learn most effectively
when they’re building personally-meaningful things)
• My job as the instructor:
Assignments and grading
• Participation (10%): show up, engage, and you’ll be fine
• Labs (30%): run during regular class time, help you get a hands-on look at how various ML techniques work
• 8 (short) assignments (40%): built to help you become comfortable with applying the techniques
• Course project (20%)
Preparing for labs in R
Two options available for using R:1. You can install R Studio on your own machine: rstudio.com2. You can use Smith’s RStudio Server: rstudio.smith.edu:8787
If you’re unfamiliar with R, you might want to take a look at Smith’s “Getting Started with R” tutorial:
www.math.smith.edu/tutorial/r.html
Preparing for labs in python
• I like the Anaconda distribution from continuum.io, but you’re welcome to use whatever you like
• You’ll need to know how to install packages• Either 2.7 or 3.6 is fine – we’ll run into bugs either way J

Course project (20%)• Topic: ANYTHING YOU WANT
• Goals:- Learn how to break big, unwieldy questions down into clear,
manageable problems- Figure out if/how the techniques we cover in class apply to your
specific problems- Use ML to address them
• Several (graded) milestones along the way
• Demos and discussion on the final day of class

Course learning objectives
1. Understandwhat ML is(and isn’t)
2. Learn somefoundational
methods / tools
3. Be able to choose methodsthat make sense

What I expect from you
• You like difficult problems and you’re excited about “figuring stuff out”
• You have a solid foundation in introductory statistics• You are proficient in coding and debugging (or are ready
to work to get there)• You’re comfortable asking questions

What you can expect from me
• Your learning experience and process is important to me
• I’m flexible w.r.t. the topics we cover
• I’m happy to share my professional connections• Somewhat limited in-person access
Reading• In today’s class, we covered ISLR: p. 15-28• Next class, we’ll be talking about how to compare
various kinds of models (ISLR: p. 29-37)

For Wednesday
Make sure youcan access theslack channel
Need a refresher on something?
Just ask!

#questions?