lecture 01: introduction - princeton universitymarkus/teaching/fin501/01xxxx.pdf22:31 lecture 01...
TRANSCRIPT

22:31 Lecture 0122:31 Lecture 01 IntroductionIntroduction
Fin 501: Asset PricingFin 501: Asset Pricing
Slide 1Slide 1--11
Lecture 01: IntroductionLecture 01: Introduction
• Prof. Markus K. Brunnermeier

STYLIZED FACTS ON SECURITY RETURNSadopted from Heinz Zimmermann, Elmar Mertens

2
AGENDA
We will look at how security returns behave . . .
. . . across asset classes
. . . compared with their "risk"
. . . once they are grouped into baskets
. . . in relation to the macroeconomy
. . . depending on firm characteristics
. . . with regard to prior performance
. . . when there is new information
. . . and what investment managers get out of them

3
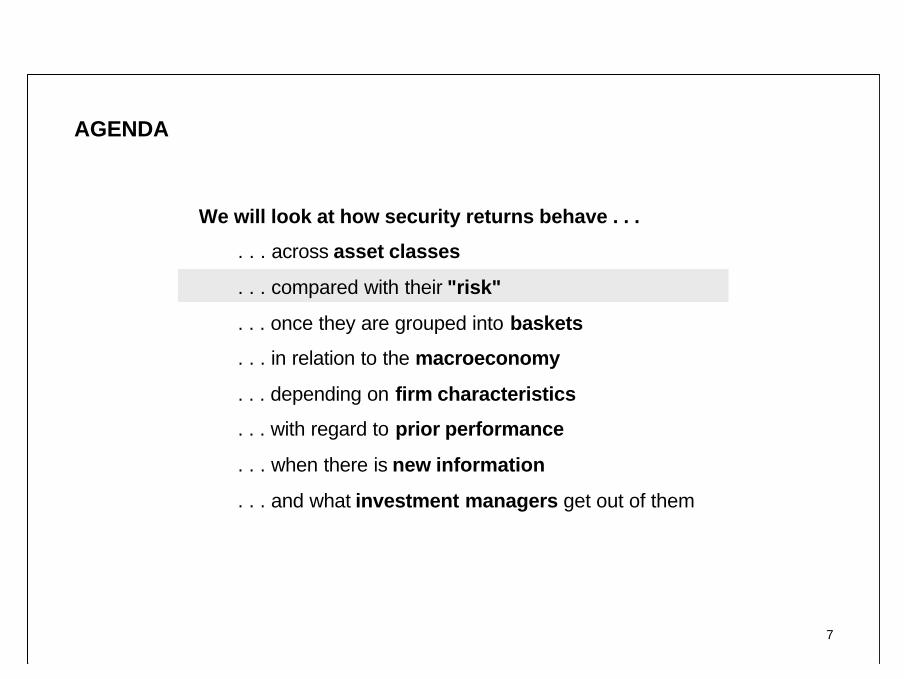
AGENDA
We will look at how security returns behave . . .
. . . across asset classes
. . . compared with their "risk"
. . . once they are grouped into baskets
. . . in relation to the macroeconomy
. . . depending on firm characteristics
. . . with regard to prior performance
. . . when there is new information
. . . and what investment managers get out of them

4
AVERAGE RETURNS ON FINANCIAL AND PHYSICAL ASSETSPercent p.a. in U$, average over the 1980s
Source: Malkiel (1996), p. 383
Zero returnin real terms
Historical returns on various asset classes differ considerably
5
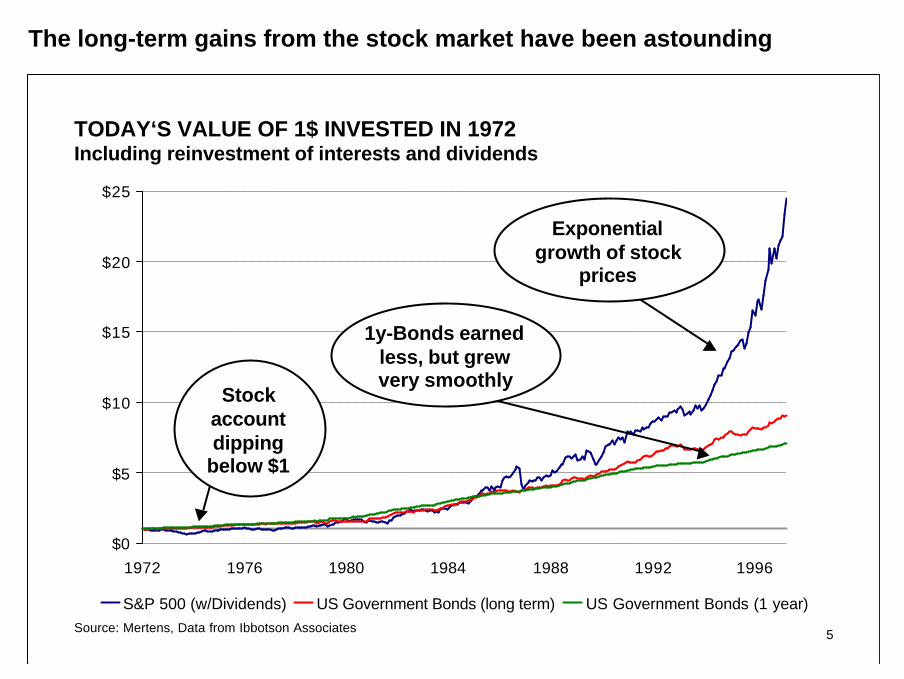
TODAY‘S VALUE OF 1$ INVESTED IN 1972Including reinvestment of interests and dividends
$0
$5
$10
$15
$20
$25
1972 1976 1980 1984 1988 1992 1996
S&P 500 (w/Dividends) US Government Bonds (long term) US Government Bonds (1 year)Source: Mertens, Data from Ibbotson Associates
Exponentialgrowth of stock
prices
1y-Bonds earnedless, but grewvery smoothly
Stockaccountdipping
below $1
The long-term gains from the stock market have been astounding
6
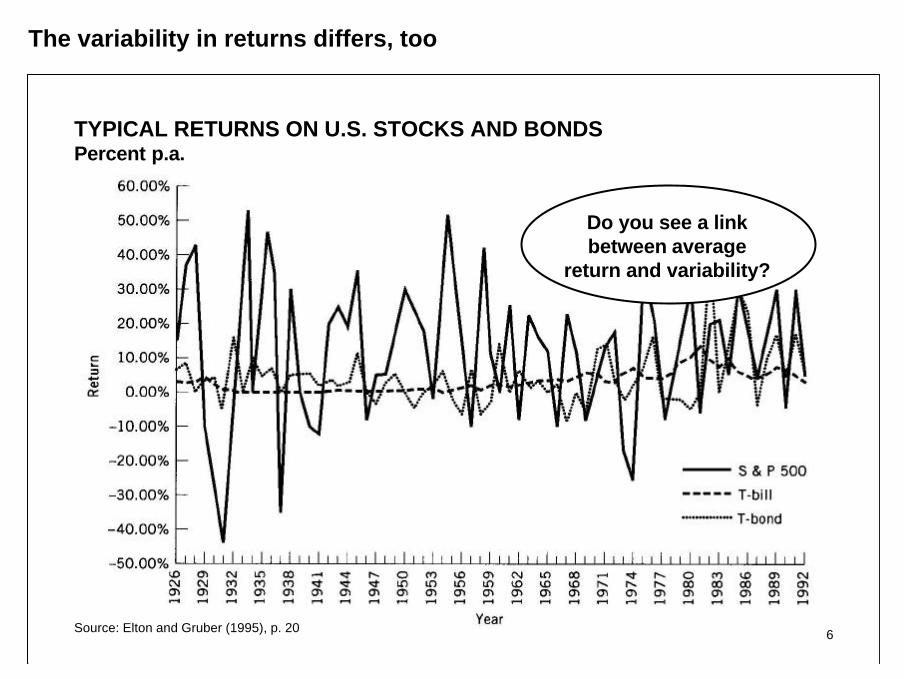
TYPICAL RETURNS ON U.S. STOCKS AND BONDSPercent p.a.
Source: Elton and Gruber (1995), p. 20
Do you see a linkbetween average
return and variability?
The variability in returns differs, too
7
AGENDA
We will look at how security returns behave . . .
. . . across asset classes
. . . compared with their "risk"
. . . once they are grouped into baskets
. . . in relation to the macroeconomy
. . . depending on firm characteristics
. . . with regard to prior performance
. . . when there is new information
. . . and what investment managers get out of them

8
RISK AND RETURN OF INTERNATIONAL ASSET CLASSESPercent per month
0.00%
0.20%
0.40%
0.60%
0.80%
1.00%
1.20%
1.40%
1.60%
0.00% 2.00% 4.00% 6.00% 8.00% 10.00% 12.00%
Stocks Bonds Money
Source: Mertens, Data from Investment Consulting Group
Average
Standard Deviation
The relation between average return and dispersion is not straightforward
9
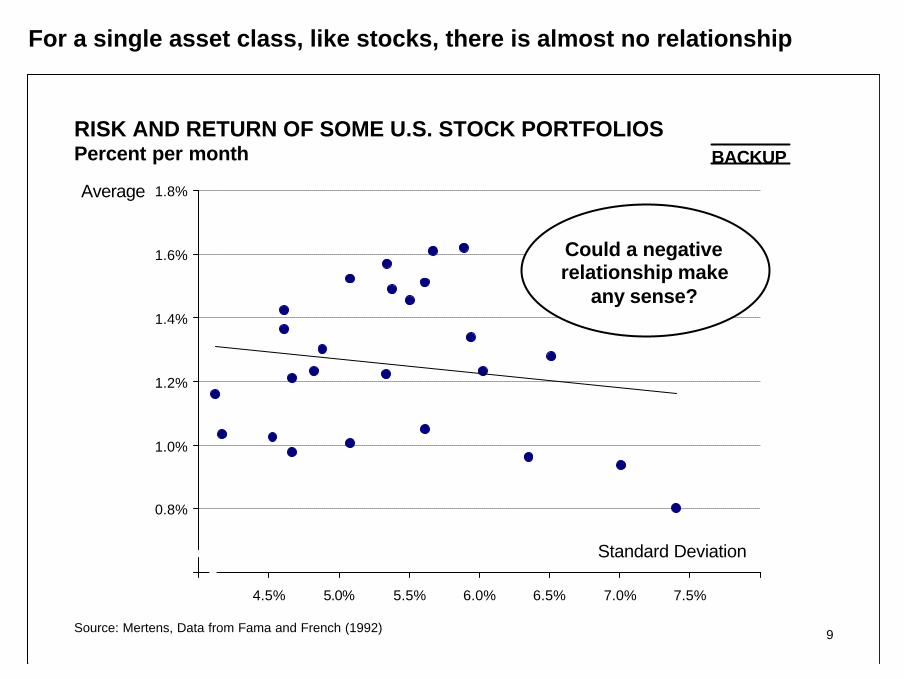
RISK AND RETURN OF SOME U.S. STOCK PORTFOLIOSPercent per month
Source: Mertens, Data from Fama and French (1992)
0.6%
0.8%
1.0%
1.2%
1.4%
1.6%
1.8%
4.0% 4.5% 5.0% 5.5% 6.0% 6.5% 7.0% 7.5% 8.0%
Average
Standard Deviation
BACKUP
Could a negativerelationship make
any sense?
For a single asset class, like stocks, there is almost no relationship

10
AGENDA
We will look at how security returns behave . . .
. . . across asset classes
. . . compared with their "risk"
. . . once they are grouped into baskets
. . . in relation to the macroeconomy
. . . depending on firm characteristics
. . . with regard to prior performance
. . . when there is new information
. . . and what investment managers get out of them

11
ADDING STOCKS IN ALPHABETIC ORDER TO A PORTFOLIOVolatility of portfolio returns (dispersion around mean) in percent p.a.
15%
17%
19%
21%
23%
25%
27%
ABB
+ Alus
uisse
+ Balo
ise+ C
iba
+ Clar
iant
CS Hold
ing+ E
ms
+ Hold
erban
k
+ Nes
tlé
+ Nov
artis I
+ Nov
artis N
+ Swiss
Life
+ Roc
he
+ SAir
Group
+ Swiss
Re+ S
GS
+ SMH N
+ SMH I
+ Sulz
er+ U
BS
+ Zuri
ch Al
lied
Relationshipnot monotone
Source: Zimmermann
Even a naïve mix of just a few stocks reduces risk considerably

12
COMOVEMENT OF STOCKS WITH MARKETReturns in percent per month
-40%
-30%
-20%
-10%
0%
10%
20%
30%
40%
-20% -10% 0% 10% 20%
SGS vs Market (x-axis)
-50%
-40%
-30%
-20%
-10%
0%
10%
20%
30%
40%
50%
-20% -10% 0% 10% 20%
Credit Suisse vs Market (x-axis)
Correlation:0.3
Correlation:0.8
Source: Mertens
Some stocks move more, other less closely with the market
13
AGENDA
We will look at how security returns behave . . .
. . . across asset classes
. . . compared with their "risk"
. . . once they are grouped into baskets
. . . in relation to the macroeconomy
. . . depending on firm characteristics
. . . with regard to prior performance
. . . when there is new information
. . . and what investment managers get out of them
14
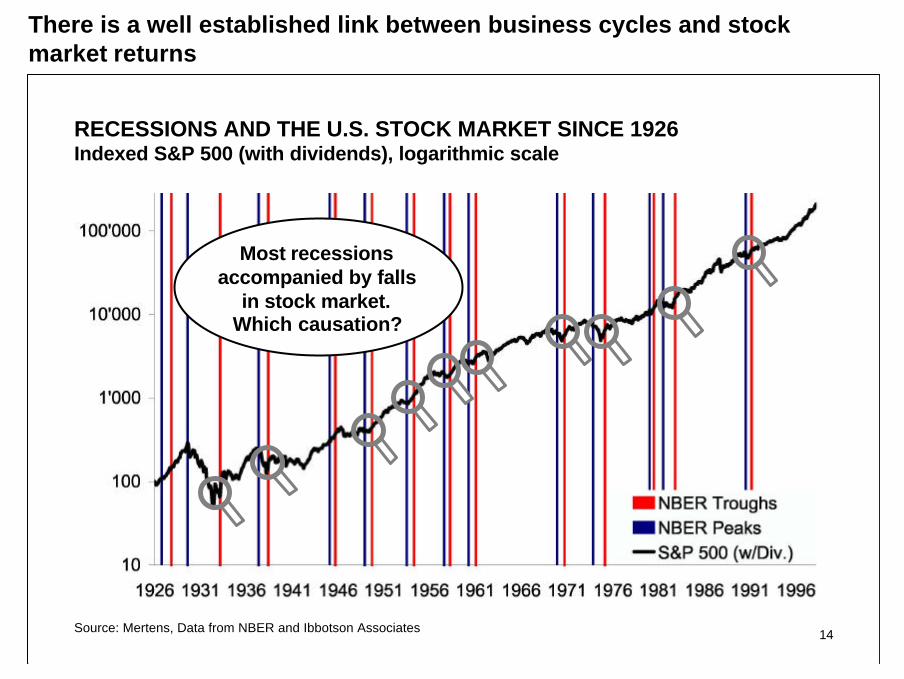
RECESSIONS AND THE U.S. STOCK MARKET SINCE 1926Indexed S&P 500 (with dividends), logarithmic scale
Most recessionsaccompanied by falls
in stock market.Which causation?
Source: Mertens, Data from NBER and Ibbotson Associates
There is a well established link between business cycles and stockmarket returns

15
U.S. STOCK MARKET AND THE MACROECONOMYPatterns of yearly returns / changes (different scales)
Annual returnon S&P 500
Yearly averageof 1-monthT-Bill rates
BACKUP
Change inannual GDP
Source: Mertens, Data from Investment Consulting Group
The relation between stock market, GDP and short rates is notstraightforward

16
AGENDA
We will look at how security returns behave . . .
. . . across asset classes
. . . compared with their "risk"
. . . once they are grouped into baskets
. . . in relation to the macroeconomy
. . . depending on firm characteristics
. . . with regard to prior performance
. . . when there is new information
. . . and what investment managers get out of them

17
TYPICAL FIRM CHARACTERISTICS
• Size
• Industry affiliation
• Accounting Ratios:
– Price-Earnings
– Book-to-Market
– Price-to-Cash-Flow
– Leverage ratio
– . . .
• Location of Headquarters and the place of major share listing
• Type of securities issued (stock, preferred, bonds, derivatives)
• Type of activities: conglomerate, start-up etc.
• . . .
Accounting Ratios aresupposed to conveygrowth expectations.Note: Most ratios are
scaled prices
Source: Mertens
18
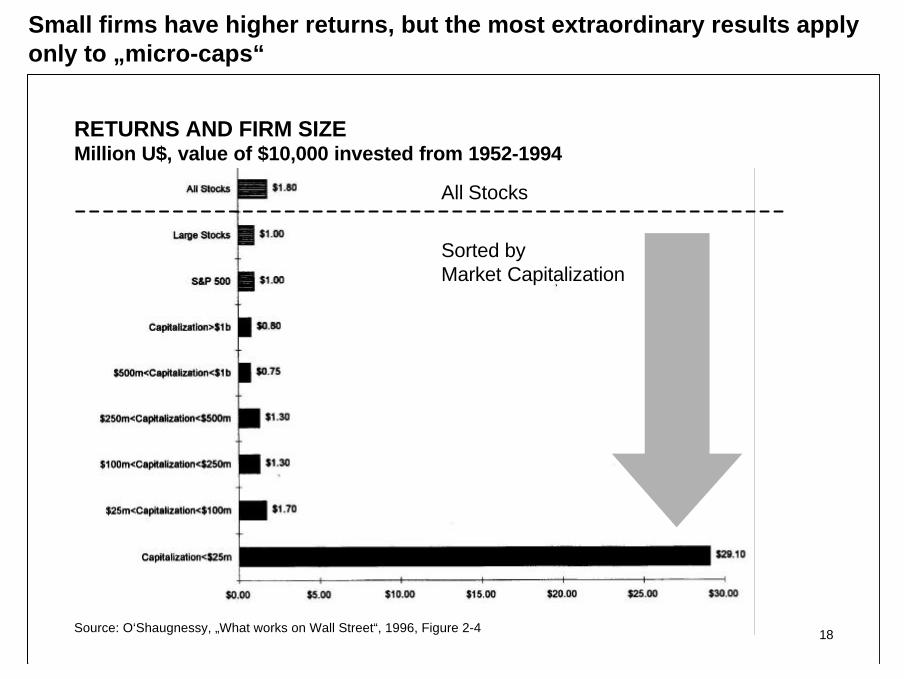
RETURNS AND FIRM SIZEMillion U$, value of $10,000 invested from 1952-1994
Source: O‘Shaugnessy, „What works on Wall Street“, 1996, Figure 2-4
All Stocks
Sorted by Market Capitalization
Small firms have higher returns, but the most extraordinary results applyonly to „micro-caps“
20
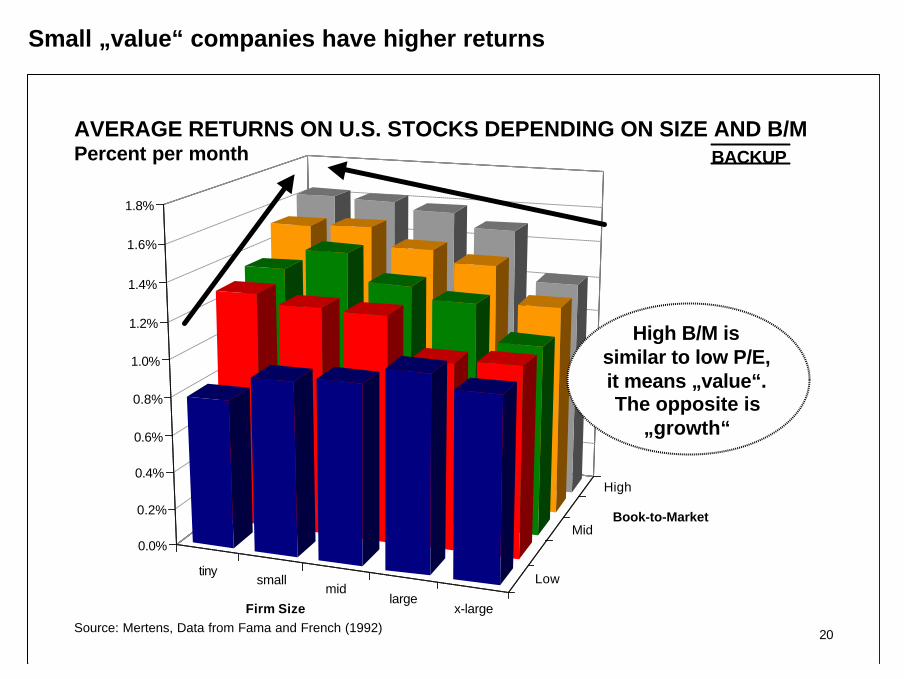
AVERAGE RETURNS ON U.S. STOCKS DEPENDING ON SIZE AND B/MPercent per month
Source: Mertens, Data from Fama and French (1992)
tinysmall
midlarge
x-large
Low
Mid
High
0.0%
0.2%
0.4%
0.6%
0.8%
1.0%
1.2%
1.4%
1.6%
1.8%
Firm Size
Book-to-Market
High B/M issimilar to low P/E,it means „value“.The opposite is
„growth“
BACKUP
Small „value“ companies have higher returns

21
PORTFOLIO OF BUYING „VALUE“ AND SELLING „GROWTH“ ´68-´90Percent p.a., U.S. Stocks BACKUP
Source: Lakonishok, Shleifer and Vishny (1994)
R: RecessionD: Down Market
A crash- andrecession-proof
strategy?
For a long time, the performance of buying „value“ companies seemedvery persistent

22
PORTFOLIO OF BUYING „VALUE“ AND SELLING „GROWTH“ ´90sPercent p.a., STOXX Euro Style Indices BACKUP
Source: Mertens, Data from STOXX
-50%
-40%
-30%
-20%
-10%
0%
10%
20%
30%
40%
1998 1999 2000 2001
Many „value“investors got
burned. Do youknow some oftheir names?
Recently, the tide has turned against „value“ investors

23
AGENDA
We will look at how security returns behave . . .
. . . across asset classes
. . . compared with their "risk"
. . . once they are grouped into baskets
. . . in relation to the macroeconomy
. . . depending on firm characteristics
. . . with regard to prior performance
. . . when there is new information
. . . and what investment managers get out of them

24
RETURNS TO PREVIOUS 5-YEAR‘S WINNER/LOSER STOCKS (U.S.)Market adjusted returns
Source: DeBondt and Thaler (1985) reproduced in Thaler (1993)
In the long-term, returns of extreme winner/loser tend to reverse

25
RETURN TO BUYING SHORT-RUN WINNER AND SELLING LOSERMarket adjusted return, international sample of stocks
Confidenceinterval (95%)
Source: Rouwenhorst (1998)
Short-run continuations seem to be persistent, too

37
LIST OF REFERENCES 1/2
Ball/ Brown (1968). „An Empirical Evaluation of Accounting Income Numbers“, Journal ofAccounting Research, pp. 159 - 178Bernard (1993). „Stock Price Reaction to Earnings Announcements“ in Thaler (1985),Advances in Behavioral Finance, Russel Sage Foundation, New York, chapter 11Carhart (1997). „On Persistence in Mutual Fund Performance“, Journal of Finance 52,pp. 57-82DeBondt/ Thaler (1985). „Does the Stock Market Overreact?“, Journal of Finance 40:3,pp. 793-807Elton/ Gruber (1995). Modern portfolio theory and investment analysis, Wiley, New YorkFama/ Fischer/ Jensen/ Roll (1969). „The Adjustment of Stock Prices to New Information“,International Economic Review 10, pp. 1-21Fama/ French (1992). "The cross-section of expected stock returns", Journal of Finance 47,pp. 427-465Jensen (1968). „The Performanceof Mutual Funds in the Period 1945-1964“, Journal ofFinance 23, pp. 389-416Lakonishok/ Shleifer/ Vishny (1994). "Contrarian Investment, Extrapolation, and Risk,"Journal of Finance 49:5, pp. 1541-1578

38
LIST OF REFERENCES 2/2
bLowenstein (1995). Buffet - The Making of an American Capitalist, Random HouseMacKinlay (1997). „Event Studies in Economics and Finance“, Journal of Economic Literature35, pp. 13-39bMalkiel (1996). A Random Walk Down Wall Street, Norton, New YorkbO‘Shaugnessy (1996). What works on Wall Street, McGraw-Hill, New YorkRouwenhorst (1998). „International Momentum Strategies“, Journal of Finance 53:1,pp. 267-284Thaler (1993). Advances in Behavioral Finance, Russel Sage Foundation, New YorkWomack (1996). „Do Brokerage Analyst Recommendations Have Investment Value?“,Journal of Finance 51, pp. 137-167
b : „bed-time“ reading (and still useful in daylight)

22:31 Lecture 0122:31 Lecture 01 IntroductionIntroduction
Fin 501: Asset PricingFin 501: Asset Pricing
Slide 1Slide 1--22
Economic Role of Financial MarketsEconomic Role of Financial Markets
• Assets allow transfer of cash flow streams– over time
(saving/lending, borrowing)– over states of the world
(insuring, hedging, …)• Value/price cash flow streams/assets

22:31 Lecture 0122:31 Lecture 01 IntroductionIntroduction
Fin 501: Asset PricingFin 501: Asset Pricing
Slide 1Slide 1--33
Transfer over timeTransfer over time• Borrow and save
to achieve smooth consumption stream over time
• personal loans, bank loans money market bonds, pensions (non-contingent instruments)
c
y
t

22:31 Lecture 0122:31 Lecture 01 IntroductionIntroduction
Fin 501: Asset PricingFin 501: Asset Pricing
Slide 1Slide 1--44
Transfer over statesTransfer over states
• Insure or hedge to reduce riskto achieve smooth consumption across states
s1
s2
0…
sS

22:31 Lecture 0122:31 Lecture 01 IntroductionIntroduction
Fin 501: Asset PricingFin 501: Asset Pricing
Slide 1Slide 1--55
Desynchronize over states (Desynchronize over states (ctdctd.).)
• Contingent commodities– Umbrella if it rains at 3:00 p.m. – Umbrella if sun shines at 3:00 p.m. Goods are defined by date and state
• Contingent securities– Dollar payoff if it rains at 3:00 p.m. – Dollar payoff if sun shines at 3:00 p.m.
e.g. stocks, derivatives

22:31 Lecture 0122:31 Lecture 01 IntroductionIntroduction
Fin 501: Asset PricingFin 501: Asset Pricing
Slide 1Slide 1--66
Pricing: Two Fundamental Approaches
• Equilibrium approach:« Absolute Asset Pricing »from first principles starting with hypotheses on the structure of the economy and the behavior of economic agents.
• Arbitrage approach:« Relative Asset Pricing »« piggybacking » on existing price observations

22:31 Lecture 0122:31 Lecture 01 IntroductionIntroduction
Fin 501: Asset PricingFin 501: Asset Pricing
Slide 1Slide 1--77
specifyPreferences &Technology
observe/specifyexisting
Asset Prices
NAC/LOOP•evolution of states•risk preferences•aggregation
relativeasset pricing
NAC/LOOP
State Prices q(or stochastic discount
factor/Martingale measure)absolute asset pricing
LOOP
derivePrice for (new) asset
deriveAsset Prices
Only works as long as market completeness doesn’t change

22:31 Lecture 0122:31 Lecture 01 IntroductionIntroduction
Fin 501: Asset PricingFin 501: Asset Pricing
Slide 1Slide 1--88
Equilibrium price of a bicycle
• Analysis of supply and demand for bicycles and substitute products
Demand
Supplyp
x

22:31 Lecture 0122:31 Lecture 01 IntroductionIntroduction
Fin 501: Asset PricingFin 501: Asset Pricing
Slide 1Slide 1--99
Arbitrage pricing of bike
Bicycle = 2 wheels: pw x 21 saddle: ps x 11 frame: pf x 11 gearshift: pg x 12 brakes: pb x 2
_______pbike (free labor)