lebanese banks - ffa private bank private bank - equity... · improved asset quality with the gross...
TRANSCRIPT

Bank Audi (AUDI LB) MARKETWEIGHT USD 7.00
Blom Bank (BLOM LB) OVERWEIGHT USD 10.00
Byblos Bank (BYB LB) MARKETWEIGHT USD 1.60
Resilient deposits should continue funding private sector and fiscal shortfalls: Banks have been navigating well through unfavorable conditions amidst a political standstill and a soft real GDP growth averaging 2% in the 2011-2014e period as per the IMF. Figures for 8M-14 pointed to moderate banking sector growth (in the 3%-5% range for assets, deposits and loans reaching USD 170.3 billion, USD 141.5 billion and USD 49.7 billion respectively). At this growth level, assets reached ~360% of 2014e GDP pointing to an oversized banking sector with excess liquidity being deployed towards the public rather than private sector. Non-resident deposits grabbed a 21% share in deposits at the end of Aug-14, along with resilient remittances (holding well above USD 7 billion as per the World Bank) which continue to fuel banks’ already high liquidity which in turn finance public debt (~60% held by commercial banks) and provide support to the CB fx reserves while also financing the private sector to a lesser extent (helped by CB initiatives). Should fiscal shortfalls exceed materially or deposits slow considerably, this could put the arrangement at risk.
Balance sheet growth of banks under coverage should sustain same pace as in Q2/14: In Q2/14, Blom Bank and Byblos Bank saw their deposits and loans QoQ growth at a respective 2% and 4% for Blom Bank, and at a respective 2% and 1% for Byblos Bank (with LDRs in the 29%-30% range), while Bank Audi saw more vigorous growth (+5% for both indicators) mainly driven by Turkish operations (reaching 24% of total assets at the end of Q2/14) with an LDR at 47% distancing itself away from the 35% sector’s average in Lebanon as the LDR of Odea Bank (~85%) moves gradually closer to sector’s average in Turkey (~115%). We expect soft growth in balance sheet in Q3/14e across our universe while Bank Audi should keep an edge driven by Turkey yet at a more gradual rate (3%-5% range respectively for Bank Audi, 1%-2% range for Blom Bank and Byblos Bank in deposits and loans).
Banks to continue dealing with profitability constraints, although BS growth and easing provisions could alleviate pressures: Lebanese banks are still dealing with narrowing asset yields from maturing higher coupon gov’t securities and low global benchmark policy rates, along with limited capacity to lower the cost of funds given market share concerns amidst slower deposit accumulation (interest spreads in USD and LBP down 14 bps and 43 bps respectively YoY in Aug-14 as per the ABL). On a positive note, we expect continued balance sheet growth and easing provisioning to help alleviate pressures. We note that Q2/14 held no major surprise for profits of banks under coverage at the exception of Bank Audi which saw notably higher profits from a stronger top line. Our estimates for YoY net profit growth in Q3/14e stands at +20%, +5% and +9% for Bank Audi, Blom Bank and Byblos Bank respectively. We continue to closely monitor Odea Bank’s results given first set of profits in Q2/14 and its aggressive growth not without possible execution risks. Our expected EPS for the full year 2014e stands at USD 0.83, USD 1.61 and USD 0.20 for Bank Audi, Blom Bank and Byblos Bank. BSE listed banks average at ~11% ROE remains well below MENAT at ~14.5%.
Lack of visibility for investors and underdeveloped equity market likely putting a strain on banks’ share prices: So far in 2014, we saw higher trading volume on the BSE at 75.8 million share in 9M-14 (up 144% YoY), while listed shares of banks under coverage saw slightly negative to mid-single digit growth (Bank Audi: -3.7% Ytd, Blom Bank: +6.1% Ytd, Byblos Bank: +5.2% Ytd). We do not expect any sustainable multiple expansion as share prices remain constrained by investors looking for further visibility in terms of a return to earnings growth, a pick-up in economic activity and abatement in political risks. Furthermore, we also highlight the fact that the BSE remains underdeveloped and illiquid, hindering stock performance as indicated by relatively low stock market cap as % of GDP and stock market turnover ratio as well as few issuers dominating the market.
Source: Company reports, BSE, FFA Private Bank estimates Note:* listed shares as of market close of October 13, 2014 **Based on TTM EPS
In the absence of any significant multiple expansion, we continue to value the banks relative resilience in operations as well as generous 5%+ dividend yields: While multiple expansion remains hindered by unstable operating conditions and structural illiquidity on the BSE, we value dividend yields at 5%+ (defended given low payouts and stable profits) as well as relative resilience in operations vs. other domestic sectors. We keep our recommendations unchanged (see table above) and remind that Blom Bank is Overweight in our universe given higher than average margins, efficiencies and ROE, stable growth in earnings, in addition to solid capitalization, sizeable liquidity and conservative approach to growth.
Company Symbol Recommendation Target Price Share Price
* YTD change
P/E **
P/B to common
Dividend Yield
Bank Audi AUDI.LB Marketweight USD 7.00 USD 6.00 -3.7% 7.5x 0.96x 6.7%
Blom Bank BLOM.LB Overweight USD 10.00 USD 8.75 +6.1% 5.5x 0.87x 5.7%
Byblos Bank BYB.LB Marketweight USD 1.60 USD 1.63 +5.2% 8.6x 0.80x 8.1%
Contacts: Head of Research: Nadim Kabbara, CFA [email protected] +961 1 985 195 Analyst: Raya Freyha [email protected] +961 1 985 195 Sales and Trading, FFA Private Bank (Beirut) +961 1 985 225 Sales and Trading, FFA Dubai ltd (DIFC) +971 4 3230300
Disclaimer:
This document has been issued by FFA Private Bank for informational purposes only. This document is not an offer or a
solicitation to buy or sell the securities mentioned. Although FFA Private Bank s.a.l. makes reasonable efforts to provide
accurate information and projections, certain statements in this document constitute forward-looking statements or
statements which may be deemed or construed to be forward-looking statements. These forward-looking statements involve,
and are subject to known and unknown risks, uncertainties and other factors which could cause the actual results, performance
(financial or operating) or achievements to differ from the future results, performance (financial or operating) or achievements
expressed or implied by such forward-looking statements. Therefore, FFA Private Bank makes no guarantee or warranty to the
accuracy and thoroughness of the information mentioned, and accepts no responsibility or liability for damages incurred as a
result of opinions formed and decisions made based on information presented in this document. All opinions expressed herein
are subject to change without prior notice.
Lebanese Banks
Q3/14 Preview
October 13th, 2014
Sector: Banking
Country: Lebanon
While Lebanese Banks trade at discount to MENA peers constrained by difficult macro backdrop, lower
profitability and structural BSE-related issues, we value their attractive dividends for income oriented investors
FFA Private Bank Lebanese Banks Coverage

| Q3/14 PREVIEW | BANKING – LEBANESE BANKS|
2
BANK AUDI
Company Description
Bank Audi is the largest bank in Lebanon in terms of assets with an asset base at USD 39.3 billion and TTM earnings at
USD 306 million in Q2/14. The Bank had a total of 204 branches and 6,161 employees as of the end of June 2014 with
operations in its domestic market Lebanon as well as across Europe, MENA and Turkey. The Bank’s diversification across
markets translates into a breakdown of assets and earnings between domestic and international at a respective
55%/45% and 69%/31% in Q2/14. In terms of assets Turkey is currently the biggest international market for Bank Audi.
The current strategy is geared towards three key markets: Lebanon, Turkey and Egypt following the active balance sheet
downsizing in Syria. We highlight the Bank’s relatively sound asset quality (Gross NPL ratio at 2.5% as of Q2/14) amidst
a difficult backdrop, the solid balance sheet growth and potential to pick up margins and profitability from current levels
driven by Turkey. Bank Audi has recently closed a capital increase representing around 50 million additional common
shares at an issue price of USD 6.00 per share and 3 warrants on Odea Bank. The capital increase aims to increase
conformance vis-à-vis regulatory requirements and fund the expansion plan in the coming three years.
Q2/14 Key Financial Highlights
Net profits at USD 104 million in Q2/14 (+21.3% QoQ, +1.5% YoY) from stronger operating income
Net interest income up to USD 192 million (+5% QoQ, +20% YoY), from higher balance sheet volumes and
margins improvement.
Surge in fees and commissions in Q2/14 to reach USD 63 million (+21% QoQ, +43% YoY).
Cost-to-income at 58% in Q2/14, reflecting weaker efficiencies sequentially and YoY, partly on account of
the expansion in Turkey.
Improved asset quality with the gross NPL ratio down to 2.5% translating into lower cost of risk.
CAR III at 12.3% in Q2/14, while profitability ratios were flat to slightly up.
Latest Key Regional Highlights
Bank Audi breakdown of assets and earnings between domestic and international operations stands at
55%/45% and 69%/31% respectively as at end June 2014 period.
In 20 months of activity Odea Bank accumulated USD 9.6 billion in total assets representing 24% of group
assets and is seeking gradual convergence towards breakeven in profits as branches gain maturity. H1/14
losses reached nearly USD 5 million despite first set of net profits in Q2/14 at ~ USD 3 million.
The Bank operations in Syria were downsized to just 1% of consolidated assets and 4% of consolidated
profits as of H1/14, thus limiting the exposure of Bank Audi to Syria’s heightened risks.
In H1/14, the Group generated USD 29.8 million in earnings from Egypt accounting for 16% of consolidated
profits and 9% of total assets. Management has adopted an accelerated business plan for Egypt with and
an objective to double the size of the assets in the medium term.
Given the unrest in Syria, the Bank’s current key growth markets are: Lebanon, Turkey and Egypt.

| Q3/14 PREVIEW | BANKING – LEBANESE BANKS|
3
FFA Model Assumptions
We forecast net profits of USD 88 million in Q3/14e, up 20% YoY however below USD 104 million in Q2/14.
Expect net interest income to continue growing (+4% QoQ, +18% YoY) from higher margins and solid earning
assets momentum from Turkish expansion. Going forward, Odea Bank should help Bank Audi’s margins as
Turkish banks typically boast higher margins and as branches gain maturity. Odea Bank’s margins have so
far in 2014 been trending higher to reach 2.46% for the month of July 2014 (vs. 1.98% in Jan-14) and should
converge closer to the sector (~3.0-3.5%+ level).
Net fees and commissions to reach USD 58 million (-8% QoQ, +28% YoY).
Balance sheet is expected to remain driven by the branch rollout in Turkey. We expect QoQ growth at 3%
and 5% in Q3/14e for deposits and loans respectively, with loans expected to remain more energetic driven
by the Turkish expansion (LDR in Turkey: 115% vs. 35% for Lebanon as of June 2014).
The LDR is expected to trend slightly higher reaching 48% by the end of Q3/14e.
We forecast provisions of USD 19 million in Q3/14e equivalent to an estimated cost of risk of 0.19%.
Our estimate for cost to income in Q3/14e at ~60%, still high compared to pre-Turkey expansion levels.
Looking at 2014e, net profits should total USD 349 million (+14% YoY) with EPS at USD 0.83, driven by
stronger operating income and lower cost of risk.
Table 1: FFA Model Forecasts
USD million FFA Q3/14e Q2/14a Q3/13a QoQ % YoY % 2013a FFA 2014e
Net interest income 198.8 191.8 168.6 4% 18% 638.2 776.3
Operating income 318.3 338.9 256.1 -6% 24% 1069.4 1258.0
Net profits 87.7 104.0 73.1 -16% 20% 305.0 349.5
Diluted EPS 0.20 0.26 0.19 -21% 6% 0.80 0.83
Assets 40,493 39,262 34,470 3% 17% 36,191 41,535
Deposits 35,027 33,960 29,471 3% 19% 31,095 35,990
Loans 16,792 16,034 13,565 5% 24% 14,713 17,608 BVPS to common 6.34 6.28 6.31 1% 1% 6.17 6.40
FFA Cost-to-income ratio 60.0% 57.7% 58.0% 56.1% 59.7% Loans-to-deposits ratio 47.9% 47.2% 46.0% 47.3% 50.0%
Source: Company reports and FFA Private Bank estimates
Investment Opinion
We value Bank Audi’s domestic leadership, asset quality and improving margins, however investors likely to remain on the sidelines waiting for more visibility in terms of generating returns from its growth strategy Bank Audi is the largest bank in Lebanon with a demonstrated franchise and the confidence of its clients in Lebanon
and abroad. In light of difficult operating conditions we value its fundamentals mainly from the preservation of its
asset quality and interest margins as well as an ambitious expansion strategy in Turkey that is materializing into
assets diversifying away from Lebanon’s risk and gradually higher margins. We continue to rate Bank Audi shares at
Marketweight although recognize upside potential for the shares in the medium to longer term once investors gain
greater confidence on management’s execution of its growth plan.

| Q3/14 PREVIEW | BANKING – LEBANESE BANKS|
4
Target Price Revision and Recommendation
We reiterate our Marketweight rating on Bank Audi shares with a fair value at USD 7.00 per share Based on our revised forecasts and discount rate assumptions to our Dividend Discount Model, our fair value
estimate for Bank Audi is at USD 7.00 per share. Our DDM assumes a 14.0% cost of equity and a 3% terminal growth
rate. We corroborate our DDM valuation by means of the residual income method as well as historical and
comparable P/E and P/B multiples.

| Q3/14 PREVIEW | BANKING – LEBANESE BANKS|
5
BLOM BANK
Company Description
Blom Bank is the second largest Bank in Lebanon in terms of assets with an asset base at USD 27.4 billion and TTM
earnings at USD 356 million in Q2/14. The Bank had a total of 224 branches and 4,552 employees as of the end of
June 2014 with operations in its domestic market Lebanon as well across Europe and the MENA region. The Bank’s
diversification across markets translated into a breakdown of assets and earnings between domestic and
international at 78%/22% and 76%/24% in Q2/14. The Bank’s current strategy is geared towards two key markets:
Lebanon and Egypt as the Bank’s operations in Syria have been downsized in terms of balance sheet. Egypt is
currently the biggest international market for Blom Bank. The Bank has so far adopted a conservative approach to
growth translating into ample liquidity buffers and solid capitalization. We also note that Blom Bank has historically
surpassed its peers in terms of profitability levels and cost-efficiencies.
Q2/14 Key Financial Highlights
Net profits up to USD 92 million in Q2/14 (+5% QoQ, +3% YoY)
Net interest income at USD 136 million in Q2/14, flat QoQ, up 3% YoY.
Fees and commissions increased to USD 35 million in Q2/14 (+6% QoQ, +3% YoY), representing 17% of total
operating income.
Provisions at USD 13 million in Q2/14, higher sequentially yet still significantly lower YoY. Cost-to-income
ratio ratio at 38.5% reflecting high efficiencies.
On the balance sheet side we note healthy growth in key indicators in Q2/14 in the 2%-4% range QoQ,
4%-7% range Ytd.
Comfortable capital position with CAR III stable at 17% and profitability ratios at the high end of our
coverage universe.
Latest Key Regional Highlights
Blom Bank breakdown of assets and earnings between domestic and international operations stands at
78%/22% and 76%/24% respectively in Q2/14.
The Bank operations in Syria have been downsized to just 1.6% of total assets and 2.5% of total profits as
of Q2/14, thus limiting the exposure of Blom Bank to Syria’s heightened risks.
In H1/14, the Group generated USD 20.2 million in net earnings from Egypt accounting for 11% of
consolidated profits and 7% of total assets.
Given the unrest in Syria, the Bank’s key growth markets are: Lebanon and Egypt.
FFA Model Assumptions
We expect net profits of USD 91 million in Q3/14e, edging up 5% YoY and roughly flat from previous quarter.
We forecast operating income at USD 206 million in Q3/14e (-2% QoQ, +17% YoY).
We expect net interest income at USD 139 million in Q3/14e (+2% QoQ, +3% YoY) as roughly flat margins
are likely to be matched with moderate earnings assets growth.
We forecast slightly higher fees and commissions at USD 33 million for the quarter (-7% QoQ, +15% YoY).

| Q3/14 PREVIEW | BANKING – LEBANESE BANKS|
6
We expect provisions of USD 18 million equivalent to a 0.20% estimated cost of risk. Our cost-to-income
estimate stands at 39% in Q3/14e (within the Bank’s usual range).
Key balance sheet indicators including assets, deposits and loans are expected to grow at a low single digit
in Q3/14e, ranging between 1% and 2%.
At these growth levels, the LDR should remain relatively unchanged edging up 2 bps QoQ to 29% which
reflects ample liquidity and significant room to expand lending from current levels.
For the year 2014e, net profits should total USD 364 million (+3% YoY) with EPS at USD 1.61.
Table 2: FFA Model Forecasts
USD million FFA Q3/14e Q2/14a Q3/13a QoQ % YoY % 2013a FFA 2014e
Net interest income 139.0 136.4 135.3 2% 3% 528.3 549.8
Operating income 206.3 210.4 175.7 -2% 17% 800.2 822.9
Net profits 91.2 91.7 86.9 -1% 5% 352.4 363.9
Diluted EPS 0.40 0.41 0.39 -2% 2% 1.58 1.61
Assets 27,792 27,371 25,694 2% 8% 26,149 28,203
Deposits 23,835 23,484 22,313 1% 7% 22,572 24,191
Loans 6,912 6,758 6,230 2% 11% 6,345 7,064
BVPS to common 10.38 10.10 9.35 3% 11% 9.75 10.67
FFA Cost-to-income ratio 38.8% 38.6% 40.3% 36.3% 38.6%
Loans-to-deposits ratio 29.0% 28.8% 27.9% 28.1% 29.2% Source: Company reports and FFA Private Bank estimates
Investment Opinion
We view Blom Bank’s higher returns and solid liquidity levels as a reflection of a prudent management team and see scope for dividends to grow over time on account of lower than average payouts We recognize Blom Bank’s solid positioning in its domestic market. We like the firm’s conservative strategy
translating into superior profitability and return ratios relative to its domestic peers despite sizeable liquidity buffers.
In the short term, we look to the prudent management team to focus on limiting asset quality deterioration in light
of difficult operations in key regional markets, while steadily growing earnings and dividends.
Recommendation
We reiterate our Overweight rating on Blom Bank shares with a fair value at USD 10.00 per share Based on our revised forecasts and discount rate assumptions to our Dividend Discount Model, our fair value
estimate has been maintained at USD 10.00 per share. Our DDM assumes a 15.5% cost of equity and a 3% terminal
growth rate. We corroborate our DDM valuation by means of the residual income method as well as historical and
comparable P/E and P/B multiples.

| Q3/14 PREVIEW | BANKING – LEBANESE BANKS|
7
BYBLOS BANK
Company Description
Byblos Bank is the third largest Bank in Lebanon in terms of assets with an asset base at USD 18.6 billion and TTM
earnings at USD 150 million in Q2/14. The Bank had a total of 102 branches and 2,515 employees as of the end of
June 2014 with operations in Lebanon as well across Europe, Africa and the MENA region. The Bank’s diversification
across markets is lagging behind its peers with a breakdown of assets and earnings between domestic and
international at 90%/10% and 84%/16% as of H1/14. The Bank’s balance sheet is mainly focused on Lebanon after
operations in Syria have been downsized. The Bank has so far adopted a conservative growth strategy translating
into ample liquidity levels and solid capitalization at the expense of weaker margins and profitability.
Q2/14 Key Financial Highlights
Net profits at USD 39 million in Q2/14 (+26% QoQ,-6% YoY)
Net interest income at USD 62 million in Q2/14 (+10% QoQ, +10% YoY).
Non-interest income at USD 49 million in Q2/14, roughly flat QoQ, yet lower YoY.
NPL ratio improved to 4.8% in Q2/14 while provisions edged up QoQ to USD 10 million (yet still lower YoY).
Cost-to-income at 48%.
Deposits and loans edged up 2% and 1% respectively QoQ, with an LDR at 30.2%.
Profitability ratios at the low end of our coverage and dividend yield at an attractive 8.2%.
Latest Key Regional Highlights
Byblos Bank breakdown of assets and earnings between domestic and international operations stands at
90%/10% and 84%/16% respectively in H1/14.
The Bank operations in Syria have been downsized to just 1.5% of total assets as of June 2014.
Byblos Bank has operations in Iraq since 2007. Currently operations are conducted through three branches
(Baghdad, Erbil and Basra). In H1/14, the Bank’ assets and net profits in Iraq totaled USD 243 million and
USD 2.4 million representing around 1.3% and 3.7% of total assets and net profits respectively.
FFA Model Assumptions
We expect net profits of USD 41 million in Q3/14e, up 5% QoQ and 9% YoY.
We forecast net interest income of USD 63 million in Q3/14e, up 2% QoQ and 10% YoY, consistent with a
trend initiated in past quarter as Management takes initiatives against compressed margins.
Fees and commissions income expected at USD 26 million in Q2/14e (+5% YoY).
Key balance sheet indicators namely assets, deposits and loans are expected to witness moderate growth
at a low single digit in Q3/14e (+2% QoQ), with an LDR maintained at 30%.
We forecast provisions of USD 14 million in Q3/14e equivalent to an estimated cost of risk at 0.30%. Our
cost-to-income estimate stands at 46% for Q3/14e and 48% for the full year 2014e.
Looking at 2014e, net profits should reach USD 155 million with EPS at USD 0.20, both roughly unchanged
from last year.

| Q3/14 PREVIEW | BANKING – LEBANESE BANKS|
8
Table 3: FFA Model Forecasts
USD million FFA Q3/14e Q2/14a Q3/13a QoQ % YoY % 2013a FFA 2014e
Net interest income 62.5 61.6 57.0 2% 10% 232.2 243.3
Operating income 119.6 110.2 103.4 9% 16% 448.1 456.7
Net profits 40.9 38.8 37.7 5% 9% 156.2 155.4
Diluted EPS 0.05 0.05 0.05 7% 3% 0.20 0.20
Assets 19,004 18,633 18,029 2% 5% 18,485 19,209
Deposits 15,533 15,274 14,407 2% 8% 14,749 15,790
Loans 4,702 4,617 4,260 2% 10% 4,511 4,787
BVPS to common 2.08 2.06 2.05 1% 1% 2.13 2.10
FFA Cost-to-income ratio 46.2% 48.1% 51.8% 46.9% 47.8%
Loans-to-deposits ratio 30.2% 30.2% 29.6% 30.6% 30.2% Source: Company reports and FFA Private Bank estimates
Investment Opinion
While we like Byblos Bank’s solid domestic retail franchise with strong risk management practices, we believe additional value could be generated for investors as visibility and cost-efficiencies improve We recognize Byblos Bank’s position in its domestic retail market and solid fundamentals benefiting from sizeable
liquidity buffers, strong capitalization and superior asset/liability management practices, a validation of
management’s risk practices although at the detriment to profitability ratios. We also recognize the firm’s leadership
at better managing its asset liability mismatch with the issuance of costlier longer term liabilities. We believe Byblos
Bank’s shares could generate more value once the firm gains visibility on its outlook and redeploys capital to create
additional shareholder value by way of expansion, acquisition, or return of capital.
Recommendation
We reiterate our Marketweight rating on Byblos Bank shares with a fair value of USD 1.60 per share Based on our revised forecasts and discount rate assumptions to our Dividend Discount Model, our fair value
estimate has been maintained at USD 1.60 per share. Our DDM assumes a 15.5% cost of equity and a 3% terminal
growth rate. We corroborate our DDM valuation by means of the residual income method as well as historical and
comparable P/E and P/B multiples.
| Q3/14 PREVIEW | BANKING – LEBANESE BANKS|
9
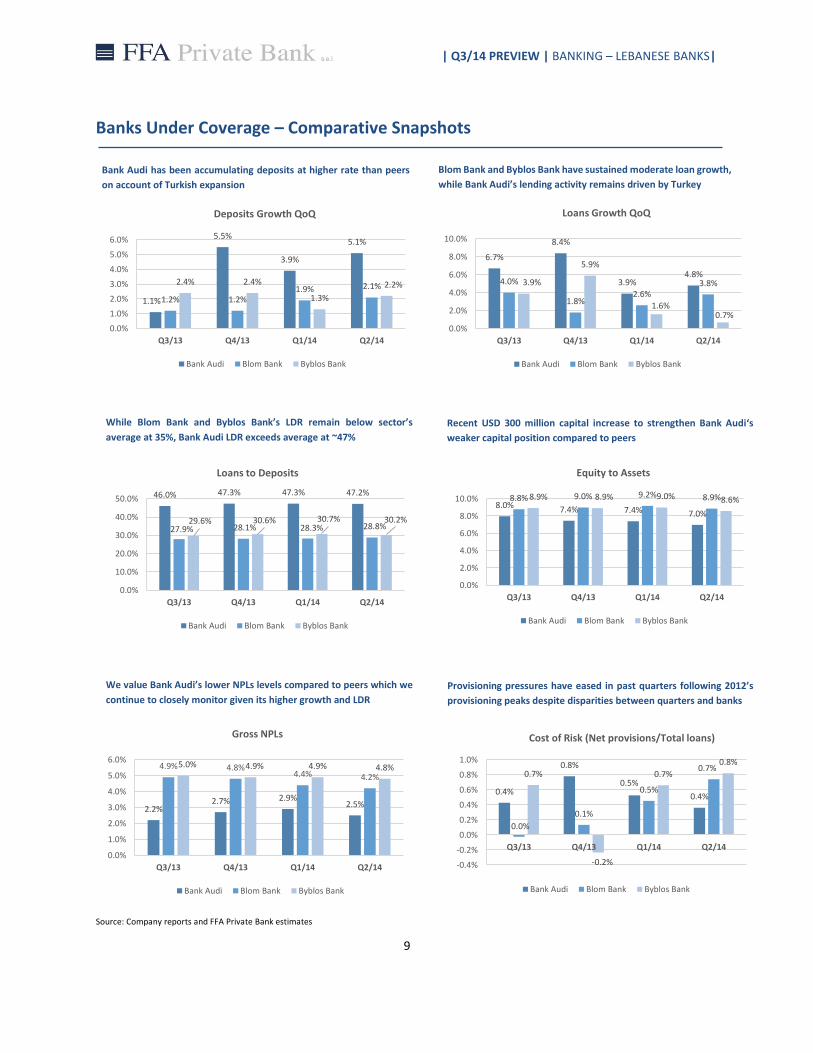
Banks Under Coverage – Comparative Snapshots
Source: Company reports and FFA Private Bank estimates
Bank Audi has been accumulating deposits at higher rate than peers
on account of Turkish expansion
While Blom Bank and Byblos Bank’s LDR remain below sector’s
average at 35%, Bank Audi LDR exceeds average at ~47%
1.1%
5.5%
3.9%
5.1%
1.2% 1.2%1.9% 2.1%2.4% 2.4%
1.3%
2.2%
0.0%
1.0%
2.0%
3.0%
4.0%
5.0%
6.0%
Q3/13 Q4/13 Q1/14 Q2/14
Deposits Growth QoQ
Bank Audi Blom Bank Byblos Bank
6.7%
8.4%
3.9%4.8%
4.0%
1.8%2.6%
3.8%3.9%
5.9%
1.6%0.7%
0.0%
2.0%
4.0%
6.0%
8.0%
10.0%
Q3/13 Q4/13 Q1/14 Q2/14
Loans Growth QoQ
Bank Audi Blom Bank Byblos Bank
46.0% 47.3% 47.3% 47.2%
27.9% 28.1% 28.3% 28.8%29.6% 30.6% 30.7% 30.2%
0.0%
10.0%
20.0%
30.0%
40.0%
50.0%
Q3/13 Q4/13 Q1/14 Q2/14
Loans to Deposits
Bank Audi Blom Bank Byblos Bank
8.0% 7.4% 7.4% 7.0%
8.8% 9.0% 9.2% 8.9%8.9% 8.9% 9.0% 8.6%
0.0%
2.0%
4.0%
6.0%
8.0%
10.0%
Q3/13 Q4/13 Q1/14 Q2/14
Equity to Assets
Bank Audi Blom Bank Byblos Bank
2.2%2.7% 2.9%
2.5%
4.9% 4.8%4.4% 4.2%
5.0% 4.9% 4.9% 4.8%
0.0%
1.0%
2.0%
3.0%
4.0%
5.0%
6.0%
Q3/13 Q4/13 Q1/14 Q2/14
Gross NPLs
Bank Audi Blom Bank Byblos Bank
0.4%
0.8%
0.5%
0.4%
0.0%
0.1%
0.5%
0.7%0.7%
-0.2%
0.7%
0.8%
-0.4%
-0.2%
0.0%
0.2%
0.4%
0.6%
0.8%
1.0%
Q3/13 Q4/13 Q1/14 Q2/14
Cost of Risk (Net provisions/Total loans)
Bank Audi Blom Bank Byblos Bank
Blom Bank and Byblos Bank have sustained moderate loan growth,
while Bank Audi’s lending activity remains driven by Turkey
Recent USD 300 million capital increase to strengthen Bank Audi‘s
weaker capital position compared to peers
We value Bank Audi’s lower NPLs levels compared to peers which we
continue to closely monitor given its higher growth and LDR
Provisioning pressures have eased in past quarters following 2012’s
provisioning peaks despite disparities between quarters and banks

| Q3/14 PREVIEW | BANKING – LEBANESE BANKS|
10
Source: Company reports and FFA Private Bank estimates
83.7% 85.6% 82.1%75.2%
93.1% 89.7% 86.9%81.5%
79.2% 79.7% 75.1% 74.5%
0.0%
20.0%
40.0%
60.0%
80.0%
100.0%
Q3/13 Q4/13 Q1/14 Q2/14
Core Income (NII + Fees)/Total Operating Income
Bank Audi Blom Bank Byblos Bank
58.0%
68.5%
54.9% 57.7%
40.3% 37.7% 41.0% 38.5%
51.4% 49.4%55.3%
48.1%
0.0%
20.0%
40.0%
60.0%
80.0%
Q3/13 Q4/13 Q1/14 Q2/14
Cost to Income
Bank Audi Blom Bank Byblos Bank
2.0% 1.9% 1.9% 2.0%2.1%
2.0% 2.0% 2.0%
1.3% 1.2% 1.2%1.3%
0.0%
0.5%
1.0%
1.5%
2.0%
2.5%
Q3/13 Q4/13 Q1/14 Q2/14
Net Interest Income/Total Assets
Bank Audi Blom Bank Byblos Bank
1.1%
0.9% 0.9%0.8%
1.4% 1.4% 1.4% 1.4%
0.9% 0.9% 0.9% 0.8%
0.0%
0.5%
1.0%
1.5%
Q3/13 Q4/13 Q1/14 Q2/14
Return on Assets (TTM Profits/Average Assets)
Bank Audi Blom Bank Byblos Bank
0.19
0.12
0.220.27
0.39 0.41 0.39 0.41
0.05 0.05 0.04 0.05
0.00
0.10
0.20
0.30
0.40
0.50
Q3/13 Q4/13 Q1/14 Q2/14
Diluted EPS (in USD)
Bank Audi Blom Bank Byblos Bank
6.30 6.16 6.45 6.28
9.35 9.75 10.23 10.10
2.05 2.13 2.17 2.05
0.00
2.00
4.00
6.00
8.00
10.00
12.00
Q3/13 Q4/13 Q1/14 Q2/14
BVPS to Common (in USD)
Bank Audi Blom Bank Byblos Bank
Stable margins for Blom Bank, while Bybos Bank’s liquidity
accumulation strategy has dampened margins and Audi’s margins to
improve as Odea converges towards Turkish average
Blom Bank core income’s contribution to total higher than peers
although witnessing a decline over the past four quarters
Blom Bank typically boasts higher efficiencies than peers, while Bank
Audi cost-to-income surged reflecting Odea’s initial stage of expansion
We value Blom Bank higher profitability compared to peers at a stable
1.4% over the past four quarters
EPS volatility has been higher for Bank Audi with a noticeable
improvement in the last reported quarter
Book value per share to common reveals that only Blom Bank has
witnessed substantial improvement over the past four quarters

| Q3/14 PREVIEW | BANKING – LEBANESE BANKS|
11
Lebanese Banking Sector Highlights
Recent Banking Sector Highlights
Lebanese banks still reporting descent balance sheet growth amidst difficult operating conditions. Banks
have been weathering the unfavorable political and economic conditions amidst a political standstill and a
lackluster real GDP growth averaging 2% in the 2012e-2014e period as per the IMF latest estimates. In 2013,
key balance sheet indicators grew in the 7%-10% range, while profits remained flat.
Looking at 2014 , we note that Lebanese banks have, so far, seen a continuous growth in their key balance
sheet indicators in the 3%-5% range Ytd (see figure 1), for assets, deposits and loans to reach USD 170.3
billion, USD 141.5 billion and USD 49.7 billion respectively at the end of August 2014. Continuous deposits
inflows represent a sign of resilience for the sector and allow the financial system to continue to fund the
budget shortfalls, while providing support to Central Bank FX reserves, which reached USD 35.1 billion in
July 2014 up 11% since the beginning of the year. Looking at market shares by key balance sheet indicators
at end-2013, we highlight that Bank Audi is the market leader in terms of assets, deposits and loans, Blom
Bank comes second, while Byblos Bank holds the third position in assets and deposits and ranks 4th just
after Fransabank in terms of loans.
Non-resident deposits funds 21% of total deposits and remains a key strength for the sector. Non-resident
deposits edged up 3% Ytd in 8M-14 to USD 29.3 billion as the 5% QoQ drop that was registered in Jan-14
was recouped in following months. At the end of August 2014, non-resident deposits accounted for a
substantial 21% of total deposits (compared to 14% in 2007), pointing to a gradual higher contribution over
past several years; although at a slower pace this year.
Assets remain mainly funded by deposits at 83%, while asset allocation at the end of Jul-14 reflects two
main avenues for liquidity including government securities and loans to the private sector. LDR at 35%
reflects ample liquidity levels. Dollarization of deposits and loans stood at 66% and 76% respectively.
Source: BDL Source: BDL
Figure 1: Ytd growth in first eight months of the year Figure 2: Resident vs. non-resident deposits
4.6% 4.7%
6.0%
4.4%5.1%
4.9%
3.3%3.9%
5.0%
0.0%
2.0%
4.0%
6.0%
8.0%
Assets Deposits Loans
8M-12 8M-13 8M-14
98.3 105.0 112.2
22.926.4
29.3
0
50
100
150
Aug-12 Aug-13 Aug-14
USD
Bill
ion
s
Resident deposits Non-resident deposits
121.2 131.4 141.5

| Q3/14 PREVIEW | BANKING – LEBANESE BANKS|
12
We believe that the banking system has to grow by 6% per year to keep on funding fiscal shortfalls.
The majority of the asset base of Lebanese banks is exposed to government securities (T-bills, Eurobonds,
and CDs at ~ 50%) and loans to the private sector (~30%). We note that ~60% of government gross debt (T-
bills + Eurobonds) is held by Lebanese banks which ties both parties together ensuring a healthy market for
government securities. We estimate the banking system needs to grow 6% in deposits equivalent to ~USD
8.5 billion in order for the share of liquidity that does not go into private lending can be directed towards
absorbing the new government shortfalls. A slower growth rate in deposits on account of higher risk in
Lebanon or higher fiscal deficit would put this arrangement in question.
Central Bank continues to stimulate the economy by subsidizing loans and offering facilities in reserve
requirements. With the aim of stimulating lending and encouraging economic growth, the Central Bank,
has been offering interest rates subsidies on loans granted by banks to productive sectors (such as housing,
agriculture, tourism and industry, etc…) in order to reduce the cost of financing on SMEs and startups. A
substantial portion of the ~USD 1.5 billion that Banque du Liban (BDL) put at the disposal of the country’s
commercial banks at 1% interest rate in 2013 was aimed at supporting the real estate sector. The central
bank announced at the end of last year that the plan would be extended to 2014 with a total of USD 800
million in preferential financing facilities. Another measure to encourage commercial banks to enhance
their medium and long term lending is the BDL’s facilities on reserve requirements whenever banks extend
loans, in LBP or in FC to productive sectors.
Lebanese banks are still operating in a challenging environment putting pressure on earnings growth,
although not yet at the detriment of dividends. Sluggishness in earnings growth continues to prevail across
the banking system. Net earnings of alpha banks and sector were roughly unchanged in 2013 at USD 1.7
billion and USD 1.8 billion respectively, with alpha banks’ net profits accounting for nearly 95% of the sector
total net profits. Looking at H1/14, alpha banks saw their net profits increasing 6% YoY to USD 910.5 million
which should be interpreted with caution given that the alpha group (banks with deposits in excess of USD
2 billion) moved from a total of 13 banks in 2013 to 14 banks in 2014. More generally, it seems like Lebanese
banks’ earnings are still lackluster on account of pressured margins and moderate balance sheet expansion
although helped by easing provisioning pressures following a peak seen in 2012 as books in Syria have been
severely downsized.
Although banks’ profits have been uninspiring over the past couple of years, we have not seen significant
cut in dividends programs, which we expect to remain safe and attractive for investors with payouts at an
average of ~50% of profits for banks under coverage in 2013 (at nearly 52% for Bank Audi, 32% for Blom
Bank and 68% for Byblos Bank).
Both spreads in USD and LBP are on a downward trend in August 2014 compared to one year earlier.
Statistics from the ABL for the month of August 2014 reveal that Lebanese banks are still operating in a low
interest environment, limiting potential to improve earning asset yields along with limited capacity to
decrease the cost of funds given market share concerns amidst slower deposit accumulation.
Spread in USD decreased to 1.32% in August 2014 down from 1.46% one year earlier which has a substantial
impact on Lebanese Bank’s profitability given that the bulk of their liquidity is in USD. This decrease was

| Q3/14 PREVIEW | BANKING – LEBANESE BANKS|
13
driven by a 15 bps increase in the cost of funds to 3.04% in the context of roughly unchanged weighted
average on uses of funds at ~4.35%. Reminder, banks are still dealing with a negative carry on USD liquidity.
Spreads in LBP narrowed YoY in August 2014 (0.94% vs. 1.37% in Aug-13) from higher cost of funds (+8 bps
to 5.51%) and lower return on uses of funds (-35 bps to 6.45%) which was dragged down by lower lending
rates (-7 bps to 7.34%) and more essentially lower rates on CDs issued by the BDL (-67 bps to 8.12%) despite
higher weighted yield on T-bills (+20 bps to 6.92%).
Source: Association of Banks in Lebanon Source: Bank Data
Interest rates are not expected to increase in the short term, which should continue to weigh on earnings,
although growing balance sheets and easing provisions to help profits. The Governor of the BDL Riad
Salame recently stated that he expects interest rates in Lebanon to remain stable in the absence of external
market pressures given that banks hold a substantial portion of their liquidity between placements at
Central Bank and interbank which are tied to global benchmark rates. Current global interest rates’ policies
remain accommodative although could see the beginning of a gradual increase in rates starting next year
for Bank of England and Fed, while the ECB and Japan remain accommodative and keeping interest rates
low for the foreseeable future.
Furthermore, Lebanese banks used to hold in their balance sheet high yielding government bonds that
matured which going forward could either put pressure on margins or on their capacity to fund provisions.
On the cost of funds side, most banks are unlikely to drastically increase rates facing pressured interest
margins and flat earnings while maintaining them sufficiently attractive to depositors to maintain market
share and drive earning assets growth.
Although expect tighter interest margins from maturing higher coupon government securities and still low
global benchmark rates, sustained growth in earning assets funded by deposits and easing provision
pressures should continue to ease downward pressures on banks’ profits and ultimately support dividends.
News and Regulatory Updates
In August 2014, Central Bank issued amendment to basic circular 81, tightening conditions for retail loans.
The Central Bank of Lebanon recently issued an intermediate circular 369 on August 21, 2014 (which amends
basic circular 81 dating February 21, 2001) and should enter into effect as of October 1, 2014. The
amendments tightened regulations on retail lending. On one hand, the article imposes more restrictive limits
on lending amount based on the value of purchase for housing loans and car loans, and other limitation on
Figure 3: Spreads in USD and LBP Figure 4: Alpha banks net profits in first half of the year
836.6
855.3
910.5
810
830
850
870
890
910
H1/12 H1/13 H1/14
USD
Mill
ion
s
0.0%
0.4%
0.8%
1.2%
1.6%
2.0%
Spreads (LBP) Spreads (USD)

| Q3/14 PREVIEW | BANKING – LEBANESE BANKS|
14
the cumulative monthly payments depending on borrower’s monthly income. On another hand, the circular
also introduced specific and general provisions requirements against these retail loans.
In its Article IV Consultation Report on Lebanon issued in July 2014, the IMF issued recommendations for
Lebanese banks ranging from deposit growth and sovereign exposure to capital buffers and loan
classification. IMF considered that a growth rate of about 8% for deposits would be enough to finance the
economy and the Central Bank’s reserve requirements, it recommends banks to avoid a return to double digit
deposit growth that would generate excess liquidity. The IMF recommends that the banking sector should
reduce its reliance on government securities over time. It also tackled capitalization and NPLs considerations,
recommending banks to strengthen their capital buffers given their large exposure to the sovereign and
called on the BDL to improve loan classification and restructuring rules.
Comparable Valuation to MENA Peers
Lebanese banks trade at a discount to MENAT banks along with weaker profitability, yet offer higher
dividend yields and refuge from global markets. We saw higher trading volume on the BSE at 75.8 million
share in 9M-14 (up 144% YoY), while listed shares of banks under coverage saw slightly negative to mid-
single digit growth performance (Bank Audi: -3.7% Ytd, Blom Bank: +6.1% Ytd, Byblos Bank: +5.2% Ytd).
Based on today’s listed share price, Lebanese banks are trading at 8.9x P/E, 0.9x P/B and attractive dividend
yield of ~5% despite holding lower than average ROE of 10.7%. In comparison, banks in the MENAT region
trade at an average of 13.8x P/E, 1.7x P/B and offer a 3.3% dividend yield and a 14.4 % ROE (see table below).
While stock price appreciation of Lebanese banks could only benefit to long term patient investors as banks
can remain cheap at 1x book given weaker profitability and higher risk levels, they could rather benefit from
~5% returns from attractive dividend programs and negligible correlation levels to MENAT and global markets
ranging between -0.05 to +0.05.
Table 4: Comparable Valuation
Ticker Name Market Cap. In USD mn
Ytd Growth (in %)
Div. Yield (in %)
EPS Growth (in %)
ROE (in %)
PE ratio
PB ratio
AUDI LB Equity BANK AUDI SAL 2,338.5 -3.7 6.7 -8.3 11.3 7.5 1.0
BLOM LB Equity BLOM BANK 1,881.3 6.1 5.7 2.4 15.5 5.5 0.9
BYB LB Equity BYBLOS BANK 921.8 5.2 8.1 -11.4 9.5 8.6 0.8
BEMO LB Equity BANQUE EUROPEENNE MOY ORIENT 127.3 -6.0 0.6 21.6 7.5 16.7 1.3
BOB LB Equity BANK OF BEIRUT 928.1 -3.2 3.1 7.7 11.2 7.4 0.8
BLC LB EQUITY BLC BANK SAL 259.6 -12.8 n/a -30.7 9.1 7.8 0.7
Average Lebanon 1,076.1 -2.4 4.8 -3.1 10.7 8.9 0.9
Average UAE 12,712.1 25.2 3.2 19.3 15.0 12.6 1.9
Average Egypt 3,358.5 45.5 5.0 33.9 26.1 11.2 2.8
Average Kuwait 10,720.6 13.0 1.8 -17.8 7.6 27.9 1.9
Average Oman 2,615.1 19.5 3.6 0.7 14.6 9.3 1.3
Average Qatar 13,458.2 34.3 4.0 4.6 14.9 15.7 2.3
Average KSA 15,012.6 30.4 2.4 6.2 12.6 16.7 1.9
Average Turkey 7,551.6 5.4 1.7 7.3 14.0 7.8 1.0
TOTAL AVERAGE 8,313.1 21.4 3.3 6.4 14.4 13.8 1.7
Source: Bloomberg priced as of market close on October 13th 2014, FFA Private Bank for companies under coverage.

| Q3/14 PREVIEW | BANKING – LEBANESE BANKS|
15
Lebanese banks valuation should remain capped by high political and security risks, keeping investors on the
sideline and limiting multiple expansion. On a positive note dividend yields are still attractive compared to
global and regional benchmark and are typically paid in the month of April/May each year for banks under
coverage.
The BSE remains generally underdeveloped and illiquid, limiting stock performance upside. According to
the IMF’s latest Global Financial Stability Report, the BSE market clearly lags behind other MENA markets.
It points the fact that Lebanon’s non-bank financial sector is underdeveloped (~15% of GDP) compared to
the oversized banking sector with assets at about 360% of 2014e GDP. The stock market is dominated by
one large real estate player, Solidere and several banks (Bank Audi, Blom Bank, Byblos Bank, Bank of Beirut,
Banque Bemo, and BLC Bank) which together represented 96%+ of the stock market total market cap for
2013 including preferred shares and GDRs. Stock market cap as percent of GDP is low compared to regional
and global benchmarks at just ~25%. Stock market turnover ratio also appears low on a regional and global
scale at around 20% highlighting low liquidity levels. Studies have shown that a large banking sector can
constrain capital markets’ development in addition to the dominance of family businesses and weaker
corporate governance, need for stronger regulatory, legal frameworks and stock market privatization, high
sensitivity to political and security incidents, high yielding government papers competing with listed
securities, delayed privatizations which could make way for IPOs.

| Q3/14 PREVIEW | BANKING – LEBANESE BANKS|
16
Macroeconomic Highlights
Economic activity still soft in light of rising uncertainties, in contrast to improvement in external position
Economic developments continue to be soft with a GDP growth rate averaging 2% between 2011 and 2014 as per
the IMF estimates (see figure 5) down from a 9% average in the previous four year period, suggesting sharp
deceleration in economic activity. However, we note that in its recent October 2014 economic outlook database,
the IMF revised its estimates for Lebanon’s GDP slightly upwards for the 2012-2014 period to ~2% from 1.2%
previously. Capital inflows into Lebanon increased by 6% YoY to USD 16.2 billion in 2013, which did not offset the
large trade deficit at USD 17.3 billion in 2013 (+3% YoY), thus translating into a balance of payments deficit at USD
1.1 billion in 2013 vs. a deficit of USD 1.5 billion in 2012. In the first eight months of 2014, balance of payments
posted surplus of USD 433 million, as capital inflows slightly exceeded a trade deficit at USD 12 billion (-2% YoY).
Figure 5: Real GDP growth Figure 6: Gross debt to GDP ratio
Source: IMF World Economic Outlook Database October 2014 Source: IMF World Economic Outlook Database October 2014
Drop in FDI inflows, yet resilience in remittances to continue to lend support to the banking sector
FDI inflows are estimated to have been among the most affected in the context of cautiousness related to regional
uncertainties and a sluggish real estate market. Figures released by the UNCTAD show that FDI inflows to Lebanon
totaled USD 2.8 billion in 2013, down 23% from USD 3.7 billion in 2012. In parallel, remittances from the Lebanese
Diaspora, considered to be one of the largest in terms of proportion to the resident population, have proved to be
larger and more stable than FDIs inflows and are estimated by the World Bank to have reached USD 7.2 billion in
2013 (around 16% of nominal GDP), edging up from USD 6.9 billion in 2012 and maintaining Lebanon’s ranking
among top recipients in developing countries. In its recently published Migration and Development Brief, the World
Bank estimates stronger remittances inflows into Lebanon for 2014 at USD 7.7 billion (equivalent to 17% of 2013
GDP). We expect these inflows to continue to lend support to the Lebanese banking sector’s liquidity levels.
Figure 7: FDI inflows Figure 8: Remittances inflows
Source: UNCTAD Source: World Bank, April 2014 update
8.00%
2.00% 2.50%1.50% 1.75%
0%
2%
4%
6%
8%
10%
2010 2011 2012e 2013e 2014e
4,8044,280
3,485 3,674
2,833
0
1,000
2,000
3,000
4,000
5,000
6,000
2009 2010 2011 2012 2013
USD
Mill
ion
s
138%
134%
134%
141%145%
125%
130%
135%
140%
145%
150%
2010 2011 2012 2013 2014e
6,914 6,913 6,918
7,200
7,700
6,400
6,600
6,800
7,000
7,200
7,400
7,600
7,800
2010 2011 2012 2013e 2014f
USD
Mill
ion
s

| Q3/14 PREVIEW | BANKING – LEBANESE BANKS|
17
Growing structural imbalances as fiscal deficits drives debt levels
Lebanon’s public finances continue to weaken in the context of slowing economic activity and the prevailing political
stalemate. Figures released by the Ministry of Finance show that the fiscal deficit totaled USD 4.2 billion in 2013
widening 8% from USD 3.9 billion in 2012 with a fiscal deficit as % of GDP reaching an approximate 9.4% in 2013
from 9.1% in 2012. As a result of the rising deficit, Lebanon’s gross public debt reached USD 63.5 billion, up 10% from
2012 while the gross debt-to-GDP ratio estimate for 2013 stands at 141% higher than 134% in 2012, suggesting
required efforts to improve the country’s fiscal imbalances. Gross public debt reached USD 65.9 billion at the end of
August 2014 (+3.7% Ytd, +8.9% YoY), funding fiscal shortfalls. While government fiscal situation worsens, budget
deficit as % of GDP is expected to increase to ~11% of GDP for 2014, driving gross debt to reach 145% of GDP in 2014
according to the IMF. Resilient capital inflows into the banking system should continue to finance the debt as
oversized banking system continues to purchase government securities on account of high liquidity levels and slower
economic environment.
The real economy impacted by regional developments is showing mixed signals
Lebanon has been witnessing mixed performance in key economic sectors so far in 2014. The coincident of economic
an index of economic activity in Lebanon comprising eight weighted economic indicators, reached 273.4 in June 2014
compared to 283.6 in May 2014 yet still higher than 265.5 in June 2013.
The real estate market, a traditional growth engine which has suffered in the past few years, is showing some positive
signs so far in 2014 with number of transactions increasing 3% YoY in the first eight months of 2014 and positive
growth in supply indicators including total area of issued construction permits which upped 9% YoY in 7M-14.
As for the banking sector, key balance sheet indicators saw an increase in the +3%-5% range Ytd reaching USD 170.3
billion, USD 141.5 billion and USD 49.7 billion for assets, deposits and loans respectively. Non-resident deposits grew
by 3% Ytd in the first eight months of 2014 to USD 29.3 billion, funding 21% of total deposits.
Looking at tourism, we note that the sector remains lackluster although paring back the sharp decrease in activity
seen in previous years. Incoming tourists stagnated so far in 2014 as highlighted by a 1% YoY increase in the number
of tourists’ arrivals in the first eight months of 2014 to 897,106 with a 5% increase in tourist arrivals from Arab
countries which accounted for 32% of total visitors in 8M-14. Airport activity (including number of arrivals,
departures and transit) was up 2% YoY in 8M-14. EY’s Benchmark Survey of the Middle East hotel sector indicated
that the average occupancy rate of hotels in Beirut was 49% in 8M-14 down from 54% in the same period last year.
Revenues per available room were USD 81 in Beirut in 8M-14 down from USD 93 in 8M-13.
Profound structural issues facing the Lebanese economy will continue to threaten sustainable growth
unless serious reforms are undertaken
The overall assessment undoubtedly point to the fact that the Lebanese economy has been suffering from the
adverse effect of the prolonged Syrian crisis as highlighted by i) a deceleration in GDP growth to 1-2% in the 2011-
2014e period as per the IMF, significantly below pre-Syria crisis levels ii) lower FDIs inflows on account of a
deterioration in the investment environment, iii) drastically declining tourism activity iv) slower real estate activity
(with both tourism and real estate market considered among the key pillars of the Lebanese economy) v) large
inflows of Syrian refugees now estimated to account for more than a quarter of the population with serious impact

| Q3/14 PREVIEW | BANKING – LEBANESE BANKS|
18
on levels of employment, poverty, and government social/medical programs. World Bank estimates fiscal strains
from Syrian refugees at a cumulative USD 2.6 billion between 2012 and 2014 (equivalent to ~6% of 2013 GDP).
In addition to the growing pressures from regional tensions and domestic uncertainties, Lebanon has also to deal
with fiscal imbalances which are inflating debt levels. The structural imbalances are a direct reflection of the surge
in public expenditures related to the absence of comprehensive budgetary framework, poor tax collections and the
absence of any fiscal adjustment efforts which is driving Lebanon’s large debt burden higher and now ranking among
the highest in the world. Serious fiscal measures to reduce the structural imbalances and to insure the long-term
financial immunity of the country seems unavoidable. Among these measures are: enhancing the efficiency of non-
profitable government entities specifically EDL, improving tax collections, promoting private sector participation in
infrastructure investment and defining a fiscal framework.
On a positive note, the Lebanese economy has been showing some pockets of resilience including continuous growth
in the banking system, resilient remittances inflows from Lebanese expatriates as well as monetary stability.
A return to healthier economic growth (convergence towards potential GDP) will remain dependent on the
improvement in the domestic security situation and on regional political stability, although even with such
improvement structural issues facing the Lebanese economy will continue to threaten sustainable growth unless
serious reforms are undertaken. Within this backdrop, we do not expect to see a marked improvement in operating
environment for banks beyond growth in the low to mid-single digits at the bottom line.