learning to coordinate: a study in retail gasoline · pdf filelearning to coordinate: a 1study...
TRANSCRIPT

Learning to Coordinate: A Study in Retail Gasoline1
David P. Byrne Nicolas de Roos U. Melbourne U. Sydney
FTC Microeconomics Conference November 4, 2016
1The views and opinions expressed in our paper and in this talk are strictly those of the authors, and do not necessarily reflect those of the ACCC nor the Western Australian Government.
� Green and Porter (1984):
“It is logically possible for this agreement to be a tacit one
which arises spontaneously. Nevertheless, in view of the
relative complexity of the conduct to be specified by this
particular equilibrium and of the need for close coordination
among its participants, it seems natural to assume here that
the equilibrium arises from an explicit agreement.”
� Green, Marshall and Marx (2015), Ivaldi et al. (2003):� the implementation of collusive agreements, both tacit and
explicit, has been explored extensively� the issue of how collusion is initiated has largely been
abstracted from, or presumed to be explicit
Research question
� How is collusion initiated?
2 / 29

Green, Marshall and Marx (2015), Ivaldi et al. (2003):� the implementation of collusive agreements, both tacit and
explicit, has been explored extensively� the issue of how collusion is initiated has largely been
abstracted from, or presumed to be explicit
�
�
�
Research question
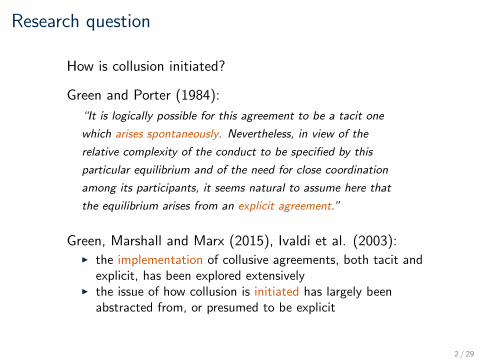
How is collusion initiated?
Green and Porter (1984): “It is logically possible for this agreement to be a tacit one
which arises spontaneously. Nevertheless, in view of the
relative complexity of the conduct to be specified by this
particular equilibrium and of the need for close coordination
among its participants, it seems natural to assume here that
the equilibrium arises from an explicit agreement.”
2 / 29
�
�
�
Research question
How is collusion initiated?
Green and Porter (1984): “It is logically possible for this agreement to be a tacit one
which arises spontaneously. Nevertheless, in view of the
relative complexity of the conduct to be specified by this
particular equilibrium and of the need for close coordination
among its participants, it seems natural to assume here that
the equilibrium arises from an explicit agreement.”
Green, Marshall and Marx (2015), Ivaldi et al. (2003): � the implementation of collusive agreements, both tacit and
explicit, has been explored extensively � the issue of how collusion is initiated has largely been
abstracted from, or presumed to be explicit
2 / 29

�
�
�
This paper
We empirically study the tacit initiation of a collusive pricing structure
Context and data: urban retail gasoline market where we have the universe of daily station-level retail prices for 15 years
Our analysis of the evolution of pricing and conduct reveals 3 interconnected mechanisms for initiating collusion tacitly:
� price leadership � focal points � experimentation
3 / 29

�
�
�
Related literature
Ex-post case studies of known cartels and explicit collusion � Clark and Houde (2013), Asker (2010), Wang (2008), Genesove and
Mullin (2001), Roller and Steen (2006), Levenstein and Suslow (2006), Pesendorfer (2000), Ellison (1994), Porter and Zona (1993), Porter (1983)
Empirical studies of tacit collusion and coordinated effects � Miller and Weinberg (2016) (mergers), Lewis (2015) and Knittel
and Stango (focal points), Lewis (2012) and Wang (2009) (price leadership), Ciliberto and Williams (2014) and Busse (2000) (multi-market contact), Borenstein and Shepard (1996) and Slade (1992) (demand fluctuations, price wars)
Learning and coordination dynamics in oligopoly � lab: Huck et al. (1999), Offerman et al. (2002), Apesteguia et al.
(2007), Friedman et. al (2015) � field: Doraszelski, Lewis and Pakes (2016), Yang (2016)
4 / 29

Roadmap
1. Overview of the context and data
2. 15 years of retail pricing � 2001-2009: (comparatively) competitive pricing � 2010-today: tacit collusion
3. Mechanisms for initiating tacit collusion � price leadership, focal points, experimentation
4. Collusive outcomes � price-cost margins, price stability, conflict resolution
5. Summary, policy implications
5 / 29

�
�
�
�
Context and Data Context
Retail gasoline market of Perth, Australia � 1.7 million people, 472 gasoline stations � 4 major retailers: BP, Caltex, Coles, Woolworths
� station shares: 22%, 16%, 16%, 13% � prices centrally set by the major retailers
shares stable from 2004-2015
Price transparency policy - Fuelwatch � price reporting website
24-hour rule
6 / 29

In sum, the data and environment are characterized by� simultaneous price setting� perfect monitoring of rivals’ current and past actions� common daily cost shocks
Context aligns well with standard repeated games frameworkfor collusion (Friedman 1977)
�
�
�
�
Context and Data Data
Universe of station-level daily prices for 15 years � 3 January 2001 - 31 December 2015 � ≈1.8 million station-date observations
Marginal cost: terminal gate price (TGP)
7 / 29
�
�
�
�
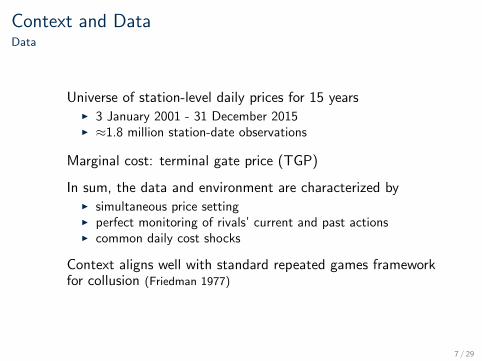
Context and Data Data
Universe of station-level daily prices for 15 years � 3 January 2001 - 31 December 2015 � ≈1.8 million station-date observations
Marginal cost: terminal gate price (TGP)
In sum, the data and environment are characterized by � simultaneous price setting � perfect monitoring of rivals’ current and past actions � common daily cost shocks
Context aligns well with standard repeated games framework for collusion (Friedman 1977)
7 / 29

Context and Data Retail pricing
120
130
140
150
Ret
ail P
rice
(cpl
)
01jan2011 01feb2011 01mar2011 01apr2011Month
BP Caltex Woolworths Coles TGP
8 / 29
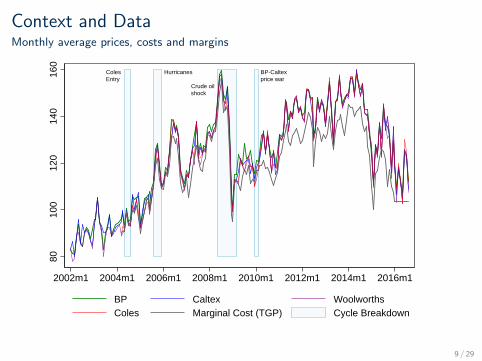
Context and Data Monthly average prices, costs and margins
ColesEntry
Hurricanes
Crude oilshock
BP-Caltexprice war
8010
012
014
016
0
2002m1 2004m1 2006m1 2008m1 2010m1 2012m1 2014m1 2016m1
BP Caltex Woolworths Coles Marginal Cost (TGP) Cycle Breakdown
9 / 29

�
15 Years of Retail Pricing
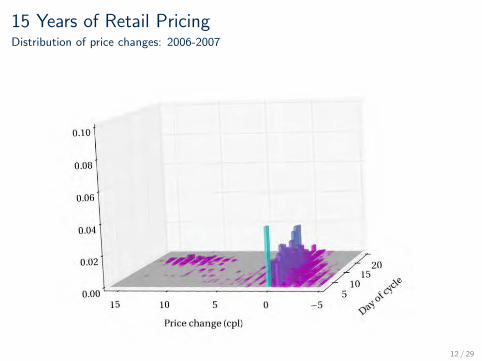
To study the evolution of pricing, it is helpful breakdown price cycles into two components
� price jumps � price cuts
10 / 29

120
130
140
150
Ret
ail P
rice
(cpl
)
01jan2011 01feb2011 01mar2011 01apr2011Month
BP Caltex Woolworths Coles TGP
Price jumps, cycle restarts“Day 1 of the cycle”
15 Years of Retail Pricing Defining price jumps, cuts and cycle length
11 / 29

120
130
140
150
Ret
ail P
rice
(cpl
)
01jan2011 01feb2011 01mar2011 01apr2011Month
BP Caltex Woolworths Coles TGP
Price cuts“Days 2,3,4,… of the cycle”
15 Years of Retail Pricing Defining price jumps, cuts and cycle length
11 / 29

0.10
0.08
0.06
0.04
0.02
0.00 15 10 5
Price change (cpl)
15 Years of Retail Pricing Distribution of price changes: 2001-2003
12 / 29
0.10
0.08
0.06
0.04
0.02
0.00 15 10 5
Price change (cpl)
15 Years of Retail Pricing Distribution of price changes: 2006-2007
12 / 29

0.10
0.08
0.06
0.04
0.02
0.00 15 10 5
Price change (cpl)
15 Years of Retail Pricing Distribution of price changes: 2009-2015
12 / 29

15 Years of Retail Pricing Inter-temporal variation in price cuts
-7-6
-5-4
-3-2
-10
12
34
5M
ean
Pric
e C
hang
e
01jan2000 01jan2005 01jan2010 01jan2015Date
Cycle Day 2 Cycle Day 3 Cycle Day 4 Cycle Day 5 Cycle Day 6 Cycle Day 7
13 / 29
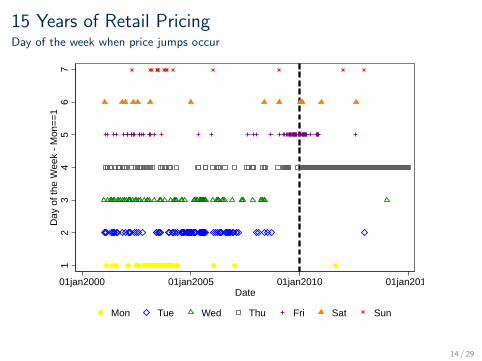
15 Years of Retail Pricing Day of the week when price jumps occur
12
34
56
7D
ay o
f the
Wee
k - M
on==
1
01jan2000 01jan2005 01jan2010 01jan2015Date
Mon Tue Wed Thu Fri Sat Sun
14 / 29

15 Years of Retail Pricing Inter-temporal variation in cycle length
05
1015
2025
Ret
ail P
rice
(cpl
)
2000m1 2002m1 2004m1 2006m1 2008m1 2010m1 2012m1 2014m1 2016m1Month
BP Caltex Woolworths Coles
15 / 29

�
�
15 Years of Retail Pricing Summary
In summary, starting in 2010 we observe � Emergence of 2 focal points
� 2 cpl daily price cuts � Thursday price jumps
� ≈ 75% increase in profit margins
This tacitly collusive pricing structure took a long time to emerge - 10 years!
� despite perfect observability/monitoring of own and rivals’ daily prices and price history
16 / 29

�
�
Initiating Tacit Price Coordination Overview
How was tacit collusion initiated?
Analysis consists of 4 parts 1. Aggregate shocks and price leadership (2004, 2006, 2009) 2. Price war (2009-10) 3. Price leadership and experimentation used to establish the
focal points (2009-12) 4. Collusive outcomes: price-cost margins, price stability, conflict
resolution
17 / 29

Aggregate Shocks and Price Leadership Global Crude Oil Price Shock
010
2030
4050
6070
Num
ber o
f Sta
tions
Lea
ding
Pric
e Ju
mps
8010
012
014
016
0Av
g. R
etai
l Pric
e Ac
ross
Sta
tions
, TG
P
01jan2008 01apr2008 01jul2008 01oct2008 01jan2009 01apr2009Date
BP Price BP Leaders Caltex Price Caltex Leaders Woolworths Price Woolworths Leaders Coles Price Coles Leaders Marginal Cost (TGP) Global Crude Price Shock
18 / 29

Price War Pre-cursor to the new pricing structure
100
120
140
Pric
es/T
GP
(CPL
)
01apr2009 01may2009 01jun2009 01jul2009Date
BP Caltex Marginal Cost (TGP)
19 / 29

Price War Pre-cursor to the new pricing structure
Caltex first defectson price jumps
BP-Caltex Price war starts10
012
014
0Pr
ices
/TG
P (C
PL)
01jul2009 01aug2009 01sep2009 01oct2009Date
BP Caltex Marginal Cost (TGP)
19 / 29
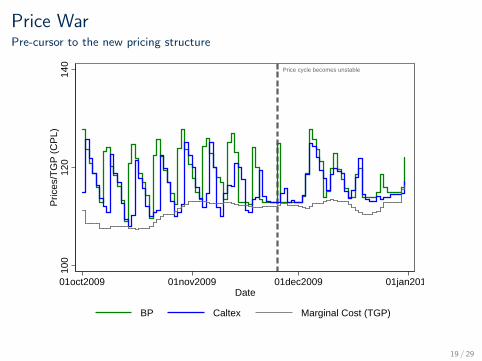
Price War Pre-cursor to the new pricing structure
Price cycle becomes unstable10
012
014
0Pr
ices
/TG
P (C
PL)
01oct2009 01nov2009 01dec2009 01jan2010Date
BP Caltex Marginal Cost (TGP)
19 / 29

Price War Pre-cursor to the new pricing structure
BP-Caltex price war ends,Stable price cycle re-established
100
120
140
Pric
es/T
GP
(CPL
)
01jan2010 01feb2010 01mar2010 01apr2010Date
BP Caltex Marginal Cost (TGP)
19 / 29

Focal point #1: Thursday price jumps 2011: BP price leadership with price jumps
010
2030
4050
Num
ber o
f Sta
tions
with
Pric
e Ju
mps
(dp>
6 cp
l)
01jan2011 08jan2011 15jan2011 22jan2011 29jan2011Date
BP Caltex Woolworths Coles BP Price Leadership
20 / 29
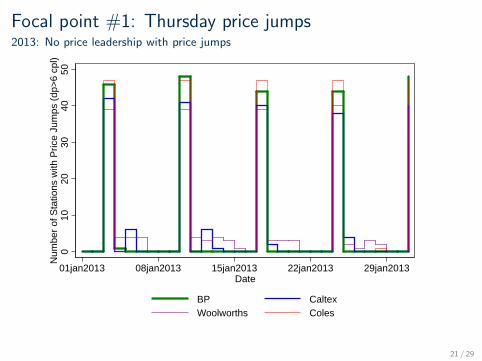
Focal point #1: Thursday price jumps 2013: No price leadership with price jumps
010
2030
4050
Num
ber o
f Sta
tions
with
Pric
e Ju
mps
(dp>
6 cp
l)
01jan2013 08jan2013 15jan2013 22jan2013 29jan2013Date
BP Caltex Woolworths Coles
21 / 29

Focal point #1: Thursday price jumps Stations’ propensities to engage in Thursday Price jumps (BP)
BP re-initiates cycleafter 2008-09 collapse
BP stops leadingcycles on Weds
0.2
.4.6
.81
% o
f Sta
tions
Eng
agin
g in
Pric
e Ju
mp
2000m1 2005m1 2010m1 2015m1Date
Mon Tue Wed Thu Fri Sat Sun
22 / 29

Focal point #1: Thursday price jumps Stations’ propensities to engage in Thursday Price jumps (Caltex)
0.2
.4.6
.81
% o
f Sta
tions
Eng
agin
g in
Pric
e Ju
mp
2000m1 2005m1 2010m1 2015m1Date
Mon Tue Wed Thu Fri Sat Sun
22 / 29

Focal point #1: Thursday price jumps Stations’ propensities to engage in Thursday Price jumps (Woolworths)
0.2
.4.6
.81
% o
f Sta
tions
Eng
agin
g in
Pric
e Ju
mp
2000m1 2005m1 2010m1 2015m1Date
Mon Tue Wed Thu Fri Sat Sun
22 / 29

Focal point #1: Thursday price jumps Stations’ propensities to engage in Thursday Price jumps (Coles)
0.2
.4.6
.81
% o
f Sta
tions
Eng
agin
g in
Pric
e Ju
mp
2004m1 2006m1 2008m1 2010m1 2012m1 2014m1 2016m1Date
Mon Tue Wed Thu Fri Sat Sun
22 / 29

Focal point #1: Thursday price jumps Stations’ propensities to engage in Thursday Price jumps (Gull)
0.2
.4.6
.81
% o
f Sta
tions
Eng
agin
g in
Pric
e Ju
mp
2000m1 2005m1 2010m1 2015m1Date
Mon Tue Wed Thu Fri Sat Sun
22 / 29

Focal point #1: Thursday price jumps Zoomed in: Wednesday price jumps, all firms, start of 2010
Gap 1
Gap 2
010
2030
4050
Num
ber o
f Sta
tions
with
Wed
Pric
e Ju
mp
2009w13 2009w40 2010w13 2010w40Date
BP Caltex Woolworths Coles BP Leadership BP Experiment BP-Caltex Conflict Period
23 / 29

Focal point #1: Thursday price jumps Zoomed in: Thursday price jumps, all firms, start of 2010
Gap 1 Gap 2
010
2030
4050
Num
ber o
f Sta
tions
with
Thu
r Pric
e Ju
mp
2009w13 2009w40 2010w13 2010w40Date
BP Caltex Woolworths Coles BP Leadership BP Experiment BP-Caltex Conflict Period
24 / 29

Focal point #1: Thursday price jumps BP price leadership and experiments
Gap 1Gap 2
BP Price Leadership Ends0
1020
3040
50N
umbe
r of S
tatio
ns L
eadi
ng P
rice
Jum
p
01jan2009 01jan2010 01jan2011 01jan2012 01jan2013Date
BP Caltex Woolworths Coles BP Leadership BP Experiment
25 / 29

Focal point #1: Thursday price jumps BP price leadership and experiments
Gap 1Gap 2
BP Price Leadership Ends0
1020
3040
50N
umbe
r of S
tatio
ns L
eadi
ng P
rice
Jum
p
01jan2009 01jan2010 01jan2011 01jan2012 01jan2013Date
BP Caltex Woolworths Coles BP Leadership BP Experiment
25 / 29

Focal point #1: Thursday price jumps BP price leadership and experiments
Gap 1Gap 2
BP Price Leadership Ends0
1020
3040
50N
umbe
r of S
tatio
ns L
eadi
ng P
rice
Jum
p
01jan2009 01jan2010 01jan2011 01jan2012 01jan2013Date
BP Caltex Woolworths Coles BP Leadership BP Experiment
25 / 29

Focal point #2: 2 cpl price cuts Stations’ propensities to set 2 cpl price cuts
0.2
.4.6
.81
Frac
tion
of S
tatio
ns w
ith P
rice
Cut
of 2
CPL
2009m1 2010m1 2011m1 2012m1 2013m1 2014m1 2015m1Month
BP Caltex Woolworths Coles Gull BP-Caltex Conflict Period
26 / 29
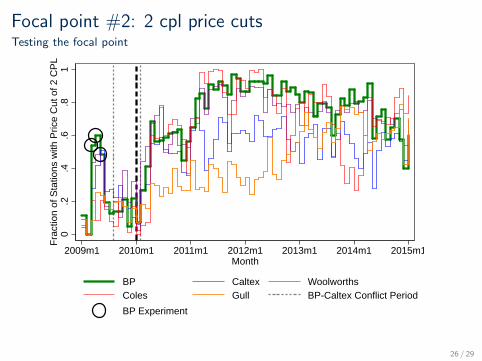
Focal point #2: 2 cpl price cuts Testing the focal point
0.2
.4.6
.81
Frac
tion
of S
tatio
ns w
ith P
rice
Cut
of 2
CPL
2009m1 2010m1 2011m1 2012m1 2013m1 2014m1 2015m1Month
BP Caltex Woolworths Coles Gull BP-Caltex Conflict Period BP Experiment
26 / 29
�
�
�
�
�
Summary
How is collusion initiated?
We found price leaders can establish focal points that facilitate tacit price coordination
Evidence points to experimentation is an important mechanism for initiating tacit collusion
� testing firms’ willingness to coordinate on focal pricing rules � communicating intentions to coordinate � creating common knowledge regarding collusive pricing
strategy
Price leadership and experimentation, not punishment, was used to resolved conflict
Collusive outcomes: enhanced margins, price stability, improved conflict resolution
27 / 29

�
�
�
Discussion Academic relevance
Empirics speak to earlier (e.g., pre-repeated games) theories of tacit collusion
� price leadership: Bain (1968) � focal points: Schelling (1960), Scherer (1967)
Findings point to recent theories of communication, experimentation, and learning in games as frameworks for collusion initiation (Crawford 2016; Fudenberg and Levine 2016)
Despite perfect monitoring of rivals’ behavior... � a relatively simple tacitly collusive pricing structure was
implemented � and it took 10 years for the pricing structure to emerge
28 / 29

�
�
Discussion Policy implications
Results point to 2 aspects of market structure that can potentially facilitate coordinated effects
� firm size asymmetry � price transparency policies
Using rich price data (e.g., long panel data at high frequency) to detect collusion at the initiation stage
29 / 29