learning factor models of students at risk of failing in ... factor models of students at risk of...
TRANSCRIPT

(2016).Learningfactormodelsofstudentsatriskoffailingintheearlystageoftertiaryeducation.JournalofLearningAnalytics,3(2),330–372.
http://dx.doi.org/10.18608/jla.2016.32.20
ISSN1929-7750(online).TheJournalofLearningAnalyticsworksunderaCreativeCommonsLicense,Attribution-NonCommercial-NoDerivs3.0Unported(CCBY-NC-ND3.0) 330
Learning Factor Models of Students at Risk of Failing in the Early Stage of Tertiary Education
GeraldineGray
ColmMcGuinness
PhilipOwende
MarkusHofmann
InstituteofTechnologyBlanchardstown,[email protected]
ABSTRACT: This paper reports on a study to predict students at risk of failing based on dataavailablepriortocommencementoffirstyear.Thestudywasconductedoverthreeyears,2010to 2012, on a student population from a range of academic disciplines, n=1,207. Data wasgatheredfrombothstudentenrollmentdataandanonline,self-reporting,learner-profilingtooladministered during first-year student induction. Factors considered included prior academicperformance, personality, motivation, self-regulation, learning approaches, age, and gender.Modelsweretrainedondatafromthe2010and2011studentcohort,andtestedondatafromthe 2012 student cohort. A comparison of eight classification algorithms foundk-NN achievedbest model accuracy (72%), but results from other models were similar, including ensembles(71%), support vector machine (70%), and a decision tree (70%). However, improvements inmodelaccuracyattributabletonon-cognitivefactorswerenotsignificant.Modelsofsubgroupsby age and discipline achieved higher accuracies, but were affected by sample size; n<900underrepresentedpatterns in thedataset.Factorsmostpredictiveofacademicperformance infirst year of study at tertiary education included age, prior academic performance, and self-efficacy. Early modelling of first-year students yielded informative, generalizable models thatidentifiedstudentsatriskoffailing.
Keywords:Learninganalytics, learnerprofiling,academicperformance,non-cognitivefactorsoflearning,tertiaryeducation
1 INTRODUCTION
Enrollmentnumbers to tertiaryeducationare increasing,as isdiversity in studentpopulations (OECD,
2013;Patterson,Carroll,&Harvey,2014);however,significantnumbersofstudentsdonotcompletethe
courses inwhich theyenroll,particularlycourseswith lowerentry requirements (ACT,2012;Mooney,
Patterson, O’Connor, & Chantler, 2010). Factors predictive of academic performance have been the
focusofresearchformanyyears(Farsides&Woodfield,2003;Moran&Crowley,1979),andcontinueas
an active research topic (Jayaprakash, Moody, Lauria, Regan, & Baron 2014; Cassidy, 2011; Wise &
Shaffer,2015), indicating the inherentdifficulty ingeneratingaccurate learning factormodels (Knight,
BuckinghamShum,&Littleton,2013;Tempelaar,Cuypers,vandeVrie,Heck,&vanderKooij,2013).
(2016).Learningfactormodelsofstudentsatriskoffailingintheearlystageoftertiaryeducation.JournalofLearningAnalytics,3(2),330–372.
http://dx.doi.org/10.18608/jla.2016.32.20
ISSN1929-7750(online).TheJournalofLearningAnalyticsworksunderaCreativeCommonsLicense,Attribution-NonCommercial-NoDerivs3.0Unported(CCBY-NC-ND3.0) 331
Tertiary education providers collect much data on students, including demographic data, academic
activity, and log data from online campus activities. As a result, the application of data analytics to
educationalsettingsisanemergingandgrowingresearchdisciplineofdataanalytics(Campbell,deBlois,
& Oblinger, 2007;Mirriahi, Gašević, Long, & Dawson, 2014; Sachin & Vijay, 2012; Siemens & Baker,
2012). The primary aim of learning analytics is to provide learning professionals, and students, with
actionable information that can be used to enhance the learning process (Siemens, 2012; Chatti,
Dyckhoff,Schroeder,&Thüs,2012).Muchofthepublishedworkinlearninganalytics isbasedondata
systematicallygatheredbyeducationproviders,particularlylogdatafromVirtualLearningEnvironments
(VLE) and Intelligent Tutoring Systems (ITS) (Drachsler & Greller, 2012; Baker & Yacef, 2010).
Measurementandanalysisofnon-cognitivefactorsof learninghasreceivedlimitedattentionfromthe
learning analytics community (Buckingham Shum&Deakin Crick, 2012)with the exception of factors
inferredfromonlinebehaviour(e.g.,Ali,Hatala,Gašević,&Winne,2014;Arnold&Pistilli,2012;Shute&
Ventura, 2013). In contrast, many publications emanating from educational psychology report on
correlationswith,ordependencieson,awidevarietyofnon-cognitivepsychometricfactorsoflearning
andacademicperformance(Dekker,Pechenizkiy,&Vleeshouwers,2009;Herzog,2006;Robbins,Lauver,
Le,Davis,&Langley,2004).Therefore,furtherworkisneededtodeterminethevalueofnon-cognitive
factorsinmodelsoflearningoverandabovetheanalysisofdatasystematicallygatheredbyeducation
providers.
Early identification and profiling of students at risk of failing informs provisioning of supports and
modificationstolearningenvironmentstoenableallstudentsperformoptimally.Colby(2005)identified
week twoas a critical point in identifying at-risk students.Arnold andPistilli (2012) reportedpositive
results identifying at-risk students in week two based on interactions with a VLE, prior academic
performance, and demographic data. Similarly, Milne, Jeffrey, Suddaby, and Higgins (2012) reported
successfulresultsinpredictingstudentsatriskoffailingbasedonanalysisofonlinebehaviourinweek
one, while early results reported in Gray, McGuinness, and Owende (2014) suggested non-cognitive
factorsoflearningmeasuredduringstudentinductioncouldalsoachievegoodpredictiveaccuracy.
Theobjectiveofthisstudywastoinvestigateiffactorsoflearning,measuredpriortocommencementof
firstyear,couldaccuratelypredictstudentsatriskoffailingattheendofyearoneoftertiaryeducation.
Thedatausedcoveredadiversestudentpopulationenrolledinarangeofacademiccourses.
2 FACTORS OF LEARNING
Researchfromeducationalpsychologyhas identifiedarangeoffactorsrelateddirectlyor indirectlyto
academicperformance in tertiaryeducation. Inparticular, factorsofprioracademicperformance,and
non-cognitivefactorsofpersonality,motivation,self-regulation,andapproachestolearningarecitedas
predictive of first-yearGPA (Cassidy, 2011; Chamorro-Premuzic& Furnham, 2008; Gray,McGuinness,
Owende,&Carthy,2014;Komarraju&Nadler,2013;Robbinsetal.,2004;Swanberg&Martinsen,2010).
In addition, a number of non-cognitive factors of learning have been associated with an effective
learningdisposition, includingadeep learningapproach,ability toself-regulate,setting learninggoals,
(2016).Learningfactormodelsofstudentsatriskoffailingintheearlystageoftertiaryeducation.JournalofLearningAnalytics,3(2),330–372.
http://dx.doi.org/10.18608/jla.2016.32.20
ISSN1929-7750(online).TheJournalofLearningAnalyticsworksunderaCreativeCommonsLicense,Attribution-NonCommercial-NoDerivs3.0Unported(CCBY-NC-ND3.0) 332
persistence, conscientiousness, and sub-factors of openness, namely intellectual curiosity, creativity,
and open-mindedness (Buckingham Shum& Deakin Crick, 2012; Knight et al., 2013; Tishman, Jay, &
Perkins,1993).
Prioracademicperformancecanrefertohighschoolgradepointaverage(HSGPA)orequivalent,and/or
standardized tests such as American College Testing (ACT) scores or Scholastic Aptitude Test (SAT)
scores. Correlations (r) between prior academic performance and academic performance in tertiary
educationareconsistentandrelativelystrongacrossstudiesofyoungercollegestudents.Forexample,a
meta-analysisof109studiesconductedbyRobbinsetal.(2004)foundamoderatecorrelationbetween
academic performance and HSGPA (r=0.448, 90% CI [0.41, 0.49]). However, Eppler and Harju (1997)
foundthatcorrelationsbetweenacademicperformanceandSATscoreswerenotasstrongformature
students1(r=0.09,90%CI*[-0.15,0.32],n=50).
There is broad agreement that conscientiousness is the best personality-based predictor of academic
performance(Swanberg&Martinsen,2010).Forexample,Komarraju,Karau,Schmeck,andAvdic(2011)
reported a correlation of r=0.29 (p<0.01, 90% CI* [0.2, 0.37], n=308) between conscientiousness and
academic performance. Some studies have also cited openness as significant; however, reported
correlations with academic performance are less consistent (Gray, McGuinness, Owende, & Carthy,
2014). For example, Komarraju et al. (2011) reported a correlation of r=0.13 (p<0.05, 90% CI* [0.04,
0.22],n=308)betweenopennessandGPA,whileKappeandvanderFlier(2010)reportedacorrelation
ofr=-0.08(90%CI*[-0.22,0.06],n=133).Differencesmaybeexplainedbyassessmentmethods,asopen
personalities tend todobetterwhenassessmentmethodsareunconstrainedbysubmission rulesand
deadlines(Kappe&vanderFlier,2010).
Motivation to learn is characterized by a range of complementary theories (Steel & Konig, 2006). A
meta-analysis of 109 studies analyzing psychosocial and study skill traits found two factors of
motivation, namely self-efficacy (r=0.495, 90% CI [0.44, 0.55]) and achievementmotivation (r=0.303,
90% CI [0.26, 0.34]), had the highest correlationswith academic performance (Robbins et al., 2004).
Achievementmotivationmayreflectagoaltosucceedoradesiretoavoidfailure(Elliot&Harackiewicz,
1996). Achievement goals in turn can be assessed with respect to learning (intrinsic) achievement
and/or performance (extrinsic) achievement (Eppler&Harju, 1997). Studies have found that learning
goalshaveahighercorrelationwithacademicperformancethanperformancegoals(Gray,McGuinness,
Owende, & Carthy, 2014). For example, Eppler and Harju (1997) reported a correlation of r=0.3
(p<0.001, 90% CI* [0.19, 0.4], n=212) for learning goals and r=0.13 (p=0.059, 90% CI* [0.02, 0.24],
n=212)forperformancegoals.Covington(2000)arguedgoalsettinginitselfwasnotenough,asability
to self-regulate learning can be the difference between achieving, or not achieving, the goals set.
However,KomarrajuandNadler(2013)foundthatself-regulation(monitoringandevaluatinglearning)
1CI*denotesconfidenceintervalswerenotprovidedbytheauthor,andwerecalculatedinRversion3.0.2usingCIrinpackagepsychometric,whichcalculatesconfidenceintervalsbasedontheFisherr-to-ztransformation.
(2016).Learningfactormodelsofstudentsatriskoffailingintheearlystageoftertiaryeducation.JournalofLearningAnalytics,3(2),330–372.
http://dx.doi.org/10.18608/jla.2016.32.20
ISSN1929-7750(online).TheJournalofLearningAnalyticsworksunderaCreativeCommonsLicense,Attribution-NonCommercial-NoDerivs3.0Unported(CCBY-NC-ND3.0) 333
didnotaccountforanyadditionalvarianceinacademicperformanceoverandaboveself-efficacy,but
studyeffortandstudytimedidaccountforadditionalvariance.
A number of studies reported the relationship between academic performance and temperament or
motivation was mediated by approach to learning task (Bruinsma, 2004; Chamorro-Premuzic &
Furnham,2008;Diseth,2011;Sins,vanJoolingen,Savelsbergh,&vanHout-Wolters,2008).Martonand
Säljö(2005)classifiedastudent’sapproachtolearningaseithershallowordeep.Deeplearnersaimto
understand content, while shallow learners aim to memorize content regardless of their level of
understanding.Laterstudiesaddedstrategic learners (Entwhistle,2005,p.19),whosepriority is todo
well, and will adopt either a shallow or a deep learning approach depending on the requisites for
academic success. Comparing the influence of approaches to learning on academic performance,
Cassidy(2011)foundcorrelationswithGPAweresimilarforboththestrategic(r=0.32,p<0.01,90%CI*
[0.16, 0.46], n=97) and the deep (r=0.31, p<0.01, 90% CI* [0.15, 0.45], n=97) learning approach.
However, Chamorro-Premuzic and Furnham (2008) found a deep learning approach (r=0.31, p<0.01,
90%CI[0.19,0.42],n=158)hadahighercorrelationwithGPAthanastrategiclearningapproach(r=0.18,
p<0.05,90%CI*[0.05,0.3],n=158).Differencesfoundhavebeenexplained,inpart,byassessmenttype
(Volet, 1996), highlighting the importance of assessment design in encouraging effective learning
strategies.
As evidenced by results cited in this section, statistical models have dominated data analysis in
educational psychology (Dekker et al., 2009), particularly Pearson correlation and linear regression.
There is evidence to suggest that assumptions for Pearson correlation and linear regression are not
alwaysmet when analyzing non-cognitive factors of learning (Gray,McGuinness, Owende, & Carthy,
2014).Therefore,itispertinenttoaskifdatamining’sempiricalmodellingapproachismoreappropriate
formodelsoflearning.Agrowingnumberoflearninganalyticsstudieshasinvestigatedtheroleofnon-
cognitivefactorsinmodelsoflearning(Arnold&Pistilli,2012;BuckinghamShum&DeakinCrick,2012;
Shute&Ventura,2013).Forexample,Bergin(2006)citedanaccuracyof82%usinganensemblemodel
predicting a strong (grade>55%) or weak (grade<55%) performance based on prior academic
performance,self-efficacy,andstudyhours(n=58).Gray,McGuinness,andOwende(2013)citedsimilar
accuracies(81%,n=350)withaSupportVectorMachinemodelusingcognitiveandnon-cognitivefactors
oflearningtodistinguishhigh-risk(GPA<2.0)fromlow-risk(GPA≥2.5)studentsbasedonfirst-yearGPA.
3 THE STUDY DATASET
3.1 Description of Study Participants
The study participants were first-year students at the Institute of Technology Blanchardstown (ITB),
Ireland.TheadmissionpolicyatITBsupportstheintegrationofadiversestudentpopulationintermsof
ageandsocio-economicbackground.Courseentryrequirementsaregenerallylowerthancorresponding
universitycourses(Mooneyetal.,2010).
(2016).Learningfactormodelsofstudentsatriskoffailingintheearlystageoftertiaryeducation.JournalofLearningAnalytics,3(2),330–372.
http://dx.doi.org/10.18608/jla.2016.32.20
ISSN1929-7750(online).TheJournalofLearningAnalyticsworksunderaCreativeCommonsLicense,Attribution-NonCommercial-NoDerivs3.0Unported(CCBY-NC-ND3.0) 334
EachSeptemberfrom2010to2012,allfull-time,first-yearstudentsatITBwereinvitedtoparticipatein
the study by completing learner profiling administered during first-year student induction. A total of
1,365 (52%) full-time, first-year students completed the profiling. Eliminating invalid student ID’s
(n=100),thosewhodidnotgivepermissiontobeincludedinthestudy(n=35),studentsundertheageof
18atthetimeofprofiling(n=3),andinstancesmissingprofilingdata(n=20)resultedin46%offull-time,
first-yearstudentsparticipatinginthestudy(n=1,207).
Participantsrangedinagefrom18to60,withameanageof23.27(standarddeviation,s=7.3);ofwhich
355 (29%) studentsweremature (23 and over2), 713 (59%)weremale, and 494 (41%)were female.
Studentswere enrolled in a range of courses in the disciplines of Business (n=402, 33%), Humanities
(n=353,29%),InformationTechnology(n=239,20%),Engineering(n=172,14%),andHorticulture(n=41,
3%).
3.2 Study Factors and Instruments Used
Thestudydatasetincludeddatafromthreesources:1)studentregistration;2)non-cognitivefactorsof
learningmeasuredduring first-year induction;and3)examresults from the first yearof studyat ITB,
suppliedbythecollege.Studyfactorsareinitalicsinfollowingsections.
3.2.1 Student registration data Registration data included age, gender, and prior academic performance. Access to full-time college
courses in Ireland isbasedonacademicperformance inthe leavingcertificate(orequivalent),asetof
stateexamsat theendof secondary school. The leaving certificate includes fourmandatory subjects,
namelymathematics, English,3 Irish, anda foreign language, and typically anadditional threeelective
subjects.Subjectscanbestudiedathigherorordinarylevel;mathematicsandIrisharealsoofferedat
the foundation level. College places are offered based on CAO4 points, an aggregate score based on
points achieved in a student’s best six leaving certificate subjects (range [0,600]). Table 12 in the
Appendix maps exam grades to CAO points for higher level, ordinary level, and foundation level
examinations.CAOpointsareawardedformarks≥40%.
Thestudydataset includedCAOpoints,points inmathematics,andpoints inEnglish foreachstudent.
Pointsachievedinadditionalsubjects(53intotal)wereincludedasaveragepointsachievedbysubject
category.TheDepartmentofEducationinIrelandgroupsleavingcertificatesubjectsintosixcategories
2Thisisastate-widedefinitionofamaturestudent;theirentryrequirementsarelessstrict.
3TheLeavingCertificateEnglishsyllabusaimstodevelopamatureandcriticalliteracy,arespectandappreciationforlanguage,andanawarenessofthevalueofliterature(www.education.ie).
4CAOreferstotheCentralApplicationsOfficewithresponsibilityforprocessingapplicationsforundergraduatecoursesintheHigherEducationInstitutesinIreland.
(2016).Learningfactormodelsofstudentsatriskoffailingintheearlystageoftertiaryeducation.JournalofLearningAnalytics,3(2),330–372.
http://dx.doi.org/10.18608/jla.2016.32.20
ISSN1929-7750(online).TheJournalofLearningAnalyticsworksunderaCreativeCommonsLicense,Attribution-NonCommercial-NoDerivs3.0Unported(CCBY-NC-ND3.0) 335
based on subject content, namely humanities, social, artistic, practical, science, and business.5 These
were combined to create three categories as follows: applied (artistic and practical categories);
humanities(humanitiesandsocialcategories);andmethodical(scienceandbusinesscategories).Table1
lists subjects included in each category. Many science and business subjects are numerate based;
however, the two most popular electives in the methodical category did not have a significant
mathematics component, namelyBiology (51%of students) andBusiness (48%of students). Electives
from thehumanities categorywere themost popular; for example, 56% studiedGeography and51%
studiedFrench.Allsubjectsintheappliedcategoryhadasignificantpracticalcomponent;however,43%
ofparticipantsdidnothaveagradeforthiscategoryofelectives,limitingitsusefulness.
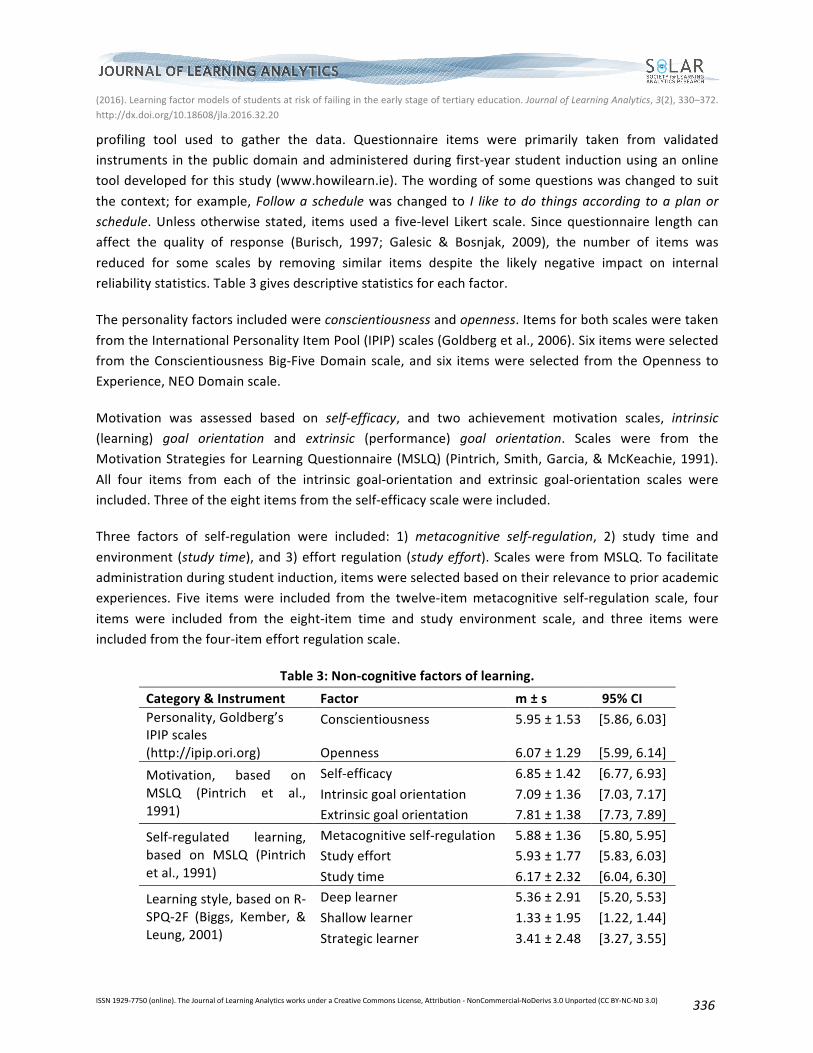
Descriptive statistics for study factors of prior academic performance in Table 2 confirmed a student
populationwithaweakerprioracademicprofilecomparedtouniversitystudentsasreportedinMooney
etal.(2010).Ofparticularnotewasthelowaveragepointsinmathematics(mean,m=23.8,equivalent
to55%–59%inanordinarylevelpaper),whichwassignificantlylowerthanallothersubjectareas.
Table1:Leavingcertificatesubjectcategories.
Category Description
Applied Art, Building Construction, Craft Design and Technology, Engineering,Graphic and Tech Design, Music, Music and Musicianship, Drama andTheatreStudies,TechnicalDrawing,Technology,LeavingCertificateLinkModules
Humanities Classical Studies, Economic and Social History, English, Geography,History,HomeEconomics,allLanguages,ReligiousStudies
Methodical Accounting, Agricultural Economics, Agricultural Science, AppliedMathematics, Biology, Business (Organization/Studies), Chemistry,Computer (Science/Studies), Economics, Mathematics, Physics, PhysicswithChemistry,Science/EnvironmentScience
Table2:Leavingcertificatepointsbysubjectcategory(m±s).
Subject AveragePoints SubjectCategory AveragePointsCAOpoints 259.5±78.1(n=1,018) AppliedAverage 48.5±19.5(n=647)English 46.4±18.5(n=1,015) HumanitiesAverage 40.0±14(n=1,016)Mathematics 23.8±13.9(n=1,008) MethodicalAverage 32.1±15.5(n=1,016)ValidrangeforCAOpointsis[0,600].Rangeforsubjectsandsubjectcategoriesis[0,100].Means(m)andstandard deviations (s) were calculated based on the number of participantswho had results in eachcategory,asindicatedby“n”above.
3.2.2 Additional non-cognitive factors gathered The following sections discuss fifteennon-cognitive factors of learning included in the study, and the
5 Details of subject groups can be found at the Department of Education’s National Career Guidance website:www.careersportal.ie
(2016).Learningfactormodelsofstudentsatriskoffailingintheearlystageoftertiaryeducation.JournalofLearningAnalytics,3(2),330–372.
http://dx.doi.org/10.18608/jla.2016.32.20
ISSN1929-7750(online).TheJournalofLearningAnalyticsworksunderaCreativeCommonsLicense,Attribution-NonCommercial-NoDerivs3.0Unported(CCBY-NC-ND3.0) 336
profiling tool used to gather the data. Questionnaire items were primarily taken from validated
instruments inthepublicdomainandadministeredduringfirst-yearstudent inductionusinganonline
tooldevelopedforthisstudy(www.howilearn.ie).Thewordingofsomequestionswaschangedtosuit
the context; forexample,Followa schedulewas changed to I like todo thingsaccording toaplanor
schedule.Unless otherwise stated, itemsused a five-level Likert scale. Sincequestionnaire length can
affect the quality of response (Burisch, 1997; Galesic & Bosnjak, 2009), the number of items was
reduced for some scales by removing similar items despite the likely negative impact on internal
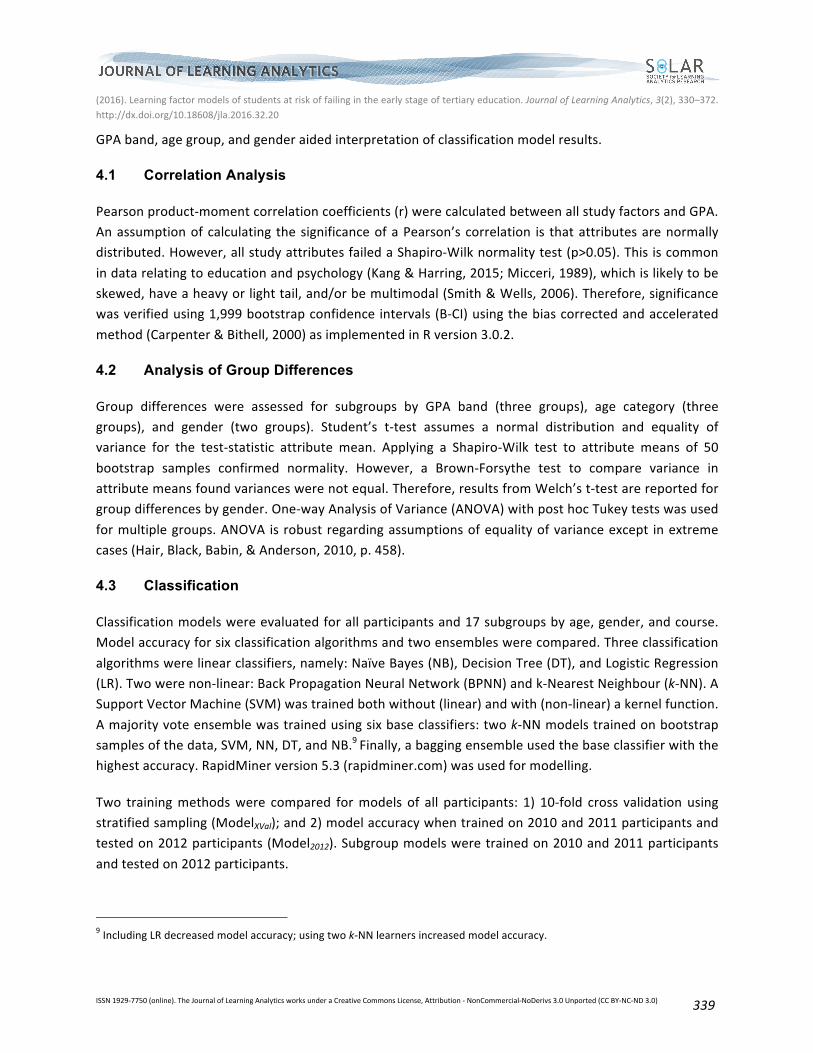
reliabilitystatistics.Table3givesdescriptivestatisticsforeachfactor.
Thepersonalityfactorsincludedwereconscientiousnessandopenness.Itemsforbothscalesweretaken
fromtheInternationalPersonalityItemPool(IPIP)scales(Goldbergetal.,2006).Sixitemswereselected
fromtheConscientiousnessBig-FiveDomainscale,andsix itemswereselected fromtheOpenness to
Experience,NEODomainscale.
Motivation was assessed based on self-efficacy, and two achievement motivation scales, intrinsic
(learning) goal orientation and extrinsic (performance) goal orientation. Scales were from the
MotivationStrategies forLearningQuestionnaire(MSLQ)(Pintrich,Smith,Garcia,&McKeachie,1991).
All four items from each of the intrinsic goal-orientation and extrinsic goal-orientation scales were
included.Threeoftheeightitemsfromtheself-efficacyscalewereincluded.
Three factors of self-regulation were included: 1) metacognitive self-regulation, 2) study time and
environment (studytime),and3)effort regulation (studyeffort).Scaleswere fromMSLQ.To facilitate
administrationduringstudentinduction,itemswereselectedbasedontheirrelevancetoprioracademic
experiences. Five itemswere included from the twelve-itemmetacognitive self-regulation scale, four
items were included from the eight-item time and study environment scale, and three items were
includedfromthefour-itemeffortregulationscale.
Table3:Non-cognitivefactorsoflearning.
Category&Instrument Factor m±s 95%CI
Personality,Goldberg’sIPIPscales(http://ipip.ori.org)
Conscientiousness 5.95±1.53 [5.86,6.03]
Openness 6.07±1.29 [5.99,6.14]
Motivation, based onMSLQ (Pintrich et al.,1991)
Self-efficacy 6.85±1.42 [6.77,6.93]
Intrinsicgoalorientation 7.09±1.36 [7.03,7.17]
Extrinsicgoalorientation 7.81±1.38 [7.73,7.89]
Self-regulated learning,based on MSLQ (Pintrichetal.,1991)
Metacognitiveself-regulation 5.88±1.36 [5.80,5.95]
Studyeffort 5.93±1.77 [5.83,6.03]
Studytime 6.17±2.32 [6.04,6.30]
Learningstyle,basedonR-SPQ-2F (Biggs, Kember, &Leung,2001)
Deeplearner 5.36±2.91 [5.20,5.53]
Shallowlearner 1.33±1.95 [1.22,1.44]
Strategiclearner 3.41±2.48 [3.27,3.55]

(2016).Learningfactormodelsofstudentsatriskoffailingintheearlystageoftertiaryeducation.JournalofLearningAnalytics,3(2),330–372.
http://dx.doi.org/10.18608/jla.2016.32.20
ISSN1929-7750(online).TheJournalofLearningAnalyticsworksunderaCreativeCommonsLicense,Attribution-NonCommercial-NoDerivs3.0Unported(CCBY-NC-ND3.0) 337
Category&Instrument Factor m±s 95%CI
Preferred learningchannel, NLN LearningStylesQuestionnaire.
Visual 7.17±2.06 [7.05,7.28]
Auditory 3.13±2.17 [3.04,3.29]
Kinaesthetic 4.67±2.42 [4.53,4.80]
Preferenceforgroupwork 6.55±3.36 [6.36,6.74]m=mean;s=standarddeviation.Validrangeforeachfactoris[0,10].
LearningapproachwasassessedbasedontheRevisedTwo-FactorStudyProcessQuestionnaire(R-SPQ-
2F)publishedbyBiggsetal. (2001).Thepublishedquestionnaireprovidedseparatescales forshallow
anddeeplearningapproaches. Itemsusedafive-levelLikertscale.Thequestionstylewaschangedfor
thisstudy,forcingparticipantstochoosebetweenadeep,strategic,orshallowlearningapproach.Each
itemonafour-itemscaleaskedparticipantstopickoneofthreestatements:twostatements,relatingto
deep and shallow learning approach, were taken from R-SPQ-2F; the third statement, relating to a
strategic learning approach, was compiled in collaboration with the National Learning Network
AssessmentService6(NLN).Thestyleofquestionmatchedthestyleofitemsonalearning-stylesprofiler
designedbyNLNandusedbyITBinpreviousyears.
InagreementwithNLN,scalesfromtheirlearningstylesquestionnairewerealsoincluded.Thiscovered
learnermodality(Visual,Auditoryand/orKinaesthetic[VAK];Fleming,1995),whichwasscoredfromsix
questions, each offering two choices of modality, resulting in four items permodality across the six
questions.Preferenceforsoloorgroupworkwasalsoasked.
Questionnaire validity and internal reliability were assessed using a paper-based questionnaire that
includedboththerevisedwordingofquestionsusedontheonlinequestionnaire (reducedscale),and
the original questions from the published instruments (original scale). The paper questionnaire was
administeredduringscheduledfirst-yearlecturesacrossallacademicdisciplines.Resultsaredetailedin
Table4.Pearsoncorrelationsbetweenscorescalculatedfromthereducedscale,andscorescalculated
fromtheoriginalscale,werehighforallfactors(≥0.9)except intrinsicgoalorientationandstudytime.
InternalreliabilitywasassessedusingCronbach’sAlpha.Allfactorshadacceptablereliability(>0.7)given
thesmallnumberofquestionsperscale7(between3and6),withtheexceptionagainof intrinsicgoal
orientationandstudytime.Interestingly,KomarrajuandNadler(2013)reportedsimilardifficultieswith
theintrinsicgoalorientationscalewhenadministeredinthefirstweekofterm.Intrinsicgoalorientation
andstudytimewerenotremovedfromthedataset;however,itisacknowledgedthatinferencesbased
onthesefactorsmaybeunreliable.
6TheNationalLearningNetworkAssessmentServiceprovidesfunctionalstrategiesandsupportforchildren,adolescents,andadultswithspecificlearningdifficulties.TheyarelocatedoncampusatITB(www.nln.ie).
7WhilegenerallyaCronbachAlphaof>0.8indicatesgoodinternalconsistency,CronbachAlphacloserto0.7canberegardedasacceptableforscaleswithfeweritems(Tavakol&Dennick,2011).

(2016).Learningfactormodelsofstudentsatriskoffailingintheearlystageoftertiaryeducation.JournalofLearningAnalytics,3(2),330–372.
http://dx.doi.org/10.18608/jla.2016.32.20
ISSN1929-7750(online).TheJournalofLearningAnalyticsworksunderaCreativeCommonsLicense,Attribution-NonCommercial-NoDerivs3.0Unported(CCBY-NC-ND3.0) 338
Table4:Questionnairevalidation:correlationsandCronbach’sAlpha.
ReducedscaleOriginalscale
Correlations betweenoriginal scale and reducedscalescores
PublishedFactor n α items α items αOpenness 47 0.70 6 0.84 10 0.90(95%CI[0.82,0.94]) 0.82Conscientiousness42 0.69 6 0.80 10 0.95(95%CI[0.91,0.97]) 0.79IntrinsicGoals 43 0.63 4 0.53 4 0.81(95%CI[0.68,0.89]) 0.74ExtrinsicGoals 48 0.69 4 0.58 4 0.90(95%CI[0.82,0.94]) 0.62Effort 41 0.69 3 0.74 4 0.98(95%CI[0.96,0.99]) 0.69Self-efficacy 48 0.82 3 0.81 7 0.93(95%CI[0.89,0.97]) 0.94Meta CognitiveSelf-regulation 38 0.70 5 0.70 12 0.90(95%CI[0.81,0.95]) 0.79Timeandstudy 48 0.55 4 0.68 8 0.79(95%CI[0.65,0.87]) 0.76LearningStyle 42 0.76 4
3.2.3 Year 1 academic performance First-year academicperformancewasmeasuredasGradePointAverage (GPA), an aggregate scoreof
between 10 and 12 first-year modules (range [0,4]). GPA is calculated from module grade achieved
multipliedbymoduleweighting(credits).AGPA<2.0,oraresultoffailinanyindividualmodule,results
inanawardofFailoverall,otherwiseastudentisawardedaPassresultandmayprogresstothenext
academic stage. Table 5 shows the academic profile of study participants across GPA bands. Of the
students with GPA≥2.5 (n=558, 46%), 92% passed all modules indicating a low-risk group that can
progress to year two.Of the studentswith GPA<2 (n=432, 36%), 91% failed three ormoremodules,
indicatingahigh-riskgroupfallingwellshortofprogressionrequirements.Fortheremainingstudentsin
theGPAband8[2.0,2.5)(n=217,18%),35%passedallmodules,36%failedonemodule,20%failedtwo
modules,and8%failedmorethantwomodules.Thisisalesshomogenousgroupintermsofacademic
results,butcouldberegardedasstrugglingacademically(medium-risk),eitherpassingallmoduleswith
lowgradesorrequiredtorepeatoneortwomodulestoprogress.
Table5:Numberofmodulespassed,byGPAband.
GPAband n
Failed > 6
modules
Failed 3 to
6modules
Failed1 to
2modules
Passed all
modules
0.0≤GPA<2.0 432 245(57%) 146(34%) 39(9%) 1(0.2%)2.0≤GPA<2.5 217 0(0%) 18(8%) 122(56%) 77(35%)
2.5≤GPA≤4 558 0(0%) 5(1%) 38(7%) 515(92%)
4 ANALYTICAL APPROACHES USED
Both statistical analysis and classification techniques were used in this study. Correlation analysis
facilitatedcomparisonwithotherstudiesineducationalpsychology.Analysisofsubgroupdifferencesby
8[x,y)denotesarangeinclusiveofxbutexclusiveofy.
(2016).Learningfactormodelsofstudentsatriskoffailingintheearlystageoftertiaryeducation.JournalofLearningAnalytics,3(2),330–372.
http://dx.doi.org/10.18608/jla.2016.32.20
ISSN1929-7750(online).TheJournalofLearningAnalyticsworksunderaCreativeCommonsLicense,Attribution-NonCommercial-NoDerivs3.0Unported(CCBY-NC-ND3.0) 339
GPAband,agegroup,andgenderaidedinterpretationofclassificationmodelresults.
4.1 Correlation Analysis
Pearsonproduct-momentcorrelationcoefficients(r)werecalculatedbetweenallstudyfactorsandGPA.
Anassumptionofcalculating thesignificanceofaPearson’scorrelation is thatattributesarenormally
distributed.However,allstudyattributesfailedaShapiro-Wilknormalitytest(p>0.05).Thisiscommon
indatarelatingtoeducationandpsychology(Kang&Harring,2015;Micceri,1989),whichislikelytobe
skewed,haveaheavyorlighttail,and/orbemultimodal(Smith&Wells,2006).Therefore,significance
wasverifiedusing1,999bootstrapconfidenceintervals(B-CI)usingthebiascorrectedandaccelerated
method(Carpenter&Bithell,2000)asimplementedinRversion3.0.2.
4.2 Analysis of Group Differences
Group differences were assessed for subgroups by GPA band (three groups), age category (three
groups), and gender (two groups). Student’s t-test assumes a normal distribution and equality of
variance for the test-statistic attribute mean. Applying a Shapiro-Wilk test to attribute means of 50
bootstrap samples confirmed normality. However, a Brown-Forsythe test to compare variance in
attributemeansfoundvarianceswerenotequal.Therefore,resultsfromWelch’st-testarereportedfor
groupdifferencesbygender.One-wayAnalysisofVariance(ANOVA)withposthocTukeytestswasused
formultiplegroups.ANOVAisrobustregardingassumptionsofequalityofvarianceexcept inextreme
cases(Hair,Black,Babin,&Anderson,2010,p.458).
4.3 Classification
Classificationmodelswereevaluatedforallparticipantsand17subgroupsbyage,gender,andcourse.
Modelaccuracyforsixclassificationalgorithmsandtwoensembleswerecompared.Threeclassification
algorithmswerelinearclassifiers,namely:NaïveBayes(NB),DecisionTree(DT),andLogisticRegression
(LR).Twowerenon-linear:BackPropagationNeuralNetwork(BPNN)andk-NearestNeighbour(k-NN).A
SupportVectorMachine(SVM)wastrainedbothwithout(linear)andwith(non-linear)akernelfunction.
Amajorityvoteensemblewastrainedusingsixbaseclassifiers:twok-NNmodelstrainedonbootstrap
samplesofthedata,SVM,NN,DT,andNB.9Finally,abaggingensembleusedthebaseclassifierwiththe
highestaccuracy.RapidMinerversion5.3(rapidminer.com)wasusedformodelling.
Two trainingmethodswere compared formodels of all participants: 1) 10-fold cross validation using
stratifiedsampling(ModelXVal);and2)modelaccuracywhentrainedon2010and2011participantsand
testedon2012participants(Model2012).Subgroupmodelsweretrainedon2010and2011participants
andtestedon2012participants.
9IncludingLRdecreasedmodelaccuracy;usingtwok-NNlearnersincreasedmodelaccuracy.

(2016).Learningfactormodelsofstudentsatriskoffailingintheearlystageoftertiaryeducation.JournalofLearningAnalytics,3(2),330–372.
http://dx.doi.org/10.18608/jla.2016.32.20
ISSN1929-7750(online).TheJournalofLearningAnalyticsworksunderaCreativeCommonsLicense,Attribution-NonCommercial-NoDerivs3.0Unported(CCBY-NC-ND3.0) 340
4.3.1 Model parameter tuning Parametertuningforeachalgorithm,andtheoptimalparametersettingsformodelsofallparticipants,
wereasfollows:
• k-NNmodelswere trained on values of k in the range [2,50]. BestModelXVal used k=18; bestModel2012usedk=15.
• SVMmodelsweretrainedonthreecomplexityconstants(C)intherange[0–5]andfourkernelfunctions,namelydot(none),radial,polynomial,andanova.BestModelXValusedaradialkernelfunctionandC=0;bestModel2012usedadotkernelfunctionandC=0.
• Best accuracy for BPNN was achieved with a learning rate of 0.25, momentum of 0.3, 500trainingcycles,andthedefaultconfigurationofonehiddenlayerwithnumberofneuronssetto:
1 + #$%&'(*+,--(.&$-'/0#$%&'(*+12,//'/3 . The activation function was sigmoid; attributes
werescaledtotherange[-1,1].• Thedecisiontreerequiredaninformation-gainthreshold<0.05totrain.Modelsweretrainedon
information-gain thresholds in the range [0.0,0.05]; additional pruning was controlled byminimum leaf size in the range [2,20]. Best ModelXVal used an information-gain threshold of0.009andaminimumleafsizeof10;bestModel2012usedaninformation-gainthresholdof0.016andaminimumleafsizeof5.
• Baggingensemblesweretestedwithiterationvaluesintherange[2,15]andsampleratiosintherange[0.5,1].Optimalbaggingaccuracyused8iterationsandasampleratioof0.9,althoughalliterationvaluesgavesimilarresults.Parametersettingsfortheconstituentbasealgorithmwereasperconfigurationdetailsabove.
• The voting ensemble used majority voting. Parameter settings for the constituent basealgorithmswereasdetailedabove.
4.3.2 Reporting model accuracy Tworesultsarereportedforeachmodel,accuracyandgeometricmean(GM).GMismoreappropriate
than accuracy for unbalanced datasets; it combines the precision and recall of each class and so
compensatesforthegreater influenceofthemajorityclass inaccuracycalculations(Romero,Ventura,
Espejo,&Hervás,2008).AswillbediscussedinSection5.4,thedegreeofclassimbalancevariedacross
subgroups in the dataset, which was addressed by over-sampling the minority class. Accuracy was
calculated from the confusionmatrixof thebalanceddataset.GMwas calculated from the confusion
matrixoftheoriginal,unbalanceddataset,i.e.,afterremovalofbootstrapreplicas.
4.3.3 Comparing classification model accuracies Modelaccuracieswerecomparedbasedontheirconfusionmatrices.Twotestswereused,McNemar’s
testandFisher’sexacttest(FET).McNemar’stest,basedonchisquared(43),canbeusedtocompare
theresultsoftwoclassificationmodelsappliedtothesamedataset(Dietterich,1998).Whencomparing
severalalgorithms,p-valueswereadjustedusingtheHolmcorrectiontoaccountforfamily-wiseerror.
FETwasusedtocomparemodelaccuracieswhenappliedtodifferentdatasets;forexample,comparing
analgorithm’sperformanceforModelXValandModel2012(Rice,1995,p.484).BothtestswereruninR.
4.3.4 Attribute subset selection Attributesubsetselectiontechniquescan improvemodelperformanceandidentifyrelevantattributes
(2016).Learningfactormodelsofstudentsatriskoffailingintheearlystageoftertiaryeducation.JournalofLearningAnalytics,3(2),330–372.
http://dx.doi.org/10.18608/jla.2016.32.20
ISSN1929-7750(online).TheJournalofLearningAnalyticsworksunderaCreativeCommonsLicense,Attribution-NonCommercial-NoDerivs3.0Unported(CCBY-NC-ND3.0) 341
(Hall&Homes,2003).Threewrappermethodswereusedforattributesubsetselection,namelyforward
selection, backward selection, and a genetic algorithm. The two most popular approaches, forward
selectionandbackwardselection,generallygivegoodresults(Hall&Homes,2003)butcanconvergeon
a local optimum (Baumann, 2003), hence a genetic algorithm (GA) was also used (Yang & Honavar,
1998).Inananalysisof144optimalModel2012modelsacrossalgorithmsanddatasetsubgroups,forward
selection identified the best model most frequently (65% of models), followed by Genetic algorithm
(33%ofmodels).Forwardselectionidentified82%ofthebestk-NNmodels,wherebestmodelreferred
tothemodelwiththehighestoverallaccuracy.
5 DATA PRE-PROCESSING
Thefollowingsectiondiscussesmissingdata,generatingabinaryclasslabelfromGPA,classimbalance,
and assessing sample size.All attributeswere scaledusing a standardnormal Z-transformation (m=0,
s=1).
5.1 Missing Data on Prior Academic Performance
Prioracademicperformancewasunavailablefor189(16%)ofthe1,207studyparticipants.Anadditional
20 students (2%) had fewer than the required six leaving certificate subjects, so CAO points
underestimated prior academic performance. Both subgroups represented non-standard students of
interest to the study and remained in the dataset. However, an additional factor, average leaving
certificateresults(m=38.4,s=11.9,n=1,018),wasaddedto indicateaverageresultsachievedacrossall
leavingcertificatesubjectsattempted.
5.2 Discretizing Academic Performance
The class label needed to identify students at risk of failing. Experimenting with various ways to
discretizeGPA,Minaei-Bidgoli,Kashy,Kortemeyer,andPunch(2003)foundthathighernumbersofbins
(up to nine) resulted in higher errors because of low sample size in some bins (n=227). They
recommendedusingeithertwo(GPA≤2.0andGPA>2)orthree(GPA≤2;2<GPA<3.5,andGPA≥3.5)bins.
ThirtypercentoftheirparticipantsachievedaGPAof3.5orhigher.Romeroetal.(2008)binnedmodule
grades into fourcategoriesbasedon final coursemark (range [0,10]): fail [0,5],pass [5,7],good [7,9],
andexcellent[9,10].However,theyreportedexcellentandgoodstudentswerefrequentlyclassifiedas
pass,againciting lowersamplesizes in thosegroupsasapossiblecause (n=438).Thai-Nghe, Janecek,
andHaddawy(2007)achievedbestrecallforfailedstudents(64%)usingtwobinsbasedonend-of-year
GPA(range[2,4]),namelyfail[2,2.5)andpass[2.5,4](n=20,492).
Both twoand threeGPAbinswere considered for this study. Toevaluateboundariesusing twobins,
seventeenGPAbinboundaries in the range [1.7, 2.5]wereassessedusingNaïveBayes10with10-fold
10EarlymodelsofthedatasuggestedNaïveBayesgavecomparableaccuraciestootherlearners,concurringwithBergin(2006),asdiscussedinSection7.1.

(2016).Learningfactormodelsofstudentsatriskoffailingintheearlystageoftertiaryeducation.JournalofLearningAnalytics,3(2),330–372.
http://dx.doi.org/10.18608/jla.2016.32.20
ISSN1929-7750(online).TheJournalofLearningAnalyticsworksunderaCreativeCommonsLicense,Attribution-NonCommercial-NoDerivs3.0Unported(CCBY-NC-ND3.0) 342
crossvalidation.OptimalaccuracywasachievedwithaboundaryofGPA=2.0(accuracy:68.5%,recallon
fail:71%)confirmingaboundarybetweenapassingandfailingGPA.ModelspredictingthreeGPAbins
were less successful. Sixteenmodelswere testedusing lowerGPAboundary values in the range [1.0,
2.0] and upper GPA boundary values in the range [2.5, 3.25]. Models had difficulty distinguishing
between medium- and low-risk students. The highest overall accuracy was achieved with GPA
boundariesof 1.8 and3.25 (accuracy: 53.5%, recall on fail: 64%),whichwasmarginally better than a
randomguess(ĸ=0.3).11Superby,Vandamme,andMeskens(2006)hadsimilarlypoorresultspredicting
three classes. Therefore, two GPA bins were used for classification models in this study, GPA<2.0
(class=fail)andGPA≥2(class=pass),distinguishinghigh-riskstudentsfromotherstudents.
5.3 Evaluation of Sample Size
Progressive sampling indicates if combinations of attribute values likely to occur amongst study
participantsaresufficientlyrepresentedinasample(Provost,Jensen,&Oates,1999).Eachclassification
algorithm was trained on fifty sample sizes between the sampling fractions of 0.3 (n=362) and 1
(n=1,207),using10-foldcrossvalidation.VarianceinNaïveBayesmodelaccuracyconvergedforsample
factions >0.75 (n=905). In addition, the slope of the LOESS regression line for Naïve Bayes model
accuracywas approximately zero for sample fractions >0.8 (n=966), indicating convergence ofmodel
accuracyas illustrated inFigure1.NaïveBayescanconvergetooptimalaccuracyonasmallersample
size than other algorithms (Ng & Jordon, 2001; Mitchell, 2015). Variance in model accuracy for DT,
BPNN, and k-NN converged for sample fractions >0.8 (n=966). Variance in SVM model accuracy
convergedforsamplefractions>0.85(n=1,026)andLRmodelaccuracyappearedtoconvergeforsample
fractions>0.93(n=1,123),howeveralargerdatasetwouldbeneededtoconfirmaccuracyconvergence
forLR.
Keyfinding:Samplesizeslessthann=900under-representedpatternsinthedataset.
Figure1:ModelaccuracyforprogressivesamplingusingNaïveBayes,generatedusingthescatterplot
functionintheRpackagecar,version2.0-21.11Cohen’s Kappa coefficient (ĸ), range -1 to 1 inclusive, is a measure of the extent to which this result could have occurred by chance; -0.2<ĸ<0.2 indicates a performance similar to a random guess (Kundel & Polansky, 2003).
(2016).Learningfactormodelsofstudentsatriskoffailingintheearlystageoftertiaryeducation.JournalofLearningAnalytics,3(2),330–372.
http://dx.doi.org/10.18608/jla.2016.32.20
ISSN1929-7750(online).TheJournalofLearningAnalyticsworksunderaCreativeCommonsLicense,Attribution-NonCommercial-NoDerivs3.0Unported(CCBY-NC-ND3.0) 343
5.4 Class Imbalance
Thirty-eight percent of all participants were in class fail. The relative class size for fail varied across
datasetsubgroups,rangingfrom15%to56%.Results fromprogressivesampling indicatedthedataset
wastoosmalltounder-samplethemajorityclass,thereforetwoclassbalanceoptionswerecompared:
basicover-samplingoftheminorityclassandsyntheticminorityover-samplingtechnique(SMOTE).Basic
over-samplingoftheminorityclasshasbeencriticizedfornotaddressingtheissueoflackofdata,and
forover-fittingthedata(Weiss,2004).Chawla,Bowyer,Hall,andKelelmeyer(2002)proposedSMOTEas
an alternative over-sampling approach that generates synthetic instances along line segments joining
nearestneighboursintheminorityclass.Additionalinstancesoftheminorityclassweregeneratedusing
theSMOTEfunctionimplementedinR(packageDMwRversion0.4.1).Modelsweretrainedonthe2010
and 2011 student cohort and tested on the 2012 student cohort. Training and test datasets were
balancedseparately, i.e., instancesfromthetrainingdatasetwerenotavailablewhenre-samplingtest
instances,andviceversa.SMOTEresulted in lowermodelaccuraciesthansimpleover-samplingforall
learners, therefore, simple over-sampling of theminority classwas used.However, it isworth noting
that a comparison of model accuracies using SMOTE versus simple over-sampling showed the
differenceswerenotstatisticallysignificant.
6 RESULTS
Results of statistical analysis exploring relationships between study factors and GPA are given to
facilitatebothcomparisonwithotherstudies,andinformthediscussionofclassificationmodelresultsin
Section7.Thisincludescorrelationanalysisandanalysisofgroupdifferences.Resultsfromclassification
models predicting a binary class label of fail (GPA<2.0) and pass (GPA≥2.0) are presented, including
identificationofkeyattributesusedacrossclassificationmodels.
6.1 Correlations between Study Attributes
All factors of prior academic performance had significant correlationswith each other and lower but
significant correlations with GPA (p<0.05), illustrated as a heat map in Table 6. Methodical subjects
(r=0.302,95%B-CI[0.24,0.36]),CAOPoints(r=0.285,95%B-CI[0.22,0.34]),andMathematics(r=0.274,
95%B-CI [0.21, 0.33]) had the highest correlationswithGPA. Similar correlationswere cited in other
studies that included mature students (Conrad, 2006; Duff, Boyle, Dunleavy, & Ferguson, 2004;
Kaufman,Agars,&Lopez-Wagner,2008).

(2016).Learningfactormodelsofstudentsatriskoffailingintheearlystageoftertiaryeducation.JournalofLearningAnalytics,3(2),330–372.
http://dx.doi.org/10.18608/jla.2016.32.20
ISSN1929-7750(online).TheJournalofLearningAnalyticsworksunderaCreativeCommonsLicense,Attribution-NonCommercial-NoDerivs3.0Unported(CCBY-NC-ND3.0) 344
Table6:CorrelationsbetweenfactorsofprioracademicperformanceandGPA.
GPA CAOPoints English Mathematics
Applied
Average
Humanities
Average
CAOPoints0.285[0.22,0.34]
English0.169[0.11,0.23]
0.698[0.67,0.73]
Mathematics0.274[0.21,0.33]
0.477[0.42,0.53]
0.251[0.19,0.31]
AppliedAverage
0.172[0.10,0.24]
0.560[0.50,0.61]
0.365[0.29,0.43]
0.173[0.09,0.25]
HumanitiesAverage
0.228[0.17,0.29]
0.820[0.79,0.84]
0.693[0.66,0.73]
0.263[0.20,0.32]
0.338[0.26,0.40]
MethodicalAverage
0.302[0.24,0.36]
0.707[0.68,0.74]
0.432[0.38,0.48]
0.681[0.65,0.71]
0.194[0.12,0.26]
0.418[0.36,0.47]
Intervals are 95% Confidence Intervals based on 1,999 bootstrap samples. Only students with school leavingcertificate results were included (n=1,018). Applied average results are based on a subset of students who didappliedsubjects(n=647,64%).
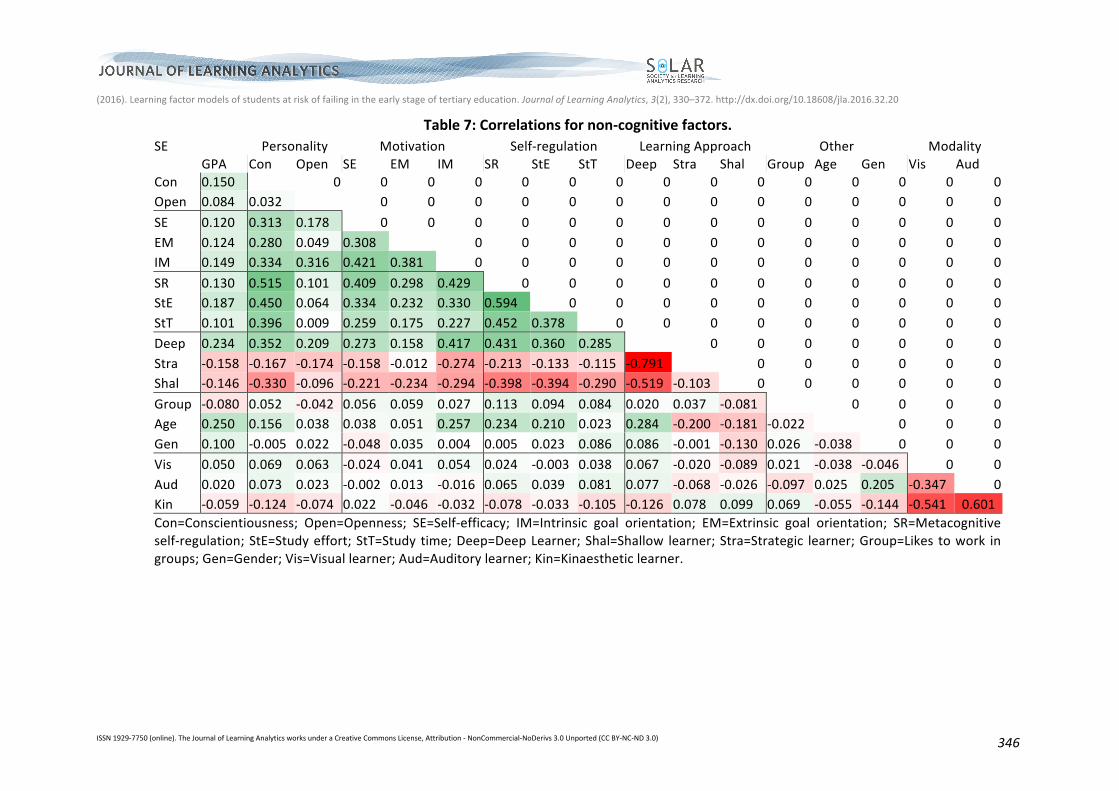
With the exception of visual and auditory modality, all non-cognitive factors of learning were
significantly correlatedwithGPA (p<0.05). Table7 is aheatmapvisualizationof correlations fornon-
cognitivestudyfactors;correlationswithconfidenceintervalsaregivenintheAppendix,Table15.Age
(r=0.25,95%B-CI[0.2,0.3]),adeeplearningapproach(r=0.234,95%B-CI[0.18,0.29]),andstudyeffort
(r=0.187, 95% B-CI [0.14, 0.24]) had the highest correlations with GPA.Openness (r=0.084, 95% B-CI
[0.03, 0.14]) andgroupwork (r=-0.08, 95%B-CI [-0.13, -0.02]) had theweakest statistically significant
correlationswithGPA.Correlationswerecomparablewithotherstudiesofdiversestudentpopulations
with the exception of self-efficacy (r=0.12, 95% B-CI [0.06, 0.18]), which was lower than expected
(Cassidy,2011:r=0.397;Diseth,2011:r=0.44;Komarraju&Nadler,2013:r=0.30).
The relatively low validity and internal reliability of intrinsic goal orientation was not reflected in
correlationswithotherattributes.Allfactorsofmotivationwerestatisticallysignificantlycorrelatedwith
each other. The highest correlationwas between intrinsic goal orientation and self-efficacy (r=0.421,
95%B-CI [0.37, 0.47]),which concurredwithDiseth (2011) andwasmarginally lower thanKomarraju
andNadler(2013).Alsoofnotewasthestatisticallysignificantcorrelationbetweenintrinsicandextrinsic
goalorientation(r=0.381,95%B-CI[0.33,0.43])ascorrelationscitedinotherstudieswereinconsistent
(Diseth, 2011; Eppler & Harju, 1997; Komarraju & Nadler, 2013). Correlations between factors of
motivation and factors of self-regulation were also statistically significant, particularly intrinsic goal
orientationandadeeplearningapproach(r=0.417,95%B-CI[0.37,0.47]).
Study time had relatively low validity and internal reliability as discussed in Section 3.2.2. While
correlationswithmetacognitive self-regulation (0.452, 95%B-CI [0.4, 0.49]) and study effort (r=0.378,
95%B-CI[0.33,0.43])werestatisticallysignificant,theywerelowerthanresultscitedinotherstudies;
forexample,BidjeranoandDai (2007) (r=0.55and r=0.64 respectively),whichwasbasedona similar
(2016).Learningfactormodelsofstudentsatriskoffailingintheearlystageoftertiaryeducation.JournalofLearningAnalytics,3(2),330–372.
http://dx.doi.org/10.18608/jla.2016.32.20
ISSN1929-7750(online).TheJournalofLearningAnalyticsworksunderaCreativeCommonsLicense,Attribution-NonCommercial-NoDerivs3.0Unported(CCBY-NC-ND3.0) 345
participantprofile.
The high negative correlation between adeep and strategic learning approach (r=-0.791, 95%B-CI [-
0.81, -0.77]) reflected thatmost participants reported theywere not shallow learners (m=1.3, s=1.9,
range=[0,10]),selectingeitherdeeporstrategicstatements.Asexpected,ashallow learningapproach
wasnegativelycorrelatedwithothernon-cognitivefactors.However,astrategiclearningapproachwas
also negatively correlated with other factors of learning and GPA (r=-0.158, 95% B-CI [-0.22, -0.10]),
contradictingotherstudies(e.g.,Duffetal.,2004;Swanberg&Martinsen,2010).Thedifferencemaybe
explainedbytheirquestionnairedesign,whichfacilitatedselectionofbothstrategicanddeeplearning
approaches, resulting in a statistically significant positive correlation between deep and strategic
learningapproaches.
Keyfinding:Withtheexceptionofstudytime,correlationsbetweenstudyfactorsconcurredwithresults
citedinotherstudies.Alsoofnotewastherelativelylowcorrelationbetweenself-efficacyandGPA.
6.2 Group Differences
6.2.1 GPA bands Group differences were assessed for the three GPA bands discussed Section 3.2.3, namely high-risk
(GPA<2.0),medium-risk(2.0≤GPA<2.5),andlow-risk(GPA≥2.5)students.Adeeplearningapproachwas
the only attribute with statistically significant differences across the three groups (F(2,1204)=25.95,
p<0.001).High-riskstudentshadsignificantlylowerprioracademicperformancethaneithermedium-or
low-risk students, particularly in methodical average (F(2,1015)=59.98, p<0.001), CAO points
(F(2,1015)=50.33, p<0.001), and mathematics (F(2,1015)=46.02, p<0.001). Low-risk students were
significantlydifferentfromtheothertwogroupsinsomeeffectivelearningdispositions.Theyhadhigher
scores in intrinsicgoalorientation (F(2,1015)=50.22,p<0.001),studyeffort (F(2,1204)=17.76,p<0.001),
conscientiousness (F(2,1204)=11.42, p<0.001), and openness (F(2,1204)=5.77, p<0.003). For the
remainingnon-cognitivefactors,therewerestatisticallysignificantdifferencesbetweenhigh-andlow-
risk students only, but medium-risk students did not differ significantly from the other two groups..
(2016).Learningfactormodelsofstudentsatriskoffailingintheearlystageoftertiaryeducation.JournalofLearningAnalytics,3(2),330–372.http://dx.doi.org/10.18608/jla.2016.32.20
ISSN1929-7750(online).TheJournalofLearningAnalyticsworksunderaCreativeCommonsLicense,Attribution-NonCommercial-NoDerivs3.0Unported(CCBY-NC-ND3.0) 346
Table7:Correlationsfornon-cognitivefactors.SE
Personality Motivation Self-regulation LearningApproach Other Modality
GPA Con Open SE EM IM SR StE StT Deep Stra Shal Group Age Gen Vis Aud
Con 0.150
0 0 0 0 0 0 0 0 0 0 0 0 0 0 0Open 0.084 0.032
0 0 0 0 0 0 0 0 0 0 0 0 0 0
SE 0.120 0.313 0.178 0 0 0 0 0 0 0 0 0 0 0 0 0 0
EM 0.124 0.280 0.049 0.308
0 0 0 0 0 0 0 0 0 0 0 0IM 0.149 0.334 0.316 0.421 0.381 0 0 0 0 0 0 0 0 0 0 0 0
SR 0.130 0.515 0.101 0.409 0.298 0.429 0 0 0 0 0 0 0 0 0 0 0StE 0.187 0.450 0.064 0.334 0.232 0.330 0.594 0 0 0 0 0 0 0 0 0 0
StT 0.101 0.396 0.009 0.259 0.175 0.227 0.452 0.378 0 0 0 0 0 0 0 0 0
Deep 0.234 0.352 0.209 0.273 0.158 0.417 0.431 0.360 0.285 0 0 0 0 0 0 0
Stra -0.158 -0.167 -0.174 -0.158 -0.012 -0.274 -0.213 -0.133 -0.115 -0.791
0 0 0 0 0 0Shal -0.146 -0.330 -0.096 -0.221 -0.234 -0.294 -0.398 -0.394 -0.290 -0.519 -0.103 0 0 0 0 0 0
Group -0.080 0.052 -0.042 0.056 0.059 0.027 0.113 0.094 0.084 0.020 0.037 -0.081 0 0 0 0Age 0.250 0.156 0.038 0.038 0.051 0.257 0.234 0.210 0.023 0.284 -0.200 -0.181 -0.022
0 0 0
Gen 0.100 -0.005 0.022 -0.048 0.035 0.004 0.005 0.023 0.086 0.086 -0.001 -0.130 0.026 -0.038 0 0 0
Vis 0.050 0.069 0.063 -0.024 0.041 0.054 0.024 -0.003 0.038 0.067 -0.020 -0.089 0.021 -0.038 -0.046 0 0
Aud 0.020 0.073 0.023 -0.002 0.013 -0.016 0.065 0.039 0.081 0.077 -0.068 -0.026 -0.097 0.025 0.205 -0.347 0Kin -0.059 -0.124 -0.074 0.022 -0.046 -0.032 -0.078 -0.033 -0.105 -0.126 0.078 0.099 0.069 -0.055 -0.144 -0.541 0.601Con=Conscientiousness; Open=Openness; SE=Self-efficacy; IM=Intrinsic goal orientation; EM=Extrinsic goal orientation; SR=Metacognitiveself-regulation;StE=Studyeffort;StT=Study time;Deep=DeepLearner;Shal=Shallow learner;Stra=Strategic learner;Group=Likes towork ingroups;Gen=Gender;Vis=Visuallearner;Aud=Auditorylearner;Kin=Kinaestheticlearner.
(2016).Learningfactormodelsofstudentsatriskoffailingintheearlystageoftertiaryeducation.JournalofLearningAnalytics,3(2),330–
372.http://dx.doi.org/10.18608/jla.2016.32.20
ISSN1929-7750(online).TheJournalofLearningAnalyticsworksunderaCreativeCommonsLicense,Attribution-NonCommercial-NoDerivs3.0Unported(CCBY-NC-ND3.0)347
Groups did not differ significantly in visual or auditory modality. Group means are given in the
Appendix,Table13.
Keyfinding:GroupdifferencesbyGPAbandconfirmedthatbothprioracademicperformanceand
non-cognitivefactorsassociatedwithaneffective learningdispositiondifferentiatedhigh-risk from
low-riskstudents
6.2.2 Age categories Studyfactormeanandstandarddeviationswereinitiallycomparedfortenagecategories12:18,19,
20,21,22–23,24–25,26–28,29–32,33–39,and≥40.Agegroupswerecombinedtoensureatleast
60 students per group.13 Comparing differences in means reduced the ten categories to three,
namely:18–23(n=875);24–28(n=131);and29–60(n=201).Thiswasbasedona lackofsignificant
differencesforstudyfactorsinagegroupswithinthesethreeagecategories.Analysisofdifferences
across the three age categories showed average GPA scores increased significantly with age
(F(2,1204)=48.95,p<0.001),asdidmanynon-cognitivefactorsassociatedwithaneffectivelearning
disposition,namelyadeeplearningapproach(F(2,1204)=68.54,p<0.001),intrinsicgoalorientation
(F(2,1204)=51.6, p<0.001), metacognitive self-regulation (F(2,1204)=39.19, p<0.001), study effort
(F(2,1204)=32.57, p<0.001), conscientiousness (F(2,1204)=16.06, p<0.001), and extrinsic goal
orientation (F(2, 1204)=5.287, p<0.01). As expected, CAO points decreased with age
(F(2,1015)=54.08, p<0.001) as entry requirements are lower for students aged 23 and over. This
differenceinprioracademicperformancewasreflectedinallsubjectareasexceptmathematics(F(2,
1015)=0.271, p=0.763). These results concurwith a numberof studies reporting a better learning
dispositionandacademicperformanceamongstolderstudents(e.g.,Cassidy,2011;Eppler&Harju,
1997;Hoskins,Newstead,&Dennis,1997).GroupmeansareincludedintheAppendix,Table13.
Keyfinding:Groupdifferencesbyageconcurredwithotherstudiesthatolderstudentshadamore
effectivelearningdispositionandhigherGPA.
6.2.3 Gender differences Engineering and computing courses were predominantly male and had low entry requirements.
Humanities courseswerepredominantly female andhadhigh entry requirements. Therefore, it is
unsurprising thatmales had significantly lowerCAO points than females (t(918)=-4.077, p<0.001).
Thisdifferencewasreflectedinallsubjectareas,theleastsignificantdifferencewasinmathematics
(t(913)=-2.081, p=0.038), as illustrated in Table 13 in the Appendix. GPA scores were also
significantlylowerformales(t(1158)=-3.595,p<0.001).Genderdifferencesinacademicperformance
werenotreflectedinfactorsoftemperamentormotivation,butstatisticallysignificantdifferences
werefoundinfactorsofself-regulation,approachestolearning,andlearnermodality.Femaleshad
highermean scores for study time (t(1065)=-2.988, p=0.003), adeep learningapproach (t(1107)=-
3.038, p=0.002), and auditory modality (t(1170)=-7.300, p<0.001) while males had higher mean
12StudentagewascalculatedaswholeyearsoldatSeptember1stintheyearofregistration.
13ApplyingbothaWilcoxonRankSumnon-parametrictestandaparametrict-testtoarangeofdistributionscommoninpsychometricdata,Micceri(1989)reportedt-testsinflatedTypeIerrors(incorrectfindingofsignificance)forsamplesizeslessthan60only,butperformedwellforlargersamples.

(2016).Learningfactormodelsofstudentsatriskoffailingintheearlystageoftertiaryeducation.JournalofLearningAnalytics,3(2),330–
372.http://dx.doi.org/10.18608/jla.2016.32.20
ISSN1929-7750(online).TheJournalofLearningAnalyticsworksunderaCreativeCommonsLicense,Attribution-NonCommercial-NoDerivs3.0Unported(CCBY-NC-ND3.0)348
scoresforashallowlearningapproach(t(1170)=4.723,p<0.001)andkinaestheticlearningmodality
(t(1131)=5.175,p<0.001).
6.3 Classification Results
6.3.1 Classification accuracy for models of all participants Table 8 gives classification model accuracies for models of all participants as a heat map. As
discussed in Section 5.4, the dataset was balanced by oversampling theminority class. Reported
modelaccuraciesarebasedontheresultingbalanceddataset.However,geometricmean(GM)was
calculated after removal of replicated instances from the labelled dataset as explained in Section
4.2.2.Thisisindicatedbythesamplesize(n)includedinTable8.ContingencytablesforMcNemar’s
test(!")andFisher’sexacttest(FET)alsoexcludedreplicatedinstances.
Best Model2012 accuracy was k-NN (accuracy: 71.98%, GM: 70.35%). However, a comparison of
Model2012 accuracies using McNamer’s test with Holm correction for family-wise error indicated
model performancewas comparable across algorithms. Theonly statistically significant difference
wasbetweenLR(accuracy:65.38%,GM:61.12%)andk-NN(!"(1,n=436)=15.95,p<0.001).
IncontrastwithModel2012results,bestModelXValaccuracywasSVM(81.62%).ItslowerGM(72.18%)
reflected a higher recall on pass (88.24%) than fail (59.04%). Given the objective of identifying
students at risk of failing, models with a high recall on fail are preferable. BPNN also had good
accuracy(75.33%)butalowerGM(69.32%)reflectingahigherprecisiononpass(78.53%)thanfail
(57.48%).AcomparisonofModelXValaccuraciesusingMcNamer’stestwithHolmcorrectionshowed
SVMhadstatisticallysignificantlyhigheraccuracythanallotheralgorithms.Inaddition,LRaccuracy
was statistically significantly lower than other algorithms (accuracy: 66.64%, GM: 63.06%).
Differencesintheaccuraciesoftheremainingsixalgorithmswerenotstatisticallysignificant.
ModelXVal accuracy was higher than Model2012 accuracy for each algorithm used. However, a
comparison of the Model2012 and ModelXVal accuracy for each algorithm found a statistically
significantdifferenceforSVMonly(p<0.001FET).14
ExtensivesearchstrategieswereusedforoptimalattributesubsetselectionasdiscussedinSection
4.3.4. This can result in model over-fitting (Baumann, 2003). A comparison of cross validation
accuracies with (ModelXVal), and without (Modelall), attribute subset selection found that the
differencewasstatisticallysignificant for twoalgorithmsonly,k-NN(!"(1,n=1207)=20.1,p<0.001)andak-NNBaggingEnsemble(!"(1,n=1207)=6.7,p<0.01).ModelallaccuraciesareincludedinTable
8.
Keyfinding:Modelsofstudentsatriskoffailingbasedonfactorsmeasuredpriortocommencement
offirstyearofstudyachievedgoodpredictiveaccuracy.Modelaccuracieswerecomparableacrossa
numberofclassifiers.
14Fisher’sexacttest(FET)assumesindependentsamples;itislikelythatsomeinstancesfromModelXValwerereplicatedinModel2012,violatingtheassumptionsofFET.Significanceconcurredwithresultsfromaselectionofotherstatisticaltestsincludingchi-squaredandZ-scoreprobability.
(2016).Learningfactormodelsofstudentsatriskoffailingintheearlystageoftertiaryeducation.JournalofLearningAnalytics,3(2),330–
372.http://dx.doi.org/10.18608/jla.2016.32.20
ISSN1929-7750(online).TheJournalofLearningAnalyticsworksunderaCreativeCommonsLicense,Attribution-NonCommercial-NoDerivs3.0Unported(CCBY-NC-ND3.0)349
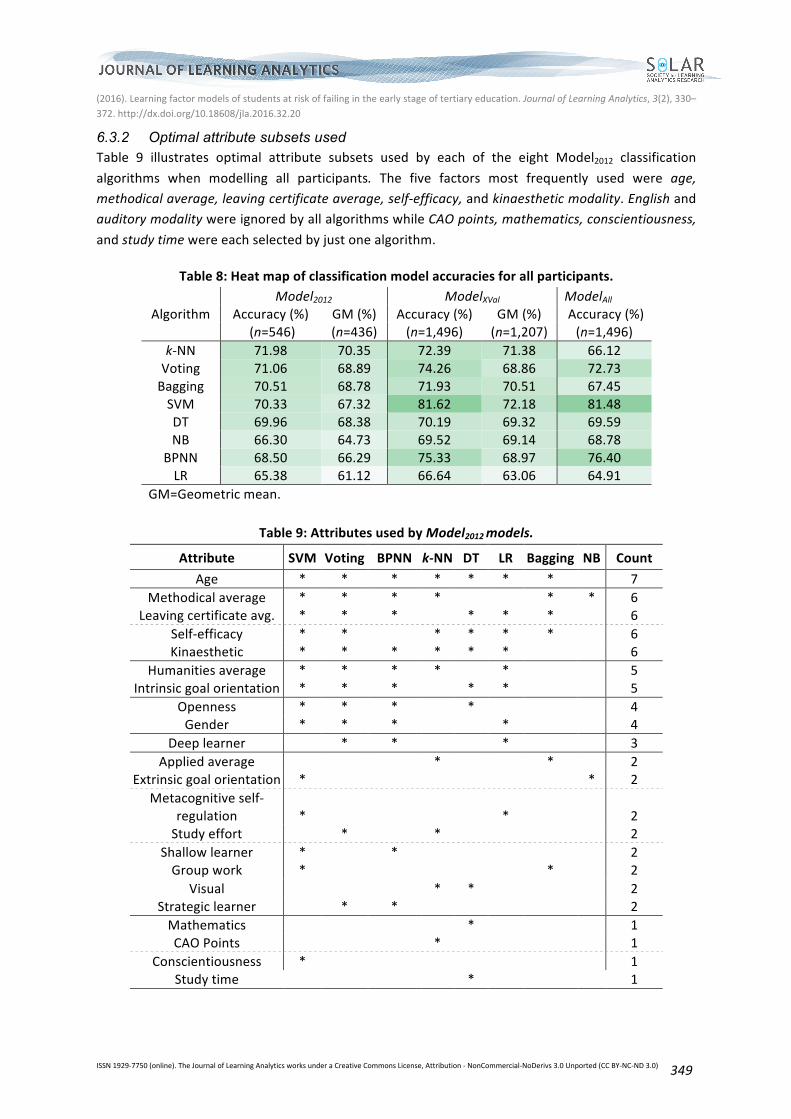
6.3.2 Optimal attribute subsets used Table 9 illustrates optimal attribute subsets used by each of the eight Model2012 classification
algorithms when modelling all participants. The five factors most frequently used were age,
methodicalaverage,leavingcertificateaverage,self-efficacy,andkinaestheticmodality.Englishand
auditorymodalitywereignoredbyallalgorithmswhileCAOpoints,mathematics,conscientiousness,
andstudytimewereeachselectedbyjustonealgorithm.
Table8:Heatmapofclassificationmodelaccuraciesforallparticipants.
Model2012 ModelXVal ModelAll
Algorithm Accuracy(%) GM(%) Accuracy(%) GM(%) Accuracy(%) (n=546) (n=436) (n=1,496) (n=1,207) (n=1,496)
k-NN 71.98 70.35 72.39 71.38 66.12Voting 71.06 68.89 74.26 68.86 72.73Bagging 70.51 68.78 71.93 70.51 67.45SVM 70.33 67.32 81.62 72.18 81.48DT 69.96 68.38 70.19 69.32 69.59NB 66.30 64.73 69.52 69.14 68.78
BPNN 68.50 66.29 75.33 68.97 76.40LR 65.38 61.12 66.64 63.06 64.91
GM=Geometricmean.
Table9:AttributesusedbyModel2012models.
Attribute SVM Voting BPNN k-NN DT LR Bagging NB CountAge * * * * * * *
7
Methodicalaverage * * * *
* * 6Leavingcertificateavg. * * *
* * *
6
Self-efficacy * *
* * * *
6Kinaesthetic * * * * * *
6
Humanitiesaverage * * * *
*
5Intrinsicgoalorientation * * *
* *
5
Openness * * *
*
4Gender * * *
*
4
Deeplearner
* *
*
3Appliedaverage
*
*
2
Extrinsicgoalorientation *
* 2Metacognitiveself-
regulation *
*
2Studyeffort
*
*
2
Shallowlearner *
*
2Groupwork *
*
2
Visual
* *
2Strategiclearner
* *
2
Mathematics
*
1CAOPoints
*
1
Conscientiousness *
1Studytime
*
1

(2016).Learningfactormodelsofstudentsatriskoffailingintheearlystageoftertiaryeducation.JournalofLearningAnalytics,3(2),330–
372.http://dx.doi.org/10.18608/jla.2016.32.20
ISSN1929-7750(online).TheJournalofLearningAnalyticsworksunderaCreativeCommonsLicense,Attribution-NonCommercial-NoDerivs3.0Unported(CCBY-NC-ND3.0)350
Attribute SVM Voting BPNN k-NN DT LR Bagging NB CountAuditory 0English
0
Numberofattributesused: 14 12 11 9 9 9 6 2
*Attributewasincludedinthemodel;dashedlineswereaddedtoimprovereadability.
Tocomparethepredictiveaccuracyofnon-cognitivefactorsoflearningwiththepredictiveaccuracy
offactorsavailablefromstudentregistration,threemodelswerecompared:ak-NNmodeltrained
onallattributes(Model2012),ak-NNmodeltrainedonprioracademicperformance,age,andgender
(Modelprior), and a k-NN model trained on the non-cognitive learning factors of age and gender
(ModelNCog). Models were trained on 2010 and 2011 data, and then tested on the 2012 data.
Forwardselectionwasusedforattributesubsetselectionandmodelsweretrainedonvaluesofkin
therange[10,30].AccuracieswerecomparedusingMcNemar’stestwithHolmcorrection.Modelprior
accuracy (70.33%)wasmarginally lower thanModel2012 accuracy (71.88%), but thedifferencewas
notstatisticallysignificant(p=0.44).ModelNCogaccuracy(64.10%)wasstatisticallysignificantlylower
thanModel2012(p=0.04)butwasnotstatisticallysignificantlylowerthanModelprior(p=0.12).Asubset
of four attributes was used inModelprior, namely average leaving certificate,methodical average,
age,andgender.AsubsetofnineattributeswasusedinModelNCog,namelyconscientiousness,self-
efficacy,intrinsicandextrinsicgoalorientation,studyeffort,deepandshallowlearningapproaches,
age,andgender.
Keyfindings:Thefiveattributesmostpredictiveofstudentsatriskoffailingwereage,methodical
average, leaving cert average, self-efficacy, and kinaesthetic modality. Improvement in model
accuracyattributedtonon-cognitivefactorsoflearningwasnotstatisticallysignificant.
Table10:Confusionmatrix. PredictedFail PredictedPass RecallActualFail 116(TrueFail(TF)) 47(FalsePass(FP)) 71.17%
#$#$&$'
ActualPass 87(FalseFail(FF)) 186(TruePass(TP)) 68.13%#'
$$&#'
Precision 57.14%#$
#$&$$ 79.83%#'
#'&$' 69.27%#$&#'
#$&#'&$$&$'
6.3.3 Group differences between misclassifications and correct predictions A review ofModel2012 predictions highlighted that algorithms generally concurred on participants
misclassified.Forexample,75%ofparticipantsmisclassifiedbyk-NNweremisclassifiedbyat least
four of the eight algorithmsused. Therefore, studentmisclassificationwasdefined as an instance
misclassifiedbyat leastfouroftheeightalgorithms.Theresultingconfusionmatrix identifiedfour
groupsas illustrated inTable10: studentscorrectlypredictedas fail (TrueFail); studentscorrectly
predicted as pass (True Pass); students incorrectly predicted as fail (False Fail); and students
incorrectly predicted as pass (False Pass). A Shapiro-Wilk test of fifty bootstrap samples of each
group verified group means were normally distributed for each study factor but a Levene’s test
found varianceswere unequal. Therefore,Welch’s t-testwas used to compare eachmisclassified
(2016).Learningfactormodelsofstudentsatriskoffailingintheearlystageoftertiaryeducation.JournalofLearningAnalytics,3(2),330–
372.http://dx.doi.org/10.18608/jla.2016.32.20
ISSN1929-7750(online).TheJournalofLearningAnalyticsworksunderaCreativeCommonsLicense,Attribution-NonCommercial-NoDerivs3.0Unported(CCBY-NC-ND3.0)351
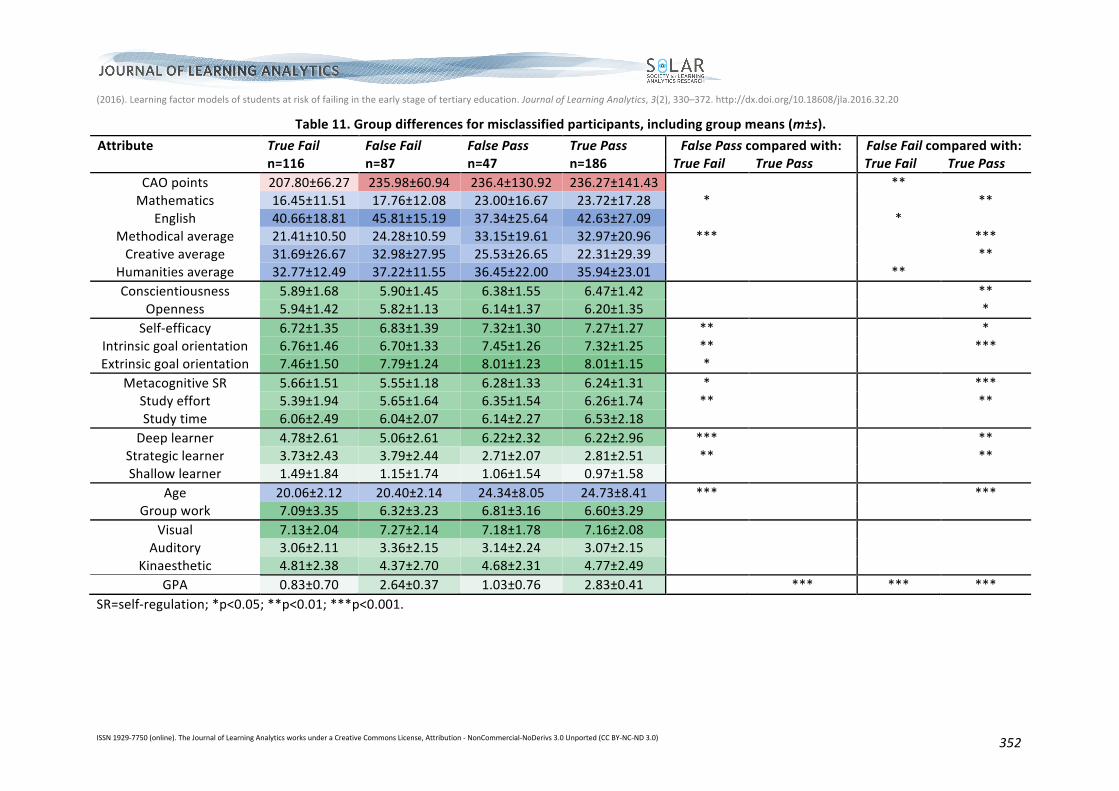
groupwithcorrectly classifiedparticipants.Resultsandgroupmeansaregiven inTable11.Group
differencesconcurredwithasimilaranalysisofk-NNmisclassifications.
Of specific interest was each misclassified group and how it differed from correctly classified
participants.FalsePasshadsimilarmeanscorestoTruePassinallstudyattributes.However,False
Pass had statistically significantly highermean scores thanTrue Fail in a numberof non-cognitive
factorsof learning,methodicalaverage,andmathematics.FalseFailhadastatisticallysignificantly
lowerGPAthanTruePass,andhadsimilarmeanscorestoTrueFail inallstudyfactorsexceptCAO
points,humanitiesaverage,andEnglish.
Key finding: Analysis of group differences between instances incorrectly predicted as pass andinstances correctly predicted as pass showeda lackof statistically significant differencesbetween
the two groups. Conversely, differences between instances incorrectly predicted as pass and
instances correctly predicted as failwere statistically significant in a number of effective learning
dispositionsandmeasuresofprioracademicperformance
6.3.4 Classification models by subgroup Classificationmodelswere trained for subgroupsbyacademic course (12 subgroups), gender, and
age(3subgroups).Aswiththefulldataset,eightclassificationalgorithmsweretrainedon2010and
2011dataandtestedon2012data.Subgroupmodelaccuracieswerehigherthanmodelstrainedon
the full dataset.However, all subgroupshadn<900 and sowerebelow theminimum sample size
required to accurately model study factors as discussed in Section 5.4. Therefore, to assess if
insufficient data contributed to high model accuracies, model accuracy for each subgroup was
compared to themeanaccuracyofmodels trainedon50 randombootstrap samplesof the same
size, selected from all participants. The random samples were constructed to match the class
imbalanceoftheircorrespondingsubgroup, i.e.,thenumbersofpassesandfailsmatchedforboth
testdatasetsandtrainingdatasets.Averagemodelaccuraciesforrandomsampleswerealsohigher
thanmodels of all participants, and inmany cases were similar to their corresponding subgroup
model accuracy. This suggested that under sampling of the data contributed to improvement in
modelaccuracy,invalidatingresultsfrommodelsofsubgroup.
Keyfinding:Samplesizesweretoosmalltodrawconclusionsonsubgroupmodelaccuracies.
7 ANALYSIS OF RESULTS
Resultsfromthisstudyindicatedthatpredictivemodelsofstudentsfailingintheirfirstyearofstudy
intertiaryeducation,trainedondataavailableduringfirst-yearstudentinduction,canachievegood
predictiveaccuracywhenapplied toadifferent studentcohort.Therefore, the study corroborates
the use of data mining’s empirical modelling approaches for predicting at-risk students. The
followingsectionsdiscussthesalientoutcomesfromthisstudy.
7.1 Models of Academic Performance
Thestudydatasetwasdiverse in termsof studentageandcourseof study.Modesofassessment
also varied across courses. For example, humanities courses gavemoreweighting to end-of-term
examinations,othercoursesgaveequalorhigherweightingtocontinuousassessmentwork.
(2016).Learningfactormodelsofstudentsatriskoffailingintheearlystageoftertiaryeducation.JournalofLearningAnalytics,3(2),330–372.http://dx.doi.org/10.18608/jla.2016.32.20
ISSN1929-7750(online).TheJournalofLearningAnalyticsworksunderaCreativeCommonsLicense,Attribution-NonCommercial-NoDerivs3.0Unported(CCBY-NC-ND3.0) 352
Table11.Groupdifferencesformisclassifiedparticipants,includinggroupmeans(m±s).Attribute TrueFail FalseFail FalsePass TruePass FalsePasscomparedwith: FalseFailcomparedwith: n=116 n=87 n=47 n=186 TrueFail TruePass TrueFail TruePass
CAOpoints 207.80±66.27 235.98±60.94 236.4±130.92 236.27±141.43
**
Mathematics 16.45±11.51 17.76±12.08 23.00±16.67 23.72±17.28 *
**
English 40.66±18.81 45.81±15.19 37.34±25.64 42.63±27.09
*
Methodicalaverage 21.41±10.50 24.28±10.59 33.15±19.61 32.97±20.96 ***
***Creativeaverage 31.69±26.67 32.98±27.95 25.53±26.65 22.31±29.39
**
Humanitiesaverage 32.77±12.49 37.22±11.55 36.45±22.00 35.94±23.01
**
Conscientiousness 5.89±1.68 5.90±1.45 6.38±1.55 6.47±1.42
**Openness 5.94±1.42 5.82±1.13 6.14±1.37 6.20±1.35
*
Self-efficacy 6.72±1.35 6.83±1.39 7.32±1.30 7.27±1.27 **
*Intrinsicgoalorientation 6.76±1.46 6.70±1.33 7.45±1.26 7.32±1.25 **
***
Extrinsicgoalorientation 7.46±1.50 7.79±1.24 8.01±1.23 8.01±1.15 *
MetacognitiveSR 5.66±1.51 5.55±1.18 6.28±1.33 6.24±1.31 *
***Studyeffort 5.39±1.94 5.65±1.64 6.35±1.54 6.26±1.74 **
**
Studytime 6.06±2.49 6.04±2.07 6.14±2.27 6.53±2.18
Deeplearner 4.78±2.61 5.06±2.61 6.22±2.32 6.22±2.96 ***
**Strategiclearner 3.73±2.43 3.79±2.44 2.71±2.07 2.81±2.51 **
**
Shallowlearner 1.49±1.84 1.15±1.74 1.06±1.54 0.97±1.58
Age 20.06±2.12 20.40±2.14 24.34±8.05 24.73±8.41 ***
***Groupwork 7.09±3.35 6.32±3.23 6.81±3.16 6.60±3.29
Visual 7.13±2.04 7.27±2.14 7.18±1.78 7.16±2.08
Auditory 3.06±2.11 3.36±2.15 3.14±2.24 3.07±2.15
Kinaesthetic 4.81±2.38 4.37±2.70 4.68±2.31 4.77±2.49
GPA 0.83±0.70 2.64±0.37 1.03±0.76 2.83±0.41
*** *** ***
SR=self-regulation;*p<0.05;**p<0.01;***p<0.001.

(2016).Learningfactormodelsofstudentsatriskoffailingintheearlystageoftertiaryeducation.JournalofLearningAnalytics,3(2),330–372.http://dx.doi.org/10.18608/jla.2016.32.20
ISSN1929-7750(online).TheJournalofLearningAnalyticsworksunderaCreativeCommonsLicense,Attribution-NonCommercial-NoDerivs3.0Unported(CCBY-NC-ND3.0) 353
Assessment methods can affect academic performance (Pérez-Martínez, García-García, Perdomo, &
Villamide-Díaz, 2009) and its relationships with factors such as openness and learning approach, as
discussed inSection2.Notwithstanding these sourcesof variability, classificationmodelaccuracywas
high(71.98%)whenappliedtoadifferentstudentcohort.
A number of studies modelling educational data have cited comparable accuracies between
classification algorithms, although there are inconsistencies regarding which model achieves optimal
accuracywhenmodelling educational data. For example, Jayaprakashet al. (2014) reported SVM, LR,
andNBhad comparable accuracypredictinghigh-risk studentsbasedon factors including SAT scores,
enrollmentdata, anddata fromanonline learningenvironment,howeverDTdidnotperformaswell
(n=15,150).Ontheotherhand,Lauria,Moody,Jayaprakash,Jonnalagadda,andBaron(2013)reported
DT had comparable accuracy with both SVM and LR when distinguishing between strong and weak
students,alsobasedonprioracademicperformance,demographicdata,andlogdatafromanintelligent
tutoringsystem(n=6,445).Herzog(2006)foundDTandBPNNhadsimilarperformancetoLRprovided
thatindependentvariableshadlittleco-linearity,butLRhadloweraccuracywhenvariableswithgreater
dependencieswere included inthemodel (n=4,564).Bergin(2006)foundNBandastackingensemble
outperformedDT,BPNN,k-NN(k=3),andLRwhenclassifyingstudentsasstrongorweakbasedonprioracademicperformanceandpsychometricdata(n=102).Resultsfromthisstudyconcurredthatarange
ofclassificationalgorithmsachievedsimilaraccuracy;thehighestaccuracieswerek-NN,ensembles,and
SVM,asillustratedinTable8.
While model accuracy estimated using 10-fold cross validation (ModelXVal) was higher than model
accuracywhentestedonadifferentstudentcohort(Model2012),theincreasewasstatisticallysignificant
for one algorithm only, SVM. As discussed in Section 4.3, a kernel function improved SVM model
accuracyforModelXVal,generatingamorecomplexmodelthanModel2012whereakernelfunctionfailed
to improvemodel accuracy. In contrast, optimal parameter settings for bothModel2012 andModelXVal
were similar for other algorithms; for example,k ink-NN (15 and 18 respectively). Therefore, resultsindicatedthatcrossvalidationprovidedagoodestimateofmodelaccuracywiththeexceptionofanon-
linearSVMmodel.
7.2 Analysis of Misclassifications
The misclassifications of particular interest were participants incorrectly predicted as Pass. Groupcomparisons of study attributes failed to identify differences between this group and those correctly
predicted asPass. Theremay be a number of reasons for this. First, a number of factors relevant to
retentionandprogressionariseafterstudentinduction,suchasacademicandsocialintegration,change
incircumstanceresultingineconomicpressure(Tinto,2006),andclassroomrelatedaffectsonacademic
performancesuchas teachingmethods (Ganyaupfu,2013;Hake,1998).Such factorsmayexplainwhy
prior academic performance and learning disposition alone are insufficient to predict academic
performance in all cases. Second, it could be argued that profiling learners during first-year student
induction is too early in the semester to measure some study attributes accurately. For example,
(2016).Learningfactormodelsofstudentsatriskoffailingintheearlystageoftertiaryeducation.JournalofLearningAnalytics,3(2),330–372.http://dx.doi.org/10.18608/jla.2016.32.20
ISSN1929-7750(online).TheJournalofLearningAnalyticsworksunderaCreativeCommonsLicense,Attribution-NonCommercial-NoDerivs3.0Unported(CCBY-NC-ND3.0) 354
intrinsic and extrinsic goal orientation may vary depending on the time or situation (Apter, 1989).
Similarly,studentsmaybeunsureofstudyexpectationsduringtheinitialperiodofinduction;Winters,
Greene,andCostich (2008) concluded thatboth learnerand taskcharacteristics influenced levelsand
methods of self-regulation. On the other hand, factor correlations in this study (see Section 6.1)
concurred with evidence cited in other studies where data were gathered later in the semester.
Therefore, itwasmore likely that factorsnot included in the studyexplained incorrect predictionsof
Pass.Furtherworkisneededtodeterminethepotentialimprovementsinmodelaccuracyifadditional
datagatheredafterstudentinductionwereincluded.
Analysis of participants incorrectly predicted as fail showed they had a lower GPA than studentscorrectly predicted as pass. Scores in a range of effective learning dispositions and prior academic
performancewerealsolower,characterizingagroupofloweracademicachieverswhomaybenefitfrom
additionalsupportindevelopinganeffectivelearningdisposition.
7.3 Overview of Study Attributes
The recorded significant correlations between study attributes meant different attribute subsets
achievedcomparableaccuracieswhenpredictingGPA.Consequently,nocommonsubsetofattributes
could be isolated for use in this project. For example, a deep learning approach is associated withintrinsiclearninggoals(Gray,McGuinness,Owende,&Carthy,2014)andcorrelationsbetweenthetwo
factorswererelativelystrong(r=0.417,95%B-CI[0.37,0.47]).Sixoftheeightmodelsusedeitheradeeplearningapproachorintrinsicgoalorientation,butjusttwomodels,BPNNandLR,usedboth.k-NNusedneitherofthese,butinsteadusedself-efficacy,whichhadarelativelyhighcorrelationwithintrinsicgoalorientation(r=0.421,95%B-CI[0.37,0.47]),andstudyeffort,whichhadarelativelyhighcorrelationwitha deep learning approach (r=0.360, 95% B-CI [0.31, 0.41]). Nevertheless, it is clear from reviewing
attributesubsetsused(Table9)thatsomeattributesweremorepredictiveofstudentsatriskoffailing
than others. The following sections provide an overview of the study factors and their relative
usefulnessinpredictingstudentsatriskoffailing.
7.3.1 Age and Gender Correlationsbetweenageandacademicperformancearewellcited in literature (Hoskinsetal.,1997;
Cassidy, 2011; Wigfield, Eccles, & Pintrich, 1996), and evidence from this study concurs with this
observation. It is evident from analysis of group differences discussed in Section 6.2.2 that older
studentshaveamoreeffective learningdisposition: theyweremore likely toadoptadeeper learning
approach,setlearninggoals,andregulatelearning.Classificationmodelsconcurredthatagewasagoodpredictorofacademicperformance(seeTable9).
Anumberof studies reportedgender isnot significant inpredictingacademicperformance in tertiary
education (Naderi, Abdullah, Sharir,&Kumar, 2009;Dollinger,Matyja,&Huber, 2008;Hoskins et al.,
1997);however, fourof theeightalgorithmsusedgender inspiteof its relatively lowcorrelationwithGPA (r=0.1, 95% B-CI [0.05, 0.15]). Gender group differences highlighted that males had lower prior
(2016).Learningfactormodelsofstudentsatriskoffailingintheearlystageoftertiaryeducation.JournalofLearningAnalytics,3(2),330–372.http://dx.doi.org/10.18608/jla.2016.32.20
ISSN1929-7750(online).TheJournalofLearningAnalyticsworksunderaCreativeCommonsLicense,Attribution-NonCommercial-NoDerivs3.0Unported(CCBY-NC-ND3.0) 355
academic performance, lower GPA, and lower scores in a number of effective learning dispositions.
However, the dataset contained bias: courses that were predominantly male had lower entry
requirementsthancoursesthatwerepredominantlyfemale.Therefore,furtherworkisneededtoassess
if thesignificanceofgender inclassificationmodelswasreflectiveoftheircourseofstudyratherthan
actualgenderdifferences.
7.3.2 Prior academic performance Aggregate scoresofprioracademicperformance,particularlymethodicalaverage andoverall average(leaving cert average), were found to be more predictive of first-year academic performance than
individualgradesinEnglishormathematics.MethodicalaveragehadthehighestcorrelationwithGPA,andwasusedbymostclassificationmodels.Replacingmethodicalaveragewithmathematics reducedmodel accuracy. For example, k-NN model accuracy dropped from 71.3% to 66.29% (t(995)=39.1,
p<0.001) when methodical average was replaced by mathematics. Therefore, while both factorsdisplayedcomparablecorrelationswithGPA,anaggregatecoveringresultinmathematics,science,and
businesssubjectsachievedhigheraccuracywhenpredictingstudentsatriskoffailingthanmathematicsalone.
A number of classification models included the factor humanities average, particularly models with
higheraccuraciessuchask-NN,votingensemble,SVM,andBPNN.AnalysisofcorrelationswithGPAby
courseofstudyshowedthathumanitiesaveragewasmorepredictiveofGPAinbusinessandhumanities
coursesthancoursesinengineeringandcomputing(Appendix,Table16).Correlationsbetweenleaving
certificate English and GPA also varied by discipline. English had a statistically significant positivecorrelation with GPA for humanities courses and some business courses, but had a statistically
significantnegativecorrelationwithGPAforComputing(IT).CorrelationsbetweenEnglishandGPAforothertechnicaldisciplineswerenotstatisticallysignificant(p>0.05).Therefore,itwasunsurprisingthat
Englishwasnotasignificantfactorinclassificationorregressionmodelsofallparticipants.
7.3.3 Factors of personality As discussed in Section 2, conscientiousness is the best personality-based predictor of academic
performance in tertiary education, particularly for younger students (Kappe & van der Flier, 2010;
Chamorro-Premuzic & Furnham, 2008; Kaufman et al., 2008; Allick & Realo, 1997).While correlation
results from this study concurred with the available evidence, all classification models except SVM
ignoredconscientiousness.Thissuggestedthatotherstudyfactorsaccountedforconscientiousness,andthereisnoadditionalpredictivevalueinmeasuringconscientiousnessspecifically.
Opennesswas used by four classificationmodels (k-NN, BPNN, SVM, and voting), suggesting itwas a
usefulpredictorofstudentsatriskoffailingasevidencedbystatisticallysignificantgroupdifferencesin
openness forstudentswithGPA>2.5.Themixofassessmentmethodsusedacrosscoursesandwithin
coursesmayexplainthelowcorrelationbetweenopennessandGPA.Opennessisthemostcontroversial
of the BIG-5 personality factors in terms of defining both meaning and sub-factors (de Raad &
Schouwenburg, 1996, p. 321). The six-question scale used in this study covered four sub- factors:
(2016).Learningfactormodelsofstudentsatriskoffailingintheearlystageoftertiaryeducation.JournalofLearningAnalytics,3(2),330–372.http://dx.doi.org/10.18608/jla.2016.32.20
ISSN1929-7750(online).TheJournalofLearningAnalyticsworksunderaCreativeCommonsLicense,Attribution-NonCommercial-NoDerivs3.0Unported(CCBY-NC-ND3.0) 356
creativity (2 questions), intellect (2 questions), imagination, and openness to new experiences (1
questioneach).Creativity,specifically,isfrequentlycitedasaneffectivelearningdispositionthatistobe
encouragedandpromotedinassessmentdesign(BuckinghamShum&DeakinCrick,2012).Furtherwork
is required to investigate if sub-factors inherent in opennessmay bemore appropriate predictors of
academicperformancethanopennessitself.
7.3.4 Factors of motivation Results from this study support findings by Robbins et al. (2004) regarding the importance of self-efficacy; it was the most predictive non-cognitive factor of students at risk of failing. Interestingly,
DeakinCrickandGoldspink(2014)observedthatbeingabletoexpressconfidenceinlearningabilitywas
alsoastrongindicatorofaneffectivelearningdisposition. Intrinsicgoalorientationwasalsoindicativeofgoodacademicperformance,howeverinferencesonitsrelativeimportancemustconsiderthepoor
reliabilityforthatfactor,asdiscussedinSection3.2.2.
7.3.5 Factors of self-regulation Classificationmodelslargelyignoredfactorsofself-regulation.Theimportanceofself-regulatedlearning
iswellcited(e.g.,Zimmerman,1990);howeverself-regulation iscomplextodefineand is relatedtoa
numberofother factorsof learning (Roll&Winne,2015).Forexample, ina longitudinal studyon the
causal dilemma between motivation and self-regulation, De Clercq, Galand, and Frenay (2013)
concludedthatalearninggoalorientationresultedinadeeplearningapproach,whichinturnresulted
in better self-regulation. Self-regulation, as measured in this study, failed to improve model
performanceoverandabovefactorsofmotivationandapproachestolearning.
7.3.6 Approaches to learning AdeeplearningapproachhadahighercorrelationwithGPAthanothernon-cognitivestudyfactors(seeTable7)andwastheonlynon-cognitivefactoroflearningwithastatisticallysignificantdifferenceinthe
meanscoreacrossall threeGPAbandsofhigh-risk,medium-risk,and low-riskparticipants (Appendix,
Table13).However,onlyhalfofclassificationmodelsusedoneofthethreefactorsoflearningapproach:
BPNN,SVM,LR,andavotingensemble.Volet(1996)foundthatgoalsettinginfluencesself-regulation,
which in turn influences learning approach adopted. Similarly in this study, adeep learningapproachhad the strongest correlations with intrinsic goal orientation (r=0.417),metacognitive self-regulation(r=0.431), and study effort (r=0.360) (see Appendix, Table 15). With the exception of a bagging
ensemble, all models that found approaches to learning to be unimportant showed that either goalorientationorstudyeffortweresignificant.Additionally,apartfromavotingensemble,nomodelused
bothlearningapproachesandstudyeffort,althoughanumberofmodelsusedlearningapproacheswith
learninggoals.
7.3.7 Learner modality While awareness of learner modality by student and lecturer can improve the student-learning
experience(Duffin&Gray,2009a;Gilakjani,2012),thereisnoevidencetosuggestthatlearnermodality
ispredictiveofacademicperformance(Gilakjani,2012;Kablan,2016).Correlationresults(seeTable7)
(2016).Learningfactormodelsofstudentsatriskoffailingintheearlystageoftertiaryeducation.JournalofLearningAnalytics,3(2),330–372.http://dx.doi.org/10.18608/jla.2016.32.20
ISSN1929-7750(online).TheJournalofLearningAnalyticsworksunderaCreativeCommonsLicense,Attribution-NonCommercial-NoDerivs3.0Unported(CCBY-NC-ND3.0) 357
and analysis of group differences (see Table 13) concurredwith this observation for both visual andauditorymodalities. However, the kinaestheticmodality (learn by doing) had a weak but statisticallysignificantcorrelationwithGPA(r=-0.059,p<0.05).Inaddition,therewerestatisticallysignificantgroup
differencesforkinaestheticmodalitybyGPAband(p<0.05).Kinaestheticmodalitywassignificantinsixoftheeightclassificationmodels.Kinaestheticlearnersweremorelikelytobemale,morelikelytohave
registeredpoorprioracademicperformance,anddisplayedaweakbutnegativecorrelationwithfactors
of effective learning disposition. Further work is needed to determine the real importance of
kinaestheticmodality,i.e.,ifitwasusedasaproxyforpoorlearningdisposition,orwasitselfindicativeoffailure.
7.4 Malleable Learner Dispositions
Comparisonofmodelswithandwithoutnon-cognitivefactorsoflearning(personality,motivation,self-
regulation,approachesto learning,and learnermodality)suggestedthattheadditionofnon-cognitive
factors of learning provided limited improvement in predictive accuracy in spite of their significant
correlations with GPA. Therefore, their value in learner profiling at student induction merits
consideration.Severalstudieshavereportedlearningdispositionismalleable.Forexample,Miller-Reilly
(2006) evidenced that teaching approaches had changed adult learners’ self-efficacy inmathematics.
Similarly, ameta-analysis of studies on self-regulation reported improvements in self-regulation, and
consequentlylearninggoals,followingself-regulationtrainingandsupport(Wintersetal.,2008).Itcould
be argued that all students at risk of failing require further support in developing effective learning
dispositions regardless of individual profiles. However, a profiling tool facilitates feedback to both
students and lecturers that may support other interventions. The profiler used in this study gave
immediate feedback to students on their learner profile. Duffin andGray (2009b) found that 56% of
studentsunderstoodtheirlearningprofilebasedononlinefeedback,andthisroseto83%whenprofiling
was followedupbyexplanatoryworkshops.ArnoldandPistilli (2012) reporteda6.4percentagepoint
decreaseingradesD,F,andwithdrawalsamongstusersoftheirCourseSignalstoolthatprovidedboth
earlywarningsandsuggestedimprovementstrategiestoat-riskstudentsstartinginweektwo.However,
Jayaprakashetal. (2014) found that simplymaking studentsaware that theymaybeat riskof failing
significantly increased the numbers passing and the number of withdrawals, but providing further
supports did not effect additional changes in either measure. Therefore, further work is needed to
assess the impactof timely feedbackon learnerdisposition, specificallyonsubsequentoptimaluseof
thatfeedback.
8 CONCLUSION
Empiricalmodelsoflearningdevelopedinthisstudypredictedfirst-yearstudentsatriskoffailingwith
an accuracyof 72%when applied to a new student cohort. Thedatasetwasdiverse in termsof age,
academic discipline, and assessment strategies used (n=1,207). Informed by a review of factors
predictive of academic performance in tertiary education, study factors related to prior academic
performance, personality, motivation, learning strategies, learner modality, age, and gender. The
(2016).Learningfactormodelsofstudentsatriskoffailingintheearlystageoftertiaryeducation.JournalofLearningAnalytics,3(2),330–372.http://dx.doi.org/10.18608/jla.2016.32.20
ISSN1929-7750(online).TheJournalofLearningAnalyticsworksunderaCreativeCommonsLicense,Attribution-NonCommercial-NoDerivs3.0Unported(CCBY-NC-ND3.0) 358
twenty-fourstudyfactorsusedweremeasuredpriortoorduring first-yearstudentenrollment.Model
accuracieswerecomparableacrosstheeightclassificationalgorithmsused,namelyk-nearestneighbour(k-NN),avotingensemble,supportvectormachine(SVM),k-NNbaggingensemble,decisiontree(DT),back-propagation neural network (BPNN), naïveBayes (NB), and logistic regression (LR). As expected,
10-foldcrossvalidationmodelaccuracieswerehigherthanmodelsappliedtoadifferentstudentcohort;
however, the increase inmodel accuracywas statistically significant for SVMonly. Subgroups smaller
thann=900under-representedpatternsinthedataset.
Analysisofmisclassificationsshowedthatfailsmisclassifiedaspassdidnotdifferinlearningdispositionorprioracademicperformancefromthosecorrectlyclassifiedaspass.Factorsmeasurable later inthe
semester, such as academic and social integration, economic pressures, and teaching methods, may
explain misclassifications. Further work is needed to determine potential improvements in model
accuracy in an Institute of Technology student cohort if data gathered after student induction were
includedinthemodel.
Attributes that were significant in accurate prediction of students at risk of failing across a range of
coursesincluded:
• Age:Thestudysamplehadanagerangeof[18,60].Youngerstudentshadagreaterriskoffailingintheirfirstyearofstudy.
• Aggregatesofprioracademicperformance:Inparticular,anaggregateofmathematics,science,andbusinessrelatedsubjectswasfoundtobeastrongerpredictorofyear1studentsatriskoffailingcomparedtootherprioracademicperformanceaggregates.
• Factorsofmotivation,particularlyself-efficacyandintrinsicgoalorientation.• Learningapproach:Ashalloworastrategiclearningapproachwasindicativeofstudentsatrisk
offailing.• Openness,indicatingacreative,inquisitivetemperament,wasindicativeofapassinggrade.• A kinaesthetic modality (preference for learn by doing) was indicative of students at risk of
failing.
Self-regulationfactorswerenotfoundtobesignificantoncelearninggoalsandapproachestolearning
were considered. Similarly, conscientiousness did not improvemodel accuracy over and above other
factorsoflearning.RespectivecorrelationsbetweenstudyfactorsandGPAwerenotindicativeoffactors
significant in classification models of students at risk of failing. For example, both openness and
kinaesthetic learner modality were significant in a number of classification models but had poor
correlations with GPA. Conclusions from this study that openness and kinaesthetic learner modality
were significant predictors of academic performance were not widely observed in other studies,
particularlythesignificanceoflearnermodality.Therefore,furtherworkisneededtodetermineiftheir
importanceinmodelsoflearning,asreportedinthisstudy,generalizestootherstudentcohorts.
Theprimaryvalueofnon-cognitivefactorsoflearninginthisstudywastodistinguishthelearningprofile
of students at risk of failing from the learning profile of students that passed, rather than provide
(2016).Learningfactormodelsofstudentsatriskoffailingintheearlystageoftertiaryeducation.JournalofLearningAnalytics,3(2),330–372.http://dx.doi.org/10.18608/jla.2016.32.20
ISSN1929-7750(online).TheJournalofLearningAnalyticsworksunderaCreativeCommonsLicense,Attribution-NonCommercial-NoDerivs3.0Unported(CCBY-NC-ND3.0) 359
improvementinmodelpredictiveaccuracy.Ithasbeenarguedthatnon-cognitivefactorsofmotivation,
self-regulation,andapproachesto learningaremalleable,andkeytoaneffective learningdisposition,
which in turn should be a valued learning outcome of courses in tertiary education. Further work is
needed to evaluate subsequent benefits of learner profiling during student induction, both for the
student,andforfirst-yearmentoringandsupportprogrammes.
ACKNOWLEDGEMENTS
TheauthorswouldliketothanktheInstituteofTechnologyBlanchardstown(www.itb.ie)foritssupport
in facilitating this research, and the staff at the National Learning Network Assessment Services
(www.nln.ie)fortheirassistanceinadministeringquestionnairesduringstudentinduction.
REFERENCES
ACT. (2012). 2012 Retention Completion Summary Tables (Technical report). Retrieved from
www.act.org
Ali, L., Hatala, M., Gašević, D., & Winne, P. H. (2014). Leveraging MSLQ data for predicting student
achievement goal orientations. Journal of Learning Analytics, 1(3), 157–160. Retrieved from
https://epress.lib.uts.edu.au/journals/index.php/JLA/article/view/4215
Allick,J.,&Realo,A.(1997).Intelligence,academicabilities,andpersonality.PersonalityandIndividualDifferences,23(5),809–814http://dx.doi.org/10.1016/S0191-8869(97)00103-7
Apter,M.J.(1989).Reversaltheory:Motivation,emotionandpersonality.London:Routledge.Arnold, K. E., & Pistilli, M. D. (2012). Course signals at Purdue: Using learning analytics to increase
student success. Proceedings of the 2nd International Conference on Learning Analytics andKnowledge(LAKʼ12),267–270.http://dx.oi.org/10.1145/2330601.2330666
Baker,R.S.J.d.,&Yacef,K.(2010).Thestateofeducationaldataminingin2009:Areviewandfuture
visions. Journal of Educational Data Mining, 1(1),3–17. Retrieved from
http://educationaldatamining.org/JEDM/index.php/JEDM/article/view/8
Baumann,K.(2003).Cross-validationastheobjectivefunctionforvariable-selectiontechniques.TrendsinAnalyticalChemistry,22(6),395–406.http://dx.doi.org/10.1016/S0165-9936(03)00607-1
Bergin, S. (2006). Statistical and machine learning models to predict programming performance(Unpublisheddoctoraldissertation).NationalUniversityofIreland,Maynooth.
Bidjerano,T.,&Dai,D.Y. (2007).Therelationshipbetweenthebig-fivemodelofpersonalityandself-
regulated learning strategies. Learning and Individual Differences, 17(1),69–81.http://dx.doi.org/10.1016/j.lindif.2007.02.001
Biggs,J.,Kember,D.,&Leung,D.(2001).Therevisedtwo-factorstudyprocessquestionnaire:R-SPQ-2F.
BritishJournalofEducationPsychology,71,133–149.http://dx.doi.org/10.1007/BF03173004Bruinsma,M. (2004).Motivation, cognitiveprocessingandachievement inhighereducation.Learning
andInstruction,14(6),549–568.http://dx.doi.org/10.1016/j.learninstruc.2004.09.001BuckinghamShum,S.,&DeakinCrick,R. (2012). Learningdispositionsand transferablecompetencies:
Pedagogy,modellingandlearninganalytics.Proceedingsofthe2nd InternationalConferenceon
(2016).Learningfactormodelsofstudentsatriskoffailingintheearlystageoftertiaryeducation.JournalofLearningAnalytics,3(2),330–372.http://dx.doi.org/10.18608/jla.2016.32.20
ISSN1929-7750(online).TheJournalofLearningAnalyticsworksunderaCreativeCommonsLicense,Attribution-NonCommercial-NoDerivs3.0Unported(CCBY-NC-ND3.0) 360
Learning Analytics and Knowledge (LAK ʼ12), 92–101.
http://dx.doi.org/10.1145/2330601.2330629
Burisch,M.(1997).Testlengthandvalidityrevisited.EuropeanJournalofPersonality,11(4),303–315.Campbell,J.,deBlois,P.,&Oblinger,D.(2007).Academicanalytics:Anewtoolforanewera.EDUCAUSE
Review,42(4),40–57.Carpenter,J.,&Bithell,J.(2000).Bootstrapconfidenceintervals:When,which,what?Apracticalguide
formedicalstatisticians.StatisticsinMedicine,19(9),1141–1164.Cassidy, S. (2011). Exploring individual differences as determining factors in student academic
achievement in higher education. Studies in Higher Education, 37(7), 1–18.
http://dx.doi.org/10.1080/03075079.2010.545948
Chamorro-Premuzic, T.,& Furnham,A. (2008). Personality, intelligenceandapproaches to learning as
predictorsofacademicperformance.Personalityand IndividualDifferences,44(7),1596–1603.http://dx.doi.org/10.1016/j.paid.2008.01.003
Chatti,M.A.,Dyckhoff,A.L.,Schroeder,U.,&Thüs,H.(2012).Areferencemodelforlearninganalytics.
InternationalJournalofTechnologyEnhancedLearning,SpecialIssueonStateoftheArtinTEL,318–331.
Chawla,N.V.,Bowyer,K.W.,Hall, L.O.,&Kelelmeyer,W.P. (2002). Smote: Syntheticminorityover-
samplingtechnique.JournalofArtificialIntelligenceResearch,16(1),321–357.Colby,J.(2005).Attendanceandattainment:Acomparativestudy.InnovationinTeachingandLearning
inInformationandComputerSciences,4(2),1–13.Conrad, M. A. (2006). Aptitude is not enough: How personality and behavior predict academic
performance. Journal of Research in Personality, 40(3), 339–346.
http://dx.doi.org/10.1016/j.jrp.2004.10.003
Covington, M. V. (2000). Goal theory, motivation, and school achievement: An integrative review.
AnnualReviewofPsychology,51,171–200.http://dx.doi.org/10.1146/annurev.psych.51.1.171DeClercq,M.,Galand,B.,&Frenay,M. (2013).Chickenortheegg:Longitudinalanalysisof thecausal
dilemmabetweengoalorientation,self-regulationandcognitiveprocessingstrategiesinhigher
education. Studies in Educational Evaluation, 39(1), 4–13.
http://dx.doi.org/10.1016/j.stueduc.2012.10.003
deRaad,B.,&Schouwenburg,H.C. (1996).Personality in learningandeducation:Areview.EuropeanJournalofPersonality,10(5),303–336.
DeakinCrick, R.,&Goldspink, C. (2014). Learningdispositions, self-theories and student engagement.
British Journal of Educational Studies, 62(1), 19–35.
http://dx.doi.org/10.1080/00071005.2014.904038
Dekker,G.,Pechenizkiy,M.,&Vleeshouwers,J.(2009).Predictingstudentsdropout:Acasestudy.InT.
Barnes,M.Desmarais,C.Romero,&S.Ventura(Eds.),Proceedingsofthe2ndAnnualConferenceon Educational Data Mining (EDM ’09), 41–50. Retrieved from
http://www.educationaldatamining.org/conferences/index.php/EDM/2009/paper/download/14
67/1433
Dietterich, T. G. (1998). Approximate statistical tests for comparing supervised classification learning

(2016).Learningfactormodelsofstudentsatriskoffailingintheearlystageoftertiaryeducation.JournalofLearningAnalytics,3(2),330–372.http://dx.doi.org/10.18608/jla.2016.32.20
ISSN1929-7750(online).TheJournalofLearningAnalyticsworksunderaCreativeCommonsLicense,Attribution-NonCommercial-NoDerivs3.0Unported(CCBY-NC-ND3.0) 361
algorithms. Journal of Neural Computation, 10(7), 1895–1923.
http://dx.doi.org/10.1162/089976698300017197
Diseth,Á.(2011).Self-efficacy,goalorientationsandlearningstrategiesasmediatorsbetweenpreceding
and subsequent academic achievement. Learning and Individual Differences, 21(2), 191–195.http://dx.doi.org/10.1016/j.lindif.2011.01.003
Dollinger,S. J.,Matyja,A.M.,&Huber, J. L. (2008).Which factorsbestaccount foracademicsuccess:
Those which college students can control or those they cannot? Journal of Research inPersonality,42(4),872–885.http://dx.doi.org/10.1016/j.jrp.2007.11.007
Drachsler, H., & Greller,W. (2012). The pulse of learning analytics: Understandings and expectations
from the stakeholders. Proceedings of the 2nd International Conference on Learning AnalyticsandKnowledge(LAKʼ12),120–129.http://dx.doi.org/10.1145/2330601.2330634
Duff,A.,Boyle,E.,Dunleavy,K.,&Ferguson,J.(2004).Therelationshipbetweenpersonality,approach
to learning and academic performance. Personality and Individual Differences, 36(2), 1907–1920.http://dx.doi.org/10.1016/j.paid.2003.08.020
Duffin,D.,&Gray,G.(2009a).Accommodatinglearnerdiversityintheclassroom,Proceedingsofthe3rdInternational Technology, Education and Development Conference (INTED 2009), 9–11March
2009, Valencia, Spain (pp. 4629–4635). Retrieved from
https://library.iated.org/view/DUFFIN2009ACC
Duffin,D.,&Gray,G.(2009b).UsingICTtoenableinclusiveteachingpracticesinhighereducation.InP.
L. Emiliani, L. Burzagli, A. Como, F. Gabbanini, & A.-L. Salminen (Eds.), Assistive TechnologyResearchSeries,25,640–645.
Elliot, A., & Harackiewicz, J. M. (1996). Approach and avoidance achievement goals and intrinsic
motivation:Amediationalanalysis.JournalofPersonalityandSocialPsychology,70(3),461–475.Entwhistle,N. (2005). Contrastingperspectives in learning. In F.Marton,D.Hounsell,&N. Entwhistle
(Eds.),Theexperienceoflearning:Implicationsforteachingandstudyinginhighereducation,3rd(Internet)edition(pp.3–22).Edinburgh:UniversityofEdinburgh,CentreforTeaching,LearningandAssessment.Retrievedfromhttp://www.tla.ed.ac.uk/resources/EoL.html
Eppler,M.A.,&Harju,B.L.(1997).Achievementmotivationgoalsinrelationtoacademicperformance
intraditionalandnontraditionalcollegestudents.ResearchinHigherEducation,38(5),557–573.http://dx.doi.org/10.1023/A:1024944429347
Farsides, T., &Woodfield, R. (2003). Individual differences and undergraduate academic success: The
rolesofpersonality, intelligence,andapplication.Personalityand IndividualDifferences,34(7),1225–1243.http://dx.doi.org/10.1016/S0191-8869(02)00111-3
Fleming,N.D.(1995).I’mdifferent,notdumb:Modesofpresentation(VARK)inthetertiaryclassroom.
In A. Zelmer (Ed.), Research and Development in Higher Education, Proceedings of the 1995Annual Conference of the Higher Education and Research Development Society of Australasia(HERDSA1995),4–8July1995,Rockhampton,Australia(Vol.18,pp.308–313).
Galesic, M., & Bosnjak, M. (2009). Effect of questionnaire length on participation and indicators of
response quality in a web survey. Public Opinion Quarterly, 73(2), 349–360.
http://dx.doi.org/10.1093/poq/nfp031
(2016).Learningfactormodelsofstudentsatriskoffailingintheearlystageoftertiaryeducation.JournalofLearningAnalytics,3(2),330–372.http://dx.doi.org/10.18608/jla.2016.32.20
ISSN1929-7750(online).TheJournalofLearningAnalyticsworksunderaCreativeCommonsLicense,Attribution-NonCommercial-NoDerivs3.0Unported(CCBY-NC-ND3.0) 362
Ganyaupfu,E.M.(2013).Teachingmethodsandstudents’academicperformance.InternationalJournalofHumanitiesandSocialScienceInvention,2(9),29–35.
Gilakjani,A.P.(2012).Amatchormismatchbetweenlearningstylesofthelearnersandteachingstyles
oftheteachers.InternationalJournalofModernEducationandComputerScience,11,51–60.Goldberg, L.R., Johnson, J.A., Eber,H.W.,Hogan,R.,Ashton,M.C., Cloninger,C.R.,&Gough,H.C.
(2006). The international personality item pool and the future of public-domain personality
measures. Journal of Research in Personality, 40, 84–96.
http://dx.doi.org/10.1016/j.jrp.2005.08.007
Gray,G.,McGuinness,C.,&Owende,P.(2013).Aninvestigationofpsychometricmeasuresformodelling
academic performance in tertiary education. In S. K. DʼMello, R. A. Calvo, & A. Olney (Eds.),
Proceedings of the 6th International Conference on Educational DataMining (EDM2013), 6–9
July,Memphis,TN,USA(pp.240–243).Springer.
Gray, G., McGuinness, C., & Owende, P. (2014). Non-cognitive factors of learning as predictors of
academicperformanceintertiaryeducation.InS.Ritter&S.Fancsali(Eds.),WorkshoponNon-Cognitive Factors and Personalization for Adaptive Learning (NCFPAL 2014) at the 7thInternationalConferenceonEducationalDataMining(EDM2014),CEURWorkshopProceedings,
(pp.107–114):InternationalEducationalDataMiningSociety.
Gray,G.,McGuinness,C.,Owende,P.,&Carthy,A.(2014).Areviewofpsychometricdataanalysisand
applications in modelling of academic achievement in tertiary education. Journal of LearningAnalytics,1(1),75–106.
Hair, J. F. J., Black,W. C., Babin, B. J., & Anderson, R. E. (2010).Multivariate data analysis: A globalperspective,7thed.NewYork:PearsonEducation.
Hake,R.R.(1998).Interactive-engagementversustraditionalmethods:Asix-thousand-studentsurveyof
mechanicstestdataforintroductoryphysicscourses.AmericanAssociationofPhysicsTeachers,66,64–74.http://dx.doi.org/10.1119/1.18809
Hall,M.A.,&Homes,G. (2003). Benchmarking attributes selection techniques for discrete class data
mining. IEEE Transactions on Knowledge and Data Engineering, 15(6), 1437–1447.
http://dx.doi.org/10.1109/TKDE.2003.1245283Herzog,S.(2006).Estimatingstudentretentionanddegree-completiontime:Decisiontreesandneural
networks vis-à-vis regression. New Directions for Institutional Research, 131, 17–33.
http://dx.doi.org/10.1002/ir.185
Hoskins, S. L.,Newstead, S. E.,&Dennis, I. (1997).Degreeperformanceas a functionof age, gender,
priorqualificationsanddisciplinestudied.AssessmentandEvaluationinHigherEducation,22(3),317–328.http://dx.doi.org/10.1080/0260293970220305
Jayaprakash, S. M., Moody, E.W., Lauria, E. J. M., Regan, J. R., & Baron, J. D. (2014). Early alert of
academicallyat-riskstudents:Anopensourceanalyticsinitiative.JournalofLearningAnalytics,1(1), 6–47. Retrieved from
https://epress.lib.uts.edu.au/journals/index.php/JLA/article/view/3249
Kablan, Z. (2016). The effect ofmanipulatives onmathematics achievement across different learning
styles. Educational Psychology, 36(2), 277–296.
(2016).Learningfactormodelsofstudentsatriskoffailingintheearlystageoftertiaryeducation.JournalofLearningAnalytics,3(2),330–372.http://dx.doi.org/10.18608/jla.2016.32.20
ISSN1929-7750(online).TheJournalofLearningAnalyticsworksunderaCreativeCommonsLicense,Attribution-NonCommercial-NoDerivs3.0Unported(CCBY-NC-ND3.0) 363
http://dx.doi.org/10.1080/01443410.2014.946889
Kang, Y., & Harring, J. R. (2015). Reexamining the impact of non-normality in two-group comparison
procedures. Journal of Experimental Education, 83(2), 147–174.
http://dx.doi.org/10.1080/00220973.2013.876605
Kappe,R.,&vanderFlier,H.(2010).Usingmultipleandspecificcriteriatoassessthepredictivevalidity
ofthebigfivepersonalityfactorsonacademicperformance.JournalofResearchinPersonality,44(1),142–145.http://dx.doi.org/10.1016/j.jrp.2009.11.002
Kaufman, J.C.,Agars,M.D.,&Lopez-Wagner,M.C. (2008).The roleofpersonalityandmotivation in
predicting early college academic success in non-traditional students at a Hispanic-serving
institution. Learning and Individual Differences, 18(4), 492–496.
http://dx.doi.org/10.1016/j.lindif.2007.11.004
Knight, S., Buckingham Shum, S., & Littleton, K. (2013). Epistemology, pedagogy, assessment and
learning analytics. Proceedings of the 3rd International Conference on Learning Analytics andKnowledge (LAK ’13), 75–84. Retrieved from
https://epress.lib.uts.edu.au/journals/index.php/JLA/article/view/3538
Komarraju,M.,Karau,S. J., Schmeck,R.R.,&Avdic,A. (2011).Thebig fivepersonality traits, learning
styles, and academic achievement. Personality and Individual Differences, 51(4), 472–477.http://dx.doi.org/10.1016/j.paid.2011.04.019
Komarraju,M.,&Nadler, D. (2013). Self-efficacy and academic achievement:Why do implicit beliefs,
goals, and effort regulation matter? Learning and Individual Differences, 25, 67–72.
http://dx.doi.org/10.1016/j.lindif.2013.01.005
Kundel,H.L.,&Polansky,M.(2003).Measurementofobserveragreement.Radiology,228(2),303–308.http://dx.doi.org/10.1148/radiol.2282011860
Lauria, E. J. M., Moody, E. W., Jayaprakash, S. M., Jonnalagadda, N., & Baron, J. D. (2013). Open
academic analytics initiative: Initial research findings. Proceedings of the 3rd InternationalConference on Learning Analytics and Knowledge (LAK ’13), 150–154.
http://dx.doi.org/10.1145/2460296.2460325
Marton,F.,&Säljö,R.(2005).Approachestolearning.InF.Marton,D.Hounsell,&N.Entwhistle(Eds.),
The experience of learning: Implications for teaching and studying in higher education, 3rd(Internet)edition(pp.36–58).Edinburgh:UniversityofEdinburgh,CentreforTeaching,LearningandAssessment.Retrievedfromhttp://www.tla.ed.ac.uk/resources/EoL.html
Micceri, T. (1989). The unicorn, the normal curve, and other improbable creatures. PsychologicalBulletin,105(1),156–166.http://dx.doi.org/10.1037/0033-2909.105.1.156
Miller-Reilly,B.(2006).Affectivechangeinadultstudentsinsecondchancemathematicscourses:Threedifferentteachingapproaches(Unpublisheddoctoraldissertation).UniversityofAuckland,NewZealand.
Milne,J.,Jeffrey,L.M.,Suddaby,G.,&Higgins,A.(2012).Earlyidentificationofstudentsatriskoffailing.
Proceedingsofthe29thAnnualConferenceoftheAustralasianSocietyforComputersinLearninginTertiaryEducation(ASCILITE2012),(Vol.1,pp.25–28).
Minaei-Bidgoli,B.,Kashy,D.A.,Kortemeyer,G.,&Punch,W.F.(2003).Predictingstudentperformance:
(2016).Learningfactormodelsofstudentsatriskoffailingintheearlystageoftertiaryeducation.JournalofLearningAnalytics,3(2),330–372.http://dx.doi.org/10.18608/jla.2016.32.20
ISSN1929-7750(online).TheJournalofLearningAnalyticsworksunderaCreativeCommonsLicense,Attribution-NonCommercial-NoDerivs3.0Unported(CCBY-NC-ND3.0) 364
An application of data mining methods with educational web-based system lon-capa.
Proceedingsofthe33rdASEE/IEEEFrontiersinEducationConference,13–18.Mirriahi, N., Gašević, D., Long, P., & Dawson, S. (2014). Scientometrics as an important tool for the
growthofthefieldoflearninganalytics.JournalofLearningAnalytics,1(2),1–4.Retrievedfrom
https://epress.lib.uts.edu.au/journals/index.php/JLA/article/view/4116
Mitchell,T.M.(2015).Generativeanddiscriminativeclassifiers:NaïveBayesand logisticregression. In
Machine Learning, 2nd ed., McGraw Hill. Retrieved from
http://www.cs.cmu.edu/~tom/mlbook/NBayesLogReg.pdf
Mooney, O., Patterson, V., O’Connor, M., & Chantler, A. (2010). A Study of Progression in HigherEducation: A Report by the Higher Education Authority (Technical report). Higher EducationAuthority, Ireland. Retrieved from
http://www.hea.ie/sites/default/files/study_of_progression_in_irish_higher_education_2010.p
df
Moran,M. A., & Crowley,M. J. (1979). The leaving certificate and first year university performance.
JournalofStatisticalandSocialEnquiryinIreland,24(1),231–266.Naderi, H., Abdullah, H. T., Sharir, J., & Kumar, V. (2009). Creativity, age and gender as predictors of
academicachievementamongundergraduatestudents.JournalofAmericanScience,5(5),101–112.
Ng, A. Y.,& Jordon,M. I. (2001).On discriminative vs. generative classifiers: A comparison of logistic
regression and naïve Bayes. Proceedings of the 15th Conference on Advances in NeuralInformationProcessingSystems(NIPS2001),pp.841–848.
OECD. (2013). Education At a Glance 2013: OECD Indicators. OECD Publishing. Retrieved from
http://dx.doi.org/10.1787/eag-2013-en
Patterson, V., Carroll, D., & Harvey, V. (2014).HEA Key Facts and Figures: Higher Education 2012/13(Technical report). Higher Education Authority, Ireland. Retrieved from
http://www.hea.ie/sites/default/files/key_facts_and_figures_2012-13.pdf
Pérez-Martínez,J.E.,García-García,M.J.,Perdomo,W.H.,&Villamide-Díaz,M.J.(2009).Analysisofthe
resultsofthecontinuousassessmentintheadaptationoftheUniversidadPolitécnicadeMadrid
to the European Higher Education Area. In R. Hadgraft & L.Mann (Eds.), Proceedings of theResearch in Engineering Education Symposium (REES2009). Retrieved from
http://rees2009.pbworks.com/f/rees2009_submission_46.pdf
Pintrich, P., Smith, D., Garcia, T., & McKeachie, W. (1991). A Manual for the Use of the MotivatedStrategies for Learning Questionnaire. [Technical Report 91-B-004]. The Regents of theUniversityofMichigan.Retrievedfromhttp://files.eric.ed.gov/fulltext/ED338122.pdf
Provost, F., Jensen,D.,&Oates, T. (1999). Efficient progressive sampling.Proceedings of the 5th ACMSIGKDD International Conference on KnowledgeDiscovery andDataMining (KDD ’99), 23–31.http://dx.doi.org/10.1145/312129.312188
Rice,J.A.(1995).Mathematicalstatisticsanddataanalysis,2nded.Belmont,CA:DuxburyPress.
Robbins,S.B.,Lauver,K.,Le,H.,Davis,D.,&Langley,R.(2004).Dopsychosocialandstudyskillfactors
predict college outcomes? A meta-analysis. Psychological Bulletin, 130(2), 261–288.

(2016).Learningfactormodelsofstudentsatriskoffailingintheearlystageoftertiaryeducation.JournalofLearningAnalytics,3(2),330–372.http://dx.doi.org/10.18608/jla.2016.32.20
ISSN1929-7750(online).TheJournalofLearningAnalyticsworksunderaCreativeCommonsLicense,Attribution-NonCommercial-NoDerivs3.0Unported(CCBY-NC-ND3.0) 365
http://dx.doi.org10.1037/0033-2909.130.2.261
Romero,C.,Ventura,S.,Espejo,P.G.,&Hervás,C.(2008).Dataminingalgorithmstoclassifystudents.In
R.S.J.d.Baker,T.Barnes,&J.E.Beck(Eds.),Proceedingsofthe1stInternationalConferenceonEducational Data Mining (EDM 2008), 8–17. Retrieved from
http://www.educationaldatamining.org/conferences/index.php/EDM/2008/paper/download/75
6/722
Roll, I., & Winne, P. (2015). Understanding, evaluating, and supporting self-regulated learning using
learning analytics. Journal of Learning Analytics, 2(1), pp. 7–12. Retrieved from
https://epress.lib.uts.edu.au/journals/index.php/JLA/article/view/4491
Sachin, B. R., & Vijay, S. M. (2012). A survey and future vision of data mining in educational field.
Proceedings of the 2nd International Conference on Advanced Computing CommunicationTechnologies(ACCT12),(pp.96–100).http://dx.doi.org/10.1109/ACCT.2012.14
Shute,V.,&Ventura,M.(2013).Stealthassessment:Measuringandsupportinglearninginvideogames.Cambridge,Massachussets:MITPress.
Siemens, G. (2012). Learning analytics: Envisioning a research discipline and a domain of practice.
Proceedingsofthe2ndInternationalConferenceonLearningAnalyticsandKnowledge(LAKʼ12),4–8.http://dx.doi.org/10.1145/2330601.2330605
Siemens, G., & Baker, R. S. J. d. (2012). Learning analytics and educational data mining: Towards
communicationandcollaboration.Proceedingsof the2nd InternationalConferenceonLearningAnalyticsandKnowledge(LAKʼ12),252–254.http://dx.doi.org/10.1145/2330601.2330661
Sins,P.H.M.,vanJoolingen,W.R.,Savelsbergh,E.R.,&vanHout-Wolters,B. (2008).Motivationand
performancewithinacollaborativecomputer-basedmodelingtask:Relationsbetweenstudents’
achievement goal orientation, self-efficacy, cognitive processing, and achievement.
Contemporary Educational Psychology, 33(1), 58–77.
http://dx.doi.org/10.1016/j.cedpsych.2006.12.004
Smith,Z.R.,&Wells,C.S.(2006).Centrallimittheoremandsamplesize.Paperpresentedattheannual
meeting of the Northeastern Educational Research Association, 18–20 October 2006,
Kerhonkson, New York. Retrieved from
http://www.umass.edu/remp/Papers/Smith&Wells_NERA06.pdf
Steel, P., & Konig, C. J. (2006). Integrating theories ofmotivation.Academy ofManagement Review,31(4),889–913.http://dx.doi.org/10.5465/AMR.2006.22527462
Superby, J. F., Vandamme, J. P., & Meskens, N. (2006). Determination of factors influencing the
achievementofthefirst-yearuniversitystudentsusingdataminingmethods.ProceedingsoftheWorkshoponEducationalDataMiningatthe8thInternationalConferenceonIntelligentTutoringSystems (ITS 2006), 37–44. Retrieved from
http://www.educationaldatamining.org/IEDMS/sites/default/files/files/EDMITS2006/superby.p
df
Swanberg, A. B., & Martinsen, Ø. L. (2010). Personality, approaches to learning and achievement.
EducationalPsychology,30(1),75–88.http://dx.doi.org/10.1080/01443410903410474Tavakol,M.,&Dennick,R. (2011).MakingsenseofCronbach’sAlpha. International JournalofMedical
(2016).Learningfactormodelsofstudentsatriskoffailingintheearlystageoftertiaryeducation.JournalofLearningAnalytics,3(2),330–372.http://dx.doi.org/10.18608/jla.2016.32.20
ISSN1929-7750(online).TheJournalofLearningAnalyticsworksunderaCreativeCommonsLicense,Attribution-NonCommercial-NoDerivs3.0Unported(CCBY-NC-ND3.0) 366
Education,2,53–55.http://dx.doi.org/10.5116/ijme.4dfb.8dfd
Tempelaar,D.T.,Cuypers,H.,vandeVrie,E.,Heck,A.,&vanderKooij,H.(2013).Formativeassessment
andlearninganalytics.Proceedingsofthe3rdInternationalConferenceonLearningAnalyticsandKnowledge(LAK’13),205–209.http://dx.doi.org/10.1145/2460296.2460337
Thai-Nghe,N. Janecek, P.,&Haddawy, P. (2007). A comparative analysis of techniques for predicting
academic performance. Proceedings of the 37th ASEE/IEEE Frontiers in Education Conference,10–13October2007,Milwaukee,WI,USA(pp.T2G-7–T2G-12).
Tinto, V. (2006). Research and practice of student retention: What next? Journal of College StudentRetention,8(1),1–19.http://dx.doi.org/10.2190/4YNU-4TMB-22DJ-AN4W
Tishman, S., Jay, E., & Perkins, D. N. (1993). Teaching thinking disposition: From transmission to
enculturation. Theory into Practice, 32(3), 147–153.
http://dx.doi.org/10.1080/00405849309543590
Volet,S.E. (1996).Cognitiveandaffectivevariables inacademic learning:Thesignificanceofdirection
and effort in students’ goals. Learning and Instruction, 7(3), 235–254.
http://dx.doi.org/10.1016/S0959-4752(96)00027-8
Weiss,G.M.(2004).Miningwithrarity:Aunifyingframework.SIGKDDExplorations,6(1),7–19.Wigfield,A.,Eccles,J.S.,&Pintrich,P.(1996).Handbookofeducationalpsychology(pp.148–185).New
York:Simon&Schuster/Macmillan.
Winters, F. I., Greene, J. A., & Costich, C. M. (2008). Self-regulated learning within computer-based
learning environments a critical analysis. Educational Psychology Review, 20(4), 429–444.http://dx.doi.org/10.1007/s10648-008-9080-9
Wise,A.F.,&Shaffer,D.W.(2015).Whytheorymattersmorethaneverintheageofbigdata.Journal
ofLearningAnalytics,2(2),5–13.http://dx.doi.org/10.18608/jla.2015.22.2
Yang, J., & Honavar, V. (1998). Feature subset selection using a genetic algorithm. IEEE IntelligentSystems,13(2),44–49.
Zimmerman,B.J.(1990).Self-regulatedlearningandacademicachievement:Anoverview.EducationalPsychologist,25(1),3–17.http://dx.doi.org/10.1207/s15326985ep2501_2
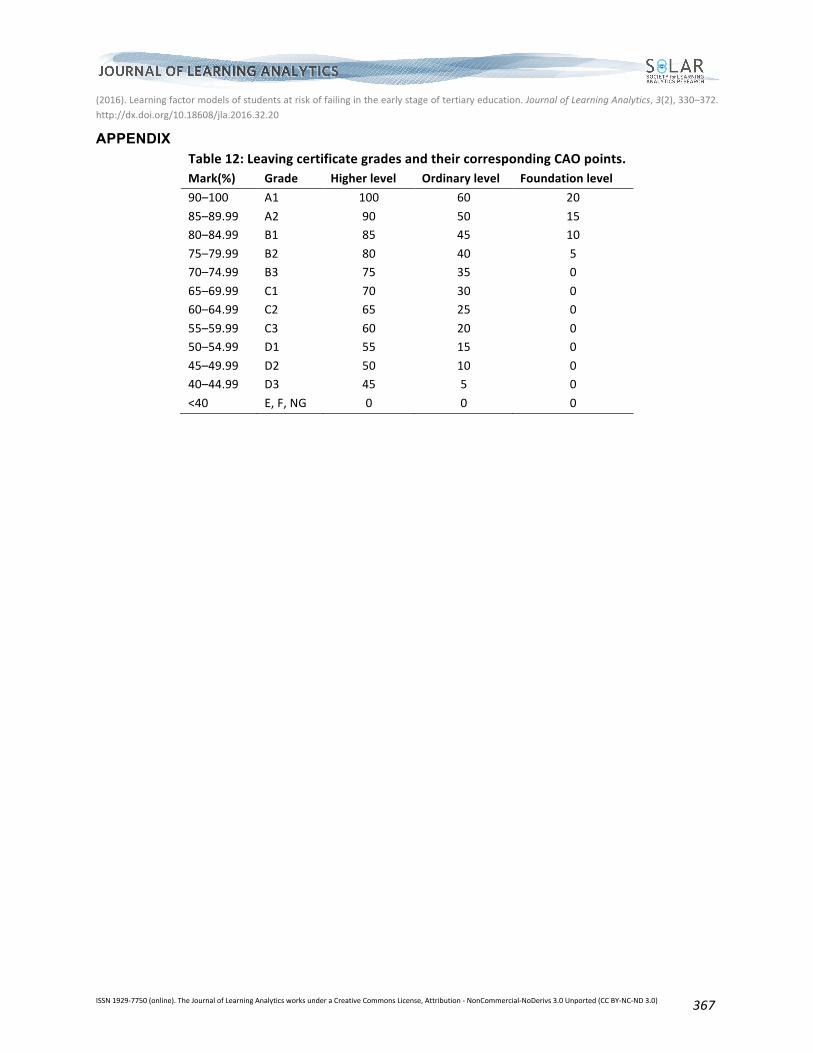
(2016).Learningfactormodelsofstudentsatriskoffailingintheearlystageoftertiaryeducation.JournalofLearningAnalytics,3(2),330–372.http://dx.doi.org/10.18608/jla.2016.32.20
ISSN1929-7750(online).TheJournalofLearningAnalyticsworksunderaCreativeCommonsLicense,Attribution-NonCommercial-NoDerivs3.0Unported(CCBY-NC-ND3.0) 367
APPENDIX Table12:LeavingcertificategradesandtheircorrespondingCAOpoints.
Mark(%) Grade Higherlevel Ordinarylevel Foundationlevel
90–100 A1 100 60 20
85–89.99 A2 90 50 15
80–84.99 B1 85 45 10
75–79.99 B2 80 40 5
70–74.99 B3 75 35 0
65–69.99 C1 70 30 0
60–64.99 C2 65 25 0
55–59.99 C3 60 20 0
50–54.99 D1 55 15 0
45–49.99 D2 50 10 0
40–44.99 D3 45 5 0
<40 E,F,NG 0 0 0

(2016).Learningfactormodelsofstudentsatriskoffailingintheearlystageoftertiaryeducation.JournalofLearningAnalytics,3(2),330–372.http://dx.doi.org/10.18608/jla.2016.32.20
ISSN1929-7750(online).TheJournalofLearningAnalyticsworksunderaCreativeCommonsLicense,Attribution-NonCommercial-NoDerivs3.0Unported(CCBY-NC-ND3.0) 368
Table13:GroupdifferencesbyGPAband.
StudyFactor Range 2.5<GPA≤4 2.0≤GPA<2.5 0≤GPA<2 p
n=558 n=190 n=459
CAOpoints [0,600] 223.5±137.1 221.1±117.6 212.2±91.4 ***Leavingcertaverage [0,100] 33.4±20.6 33.1±17.4 30.9±13.5 ***Mathematics [0,100] 21.6±17.1 21.4±15.4 17.1±13.1 ***English [0,100] 39.1±26.3 40.6±24.0 38.3±21.0 ***Appliedaverage [0,100] 24.8±29.4 26.4±28.6 27.4±26.3 Methodicalaverage [0,100] 29.1±20.8 28.8±18.2 23.8±14.7 ***Humanitiesaverage [0,100] 34.2±22.3 34.0±19.0 33.0±15.7 ***Conscientiousness [0,10] 6.2±1.5 5.8±1.4 5.7±1.6 ***Openness [0,10] 6.2±1.3 5.9±1.2 6.0±1.4 **Self-efficacy [0,10] 7.0±1.4 6.9±1.3 6.7±1.5 ***Extrinsicgoals [0,10] 8.0±1.3 7.8±1.3 7.6±1.4 ***Intrinsicgoals [0,10] 7.3±1.3 6.9±1.4 6.9±1.4 ***MCself-regulation [0,10] 6.0±1.3 5.9±1.3 5.7±1.4 **Studyeffort [0,10] 6.2±1.7 5.9±1.7 5.6±1.8 ***Studytime [0,10] 6.3±2.2 6.4±2.3 5.9±2.4 *Deeplearner [0,10] 6.0±2.9 5.3±2.8 4.7±2.8 ***Shallowlearner [0,10] 1.0±1.8 1.4±1.9 1.7±2.1 ***Strategiclearner [0,10] 3.1±2.4 3.5±2.5 3.8±2.5 ***Gender [0,10] 0.4±0.5 0.5±0.5 0.3±0.5 ***Groupwork [0,10] 6.2±3.5 7.2±2.9 6.8±3.3 ***Age [0,10] 25.1±8.4 22.5±6.7 21.4±5.5 ***Visual [0,10] 7.3±2.0 7.3±2.0 7.0±2.1 Auditory [0,10] 3.2±2.2 3.0±2.0 3.1±2.2 Kinaesthetic [0,10] 4.5±2.4 4.7±2.3 4.9±2.4 *
MC=Metacognitive;*p<0.05;**p<0.01;***p<0.001;Coloursdifferentiateheatmapscales.
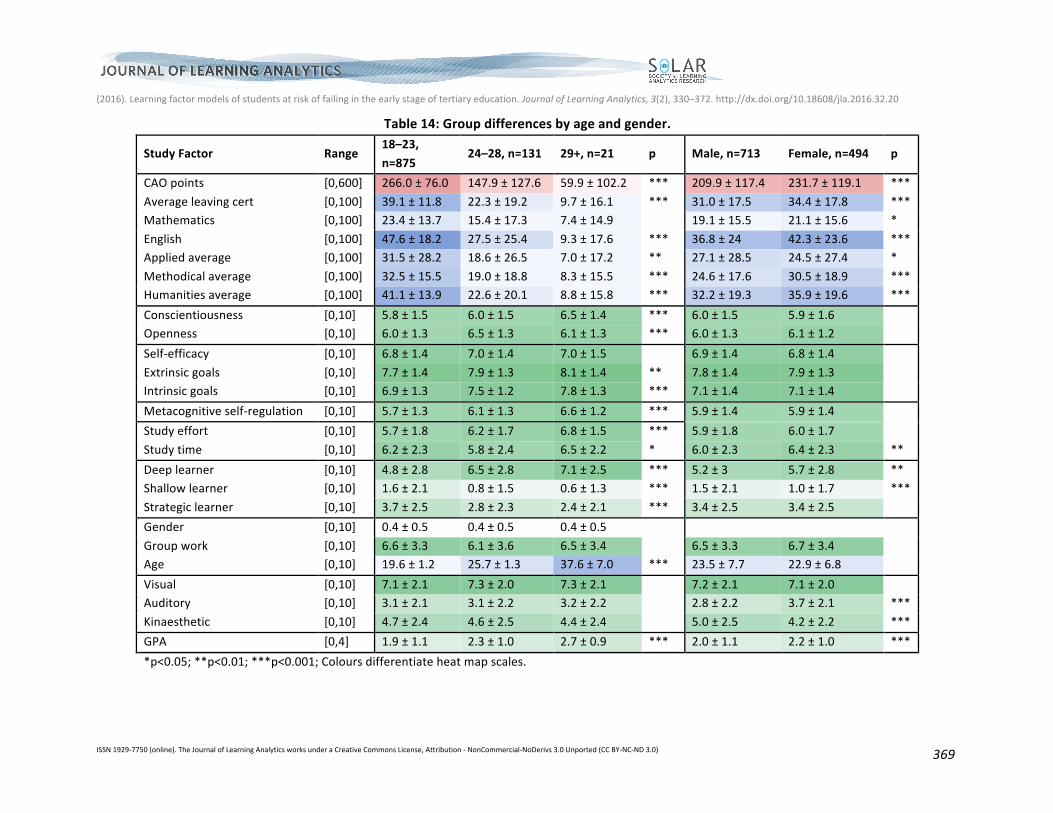
(2016).Learningfactormodelsofstudentsatriskoffailingintheearlystageoftertiaryeducation.JournalofLearningAnalytics,3(2),330–372.http://dx.doi.org/10.18608/jla.2016.32.20
ISSN1929-7750(online).TheJournalofLearningAnalyticsworksunderaCreativeCommonsLicense,Attribution-NonCommercial-NoDerivs3.0Unported(CCBY-NC-ND3.0)
369
Table14:Groupdifferencesbyageandgender.
StudyFactor Range18–23,n=875
24–28,n=131 29+,n=21 p Male,n=713 Female,n=494 p
CAOpoints [0,600] 266.0±76.0 147.9±127.6 59.9±102.2 *** 209.9±117.4 231.7±119.1 ***
Averageleavingcert [0,100] 39.1±11.8 22.3±19.2 9.7±16.1 *** 31.0±17.5 34.4±17.8 ***
Mathematics [0,100] 23.4±13.7 15.4±17.3 7.4±14.9
19.1±15.5 21.1±15.6 *
English [0,100] 47.6±18.2 27.5±25.4 9.3±17.6 *** 36.8±24 42.3±23.6 ***
Appliedaverage [0,100] 31.5±28.2 18.6±26.5 7.0±17.2 ** 27.1±28.5 24.5±27.4 *
Methodicalaverage [0,100] 32.5±15.5 19.0±18.8 8.3±15.5 *** 24.6±17.6 30.5±18.9 ***
Humanitiesaverage [0,100] 41.1±13.9 22.6±20.1 8.8±15.8 *** 32.2±19.3 35.9±19.6 ***
Conscientiousness [0,10] 5.8±1.5 6.0±1.5 6.5±1.4 *** 6.0±1.5 5.9±1.6
Openness [0,10] 6.0±1.3 6.5±1.3 6.1±1.3 *** 6.0±1.3 6.1±1.2
Self-efficacy [0,10] 6.8±1.4 7.0±1.4 7.0±1.5 6.9±1.4 6.8±1.4
Extrinsicgoals [0,10] 7.7±1.4 7.9±1.3 8.1±1.4 ** 7.8±1.4 7.9±1.3
Intrinsicgoals [0,10] 6.9±1.3 7.5±1.2 7.8±1.3 *** 7.1±1.4 7.1±1.4
Metacognitiveself-regulation [0,10] 5.7±1.3 6.1±1.3 6.6±1.2 *** 5.9±1.4 5.9±1.4
Studyeffort [0,10] 5.7±1.8 6.2±1.7 6.8±1.5 *** 5.9±1.8 6.0±1.7
Studytime [0,10] 6.2±2.3 5.8±2.4 6.5±2.2 * 6.0±2.3 6.4±2.3 **
Deeplearner [0,10] 4.8±2.8 6.5±2.8 7.1±2.5 *** 5.2±3 5.7±2.8 **
Shallowlearner [0,10] 1.6±2.1 0.8±1.5 0.6±1.3 *** 1.5±2.1 1.0±1.7 ***
Strategiclearner [0,10] 3.7±2.5 2.8±2.3 2.4±2.1 *** 3.4±2.5 3.4±2.5
Gender [0,10] 0.4±0.5 0.4±0.5 0.4±0.5
Groupwork [0,10] 6.6±3.3 6.1±3.6 6.5±3.4
6.5±3.3 6.7±3.4
Age [0,10] 19.6±1.2 25.7±1.3 37.6±7.0 *** 23.5±7.7 22.9±6.8
Visual [0,10] 7.1±2.1 7.3±2.0 7.3±2.1 7.2±2.1 7.1±2.0
Auditory [0,10] 3.1±2.1 3.1±2.2 3.2±2.2
2.8±2.2 3.7±2.1 ***
Kinaesthetic [0,10] 4.7±2.4 4.6±2.5 4.4±2.4 5.0±2.5 4.2±2.2 ***
GPA [0,4] 1.9±1.1 2.3±1.0 2.7±0.9 *** 2.0±1.1 2.2±1.0 ***
*p<0.05;**p<0.01;***p<0.001;Coloursdifferentiateheatmapscales.
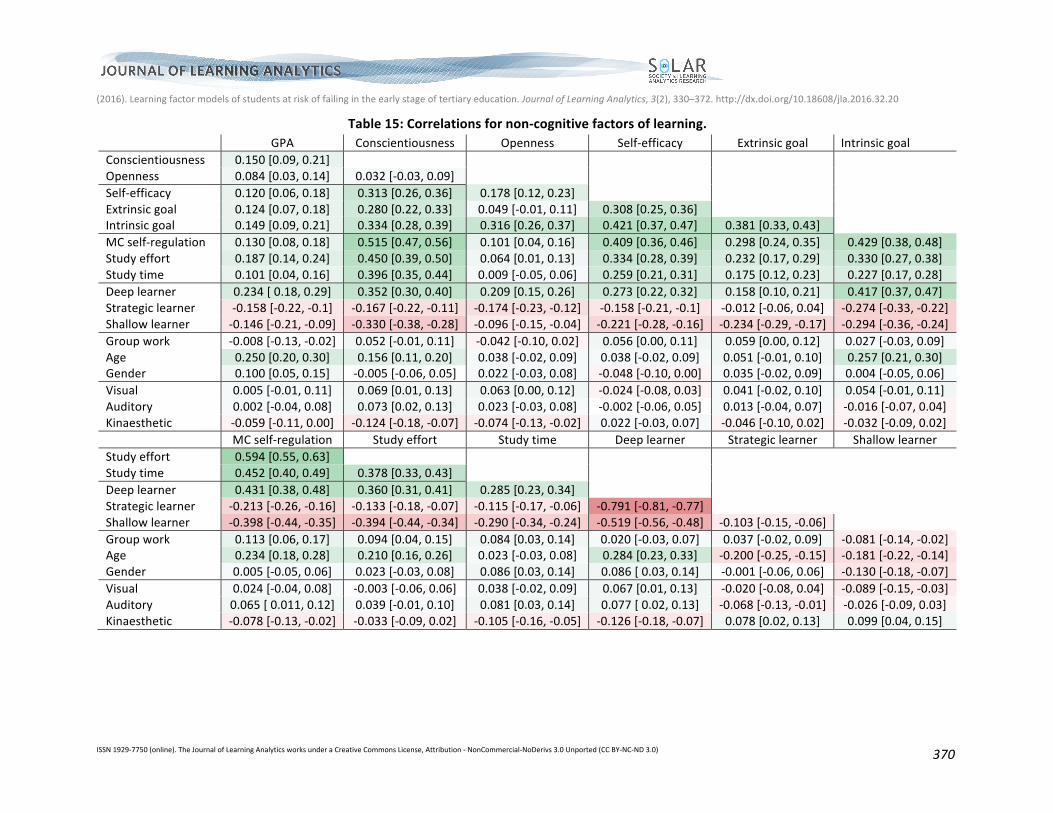
(2016).Learningfactormodelsofstudentsatriskoffailingintheearlystageoftertiaryeducation.JournalofLearningAnalytics,3(2),330–372.http://dx.doi.org/10.18608/jla.2016.32.20
ISSN1929-7750(online).TheJournalofLearningAnalyticsworksunderaCreativeCommonsLicense,Attribution-NonCommercial-NoDerivs3.0Unported(CCBY-NC-ND3.0)
370
Table15:Correlationsfornon-cognitivefactorsoflearning. GPA Conscientiousness Openness Self-efficacy Extrinsicgoal IntrinsicgoalConscientiousness 0.150[0.09,0.21] Openness 0.084[0.03,0.14] 0.032[-0.03,0.09] Self-efficacy 0.120[0.06,0.18] 0.313[0.26,0.36] 0.178[0.12,0.23] Extrinsicgoal 0.124[0.07,0.18] 0.280[0.22,0.33] 0.049[-0.01,0.11] 0.308[0.25,0.36] Intrinsicgoal 0.149[0.09,0.21] 0.334[0.28,0.39] 0.316[0.26,0.37] 0.421[0.37,0.47] 0.381[0.33,0.43] MCself-regulation 0.130[0.08,0.18] 0.515[0.47,0.56] 0.101[0.04,0.16] 0.409[0.36,0.46] 0.298[0.24,0.35] 0.429[0.38,0.48]Studyeffort 0.187[0.14,0.24] 0.450[0.39,0.50] 0.064[0.01,0.13] 0.334[0.28,0.39] 0.232[0.17,0.29] 0.330[0.27,0.38]Studytime 0.101[0.04,0.16] 0.396[0.35,0.44] 0.009[-0.05,0.06] 0.259[0.21,0.31] 0.175[0.12,0.23] 0.227[0.17,0.28]Deeplearner 0.234[0.18,0.29] 0.352[0.30,0.40] 0.209[0.15,0.26] 0.273[0.22,0.32] 0.158[0.10,0.21] 0.417[0.37,0.47]Strategiclearner -0.158[-0.22,-0.1] -0.167[-0.22,-0.11] -0.174[-0.23,-0.12] -0.158[-0.21,-0.1] -0.012[-0.06,0.04] -0.274[-0.33,-0.22]Shallowlearner -0.146[-0.21,-0.09] -0.330[-0.38,-0.28] -0.096[-0.15,-0.04] -0.221[-0.28,-0.16] -0.234[-0.29,-0.17] -0.294[-0.36,-0.24]Groupwork -0.008[-0.13,-0.02] 0.052[-0.01,0.11] -0.042[-0.10,0.02] 0.056[0.00,0.11] 0.059[0.00,0.12] 0.027[-0.03,0.09]Age 0.250[0.20,0.30] 0.156[0.11,0.20] 0.038[-0.02,0.09] 0.038[-0.02,0.09] 0.051[-0.01,0.10] 0.257[0.21,0.30]Gender 0.100[0.05,0.15] -0.005[-0.06,0.05] 0.022[-0.03,0.08] -0.048[-0.10,0.00] 0.035[-0.02,0.09] 0.004[-0.05,0.06]Visual 0.005[-0.01,0.11] 0.069[0.01,0.13] 0.063[0.00,0.12] -0.024[-0.08,0.03] 0.041[-0.02,0.10] 0.054[-0.01,0.11]Auditory 0.002[-0.04,0.08] 0.073[0.02,0.13] 0.023[-0.03,0.08] -0.002[-0.06,0.05] 0.013[-0.04,0.07] -0.016[-0.07,0.04]Kinaesthetic -0.059[-0.11,0.00] -0.124[-0.18,-0.07] -0.074[-0.13,-0.02] 0.022[-0.03,0.07] -0.046[-0.10,0.02] -0.032[-0.09,0.02] MCself-regulation Studyeffort Studytime Deeplearner Strategiclearner ShallowlearnerStudyeffort 0.594[0.55,0.63] Studytime 0.452[0.40,0.49] 0.378[0.33,0.43] Deeplearner 0.431[0.38,0.48] 0.360[0.31,0.41] 0.285[0.23,0.34] Strategiclearner -0.213[-0.26,-0.16] -0.133[-0.18,-0.07] -0.115[-0.17,-0.06] -0.791[-0.81,-0.77] Shallowlearner -0.398[-0.44,-0.35] -0.394[-0.44,-0.34] -0.290[-0.34,-0.24] -0.519[-0.56,-0.48] -0.103[-0.15,-0.06] Groupwork 0.113[0.06,0.17] 0.094[0.04,0.15] 0.084[0.03,0.14] 0.020[-0.03,0.07] 0.037[-0.02,0.09] -0.081[-0.14,-0.02]Age 0.234[0.18,0.28] 0.210[0.16,0.26] 0.023[-0.03,0.08] 0.284[0.23,0.33] -0.200[-0.25,-0.15] -0.181[-0.22,-0.14]Gender 0.005[-0.05,0.06] 0.023[-0.03,0.08] 0.086[0.03,0.14] 0.086[0.03,0.14] -0.001[-0.06,0.06] -0.130[-0.18,-0.07]Visual 0.024[-0.04,0.08] -0.003[-0.06,0.06] 0.038[-0.02,0.09] 0.067[0.01,0.13] -0.020[-0.08,0.04] -0.089[-0.15,-0.03]Auditory 0.065[0.011,0.12] 0.039[-0.01,0.10] 0.081[0.03,0.14] 0.077[0.02,0.13] -0.068[-0.13,-0.01] -0.026[-0.09,0.03]Kinaesthetic -0.078[-0.13,-0.02] -0.033[-0.09,0.02] -0.105[-0.16,-0.05] -0.126[-0.18,-0.07] 0.078[0.02,0.13] 0.099[0.04,0.15]

(2016).Learningfactormodelsofstudentsatriskoffailingintheearlystageoftertiaryeducation.JournalofLearningAnalytics,3(2),330–372.http://dx.doi.org/10.18608/jla.2016.32.20
ISSN1929-7750(online).TheJournalofLearningAnalyticsworksunderaCreativeCommonsLicense,Attribution-NonCommercial-NoDerivs3.0Unported(CCBY-NC-ND3.0)
371
Groupwork Age Gender Visual Auditory Age -0.022[-0.08,0.03] Gender 0.026[-0.03,0.08] -0.038[-0.09,0.02] Visual 0.021[-0.04,0.08] -0.038[-0.09,0.02] -0.046[-0.10,0.01] Auditory -0.097[-0.15,-0.04] 0.025[-0.03,0.08] 0.205[0.15,0.26] -0.347[-0.40,-0.29] Kinaesthetic 0.069[0.01,0.12] -0.055[-0.11,0.00] -0.144[-0.20,-0.09] -0.541[-0.58,-0.50] -0.601[-0.64,-0.57] MC:Metacognitive;Intervalsare95%ConfidenceIntervalsbasedon1,999bootstrapsamples.

(2016).Learningfactormodelsofstudentsatriskoffailingintheearlystageoftertiaryeducation.JournalofLearningAnalytics,3(2),330–372.http://dx.doi.org/10.18608/jla.2016.32.20
ISSN1929-7750(online).TheJournalofLearningAnalyticsworksunderaCreativeCommonsLicense,Attribution-NonCommercial-NoDerivs3.0Unported(CCBY-NC-ND3.0)
372
Table16:CorrelationswithGPAbysub-group.
Prioracademicperformance Personality Motivation Self-regulation
LearningApproach
Other Modality
Sub-groupMeanage n CAOMathsEnglish
Method-ical
Human-ities Applied Con Open SE EM IM SR StE StT Deep Stra Shal Group Age Gen Vis Aud Kin
all 23 1207 0.29 0.27 0.17 0.30 0.23 0.17 0.15 0.08 0.12 0.12 0.15 0.13 0.19 0.10 0.23 -0.15-0.14 -0.08 0.25 0.10 0.05 0.02 -0.05B-all 21 402 0.35 0.31 0.26 0.30 0.33 0.25 0.21 -0.02 0.08 0.15 0.08 0.11 0.19 0.12 0.18 -0.14-0.05 -0.03 0.21 -0.02 0.08 -0.04-0.03BGen 21 183 0.26 0.23 0.25 0.22 0.26 0.17 0.23 0.09 0.16 0.21 0.12 0.17 0.20 0.10 0.19 -0.08-0.16 -0.05 0.14 0.10 0.15 0.04 -0.17BwIT 22 60 0.55 0.52 0.31 0.51 0.34 0.33 0.26 -0.11 -0.01 0.32 -0.03 0.21 0.46 0.13 0.20 -0.16-0.09 -0.15 0.34 -0.07-0.05-0.15 0.16BInt 21 64 0.36 0.26 0.09 0.22 0.38 0.15 0.18 -0.38 -0.08 0.09 0.07 0.09 0.12 0.04 0.26 -0.24-0.07 -0.04 0.29 -0.12-0.01-0.05 0.05Sports 23 95 0.26 0.26 0.30 0.26 0.24 0.22 0.17 0.02 0.05 -0.02 0.05 -0.05 0.05 0.28 0.00 -0.08 0.11 0.05 0.10 0.05 0.04 0.02 -0.06C-all 24 239 0.18 0.24 -0.03 0.22 0.06 0.10 0.18 0.15 0.12 0.13 0.21 0.14 0.16 0.12 0.29 -0.13-0.29 -0.09 0.28 0.14 0.09 0.01 -0.08IT 24 137 -0.02 0.16 -0.27 0.11 -0.12 -0.02 0.28 0.18 0.18 0.18 0.34 0.29 0.21 0.16 0.37 -0.19-0.32 -0.14 0.42 0.13 0.21 -0.06-0.12CDM 23 102 0.09 0.26 -0.08 0.19 -0.01 0.09 0.10 -0.01 0.02 0.18 0.09 0.10 0.21 0.08 0.22 -0.11-0.19 0.01 0.09 0.00 -0.07 0.08 0.00E-all 22 172 0.19 0.29 -0.03 0.26 0.14 0.08 0.14 0.10 0.26 0.14 0.29 0.21 0.25 0.11 0.37 -0.28-0.23 -0.19 0.51 0.04 0.05 0.04 -0.07EngC 20 73 0.26 0.13 0.03 0.11 0.14 0.20 0.18 0.05 0.21 0.26 0.24 0.22 0.15 0.08 0.36 -0.28-0.18 0.06 0.41 0.11 0.24 0.10 -0.26Elec 22 52 0.32 0.44 -0.08 0.43 0.28 0.00 0.35 0.28 0.42 0.21 0.48 0.31 0.35 0.23 0.48 -0.47-0.24 -0.06 0.39 0.09 0.03 0.01 -0.04Mech 21 27 0.10 0.30 -0.01 0.21 0.06 -0.04 0.24 0.02 0.42 0.06 0.19 0.15 0.30 0.27 0.20 -0.03-0.27 -0.16 0.27 0.08 -0.21 0.06 0.14SECT 27 20 0.23 0.49 0.15 0.38 0.19 0.12 0.08 0.25 0.63 0.34 0.60 0.50 0.55 0.34 0.65 -0.33-0.58 -0.17 0.68 -0.23 0.06 0.05 -0.11Hort 28 41 0.07 0.15 -0.09 0.19 0.01 0.24 -0.21-0.02 0.02 0.09 0.12 0.00 -0.03 -0.15 0.05 -0.15 0.13 -0.14 0.19 0.18 0.05 -0.39 0.30H-all 25 353 0.25 0.21 0.24 0.26 0.27 0.12 0.05 0.02 0.05 0.09 0.01 0.08 0.15 0.06 0.07 -0.05-0.04 0.01 0.03 -0.03 0.05 0.00 -0.04ASC 28 146 0.22 0.28 0.28 0.22 0.23 0.20 -0.09-0.06 0.04 0.00 -0.08 -0.07 0.07 0.00 0.05 -0.04-0.03 -0.11 -0.01 0.03 0.02 -0.05 0.02EC&E 22 80 0.44 0.30 0.37 0.32 0.43 0.23 0.19 0.03 0.09 0.19 0.14 0.18 0.15 0.26 -0.06 0.14 -0.10 -0.04 -0.19-0.02-0.07 0.08 -0.03SCD 25 127 0.27 0.17 0.21 0.31 0.29 0.02 0.14 0.02 0.04 0.14 0.03 0.18 0.22 0.09 0.14 -0.14-0.03 0.09 0.05 -0.07 0.15 0.01 -0.16Age[18,23] 20 852 0.44 0.31 0.29 0.38 0.37 0.03 0.14 0.08 0.10 0.12 0.10 0.08 0.14 0.10 0.19 -0.10-0.13 -0.06 0.12 0.19 0.00 0.05 -0.05Age[24,28] 25 154 0.16 0.26 0.07 0.26 0.06 0.06 -0.02-0.04 0.13 0.01 0.04 0.06 0.07 0.10 0.14 -0.14-0.03 -0.09 0.00 0.08 0.14 -0.02-0.10Age[29,60] 38 201 0.17 0.05 0.07 0.00 0.04 0.30 0.06 0.11 0.12 0.13 0.05 0.02 0.19 0.10 0.06 -0.09 0.04 -0.16 -0.08-0.19 0.12 -0.12 0.01Male 24 713 0.26 0.27 0.12 0.28 0.20 0.02 0.19 0.14 0.23 0.15 0.25 0.19 0.25 0.12 0.33 -0.23-0.20 -0.07 0.33
0.09 -0.01-0.07
Female 23 494 0.30 0.27 0.21 0.29 0.25 0.05 0.10 -0.01 -0.06 0.07 -0.02 0.03 0.08 0.04 0.05 -0.05 0.00 -0.11 0.12
-0.01 0.02 -0.01Con=Conscientiousness;Open=Openness;SE=Self-efficacy;IM=Intrinsicgoalorientation;EM=Extrinsicgoalorientation;SR=Metacognitiveself-regulation;StE=Studyeffort;StT=Studytime;Deep=Deep learner;Shal=Shallow learner;Stra=Strategic learner;Group=Likestowork ingroups;Gen=Gender;Vis=Visual learner;Aud=Auditory learner;Kin=Kinaesthetic learner; B-all=all Business students; BGen=Business General; BwIT=Business with IT; BInt=International Business; Sport=Sports Management; C=all=allComputing students; IT=Computing(IT); CDM=Creative Digital Media; Eng=all=all Engineering students; EngC=Engineering Common Entry; Elec=Electrical & ComputerEngineering;Mech=Mechatronics;SECT=SustainableElectricalandControlTechnology;Ho=Horticulture;H-all=allHumanitiesstudents;ACS=AppliedSocialCare;EC&E=EarlyChildcare&Education;SCD=Social&CommunityDevelopment.