learning d3.js data visualization - second edition - sample chapter
TRANSCRIPT
C o m m u n i t y E x p e r i e n c e D i s t i l l e d
Inject new life into your data by creating compelling visualizations with d3.js
Learning d3.js Data VisualizationSecond Edition
Ændrew
Rininsland
Sw
izec Teller
Learning d3.js Data VisualizationSecond EditionD3.js has emerged as one of the leading platforms to develop beautiful, interactive visualizations over the Web. We begin by setting up a strong foundation, then build on this foundation. The book will take you through the entire world of reimagining data using interactive, animated visualizations created in D3.js.
In addition to covering the various features of D3.js in order to build a wide range of visualizations, we also focus on the entire process of representing data through visualizations so that developers and those interested in data visualization will get the entire process right.
We also include chapters that explore a wide range of visualizations through practical use cases. By the end of this book, you will have unlocked the mystery behind successful data visualizations and will be ready to use D3 to transform any data into a more engaging and sophisticated visualization.
Who this book is written forThis book is for web developers, data scientists, and anyone interested in representing data through interactive visualizations on the Web with D3. Some basic JavaScript knowledge is expected, but no prior experience with data visualization or D3 is required to use this book.
$ 39.99 US£ 25.99 UK
Prices do not include local sales tax or VAT where applicable
Ændrew RininslandSwizec Teller
What you will learn from this book
Gain a solid understanding of the common D3 development idioms
Be able to input data, transform it, and output it as a visualization
Add simple effects and user interactions to a visualization
Find out how to write basic D3 code for server using Node.js
Automate testing visualizations using Mocha
Achieve fl uency in ES2016, the most modern version of JavaScript
Learning d3.js Data Visualization
Second Edition
P U B L I S H I N GP U B L I S H I N G
community experience dist i l led
Visit www.PacktPub.com for books, eBooks, code, downloads, and PacktLib.
Free Sample

In this package, you will find: The authors biography
A preview chapter from the book, Chapter 1 'Getting Started with D3, ES2016,
and Node.js'
A synopsis of the book’s content
More information on Learning d3.js Data Visualization Second Edition
About the Authors
Ændrew Rininsland is a developer and journalist who has spent much of the last half-decade building interactive content for newspapers such as The Times, Sunday Times, The Economist, and The Guardian. During his 3 years at The Times and Sunday Times, he worked on all kinds of editorial projects, ranging from obituaries of fi gures such as Nelson Mandela to high-profi le data-driven investigations such as The Doping Scandal, the largest leak of sporting blood test data in history.
A prolifi c open source developer, Ændrew has released many kinds of projects, ranging from small utility libraries such as Doctop (which allow the creation of live-updating datasets using Google Docs) to big charting tools such as AxisJS. He is also a co-maintainer of C3.js, a widely used abstraction of D3 that greatly speeds up the creation of several basic chart types, and GitHub.js, a library that makes it easy to interact with the GitHub API.
You can follow him on Twitter at @aendrew and on GitHub at github.com/aendrew.
Swizec Teller author of Data Visualization with d3.js, is a geek with a hat. Founding his fi rst startup at 21, he is now looking for the next big idea as a full-stack web generalist focusing on freelancing for early-stage startup companies.
When he isn't coding, he's usually blogging, writing books, or giving talks at various non-conference events in Slovenia and nearby countries. He is still looking for a chance to speak at a big international conference.
In November 2012, he started writing Why Programmers Work At Night, and set out on a quest to improve the lives of developers everywhere.
PrefaceWelcome to Learning d3.js Data Visualization, Second Edition. Over the course of this book, you'll learn the basics of one of the world's most ubiquitous and powerful data visualization libraries, but we won't stop there. By the end of our time together, you'll have all the skills you need to become a total D3 ninja, able to do everything from building visualizations from scratch to using it on the server and writing automated tests. As well, if you haven't leveled up your JavaScript skills for a while, you're in for a treat—this book endeavors to use the latest features that are currently being added to the language, all this while explaining why they're cool and how they differ from old-school JavaScript.
What this book coversChapter 1, Getting Started with D3, ES2016, and Node.js, updated and expanded in the second edition, gets you up and running with the latest tools for building data visualizations using D3.
Chapter 2, A Primer on DOM, SVG, and CSS, reviews the underlying web technologies that D3 can manipulate.
Chapter 3, Making Data Useful, teaches you how to transform data so that D3 can visualize it.
Chapter 4, Defi ning the User Experience – Animation and Interaction, updated and expanded in the second edition, is where you use animation and user interactivity to drive your data visualizations.
Chapter 5, Layouts — D3's Black Magic, updated and expanded in the second edition, teaches you how layouts can take your D3 skills to the next level by providing reusable patterns for creating complex charts.
Preface
Chapter 6, D3 on the Server with Node.js, new in the second edition, helps you build and deploy a Node.js-based web service that renders D3 using Canvas.
Chapter 7, Designing Good Data Visualizations, updated and expanded in the second edition, compares and contrasts differing approaches to data visualization while building a set of best practices.
Chapter 8, Having Confi dence in Your Visualizations, new in the second edition, shows you how to improve the quality of your code by introducing linting, static type checking, and unit testing to your projects.
[ 1 ]
Getting Started with D3, ES2016, and Node.js
In this chapter, we'll lay the foundations of what you'll need to run all the examples in the book. I'll explain how you can start writing ECMAScript 2016 (ES2016) today—which is the latest and most advanced version of JavaScript—and show you how to use Babel to transpile it to ES5, allowing your modern JavaScript to be run on any browser. We'll then cover the basics of using D3 to render a basic chart.
What is D3.js?D3 (Data-Driven Documents), developed by Mike Bostock and the D3 community since 2011, is the successor to Bostock's earlier Protovis library. It allows pixel-perfect rendering of data by abstracting the calculation of things such as scales and axes into an easy-to-use domain-specifi c language (DSL), and uses idioms that should be immediately familiar to anyone with experience of using the massively popular jQuery JavaScript library. Much like jQuery, in D3, you operate on elements by selecting them and then manipulating via a chain of modifi er functions. Especially within the context of data visualization, this declarative approach makes using it easier and more enjoyable than a lot of other tools out there. The offi cial website, https://d3js.org/, features many great examples that show off the power of D3, but understanding them is tricky at best. After fi nishing this book, you should be able to understand D3 well enough to fi gure out the examples. If you want to follow the development of D3 more closely, check out the source code hosted on GitHub at https://github.com/mbostock/d3.
Getting Started with D3, ES2016, and Node.js
[ 2 ]
The fi ne-grained control and its elegance make D3 one of the most powerful open source visualization libraries out there. This also means that it's not very suitable for simple jobs such as drawing a line chart or two—in that case you might want to use a library designed for charting. Many use D3 internally anyway. For a massive list, visit https://github.com/sorrycc/awesome-javascript#data-visualization.
As a data manipulation library, D3 is based on the principles of functional programming, which is probably where a lot of confusion stems from. Unfortunately, functional programming goes beyond the scope of this book, but I'll explain all the relevant bits to make sure that everyone's on the same page.
What's ES2016?One of the main changes in this edition is the emphasis on ES2016, the most modern version of JavaScript currently available. Formerly known as ES6 (Harmony), it pushes the JavaScript language's features forward signifi cantly, allowing for new usage patterns that simplify code readability and increase expressiveness. If you've written JavaScript before and the examples in this chapter look pretty confusing, it means you're probably familiar with the older, more common ES5 syntax. But don't sweat! It really doesn't take too long to get the hang of the new syntax, and I will try to explain the new language features as we encounter them. Although it might seem a somewhat steep learning curve at the start, by the end, you'll have improved your ability to write code quite substantially and will be on the cutting edge of contemporary JavaScript development.
For a really good rundown of all the new toys you have with ES2016, check out this nice guide by the folks at Babel.js, which we will use extensively throughout this book:https://babeljs.io/docs/learn-es2015/.
Before I go any further, let me clear some confusion about what ES2016 actually is. Initially, the ECMAScript (or ES for short) standards were incremented by cardinal numbers, for instance, ES4, ES5, ES6, and ES7. However, with ES6, they changed this so that a new standard is released every year in order to keep pace with modern development trends, and thus we refer to the year (2016) now. The big release was ES2015, which more or less maps to ES6. ES2016 is scheduled for ratifi cation in June 2016, and builds on the previous year's standard, while adding a few fi xes and two new features. You don't really need to worry about compatibility because we use Babel.js to transpile everything down to ES5 anyway, so it runs the same in Node.js and in the browser. For the sake of simplicity, I will use the word "ES2016" throughout in a general sense to refer to all modern JavaScript, but I'm not referring to the ECMAScript 2016 specifi cation itself.
Chapter 1
[ 3 ]
Getting started with Node and Git on the command lineI will try not to be too opinionated in this book about which editor or operating system you should use to work through it (though I am using Atom on Mac OS X), but you are going to need a few prerequisites to start.
The fi rst is Node.js. Node is widely used for web development nowadays, and it's actually just JavaScript that can be run on the command line. Later on in this book, I'll show you how to write a server application in Node, but for now, let's just concentrate on getting it and npm (the brilliant and amazing package manager that Node uses) installed.
If you're on Windows or Mac OS X without Homebrew, use the installer at https://nodejs.org/en/. If you're on Mac OS X and are using Homebrew, I would recommend installing "n" instead, which allows you to easily switch between versions of Node:
$ brew install n
$ n latest
Regardless of how you do it, once you fi nish, verify by running the following lines:
$ node --version
$ npm --version
If it displays the versions of node and npm (I'm using 5.6.0 and 3.6.0, respectively), it means you're good to go. If it says something similar to Command not found, double-check whether you've installed everything correctly, and verify that Node.js is in your $PATH environment variable.
Next, you'll want to clone the book's repository from GitHub. Change to your project directory and type this:
$ git clone https://github.com/aendrew/learning-d3
$ cd $ learning-d3
This will clone the development environment and all the samples in the learning-d3/ directory as well as switch you into it.
Getting Started with D3, ES2016, and Node.js
[ 4 ]
Another option is to fork the repository on GitHub and then clone your fork instead of mine as was just shown. This will allow you to easily publish your work on the cloud, enabling you to more easily seek support, display fi nished projects on GitHub Pages, and even submit suggestions and amendments to the parent project. This will help us improve this book for future editions. To do this, fork aendrew/learning-d3 and replace aendrew in the preceding code snippet with your GitHub username.
Each chapter of this book is in a separate branch. To switch between them, type the following command:
$ git checkout chapter1
Replace 1 with whichever chapter you want the examples for. Stay at master for now though. To get back to it, type this line:
$ git stash save && git checkout master
The master branch is where you'll do a lot of your coding as you work through this book. It includes a prebuilt package.json fi le (used by npm to manage dependencies), which we'll use to aid our development over the course of this book. There's also a webpack.config.js fi le, which tells the build system where to put things, and there are a few other sundry confi g fi les. We still need to install our dependencies, so let's do that now:
$ npm install
All of the source code that you'll be working on is in the src/ folder. You'll notice it contains an index.html and an index.js fi le; almost always, we'll be working in index.js, as index.html is just a minimal container to display our work in. This is it in its entirety, and it's the last time we'll look at any HTML in this book:
<!DOCTYPE html><div id="chart"></div><script src="/assets/bundle.js"></script>
To get things rolling, start the development server by typing the following line:
$ npm start
This starts up the Webpack development server, which will transform our ES2016 JavaScript into backwards-compatible ES5, which can easily be loaded by most browsers. In the preceding HTML, bundle.js is the compiled code produced by Webpack.
Chapter 1
[ 5 ]
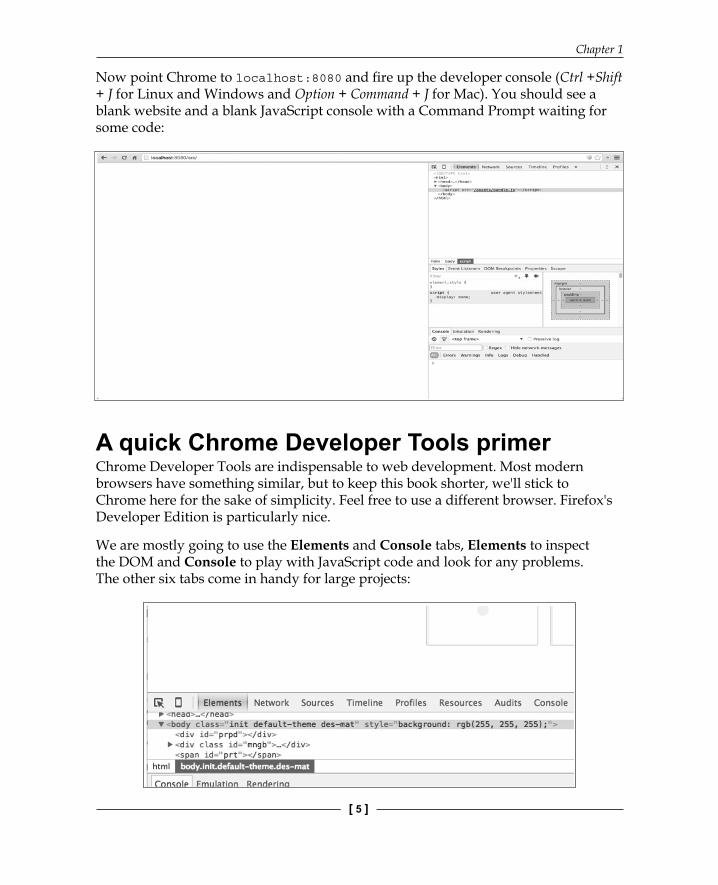
Now point Chrome to localhost:8080 and fi re up the developer console (Ctrl +Shift + J for Linux and Windows and Option + Command + J for Mac). You should see a blank website and a blank JavaScript console with a Command Prompt waiting for some code:
A quick Chrome Developer Tools primerChrome Developer Tools are indispensable to web development. Most modern browsers have something similar, but to keep this book shorter, we'll stick to Chrome here for the sake of simplicity. Feel free to use a different browser. Firefox's Developer Edition is particularly nice.
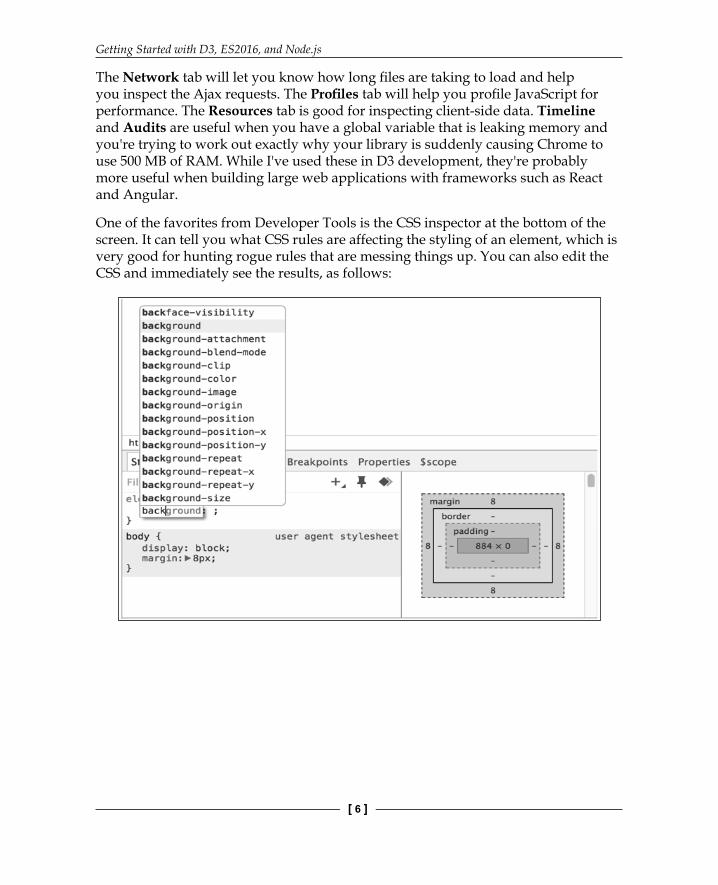
We are mostly going to use the Elements and Console tabs, Elements to inspect the DOM and Console to play with JavaScript code and look for any problems. The other six tabs come in handy for large projects:
Getting Started with D3, ES2016, and Node.js
[ 6 ]
The Network tab will let you know how long fi les are taking to load and help you inspect the Ajax requests. The Profi les tab will help you profi le JavaScript for performance. The Resources tab is good for inspecting client-side data. Timeline and Audits are useful when you have a global variable that is leaking memory and you're trying to work out exactly why your library is suddenly causing Chrome to use 500 MB of RAM. While I've used these in D3 development, they're probably more useful when building large web applications with frameworks such as React and Angular.
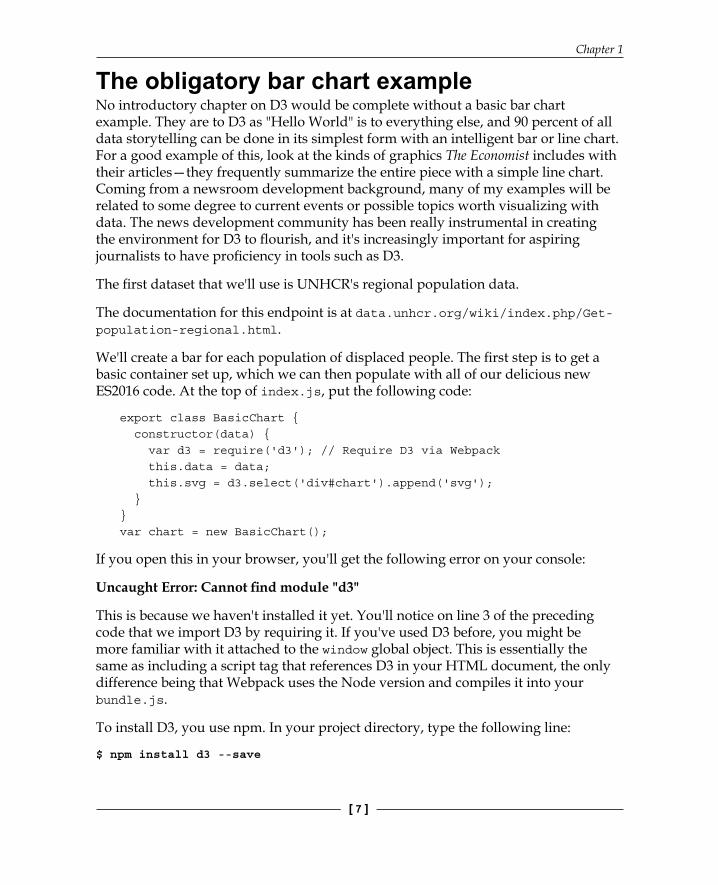
One of the favorites from Developer Tools is the CSS inspector at the bottom of the screen. It can tell you what CSS rules are affecting the styling of an element, which is very good for hunting rogue rules that are messing things up. You can also edit the CSS and immediately see the results, as follows:
Chapter 1
[ 7 ]
The obligatory bar chart exampleNo introductory chapter on D3 would be complete without a basic bar chart example. They are to D3 as "Hello World" is to everything else, and 90 percent of all data storytelling can be done in its simplest form with an intelligent bar or line chart. For a good example of this, look at the kinds of graphics The Economist includes with their articles—they frequently summarize the entire piece with a simple line chart. Coming from a newsroom development background, many of my examples will be related to some degree to current events or possible topics worth visualizing with data. The news development community has been really instrumental in creating the environment for D3 to fl ourish, and it's increasingly important for aspiring journalists to have profi ciency in tools such as D3.
The fi rst dataset that we'll use is UNHCR's regional population data.
The documentation for this endpoint is at data.unhcr.org/wiki/index.php/Get-population-regional.html.
We'll create a bar for each population of displaced people. The fi rst step is to get a basic container set up, which we can then populate with all of our delicious new ES2016 code. At the top of index.js, put the following code:
export class BasicChart { constructor(data) { var d3 = require('d3'); // Require D3 via Webpack this.data = data; this.svg = d3.select('div#chart').append('svg'); }}var chart = new BasicChart();
If you open this in your browser, you'll get the following error on your console:
Uncaught Error: Cannot fi nd module "d3"
This is because we haven't installed it yet. You'll notice on line 3 of the preceding code that we import D3 by requiring it. If you've used D3 before, you might be more familiar with it attached to the window global object. This is essentially the same as including a script tag that references D3 in your HTML document, the only difference being that Webpack uses the Node version and compiles it into your bundle.js.
To install D3, you use npm. In your project directory, type the following line:
$ npm install d3 --save
Getting Started with D3, ES2016, and Node.js
[ 8 ]
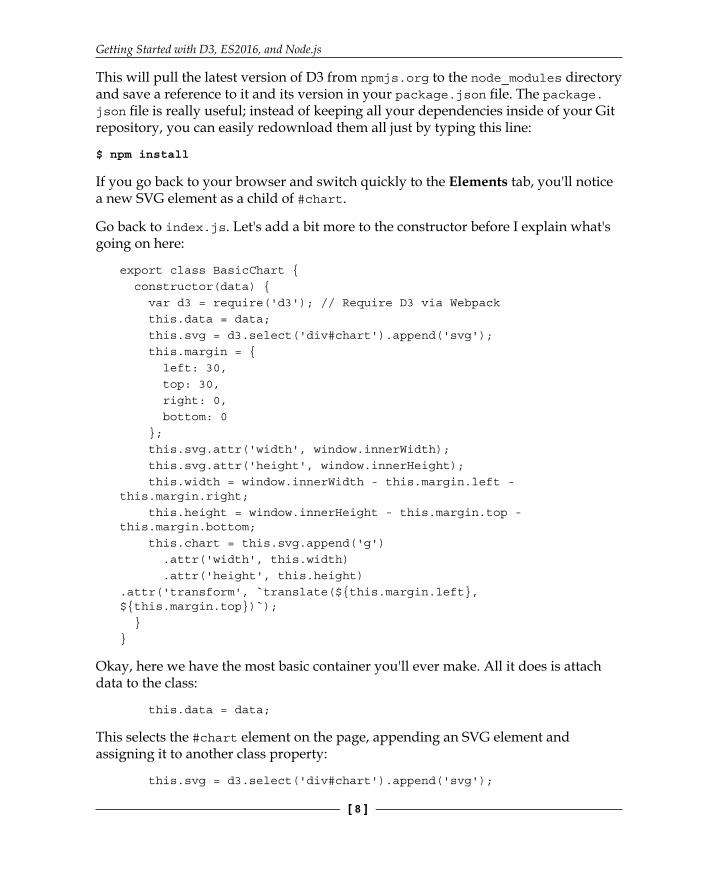
This will pull the latest version of D3 from npmjs.org to the node_modules directory and save a reference to it and its version in your package.json fi le. The package.json fi le is really useful; instead of keeping all your dependencies inside of your Git repository, you can easily redownload them all just by typing this line:
$ npm install
If you go back to your browser and switch quickly to the Elements tab, you'll notice a new SVG element as a child of #chart.
Go back to index.js. Let's add a bit more to the constructor before I explain what's going on here:
export class BasicChart { constructor(data) { var d3 = require('d3'); // Require D3 via Webpack this.data = data; this.svg = d3.select('div#chart').append('svg'); this.margin = { left: 30, top: 30, right: 0, bottom: 0 }; this.svg.attr('width', window.innerWidth); this.svg.attr('height', window.innerHeight); this.width = window.innerWidth - this.margin.left - this.margin.right; this.height = window.innerHeight - this.margin.top - this.margin.bottom; this.chart = this.svg.append('g') .attr('width', this.width) .attr('height', this.height).attr('transform', `translate(${this.margin.left}, ${this.margin. top})`); }}
Okay, here we have the most basic container you'll ever make. All it does is attach data to the class:
this.data = data;
This selects the #chart element on the page, appending an SVG element and assigning it to another class property:
this.svg = d3.select('div#chart').append('svg');
Chapter 1
[ 9 ]
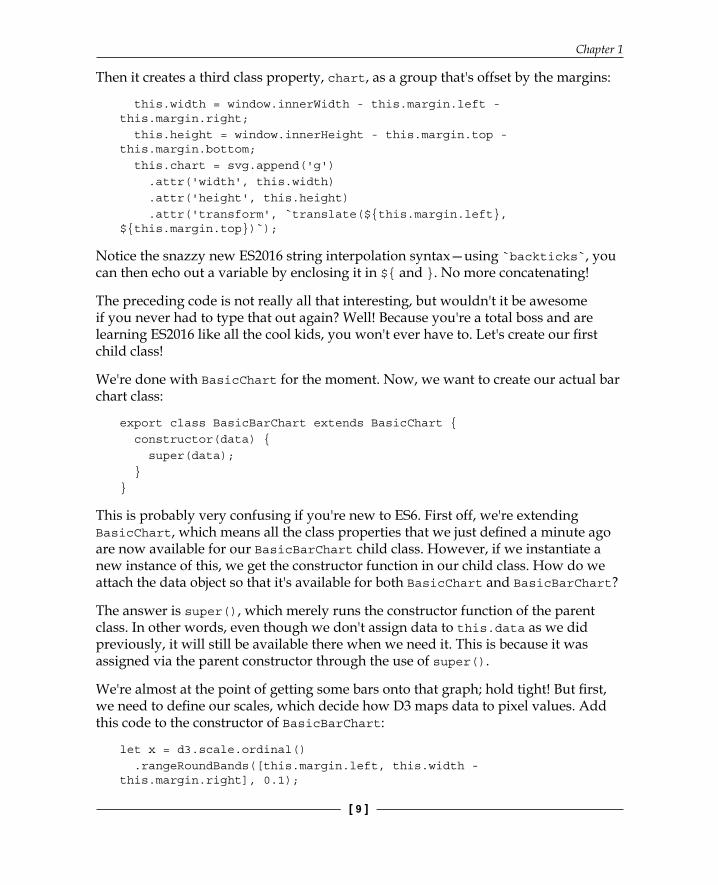
Then it creates a third class property, chart, as a group that's offset by the margins:
this.width = window.innerWidth - this.margin.left - this.margin.right; this.height = window.innerHeight - this.margin.top - this.margin.bottom; this.chart = svg.append('g') .attr('width', this.width) .attr('height', this.height) .attr('transform', `translate(${this.margin.left}, ${this.margin.top})`);
Notice the snazzy new ES2016 string interpolation syntax—using `backticks`, you can then echo out a variable by enclosing it in ${ and }. No more concatenating!
The preceding code is not really all that interesting, but wouldn't it be awesome if you never had to type that out again? Well! Because you're a total boss and are learning ES2016 like all the cool kids, you won't ever have to. Let's create our fi rst child class!
We're done with BasicChart for the moment. Now, we want to create our actual bar chart class:
export class BasicBarChart extends BasicChart { constructor(data) { super(data); }}
This is probably very confusing if you're new to ES6. First off, we're extending BasicChart, which means all the class properties that we just defi ned a minute ago are now available for our BasicBarChart child class. However, if we instantiate a new instance of this, we get the constructor function in our child class. How do we attach the data object so that it's available for both BasicChart and BasicBarChart?
The answer is super(), which merely runs the constructor function of the parent class. In other words, even though we don't assign data to this.data as we did previously, it will still be available there when we need it. This is because it was assigned via the parent constructor through the use of super().
We're almost at the point of getting some bars onto that graph; hold tight! But fi rst, we need to defi ne our scales, which decide how D3 maps data to pixel values. Add this code to the constructor of BasicBarChart:
let x = d3.scale.ordinal() .rangeRoundBands([this.margin.left, this.width - this.margin.right], 0.1);
Getting Started with D3, ES2016, and Node.js
[ 10 ]
The x scale is now a function that maps inputs from an as-yet-unknown domain (we don't have the data yet) to a range of values between this.margin.left and this.width - this.margin.right, that is, between 30 and the width of your viewport minus the right margin, with some spacing defi ned by the 0.1 value. Because it's an ordinal scale, the domain will have to be discrete rather than continuous. The rangeRoundBands means the range will be split into bands that are guaranteed to be round numbers.
Hoorah! Another fancy new ES2016 feature!The let is the new var—you can still use var to defi ne variables, but you should use let instead because it's limited in scope to the block, statement, or expression on which it is used. Meanwhile, var is used for more global variables, or variables that you want available regardless of the block scope. For more on this, visit http://mdn.io/let.If you have no idea what I'm talking about here, don't worry. It just means that you should defi ne variables with let because they're more likely to act as you think they should and are less likely to leak into other parts of your code. It will also throw an error if you use it before it's defi ned, which can help with troubleshooting and preventing sneaky bugs.
Still inside the constructor, we defi ne another scale named y:
let y = d3.scale.linear().range([this.height, this.margin.bottom]);
Similarly, the y scale is going to map a currently unknown linear domain to a range between this.height and this.margin.bottom, that is, your viewport height and 30. Inverting the range is important because D3.js considers the top of a graph to be y=0. If ever you fi nd yourself trying to troubleshoot why a D3 chart is upside down, try switching the range values.
Now, we defi ne our axes. Add this just after the preceding line, inside the constructor:
let xAxis = d3.svg.axis().scale(x).orient('bottom'); let yAxis = d3.svg.axis().scale(y).orient('left');
We've told each axis what scale to use when placing ticks and which side of the axis to put the labels on. D3 will automatically decide how many ticks to display, where they should go, and how to label them.
Now the fun begins!
Chapter 1
[ 11 ]
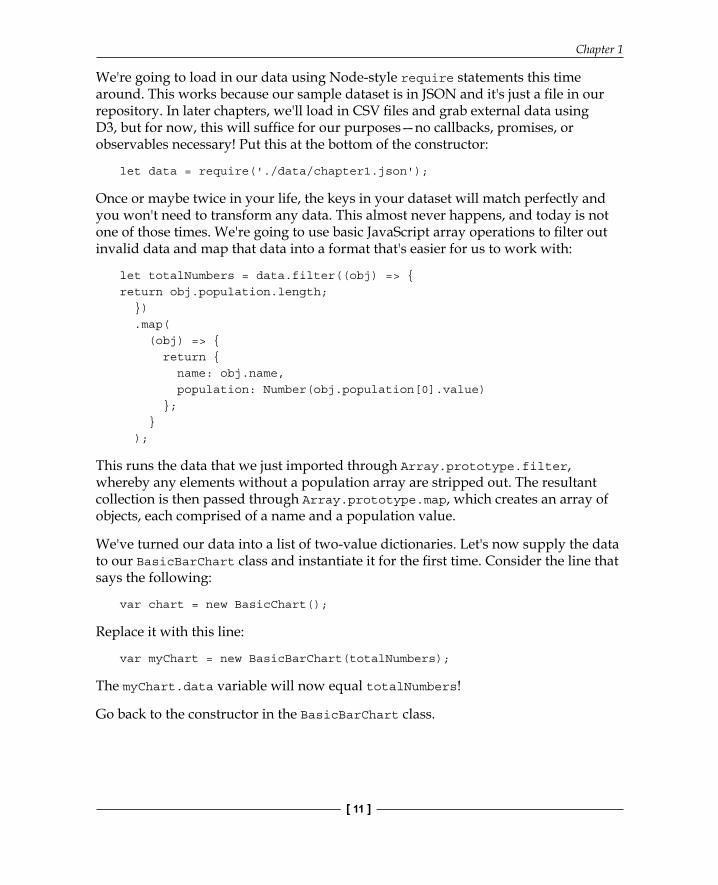
We're going to load in our data using Node-style require statements this time around. This works because our sample dataset is in JSON and it's just a fi le in our repository. In later chapters, we'll load in CSV fi les and grab external data using D3, but for now, this will suffi ce for our purposes—no callbacks, promises, or observables necessary! Put this at the bottom of the constructor:
let data = require('./data/chapter1.json');
Once or maybe twice in your life, the keys in your dataset will match perfectly and you won't need to transform any data. This almost never happens, and today is not one of those times. We're going to use basic JavaScript array operations to fi lter out invalid data and map that data into a format that's easier for us to work with:
let totalNumbers = data.filter((obj) => {return obj.population.length; }) .map( (obj) => { return { name: obj.name, population: Number(obj.population[0].value) }; } );
This runs the data that we just imported through Array.prototype.filter, whereby any elements without a population array are stripped out. The resultant collection is then passed through Array.prototype.map, which creates an array of objects, each comprised of a name and a population value.
We've turned our data into a list of two-value dictionaries. Let's now supply the data to our BasicBarChart class and instantiate it for the fi rst time. Consider the line that says the following:
var chart = new BasicChart();
Replace it with this line:
var myChart = new BasicBarChart(totalNumbers);
The myChart.data variable will now equal totalNumbers!
Go back to the constructor in the BasicBarChart class.
Getting Started with D3, ES2016, and Node.js
[ 12 ]
Remember the x and y scales from before? We can fi nally give them a domain and make them useful. Again, a scale is a simply a function that maps an input range to an output domain:
x.domain(data.map((d) => { return d.name })); y.domain([0, d3.max(data, (d) => { return d.population; })]);
Hey, there's another ES2016 feature! Instead of typing function() {} endlessly, you can now just put () => {} for anonymous functions. Other than being six keystrokes less, the "fat arrow" doesn't bind the value of this to something else, which can make life a lot easier. For more on this, visit http://mdn.io/Arrow_functions.
Since most D3 elements are objects and functions at the same time, we can change the internal state of both scales without assigning the result to anything. The domain of x is a list of discrete values. The domain of y is a range from 0 to the d3.max of our dataset—the largest value.
Now we're going to draw the axes on our graph:
this.chart.append('g') .attr('class', 'axis') .attr('transform', `translate(0, ${this.height})`) .call(xAxis);
We've appended an element called g to the graph, given it the axis CSS class, and moved the element to a place in the bottom-left corner of the graph with the transform attribute.
Finally, we call the xAxis function and let D3 handle the rest.
The drawing of the other axis works exactly the same, but with different arguments:
this.chart.append('g') .attr('class', 'axis') .attr('transform', `translate(${this.margin.left}, 0)`) .call(yAxis);
Now that our graph is labeled, it's fi nally time to draw some data:
this.chart.selectAll('rect') .data(data) .enter() .append('rect') .attr('class', 'bar') .attr('x', (d) => { return x(d.name); })
Chapter 1
[ 13 ]
.attr('width', x.rangeBand()) .attr('y', (d) => { return y(d.population); }) .attr('height', (d) => { return this.height - y(d.population); });
Okay, there's plenty going on here, but this code is saying something very simple. This is what it says:
• For all rectangles (rect) in the graph, load our data• Go through it• For each item, append a rect• Then define some attributes
Ignore the fact that there aren't any rectangles initially; what you're doing is creating a selection that is bound to data and then operating on it. I can understand that it feels a bit weird to operate on non-existent elements (this was personally one of my biggest stumbling blocks when I was learning D3), but it's an idiom that shows its usefulness later on when we start adding and removing elements due to changing data.
The x scale helps us calculate the horizontal positions, and rangeBand gives the width of the bar. The y scale calculates vertical positions, and we manually get the height of each bar from y to the bottom. Note that whenever we needed a different value for every element, we defi ned an attribute as a function (x, y, and height); otherwise, we defi ned it as a value (width).
Keep this in mind when you're tinkering.
Let's add some fl ourish and make each bar grow out of the horizontal axis. Time to dip our toes into animations!
Modify the code you just added to resemble the following. I've highlighted the lines that are different:
this.chart.selectAll('rect') .data(data) .enter() .append('rect') .attr('class', 'bar') .attr('x', (d) => { return x(d.name); }) .attr('width', x.rangeBand()) .attr('y', () => { return y(this.margin.bottom); }) .attr('height', 0) .transition()
Getting Started with D3, ES2016, and Node.js
[ 14 ]
.delay((d, i) => { return i*20; }) .duration(800) .attr('y', (d) => { return y(d.population); }) .attr('height', (d) => { return this.height - y(d.population); });
The difference is that we statically put all bars at the bottom (margin.bottom) and then entered a transition with .transition(). From here on, we defi ne the transition that we want.
First, we wanted each bar's transition delayed by 20 milliseconds using i*20. Most D3 callbacks will return the datum (or "whatever data has been bound to this element," which is typically set to d) and the index (or the ordinal number of the item currently being evaluated, which is typically i) while setting the this argument to the currently selected DOM element. Because of this last point, we use the fat arrow—so that we can still use the class this.height property. Otherwise, we'd be trying to fi nd the height property on our SVGRect element, which we're midway to trying to defi ne!
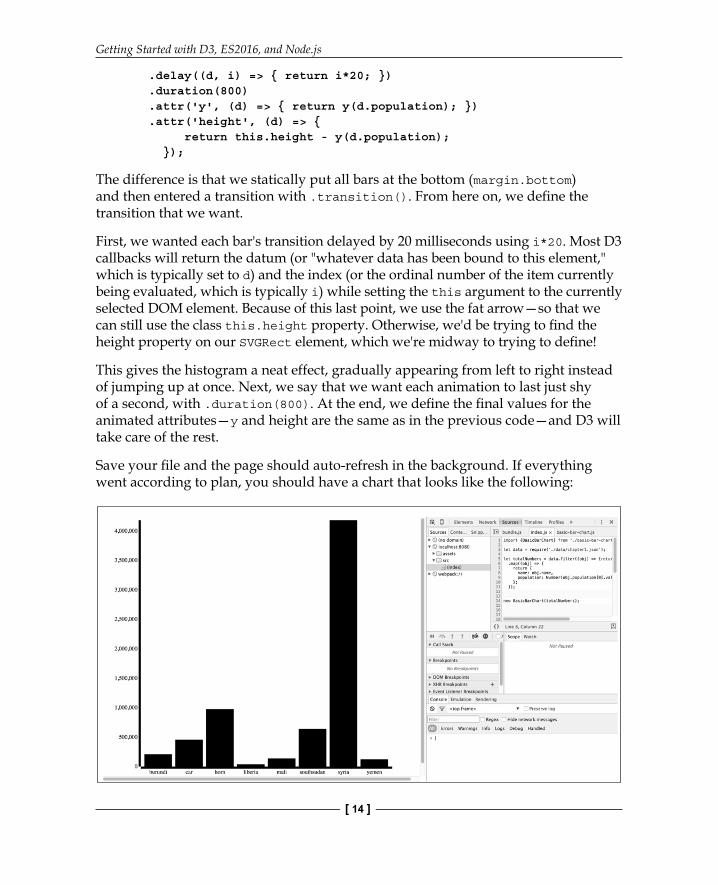
This gives the histogram a neat effect, gradually appearing from left to right instead of jumping up at once. Next, we say that we want each animation to last just shy of a second, with .duration(800). At the end, we defi ne the fi nal values for the animated attributes—y and height are the same as in the previous code—and D3 will take care of the rest.
Save your fi le and the page should auto-refresh in the background. If everything went according to plan, you should have a chart that looks like the following:
Chapter 1
[ 15 ]
According to this UNHCR data from June 2015, by far the largest number of displaced persons are from Syria. Hey, look at this—we kind of just did some data journalism here! Remember that you can look at the entire code on GitHub at http://github.com/aendrew/learning-d3/tree/chapter1 if you didn't get something similar to the preceding screenshot.
We still need to do just a bit more, mainly by using CSS to style the SVG elements.
We could have just gone to our HTML fi le and added CSS, but then that means opening that yucky index.html fi le. And where's the fun in writing HTML when we're learning some newfangled JavaScript?!
First, create an index.css fi le in your src/ directory:
html, body { padding: 0; margin: 0;}
.axis path, .axis line { fill: none; stroke: #eee; shape-rendering: crispEdges;}
.axis text { font-size: 11px;}
.bar { fill: steelblue;}
Then just add the following line to index.js:
require('./index.css');
I know. Crazy, right?! N o <style> tags needed!
Getting Started with D3, ES2016, and Node.js
[ 16 ]
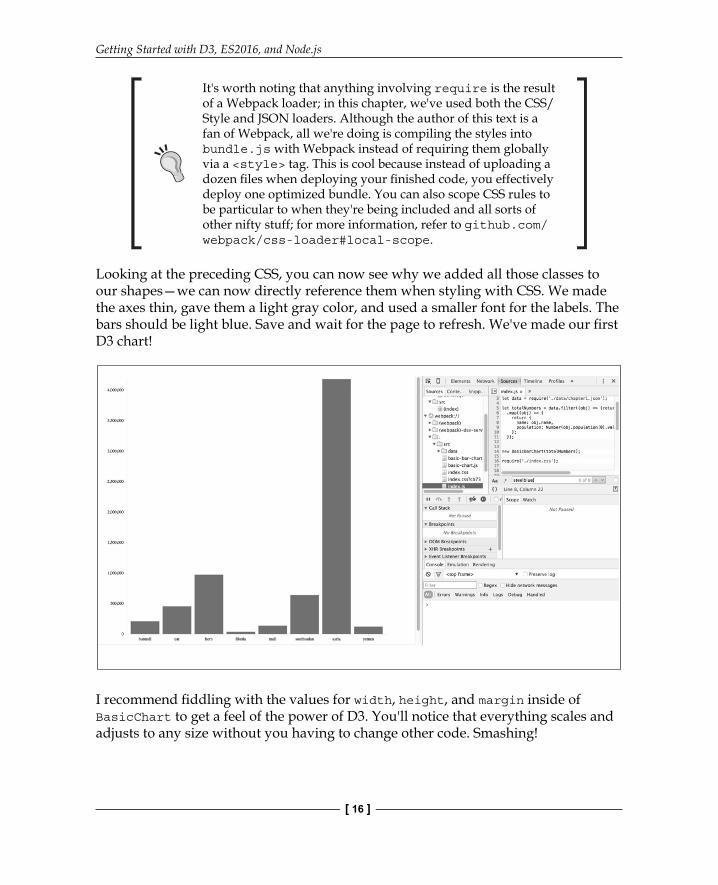
It's worth noting that anything involving require is the result of a Webpack loader; in this chapter, we've used both the CSS/Style and JSON loaders. Although the author of this text is a fan of Webpack, all we're doing is compiling the styles into bundle.js with Webpack instead of requiring them globally via a <style> tag. This is cool because instead of uploading a dozen fi les when deploying your fi nished code, you effectively deploy one optimized bundle. You can also scope CSS rules to be particular to when they're being included and all sorts of other nifty stuff; for more information, refer to github.com/webpack/css-loader#local-scope.
Looking at the preceding CSS, you can now see why we added all those classes to our shapes—we can now directly reference them when styling with CSS. We made the axes thin, gave them a light gray color, and used a smaller font for the labels. The bars should be light blue. Save and wait for the page to refresh. We've made our fi rst D3 chart!
I recommend fi ddling with the values for width, height, and margin inside of BasicChart to get a feel of the power of D3. You'll notice that everything scales and adjusts to any size without you having to change other code. Smashing!
Chapter 1
[ 17 ]
SummaryIn this chapter, you learned what D3 is and took a glance at the core philosophy behind how it works. You also set up your computer for prototyping ideas and to play with visualizations. This environment will be assumed throughout the book.
We went through a simple example and created an animated histogram using some of the basics of D3. You learned about scales and axes, that the vertical axis is inverted, that any property defi ned as a function is recalculated for every data point, and that we use a combination of CSS and SVG to make things beautiful. We also did a lot of fancy stuff with ES2016, Babel, and Webpack and got Node.js installed. Go us!
Most of all, this chapter has given you the basic tools so that you can start playing with D3.js on your own. Tinkering is your friend! Don't be afraid to break stuff—you can always reset to a chapter's default state by running $ git reset --hard origin/chapter1, replacing 1 with whichever chapter you're on.
Next, we'll be looking at all this a bit more in depth, specifi cally how the DOM, SVG, and CSS interact with each other. This chapter discussed quite a lot, so if some parts got away from you, don't worry. Just power through to the next chapter and everything will start to make a lot more sense!

Where to buy this book You can buy Learning d3.js Data Visualization Second Edition from the
Packt Publishing website.
Alternatively, you can buy the book from Amazon, BN.com, Computer Manuals and most internet
book retailers.
Click here for ordering and shipping details.
www.PacktPub.com
Stay Connected:
Get more information Learning d3.js Data Visualization Second Edition