experiences in elk with d3.js for large log analysis and visualization
TRANSCRIPT
Surasak [email protected]
Applied Network Research LabDepartment of Computer Engineering
Faculty of Engineering, Kasetsart UniversitySoftware Freedom Day 2016 – Sept 17 Bangkok
Experiences in ELK with D3.js for Large Log Analysis
and Visualization
U-Bahn Station Candid Plazt, Munich, Germany
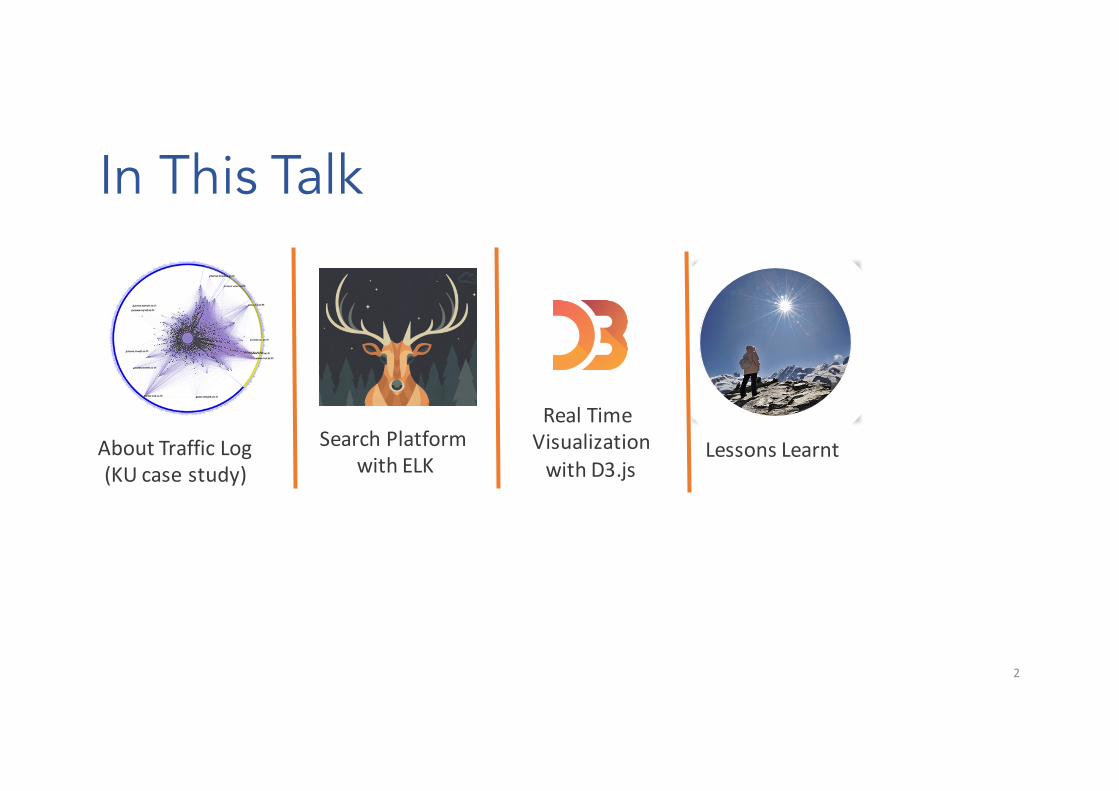
In This Talk
2
Real Time Visualizationwith D3.js
Search Platform with ELK
About Traffic Log(KU case study)
Lessons Learnt

Chapter I Network Traffic Log Structure and Sizing
KU Case Study
3

Why keeping Log
• Legal compliant
• Troubleshooting
• Security analysis
• Statistics/Analytics
4

Log Monitoring
Collecting
Processing
Analysing
Visualising
5Source: https://www.flickr.com/photos/sbeebe/4772418919

Searching in Log
Find relevant stuff
Find it fast
Make our lives easier
6
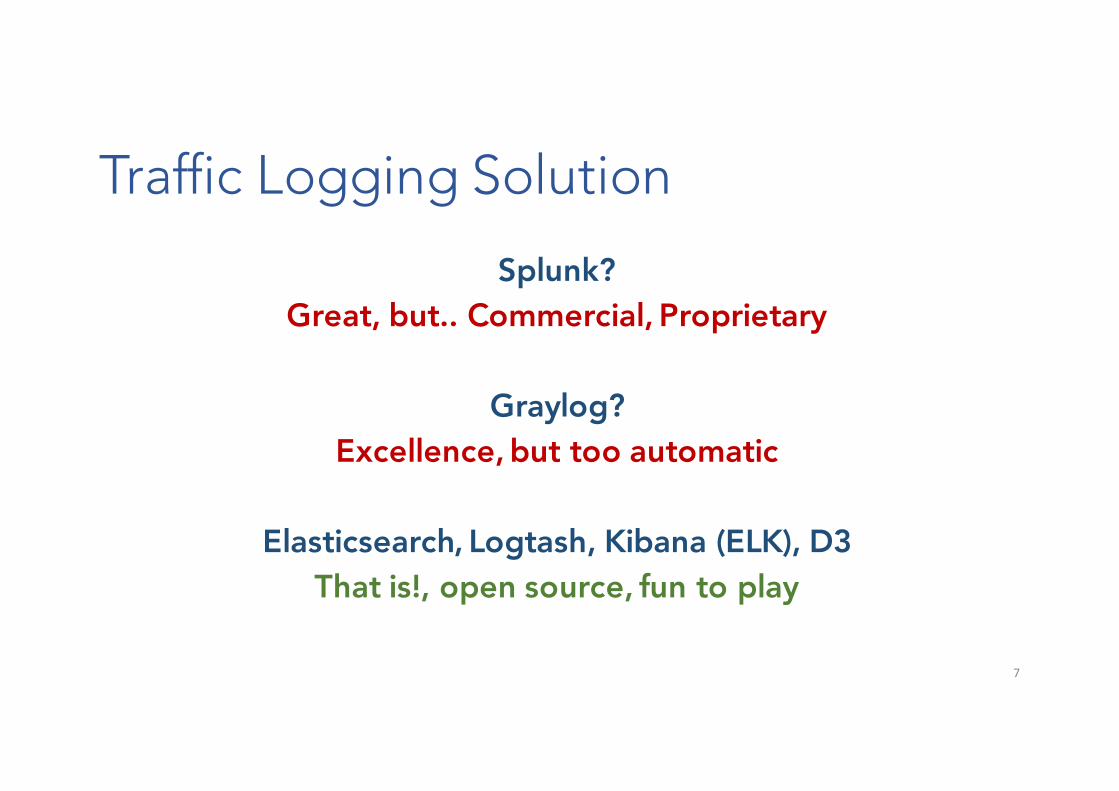
Traffic Logging Solution
Splunk? Great, but.. Commercial, Proprietary
Graylog?Excellence, but too automatic
Elasticsearch, Logtash, Kibana (ELK), D3That is!, open source, fun to play
7

KU Logging2008-2015 2015-
8
Raw Log
MySQL
Simple Web GUI
Raw Log
Elasticsearch
Web GUI/Kibana/D3
• On the fly text based log to MySQL converter
• Simple but slow
• Much faster!

KU Logging Structure
9
Network
LoginPortal
Search GUILogging Engine
PacketCapture
Socket
Login Log
Web Log
Packet Log
Multicore x86with 10 GbE
Raw Log

Raw Login Log Format
• Real-time logging, one file per day
10
Date Time Action IP UserName LogServer
Jul 1 10:04:57 login 158.108.X.X [email protected] 192.168.1.1Jul 1 10:04:58 logout 158.108.X.X [email protected] 192.168.1.2Jul 1 10:04:59 timeout 158.108.X.X [email protected] 192.168.1.2
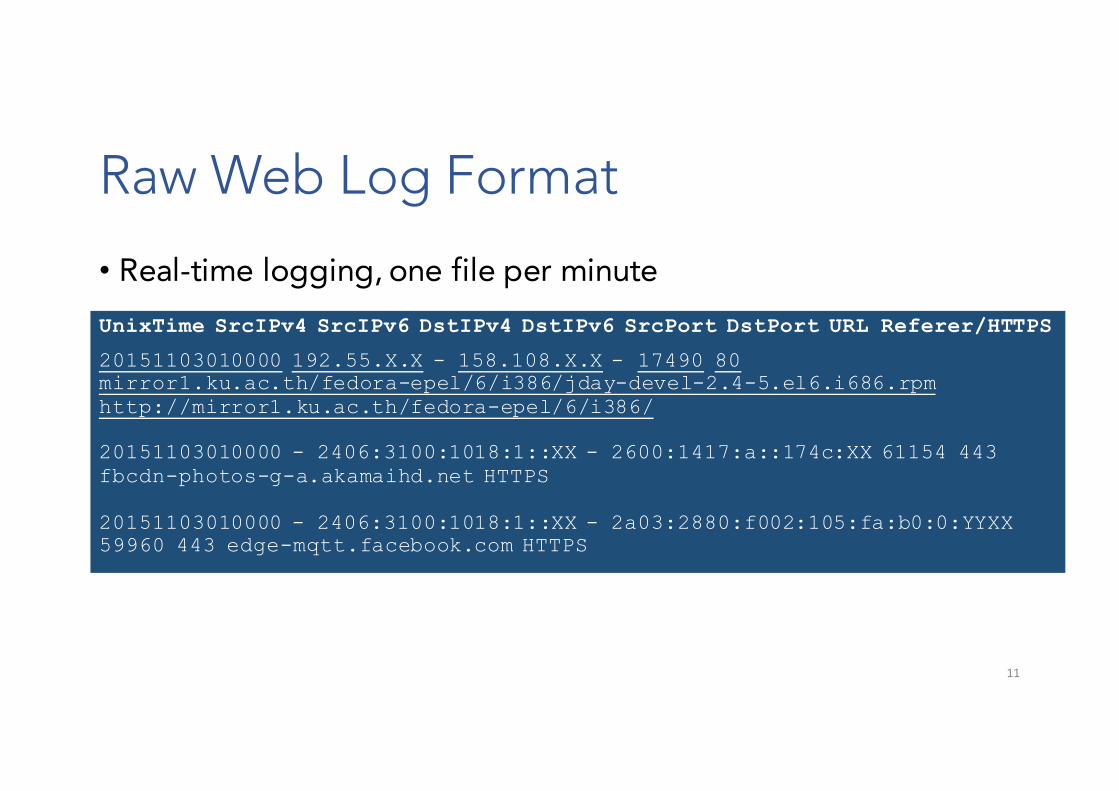
Raw Web Log Format
• Real-time logging, one file per minute
11
UnixTime SrcIPv4 SrcIPv6 DstIPv4 DstIPv6 SrcPort DstPort URL Referer/HTTPS
20151103010000 192.55.X.X - 158.108.X.X - 17490 80mirror1.ku.ac.th/fedora-epel/6/i386/jday-devel-2.4-5.el6.i686.rpmhttp://mirror1.ku.ac.th/fedora-epel/6/i386/
20151103010000 - 2406:3100:1018:1::XX - 2600:1417:a::174c:XX 61154 443 fbcdn-photos-g-a.akamaihd.net HTTPS
20151103010000 - 2406:3100:1018:1::XX - 2a03:2880:f002:105:fa:b0:0:YYXX 59960 443 edge-mqtt.facebook.com HTTPS

Raw Packet Log Format (Header Log)
• Real-time logging, one file per minute
12
TimeStamp SrcIP DstIP SrcPort Proto Size DstPort SrcPort [Flag]2009-07-16 17:53:59.999206 208.117.8.X 158.108.234.X 1514 TCP 80 1371 0x102009-07-16 17:53:59.999209 158.108.2.X 202.143.136.X 90 UDP 123 123
TimeStamp SrcIP DstIP Proto Code2009-07-16 17:53:59.999210 158.108.184.X 218.164.54.X ICMP 168

Time based Hierarchical Folder
13
Minutely FileHourDayMonthYear
2015
01
01
00
201501010000.txt201501010001.txt
:201501010059.txt01
::
23
201501012300.txt201501012301.txt
:201501012359.txt
02:
3002:
12

At What Scale?
Quite Large..
14Source:http://www.24hourcampfire.com/ubbthreads/ubbthreads.php/topics/5976731/all/That_s_a_load_of_logs
SPEED400,000 req/s peak
STRUCTUREText/binary
SIZE 30 TB3.2 trillion docs

Facts about KU
Accounts113,XXX
4 CampusesBKN, KPS, SRC, SKN
158.108.0.0/16192.102.83.0/24
10.0.0.0/8
2406:3100::/32 2001:3c8:1303::/48 2001:f00:2003::/48
IPv4
IPv650,XXX
Concurrent Active IP Address (25,XXX:Wifi)
Registered Devices210,XXX
1,4XXAccess Points

System Structure
Internalnetwork
Internet
IPv4/IPv6 Parallel Firewalls with Load Balancers
GatewayRouter
CoreRouter
Session Manager Login Servers
Quota Manager Traffic Logger
Case Study
5x1 Gbps
1x10 Gbps

Sample Minutely HTTP Request Rate
17
11 days (11x 24x60= 15,640 data points)

Request Rate and Log Sizing
18
3.1 req/s
27 MB/d
2,100 req/s
33 GB/d
380,000 req/s
330 GB/d

Accumulated Log Request and Size
19
#Files : 120
20M
2.04 GB
14.1B
2.57 TB
#Files : 172,800
28.03 TB
3.27T
#Files : 172,800

New Logging Architecture
20
Network
LoginPortal
Logging Engine
PacketCapture
Socket
Login Log
Web Log
Flow Log
Multicore x86with 10 GbE
Raw Log
DHCP,RADIUS
Session Tracking &Accounting
ElasticsearchReal time Indexing
GUI/Analytics

Chapter II ELK Stack Testbed
21
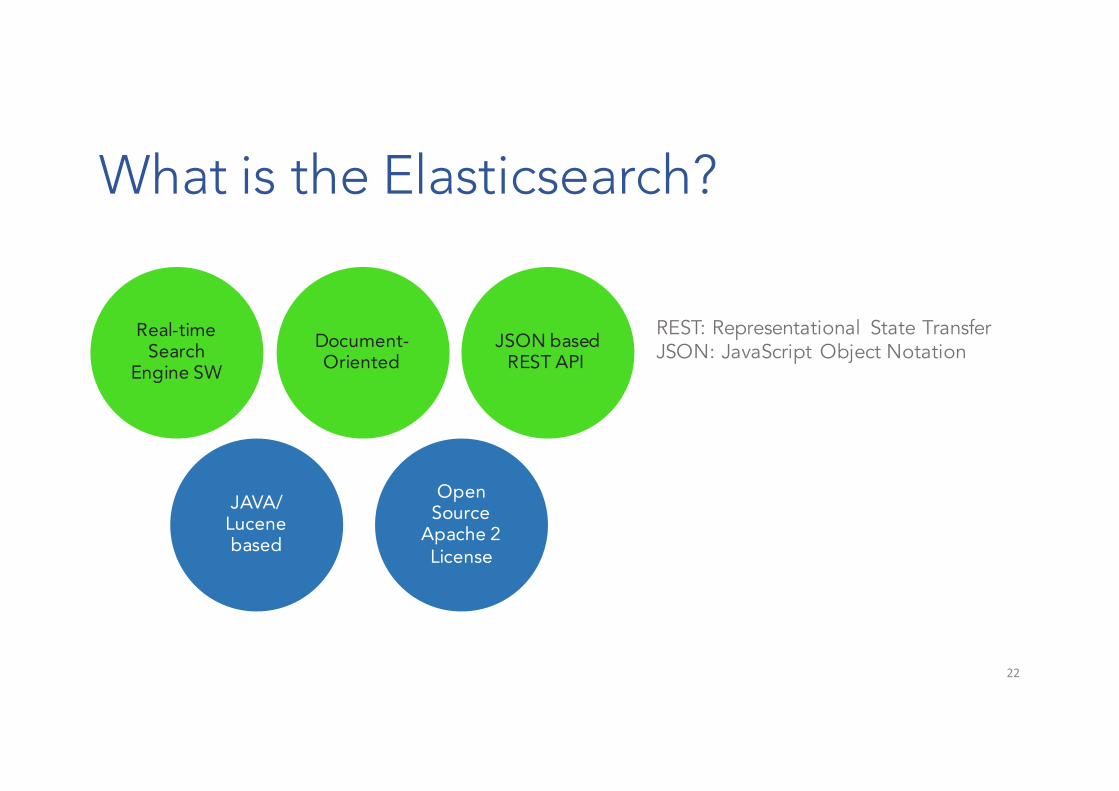
What is the Elasticsearch?
22
Real-timeSearch
Engine SWDocument-Oriented
JSON based REST API
JAVA/Lucenebased
Open Source
Apache 2 License
REST: Representational State TransferJSON: JavaScript Object Notation

Elasticsearch and Database
• Roughly layout comparison
23
Relational DatabaseDatabase
TableRow
ColumnSchema
ElasticsearchIndexType
DocumentField
Mapping

Elasticsearch Logical Layout
24
Index: social Index: blog
Elasticsearch Node
Type: story Type: user Type: posts
1 2 1 2 1 2 3 4
Index Application
Search Application
• Using any HTTP client to talk to Elasticsearch at localhost port 9200
• RESTful : Interact through common HTTP methods (GET, POST, PUT, DELETE)• Not maintain state information
• Each request is independent and resources are returned in JSONtext formats

How the world is using Elasticsearch?
25
Analytics solution on 40 million documents per day to deliver
real-time visibility
Providing search across GitHub's code
Full-text search to find related questions and answers
Full-text search with highlighted search snippets

Elasticsearch and Big DataES-Hadoop: Connectivity of Hadoop's big data analytics and the real-time search of Elasticsearch.
26
Source: https://www.elastic.co/products/hadoop

What does Elasticsearch offer?
27
Full Text Search Very Fast
Fault Tolerance
High AvailabilityDistributed Scalable
PluginArchitecture
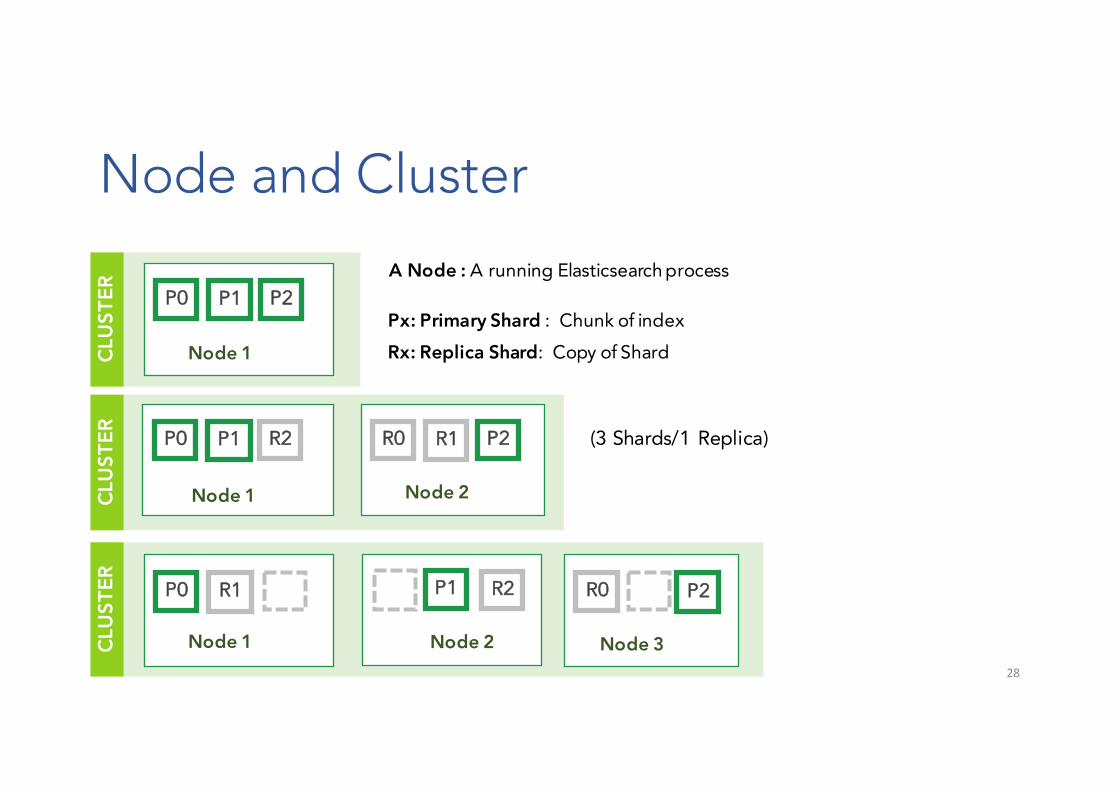
Node and Cluster
28
CLU
STER P0
Node 1
P1 R2 R0
Node 2
R1 P2
CLU
STER P0
Node 1
P1 P2Px: Primary Shard : Chunk of indexRx: Replica Shard: Copy of Shard
A Node : A running Elasticsearch process
CLU
STER P0
Node 1 Node 2
R0
Node 3
R1 R2P1 P2R2 R2 R2
(3 Shards/1 Replica)

When a Node Fails (3 Shards/1 Replica)
29
CLU
STER P0
Node 1 Node 2
R0
Node 3
R1 R2P1 P2R2 R0 R1
CLU
STER P0
Node 1 Node 2
R0
Node 3
P1 R2P1 P2R2 R2 R1

When a Node Fails (3 Shards/2 Replicas)
30
CLU
STER P0
Node 1 Node 2
R0
Node 3
R1 R2P1 P2R2 R0 R1
CLU
STER P0
Node 1 Node 2
R0
Node 3
P1 R2P1 P2R2 R2 R1

Elasticsearch documents
• Document : Basic unit of user data in JSON representation• Sample Document :
31
{"user" : ”Chris""gender" : ”M","birthdate" : "1980-12-11"
}

URI of a document
32
http://localhost:9200/sample_index/sample_type/1
Protocol used:supported HTTP
Port to connect to Using 9200 by default
Host name of theElasticsearch node
Index name
Type name
Document ID

HTTP based CRUD operationCreatecurl -XPUT “http://localhost:9200/<index>/<type>/<id>”Readcurl -XGET "http://localhost:9200/<index>/<type>/<id>"Updatecurl -XPOST "http://localhost:9200/<index>/<type>/<id>" Deletecurl -XDELETE "http://localhost:9200/<index>/<type>/<id>"
33

ELK stack from Elastic
34
Elasticsearch: High-performance scalable search engine
Logstash: Log transport and processing daemon(Log Shipper)
ELK StackKibana: Visualisation dashboard

Logstash
35
Log aggregator and parser
Transferring parsed data to Elasticsearch
Configuration file for specifying input, filtering
(parsing) and output
input { stdin { } }
filter { grok {
match => { "message" => "%{COMBINEDAPACHELOG}" } } date { match => [ "timestamp" ,"dd/MM/yyyy:HH:mm:ss" ] }}output { Elasticsearch { hosts => ["localhost:9200"] } stdout { codec => rubydebug }}
Sample Configuration Source: https://www.elastic.co/guide/en/logstash/current/config-‐examples.html

Kibana
36
General purpose query UI
Includes many widgets
Query Elasticsearch without coding
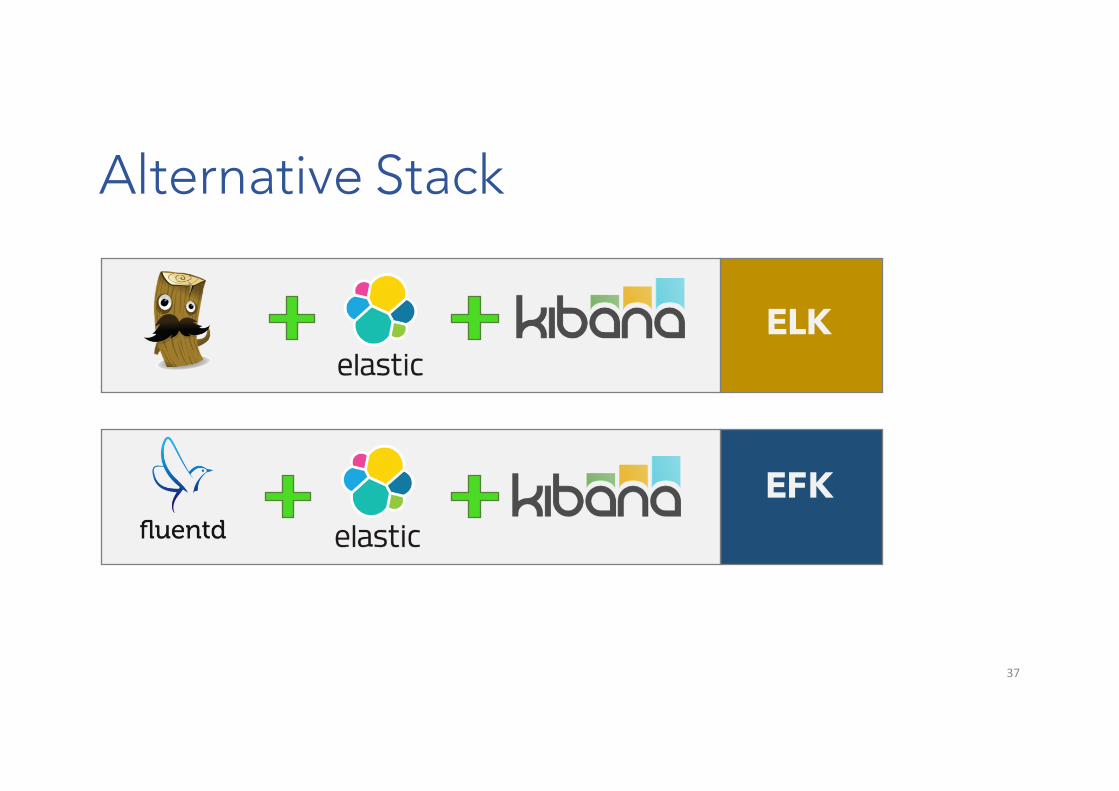
Alternative Stack
37
ELK
EFK

Indexing Performance (Weblog)
38
35
36
37
38
39
40
41
42
43
44
45
0
50
100
150
200
250
1 2 3 4 5 6 7 8 9 10 11 12 13 14 15 16 17 18 19 20 21 22 23 24 25
THOUSANDS
MILLIONS
Daily Performance Indexing
#Records Records/s• Dell R230 • Xeon E3-1271v3 3.6
Ghz 4C/8T• Hyper-threading off• 32 GB RAM• 2x6 TB NLSAS
• Elasticsearch2.3.2• 10 Shards/0 Replica
Indexing Performanceon single machine

Search PerformanceSearch keyword: “ face” against each daily log
Not yet Optimization
39
2.01
2.33
1.992.13
2.67
2.00
1.33
1.02
3.00
2.33
2.00
2.67
3.00
2.67
2.43
3.33
2.67
2.14
3.33
17,551
22,816
16,34618,218
16,240
7,9585,622
1,886
23,559
9,127 8,221
12,343
28,259
25,405
22,092
33,528
17,683
12,951
18,054
0
5,000
10,000
15,000
20,000
25,000
30,000
35,000
40,000
0.00
0.50
1.00
1.50
2.00
2.50
3.00
3.50
1 2 3 4 5 6 7 8 9 10 11 12 13 14 15 16 17 18 19
SEAR
CH TIM
E (M
S)
Search Performance and Hits
Search Time (ms) Hits

Sample Search Performance
40

Kibana: Main Dashboard
41

Kibana: Login Profile
42

Kibana: Concurrent Login View
43

Chapter III Playing with D3.js
44

Real Time Visualization with D3.js
• Data-Driven Documents (D3)
• JavaScript library for manipulating documents based on data
• Developed by Mike Bostock
45
https://d3js.org/

D3 Architecture§ Input data to build
visualizations (JSON, CSV,…)
§ Data manipulation of HTML elements dynamically with JavaScript
46
node.jssocket.io

Sample Gallery
47
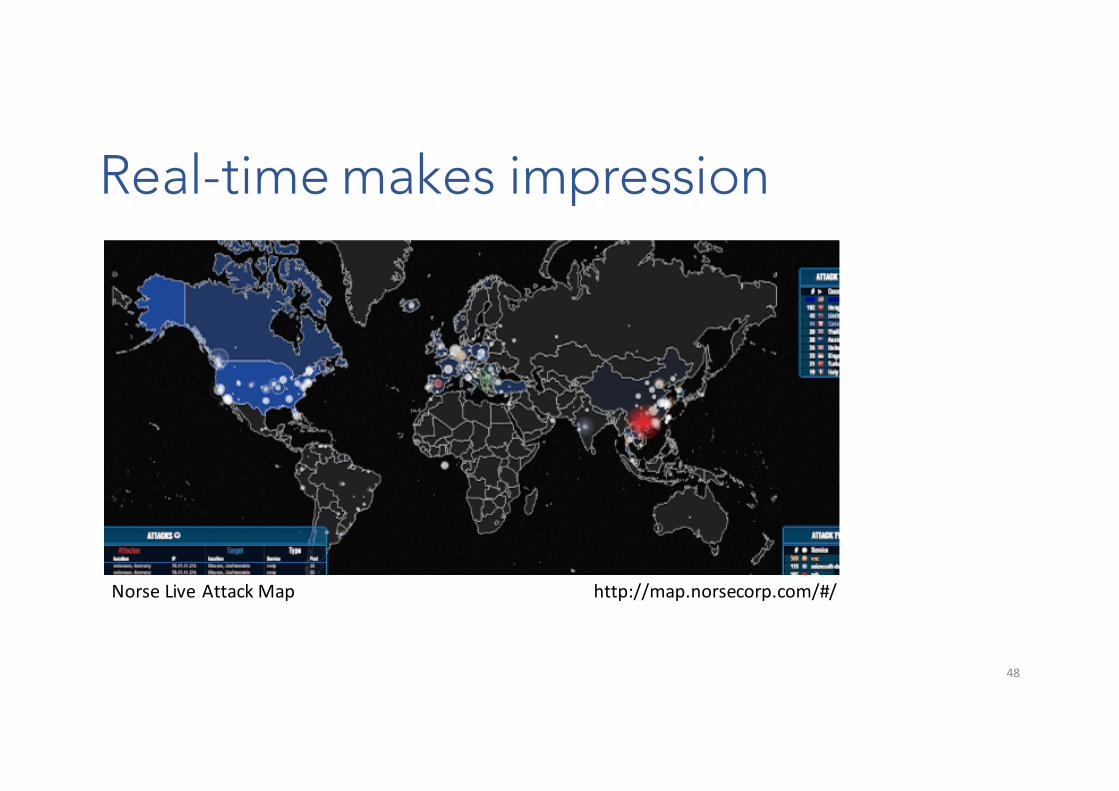
Real-time makes impression
48
http://map.norsecorp.com/#/Norse Live Attack Map

Sample Concurrent Login
49

Sample IP Matrix Occupied
50

Sample Tree Map Web Access
51
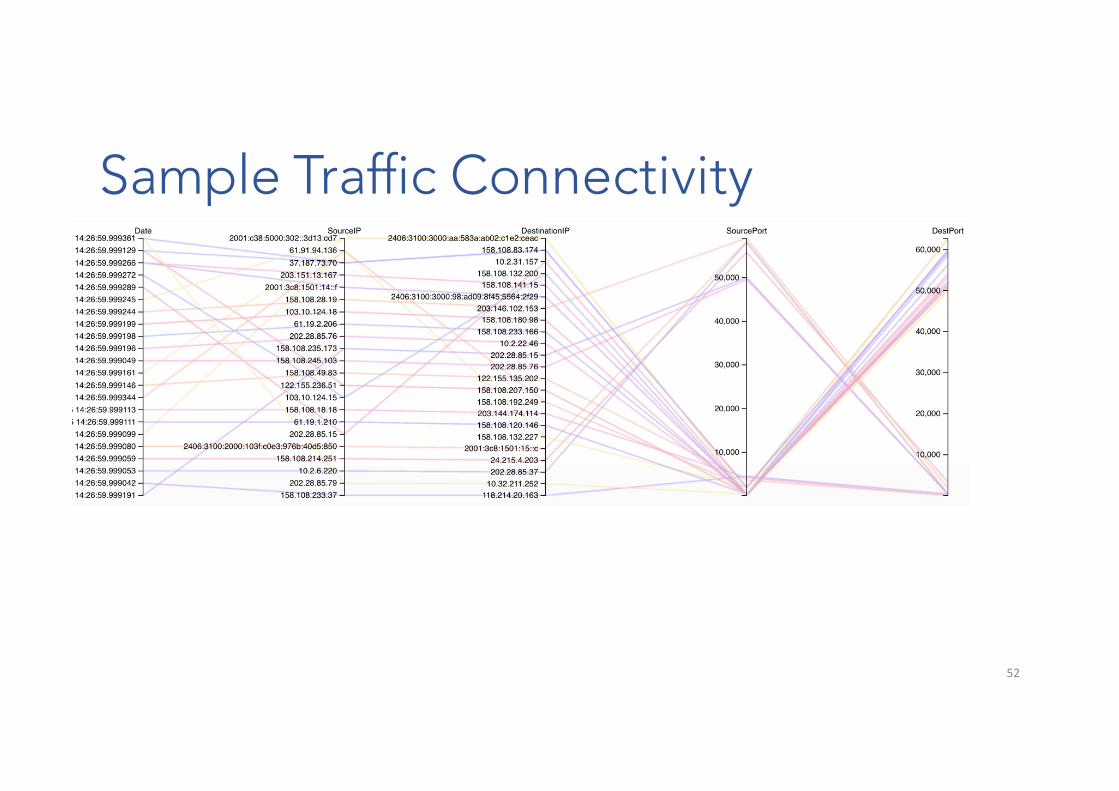
Sample Traffic Connectivity
52

Chapter IV Lessons Learned
53

Lessons Learned
Elasticsearch offers a very fast full-text search services
Indexing size may 3x to 5x bigger than source data
Use Elasticsearch for search services, not for data archiving
More cores or Faster clock? : Choose CORES64 GB of RAM is the idealGo with SSD if possible
54
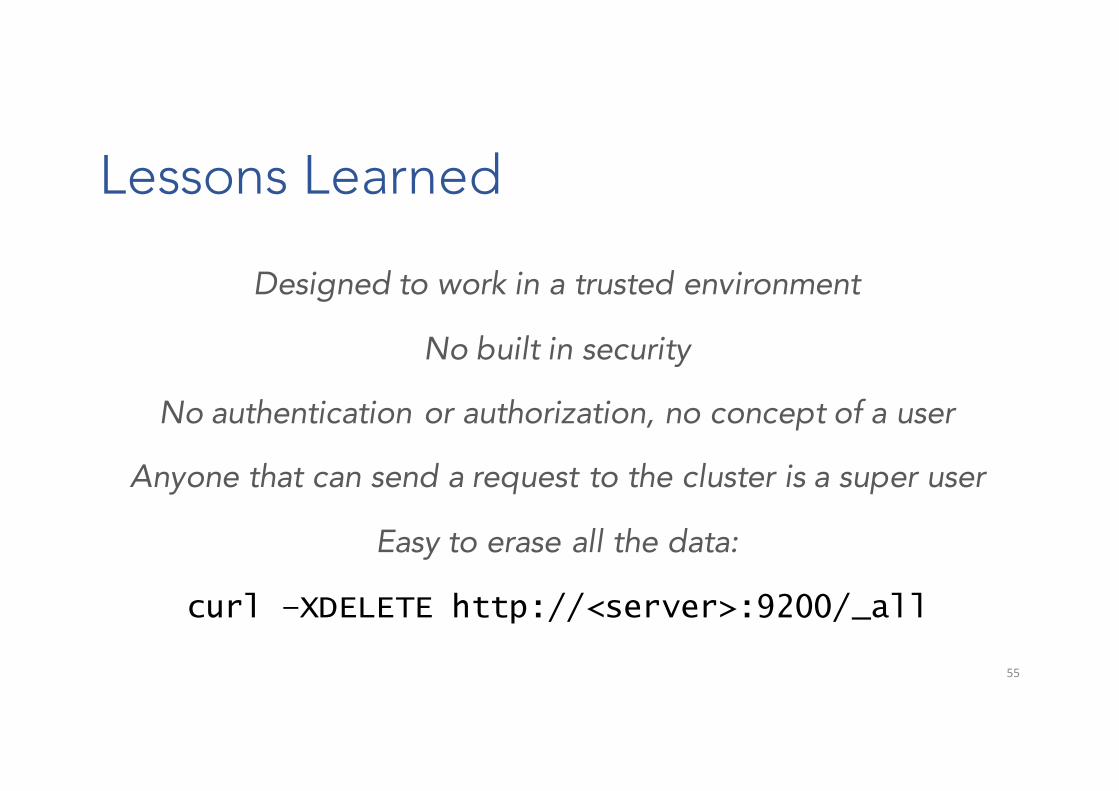
Lessons Learned
Designed to work in a trusted environment
No built in security
No authentication or authorization, no concept of a user
Anyone that can send a request to the cluster is a super user
Easy to erase all the data:
curl –XDELETE http://<server>:9200/_all
55

Lessons Learned
Shield from Elasticsearch: A comprehensive security solution, including encrypted communications, RBAC, AD/LDAP
integration and auditing
Use with a proxy : Authentication and request filtering with nginx or others
56

Lessons Learned
Logstash : A powerful tool to manipulate log
Kibana : Simple and useful for visualize data
57

Lessons Learned
D3 pros:Flexible, Fascinating Visualization
D3 cons:Low Level, Steep Learning Curve, CPU intensive
58

Thank you for your attention
Q & A Time
Q&A…
59
Kasom Koth-Arsa
Core Log Design and DevelopmentJautuporn Chuchuay
Peerapol BoonthaganonWeb GUI Development
Sataporn TechaaramwongWeb/Elasticsearch Development
Peerapong Thongpubeth
Jiradech SirijantadilokKibana Development
Poomipat ThongudomNichapat Nattee
D3 DevelopmentSurachai ChitpinijyolProject Coordinator
Surasak SanguanpongProject Director
Special Thanks to Kasetsart Office of Computer Services for supporting traffic dataSunset at Narita Airport
Kasom Koth-Arsa
Core Log Design and DevelopmentJautuporn Chuchuay
Peerapol BoonthaganonWeb GUI Development
Sataporn TechaaramwongWeb/Elasticsearch Development
Peerapong Thongpubeth
Jiradech SirijantadilokKibana Development
Poomipat ThongudomNichapat Nattee
D3 DevelopmentSurachai ChitpinijyolProject Coordinator
Surasak SanguanpongProject Director
Special Thanks to Kasetsart Office of Computer Services for supporting traffic data