learn what's new in tableau 9.0
TRANSCRIPT
www.edureka.co/data-visualization-with-tableau
Learn Whats New in Tableau 9.0
View Data Visualization with Tableau course details at www.edureka.co/data-visualization-with-tableau
For Queries:Post on Twitter @edurekaIN: #askEdurekaPost on Facebook /edurekaIN
For more details please contact us: US : 1800 275 9730 (toll free)INDIA : +91 88808 62004Email Us : [email protected]
Slide 2 www.edureka.co/data-visualization-with-tableau
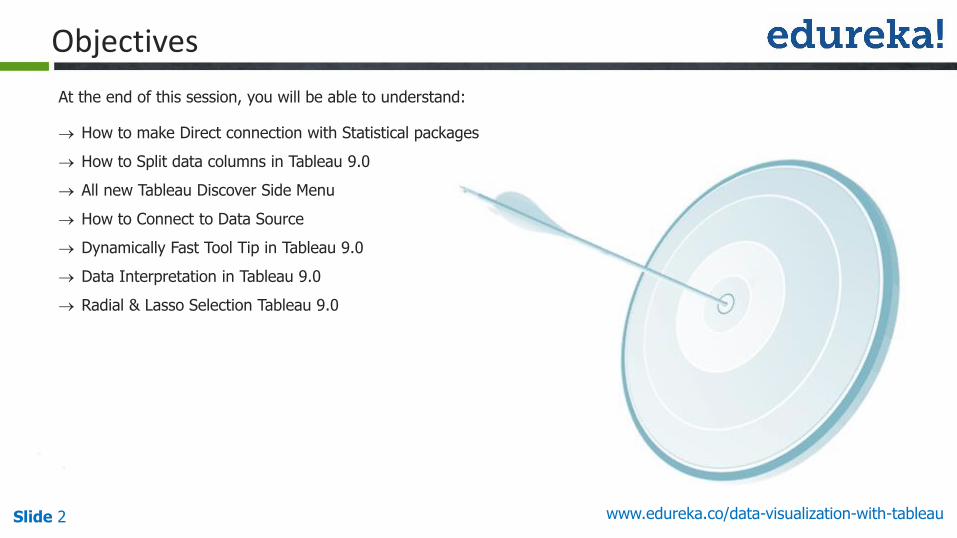
How to make Direct connection with Statistical packages
How to Split data columns in Tableau 9.0
All new Tableau Discover Side Menu
How to Connect to Data Source
Dynamically Fast Tool Tip in Tableau 9.0
Data Interpretation in Tableau 9.0
Radial & Lasso Selection Tableau 9.0
At the end of this session, you will be able to understand:
Objectives
Slide 3 www.edureka.co/data-visualization-with-tableau
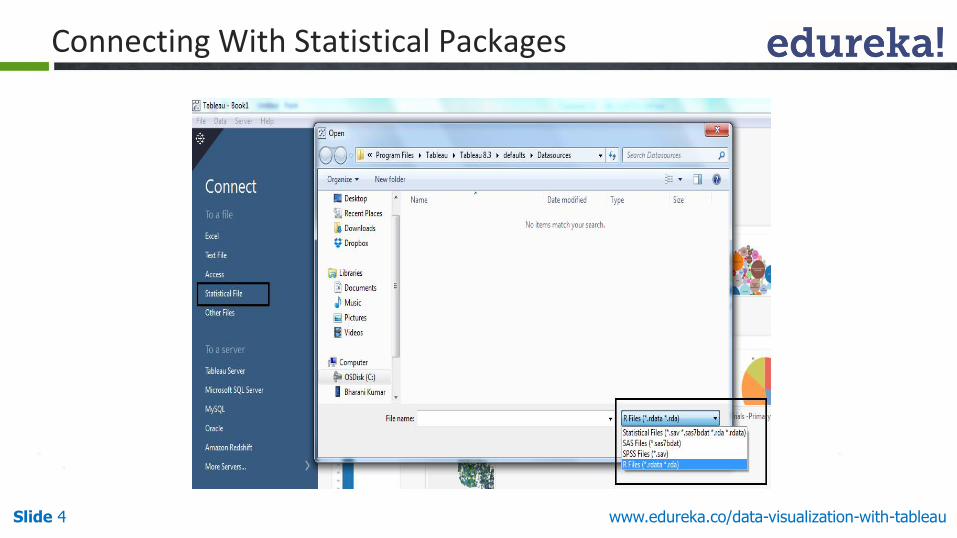
The new connector in Tableau 9.x brings native support for a number of statistical package files including:
• .sas7bdat – the file format used by SAS
• .sav – the binary file format used by SPSS
• .rdata, .rda – the file formats employed by the R statistical analysis package
Connecting With Statistical Packages
Slide 4 www.edureka.co/data-visualization-with-tableau
Connecting With Statistical Packages
Slide 5 www.edureka.co/data-visualization-with-tableau
Splitting Data Columns
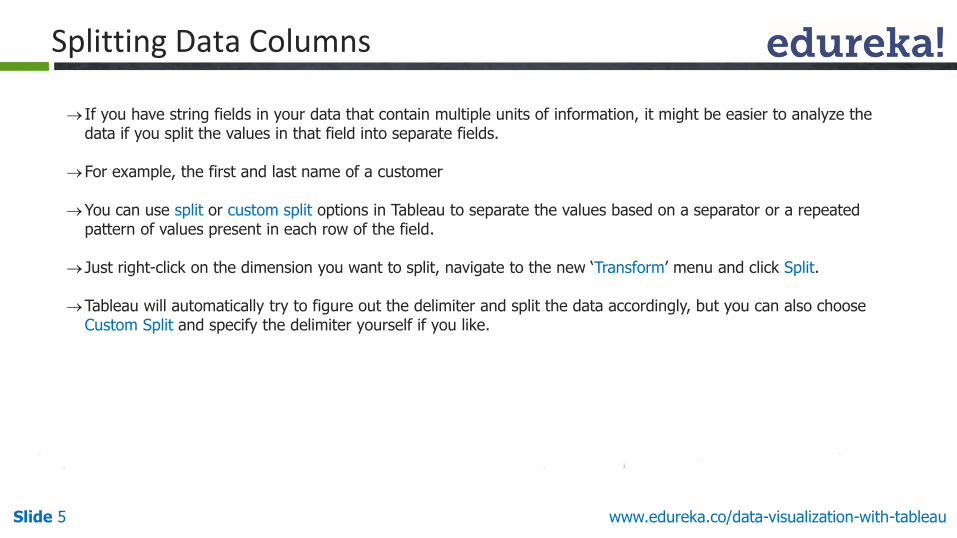
If you have string fields in your data that contain multiple units of information, it might be easier to analyze the data if you split the values in that field into separate fields.
For example, the first and last name of a customer
You can use split or custom split options in Tableau to separate the values based on a separator or a repeated pattern of values present in each row of the field.
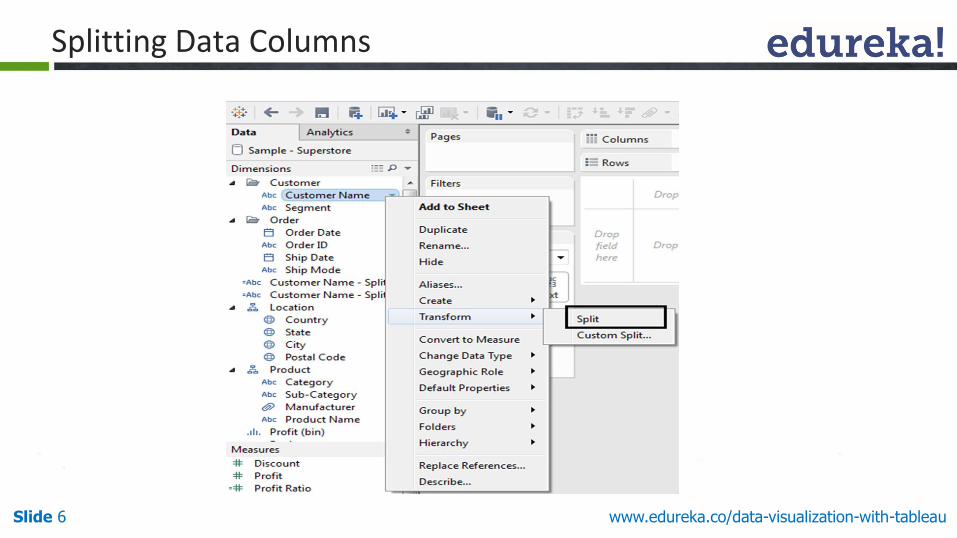
Just right-click on the dimension you want to split, navigate to the new ‘Transform’ menu and click Split.
Tableau will automatically try to figure out the delimiter and split the data accordingly, but you can also choose Custom Split and specify the delimiter yourself if you like.
Slide 6 www.edureka.co/data-visualization-with-tableau
Splitting Data Columns
Slide 7 www.edureka.co/data-visualization-with-tableau
Tableau Discover Side Menu
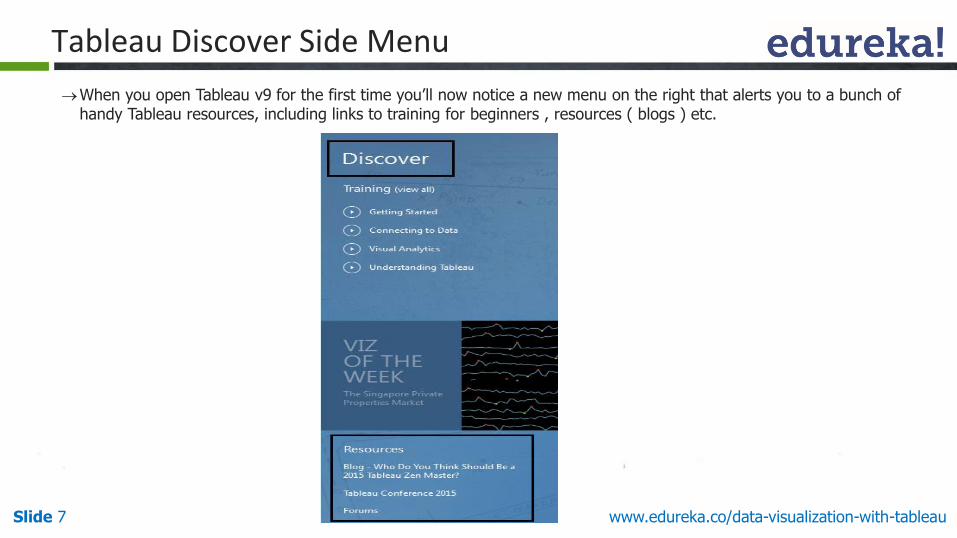
When you open Tableau v9 for the first time you’ll now notice a new menu on the right that alerts you to a bunch of handy Tableau resources, including links to training for beginners , resources ( blogs ) etc.
www.edureka.co/data-visualization-with-tableauSlide 8
Connecting to Data Source
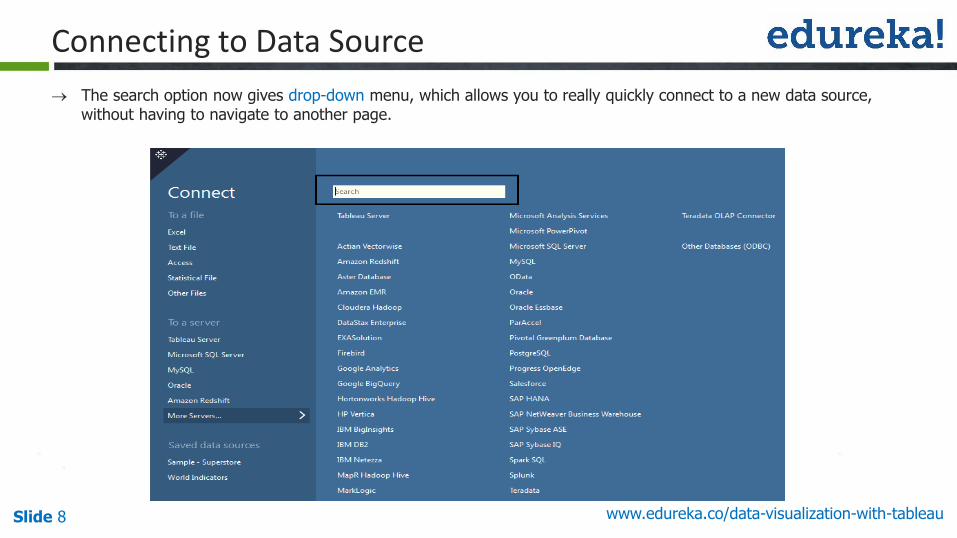
The search option now gives drop-down menu, which allows you to really quickly connect to a new data source, without having to navigate to another page.
www.edureka.co/data-visualization-with-tableauSlide 9
Tool Tip Which is Lightening Fast
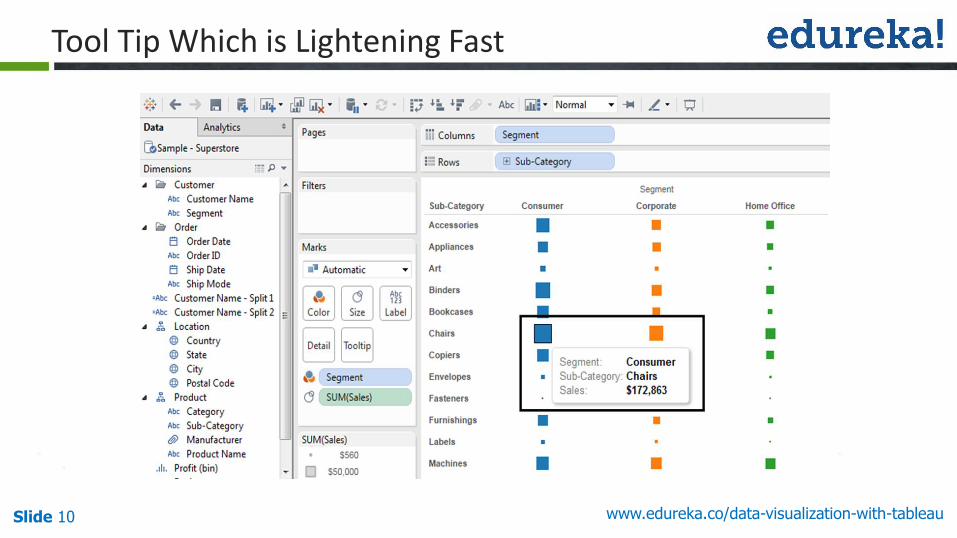
In current versions of Tableau, a tooltip only stays alive for 8 seconds and then it disappears.
Now in Tableau v9, tooltips stick around for as long as you leave your mouse in place.
Furthermore, tooltips are now super responsive, populating with new data for whichever mark you’re hovering over in real-time. You can disable it as well using tooltip window
www.edureka.co/data-visualization-with-tableauSlide 10
Tool Tip Which is Lightening Fast
www.edureka.co/data-visualization-with-tableauSlide 11
Responsive Tool Tips
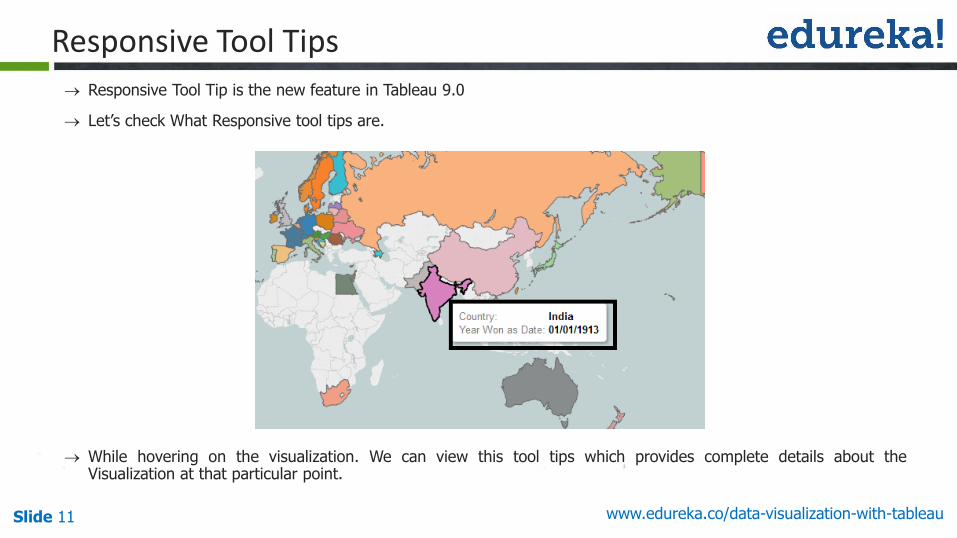
Responsive Tool Tip is the new feature in Tableau 9.0
Let’s check What Responsive tool tips are.
While hovering on the visualization. We can view this tool tips which provides complete details about theVisualization at that particular point.
www.edureka.co/data-visualization-with-tableauSlide 12
Responsive Tool Tips
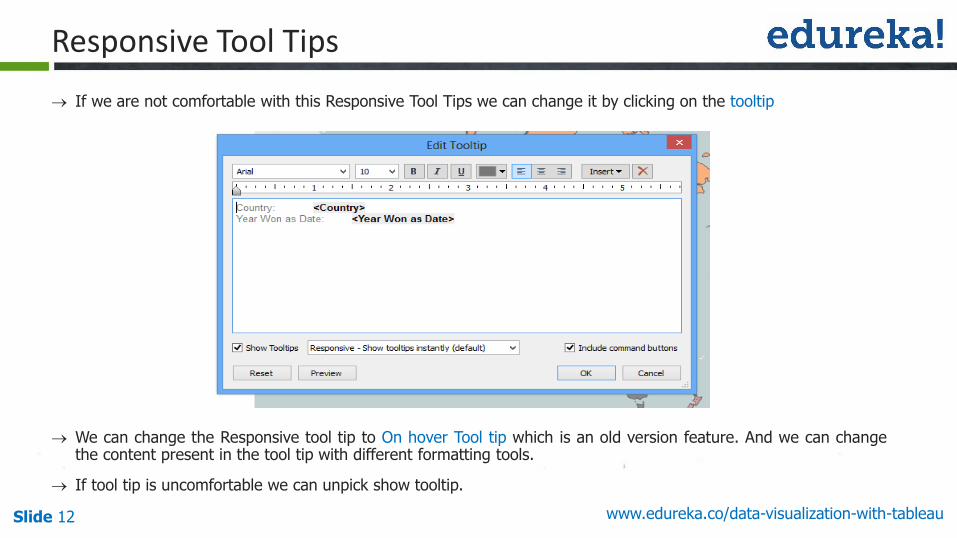
If we are not comfortable with this Responsive Tool Tips we can change it by clicking on the tooltip
We can change the Responsive tool tip to On hover Tool tip which is an old version feature. And we can changethe content present in the tool tip with different formatting tools.
If tool tip is uncomfortable we can unpick show tooltip.
www.edureka.co/data-visualization-with-tableauSlide 13
Data Interpretation
Tableau 9.0 is built in with Data Interpretation option. What is Data Interpretation.
Data Interpretation:
Data Interpretation is the process of making sense of numerical Data that has been collected, analyzed and
Presented.
Let’s check how to use Data Interpretation in Tableau.
www.edureka.co/data-visualization-with-tableauSlide 14
Data Interpretation
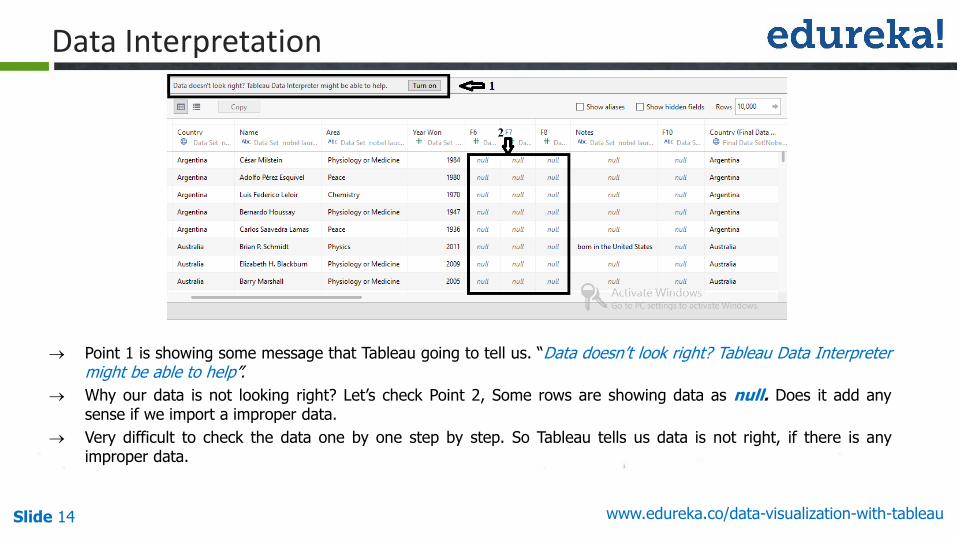
Point 1 is showing some message that Tableau going to tell us. “Data doesn’t look right? Tableau Data Interpretermight be able to help”.
Why our data is not looking right? Let’s check Point 2, Some rows are showing data as null. Does it add anysense if we import a improper data.
Very difficult to check the data one by one step by step. So Tableau tells us data is not right, if there is anyimproper data.
www.edureka.co/data-visualization-with-tableauSlide 15
Data Interpretation
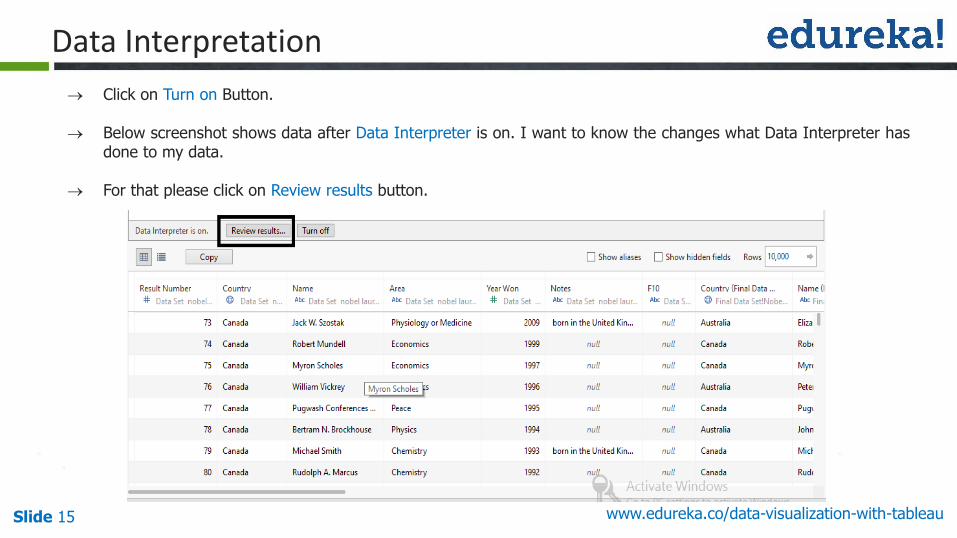
Click on Turn on Button.
Below screenshot shows data after Data Interpreter is on. I want to know the changes what Data Interpreter hasdone to my data.
For that please click on Review results button.
www.edureka.co/data-visualization-with-tableauSlide 16
Data Interpretation
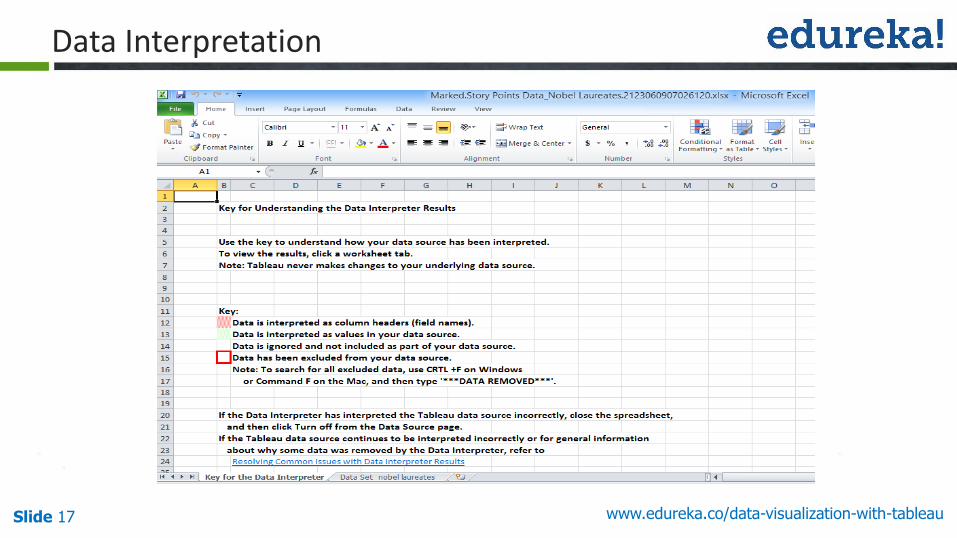
By clicking on the Review Results button. We will be redirected to an Excel Sheet.
In key points Tableau clearly mentioned what Data Interpreter has done to our data.
Check the screenshot in next slide, Now all the data is arranged same as the data present in our source data.
www.edureka.co/data-visualization-with-tableauSlide 17
Data Interpretation
www.edureka.co/data-visualization-with-tableauSlide 18
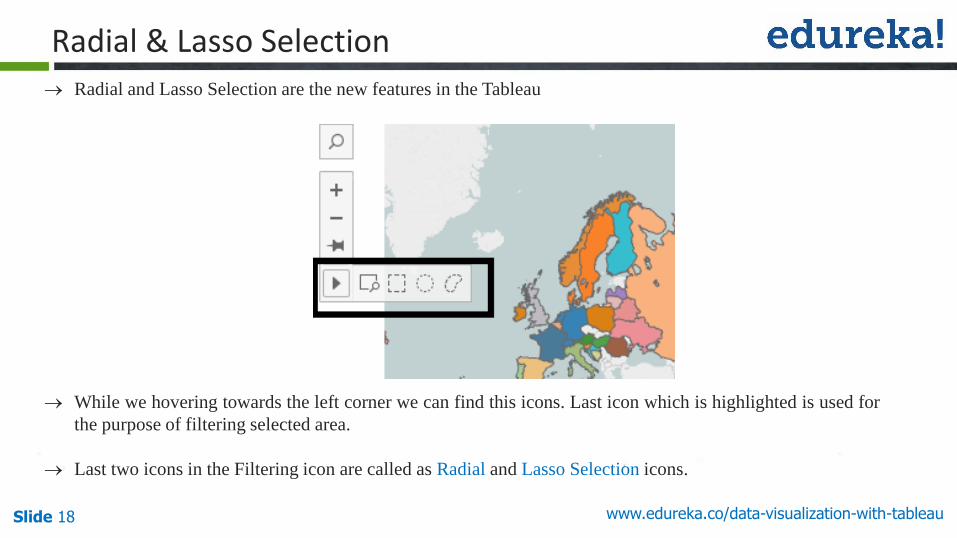
Radial & Lasso Selection Radial and Lasso Selection are the new features in the Tableau
While we hovering towards the left corner we can find this icons. Last icon which is highlighted is used for
the purpose of filtering selected area.
Last two icons in the Filtering icon are called as Radial and Lasso Selection icons.
www.edureka.co/data-visualization-with-tableauSlide 19
Radial & Lasso Selection
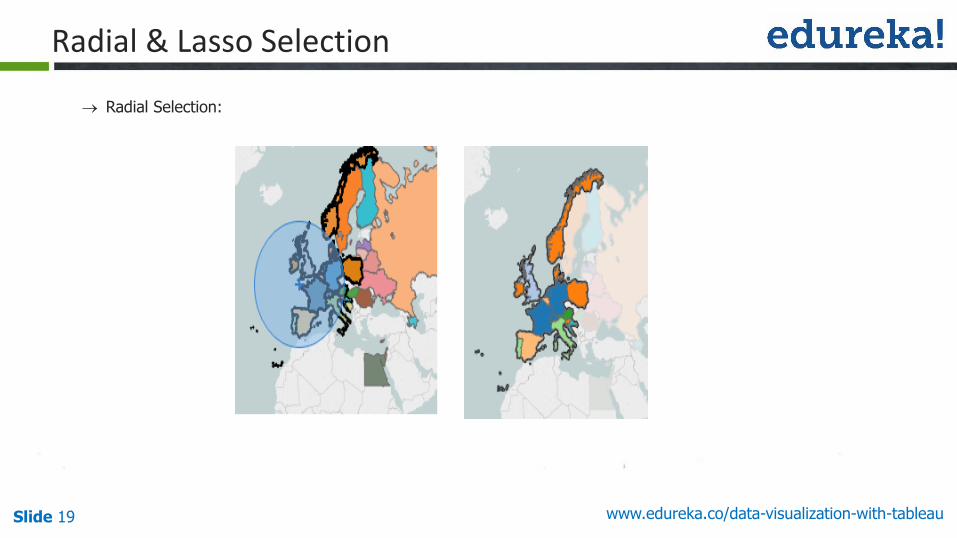
Radial Selection:
www.edureka.co/data-visualization-with-tableauSlide 20
Radial & Lasso Selection
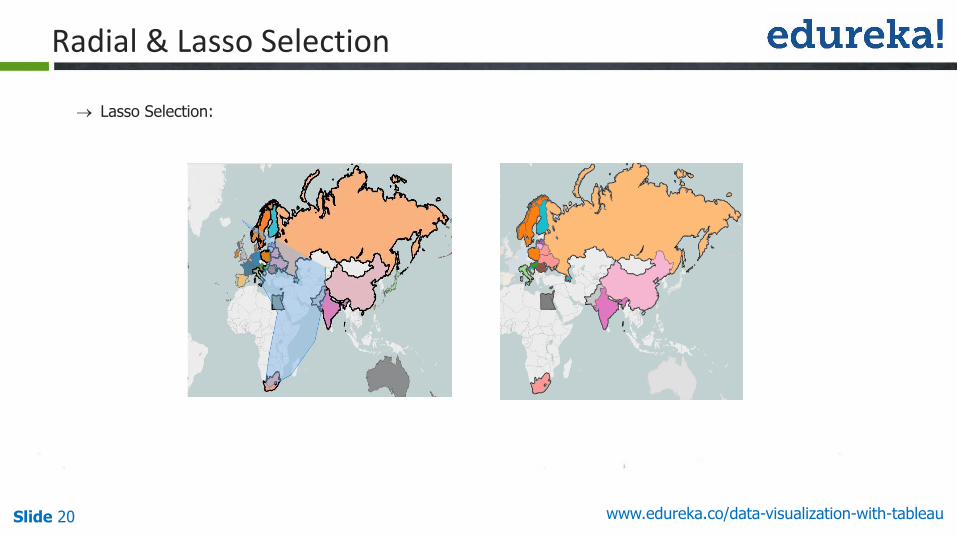
Lasso Selection:
www.edureka.co/data-visualization-with-tableauSlide 21
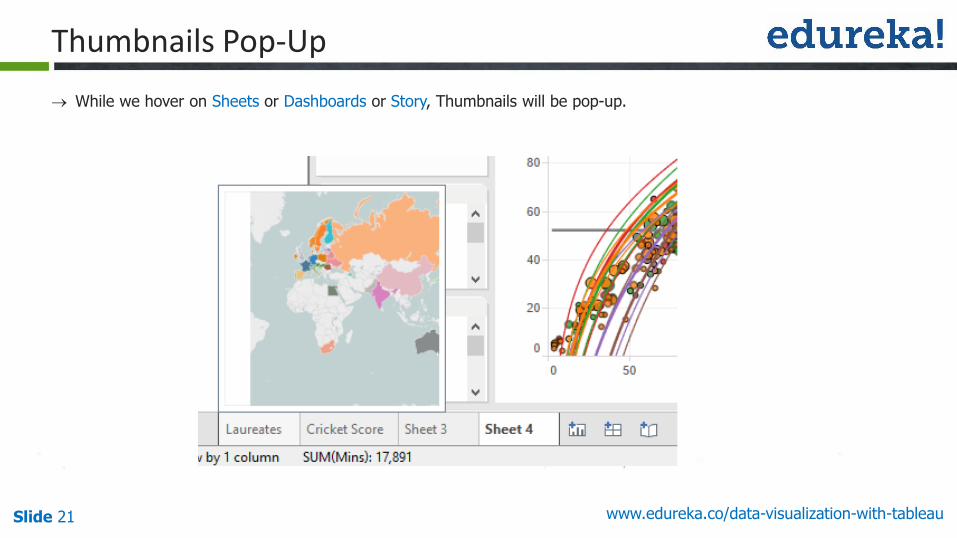
Thumbnails Pop-Up
While we hover on Sheets or Dashboards or Story, Thumbnails will be pop-up.
www.edureka.co/data-visualization-with-tableauSlide 22
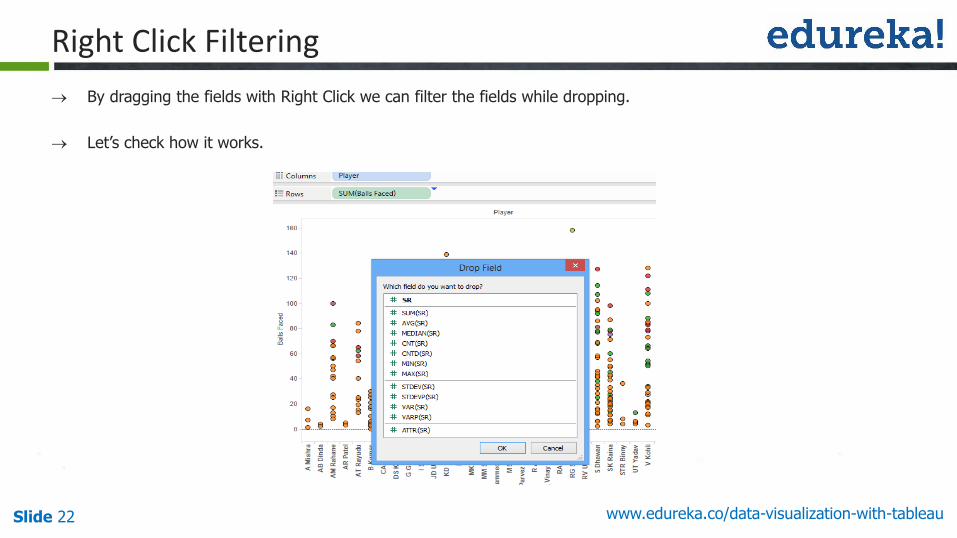
Right Click Filtering
By dragging the fields with Right Click we can filter the fields while dropping.
Let’s check how it works.
www.edureka.co/data-visualization-with-tableauSlide 23
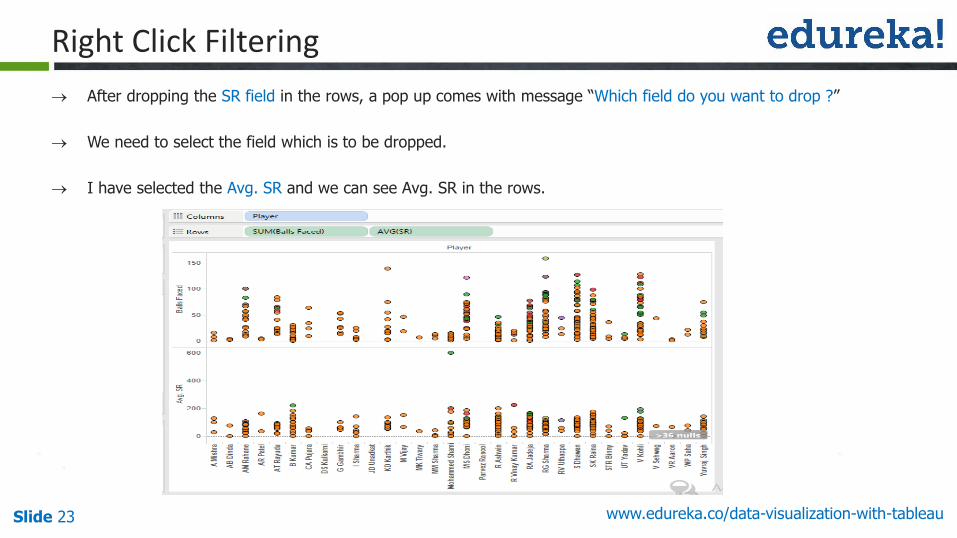
Right Click Filtering
After dropping the SR field in the rows, a pop up comes with message “Which field do you want to drop ?”
We need to select the field which is to be dropped.
I have selected the Avg. SR and we can see Avg. SR in the rows.
Questions
Slide 24 www.edureka.co/data-visualization-with-tableau

Slide 25 Course Url