learn about changing sea levels
TRANSCRIPT
Changing Sea levels During the Past 25,000 Years
An Introduction to Changes due to Glaciation and Current Conditions
byRalph W. Tiner
U.S. Fish & Wildlife ServiceNortheast RegionHadley, MA 01035
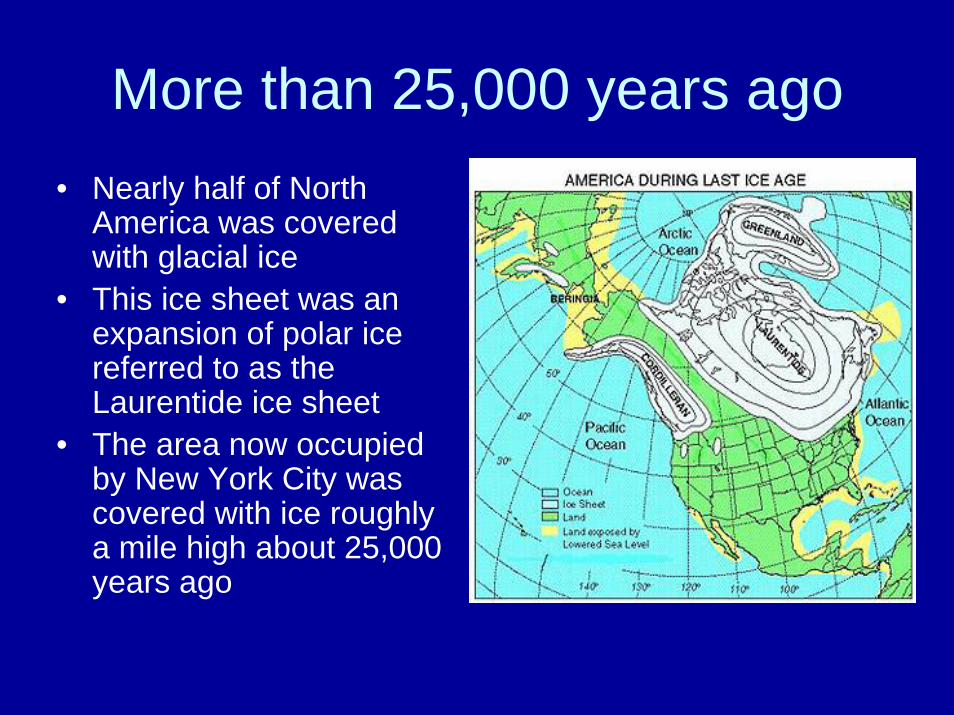
More than 25,000 years ago• Nearly half of North
America was covered with glacial ice
• This ice sheet was an expansion of polar ice referred to as the Laurentide ice sheet
• The area now occupied by New York City was covered with ice roughly a mile high about 25,000 years ago

Where did the ice come from?• Over 100,000 years ago, global temperatures began to
fall, dropping by 39-42°F (4-10°C) over thousands of years
• Snow that fell in winters in northern areas did not melt in summer (too cold)
• As the snowpack got heavier, the weight caused the underlying snow to turn into ice
• Eventually the weight of the ice on slopes caused the ice to move slowly (through gravity) forming a glacier
• Then the glacier continued to expand southward forming an enormous continental glacier (or ice sheet)
• The ice sheet moved south of Canada about 25,000 years ago
• Advancing as far south as northern New Jersey and northeastern Pennsylvania
• And there it stayed for roughly 10,000 years• This process took thousands of years (from
75,000 years before present to about 15,000 years ago when the glacier began to recede)

• With the Earth’s water accumulating in these continental glaciers, there was little seasonal return of water to the oceans in these areas
• This caused a tremendous drop in sea level
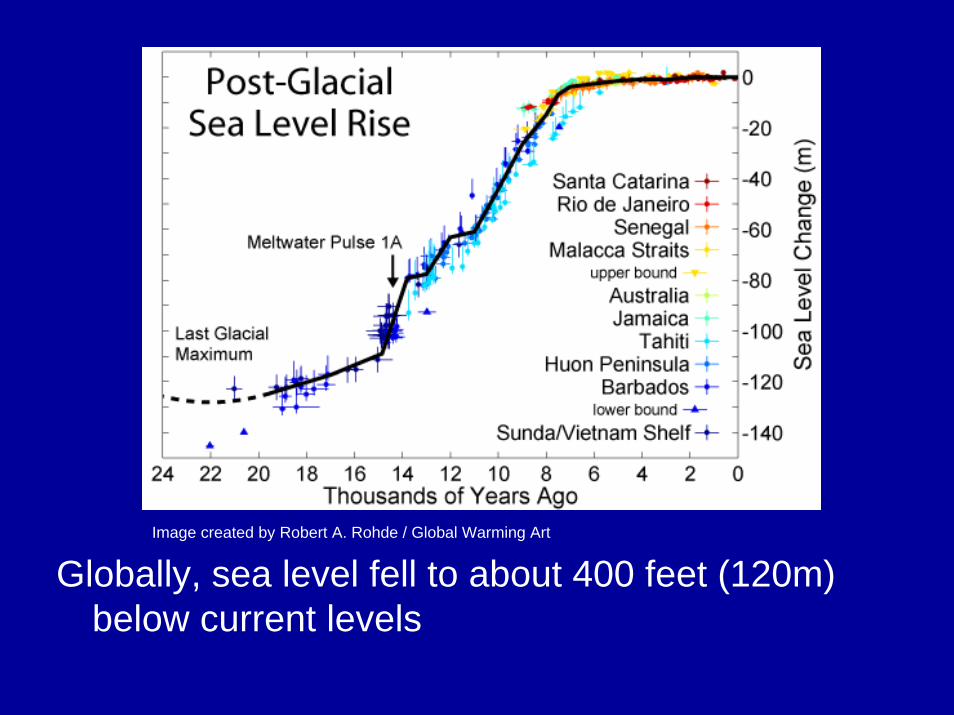
Image created by Robert A. Rohde / Global Warming Art
Globally, sea level fell to about 400 feet (120m) below current levels

• This drop in sea level exposed new areas of “land” (yellow areas)

Where was the coast about 25,000 years ago?
• Near the edge of what today is our “Continent Shelf”(light blue areas)
• About 50 miles off the coast of New Jersey
• During the last glaciation, this area was the “Coastal Plain”

• The “new” coastal plain was miles offshore of the present-day coastline (to 280 miles at the mouth of the Amazon River)
• It consisted of a combination of dryland, wetland, and rivers
• The climate, of course, was much colder than today
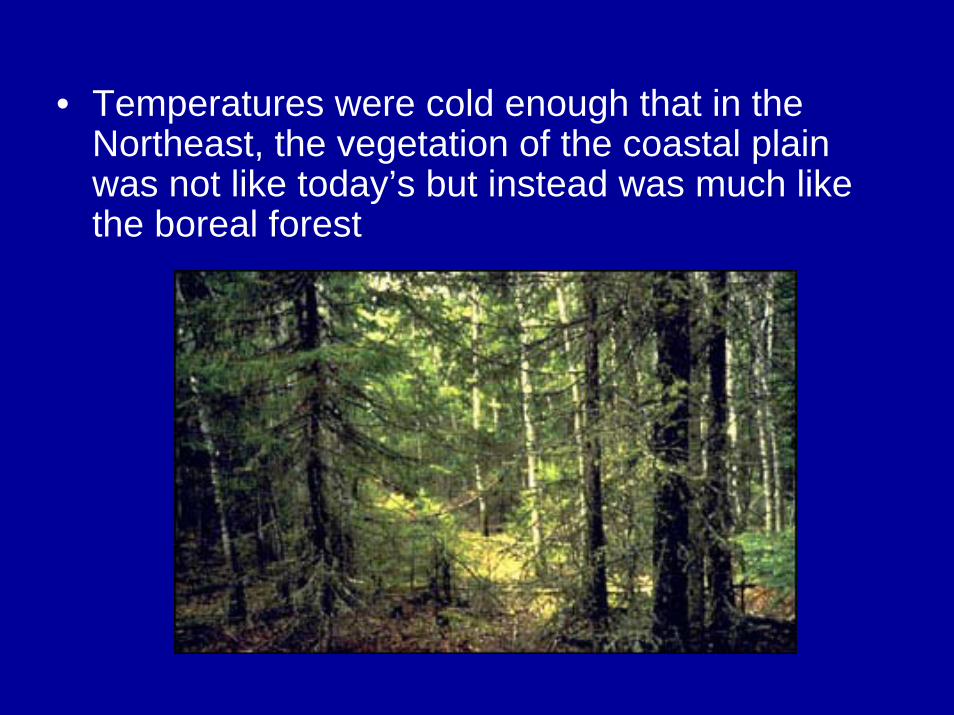
• Temperatures were cold enough that in the Northeast, the vegetation of the coastal plain was not like today’s but instead was much like the boreal forest
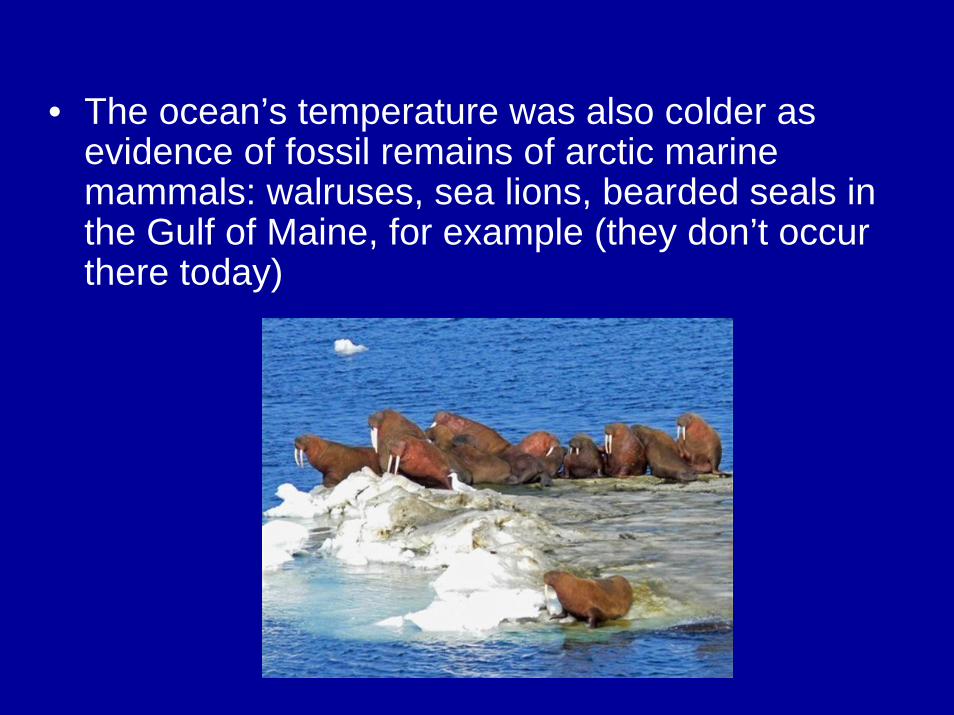
• The ocean’s temperature was also colder as evidence of fossil remains of arctic marine mammals: walruses, sea lions, bearded seals in the Gulf of Maine, for example (they don’t occur there today)
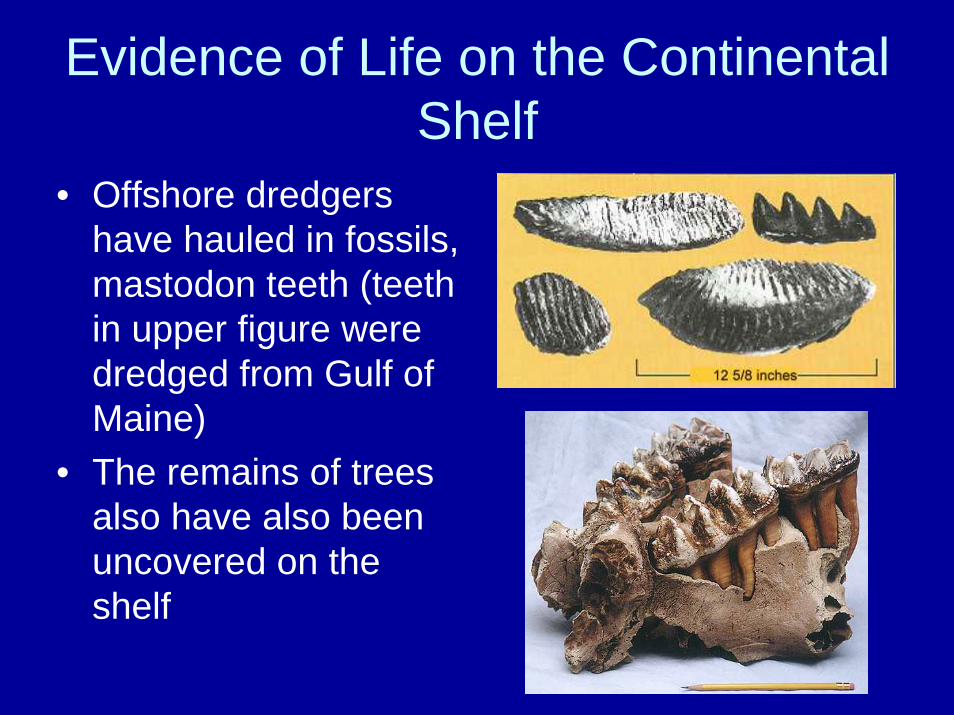
Evidence of Life on the Continental Shelf
• Offshore dredgers have hauled in fossils, mastodon teeth (teeth in upper figure were dredged from Gulf of Maine)
• The remains of trees also have also been uncovered on the shelf

Other Evidence – Offshore Oil and Gas Deposits• Rich oil and gas
deposits offshore are the remains of prehistoric swamps

About 15,000 years ago
• The glacier began to retreat• Left the US about 10,000 years ago• Where did the water from the melting ice
sheet go?
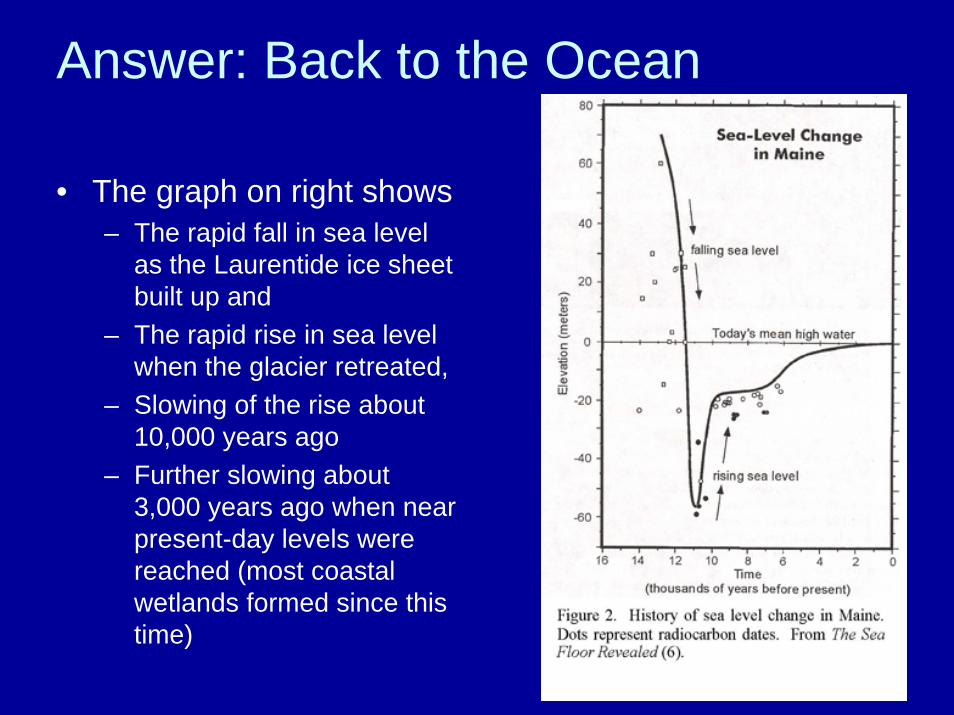
Answer: Back to the Ocean
• The graph on right shows – The rapid fall in sea level
as the Laurentide ice sheet built up and
– The rapid rise in sea level when the glacier retreated,
– Slowing of the rise about 10,000 years ago
– Further slowing about 3,000 years ago when near present-day levels were reached (most coastal wetlands formed since this time)

Sea levels and Global Temperature Change
• For millions of years, sea level has fluctuated with changes in the Earth’s climate
• During glacial periods, much of the Earth’s water is trapped in glacial ice, with this water released back to the sea during interglacial periods

Examination of Ice Cores
• Arctic, Antarctic, and other glacial ice contain a historical record of the Earth’s climate based on the content of air bubbles trapped in the ice.
• These bubbles contain atmospheric gases including carbon dioxide, methane, and other greenhouse gases from the time that they became trapped in ice.
• Climate can be traced back 800,000 years using these cores.

• Using this information, scientists have found that the Earth experiences glaciation on a cyclical basis, roughly every 100,000 years
• Graph: temperature (blue), carbon dioxide (green), and dust (red)– High points in blue
represent interglacial (warming) periods and low points indicate glacial periods

• We are living during the latest interglacial period
• Sea level has been rising since the last glaciation
• Recent evidence of this can be observed by the presence of tree stumps in salt marshes or dead trees at the margins of marshes
• By examining aerial photographs, researchers can detect changes from salt marsh to tidal flats or open water, and track the migration of salt marshes into low-lying forests (converting the latter to the former), for example
• Other scientists have developed landscape-change models to predict these types of interactions into the future – What rates of sea-level rise do modelers use?
Factors Affecting Sea-level Rise Today
• Melting polar and glacial ice• Warming of the ocean (thermal expansion)• Coastal subsidence• Post-glacial rebound (rising land after the
weight of the ice is removed = “isostaticadjustment”)
• Tectonics (mountain-building, volcanic activity, earthquakes)
Sea-level Rise Predictions
• Intergovernmental Panel on Climate Change (IPCC) has been studying this issue and making predictions re: global temperature increase and sea-level rise since the 1990s.
• Over time, technology and data continue to improve as more research is conducted on this important topic, so predictions change accordingly

IPCC 2007 Predictions• By 2100, global temperatures may rise between
2.0° and 11.5°F• This may cause further melting of the Greenland
ice sheet and other glaciers and warm the oceans resulting in a rise in sea level
• Predicted sea-level rise by 2100 is between 0.6 feet and 1.9 feet (lower than their earlier estimate of 0.3-2.9 feet)
• This has been viewed as a conservative estimate

2009 Predictions
• European scientists have examined additional information in their assessment of sea-level rise, including an analysis of tree growth rings and correlated that with past global temperatures
• Their estimate of sea-level rise for 2100 ranges from about 3.0-4.3 feet which is much higher than the IPCC estimate.
So what rate should we use for coastal zone planning?
• Many scientists are predicting a rise of 3.3 feet (1 meter) as the average change over the next 100 years
• It, therefore, seems prudent to use this rate as general guidance for coastal zone planning– Planners will, however, consult local experts
for local variations in sea-level rise rates

Concluding Remarks
• Today the rate of sea-level rise is increasing due to climate change
• Globally, a rise between 0.6-4.3 feet is predicted by 2100
• Actual sea-level rise may exceed or be lower than these predictions due to local conditions (e.g., subsidence, post-glacial rebound or tectonic activity)

• Scientists are using these estimates in models designed to predict the impact of sea-level rise on the coastal zone
• The models will be improved with time• These models are intended to serve as guides
to help government agencies and others plan for the future and are not intended to cause alarm
• In the U.S., we expect a significant increase in sea level that will have a substantial impact on coastal resources, especially fish and wildlife and their habitats